24
Regenerating Hardcore Brownfield Sites Seminar Urban Regeneration: overview of research at University of Ulster Stanley McGreal Built Environment Research Institute University of Ulster
Regenerating Hardcore Brownfield Sites Seminar
Urban Regeneration: overview of research at
University of UlsterStanley McGreal
Built Environment Research InstituteUniversity of Ulster
Regeneration Issues
Definitions Reversing social, economic and physical decline in towns and cities where market forces alone will not suffice.
Creating sustainable communities, raising value, promoting entrepreneurialism and developing innovative ways of attracting investment.
Output EvaluationsNumber of houses built, floor space developed, land reclaimed, jobs created and investment secured.
Access to services, community well-being, crime, economic deprivation, education, health, housing, physical environment, work deprivation.
Mixed-Use shemes and brownfield developmentFundamental to the sustainability of regeneration schemes driven by a confluence of planning policy, social, economic and political pressures
Attracting Private Sector Investment into Regeneration
Focus on property-led regeneration
Barriers to private sector investment
Mechanisms and incentives used
Issues of transparency – investment returns
Investment vehicles
Private sector investors lacked confidence in returns received from regeneration investments
Lack of performance data acted as a disincentive to invest
Varying perceptions of investors v non-investors
Quantification of returns on a time series basis to aid transparency
Benchmarking of regeneration performance
1998 Study for Joseph Rowntree Foundation Attracting Private Investment into Regeneration
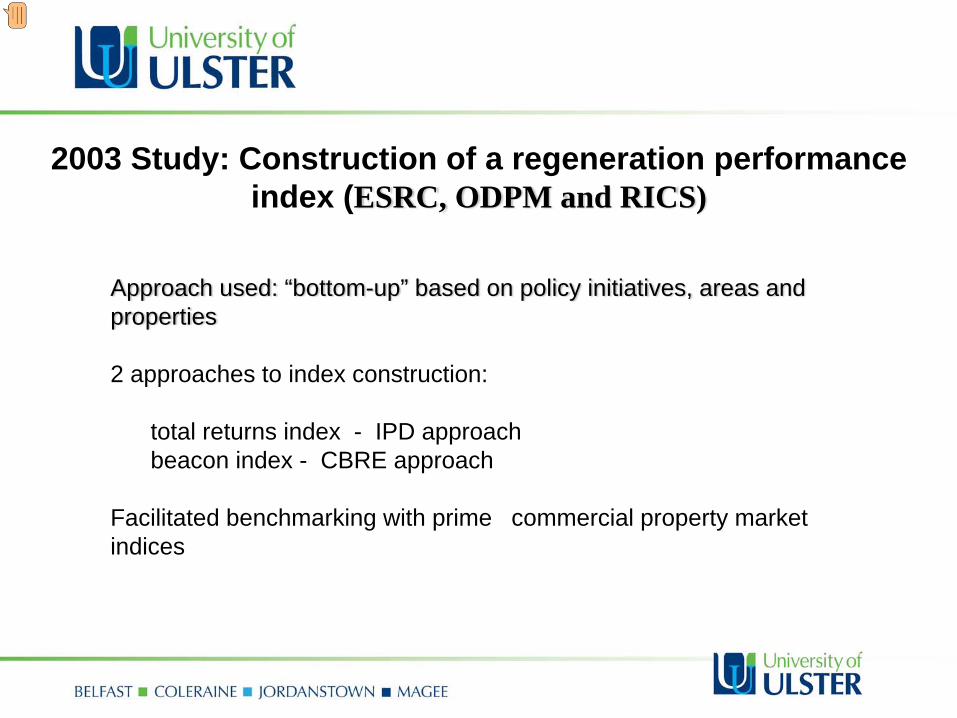
Approach used: “bottom-up” based on policy initiatives, areas and properties
2 approaches to index construction:
total returns index - IPD approach beacon index - CBRE approach
Facilitated benchmarking with prime commercial property market indices
2003 Study: Construction of a regeneration performance index (ESRC, ODPM and RICS)
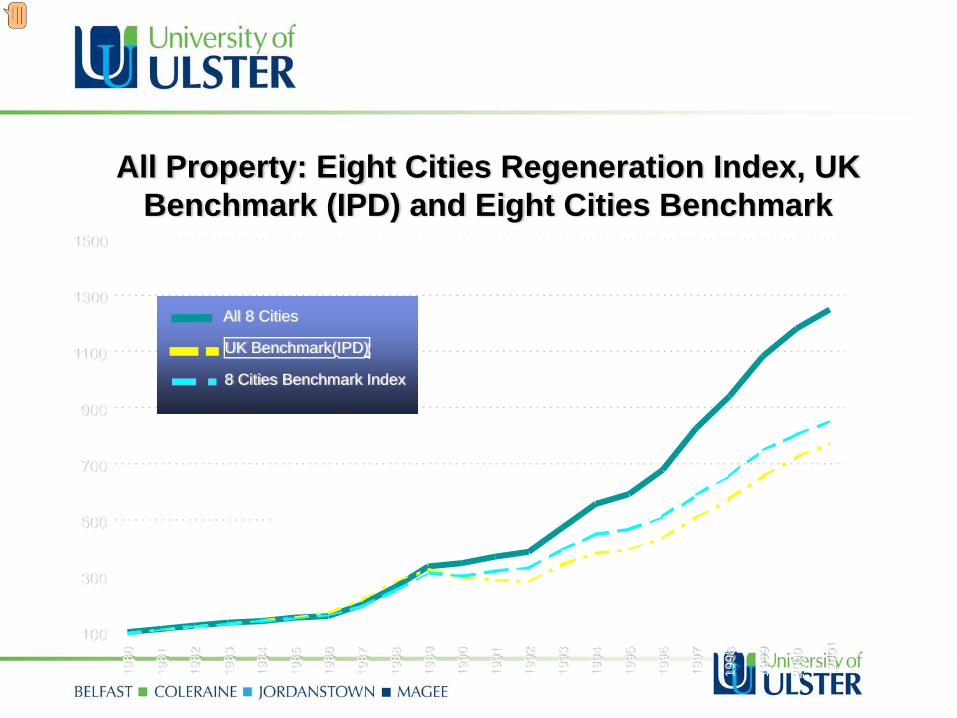
All Property: Eight Cities Regeneration Index, UK Benchmark (IPD) and Eight Cities Benchmark
100
300
500
700
900
1100
1300
1500
1980
1981
1982
1983
1984
1985
1986
1987
1988
1989
1990
1991
1992
1993
1994
1995
1996
1997
1998
1999
2000 2001
All 8 Cities
UK Benchmark(IPD)
8 Cities Benchmark Index
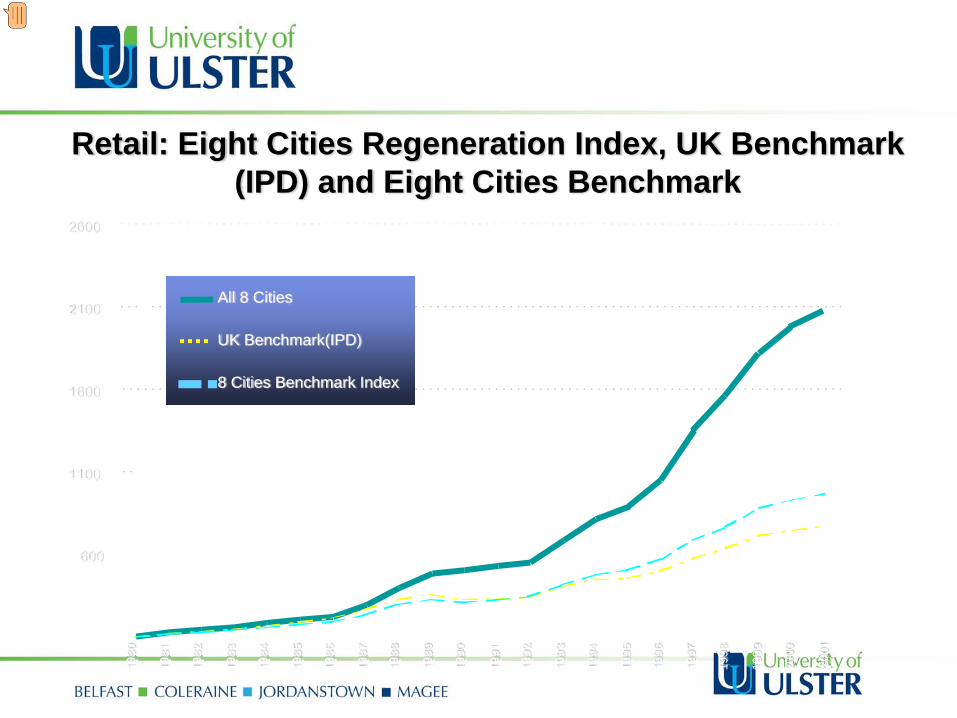
Retail: Eight Cities Regeneration Index, UK Benchmark (IPD) and Eight Cities Benchmark
100
600
1100
1600
2100
2600
1980
1981
1982
1983
1984
1985
1986
1987
1988
1989
1990
1991
1992
1993
1994
1995
1996
1997
1998
1999
2000
2001
All 8 Cities
UK Benchmark(IPD)
8 Cities Benchmark Index
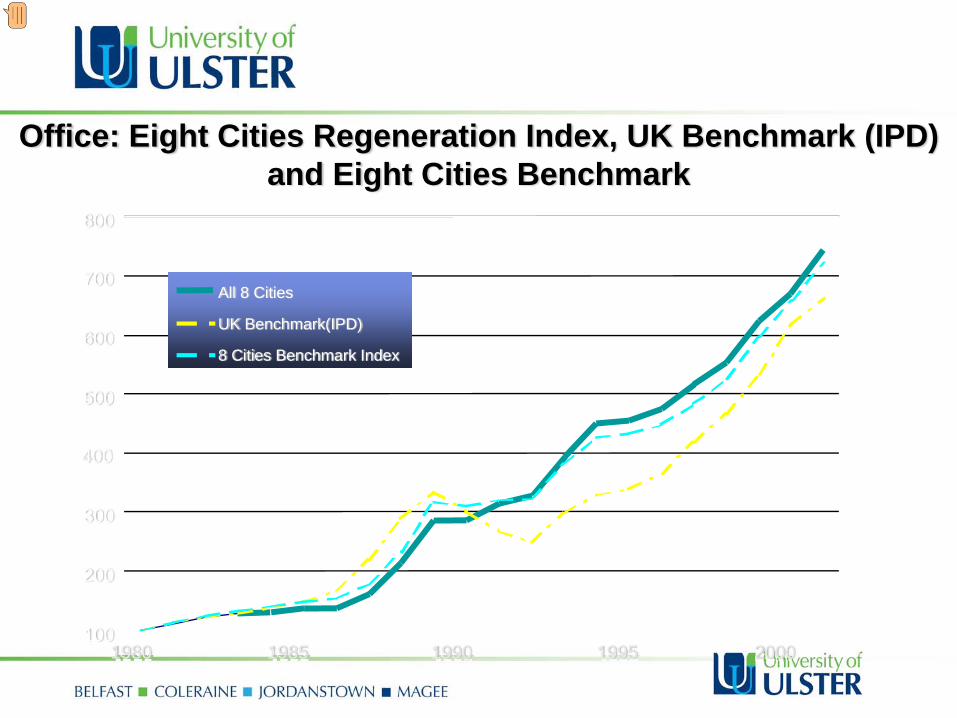
Office: Eight Cities Regeneration Index, UK Benchmark (IPD) and Eight Cities Benchmark
100
200
300
400
500
600
700
800
All 8 Cities
UK Benchmark(IPD)
8 Cities Benchmark Index
1980 1985 1990 1995 2000
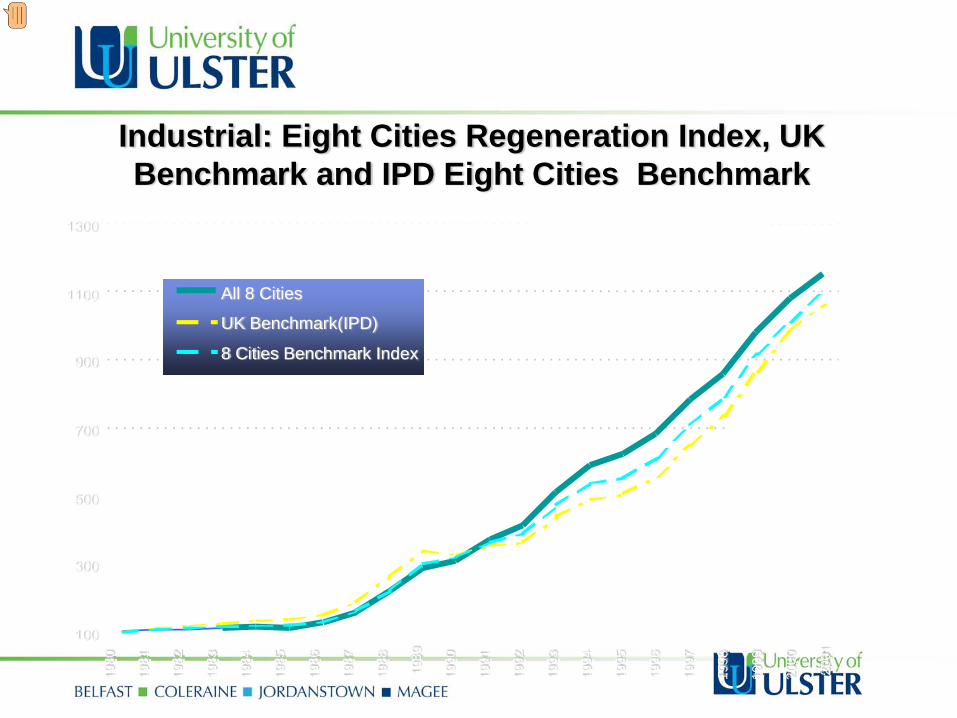
Industrial: Eight Cities Regeneration Index, UK Benchmark and IPD Eight Cities Benchmark
100
300
500
700
900
1100
1300
1980
1981
1982
1983
1984
1985
1986
1987
1988
1989
1990
1991
1992
1993
1994
1995
1996
1997
1998
1999
2000
2001
All 8 Cities
UK Benchmark(IPD)
8 Cities Benchmark Index
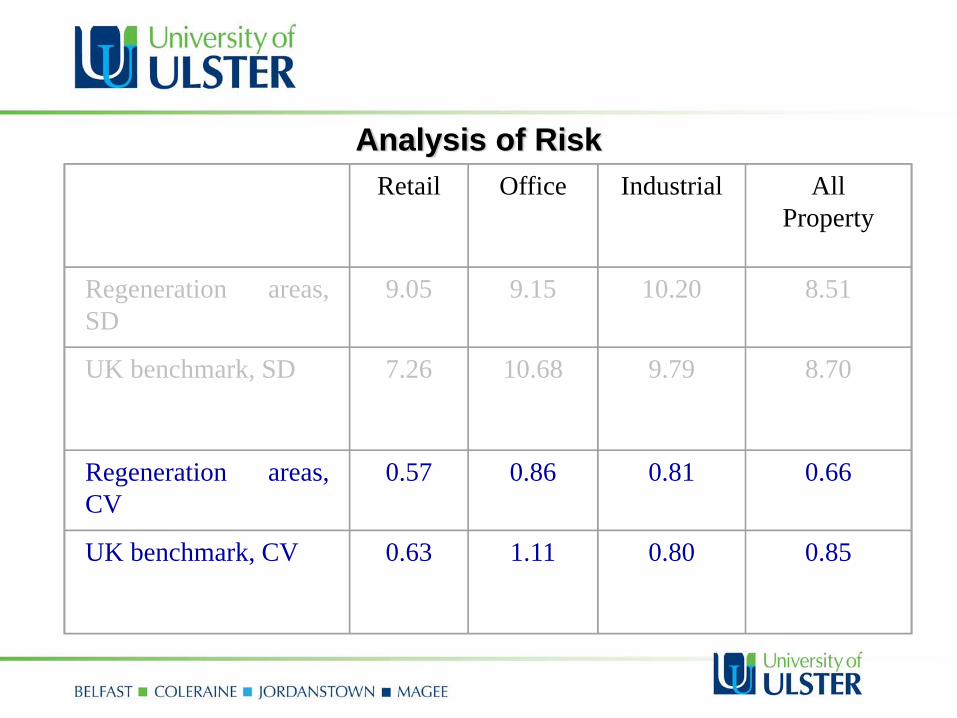
Retail Office Industrial All Property
Regeneration areas,SD
9.05 9.15 10.20 8.51
UK benchmark, SD 7.26 10.68 9.79 8.70
Regeneration areas,CV
0.57 0.86 0.81 0.66
UK benchmark, CV 0.63 1.11 0.80 0.85
Analysis of Risk
Regeneration property outperforming national & local benchmarks.
Systematic under-pricing of regeneration markets symptomatic of the information deficit
Sector differences highlight the strong retail performance
Misinformation regarding perceptions of regeneration risk
Maturing markets reflect success of regeneration policy
What were the Key Findings?
2006 Study: Institutional investment in regeneration (IPF, BPF, EP)
Approach: top UK investment institutions
Cross asset perspective: bonds, equityventure capital, securitised vehicles etc
Expectations of asset return, 3/5 year + longer time horizonsRisk tolerancesNature of security offeredAlternative financial models
Regeneration Investment Opportunities: Cross-asset perspective 1
Property has strongest linkages with institutional investment
New opportunities sought in brownfields, additional 4% return sought from development but higher risk premium of order of 3-4%
Institutions display growing appetite for long maturity bonds
20 year regeneration/infrastructure bond would be attractive to bonds/fixed income asset class - an alternative vehicle to increase exposure to the sector
Key issue is financing the coupon payments in the early years of regeneration/infrastructure with negative capital flows
Regeneration Investment Opportunities: Cross-asset perspective 2
Recognition that equities are less likely to yield regeneration opportunities than property or bonds
Introduction of REITs is perceived to offer significant investment opportunities going forward in time
Property companies developing and investing across a number of schemes could prove attractive from a diversification perspective
Potential for private equity through PFI, similar to mezzanine funds in terms of cash flow characteristics
Hedge funds have an open mind on regeneration investment opportunities/focus on the merits of each project in terms of cash flow and covenant strength
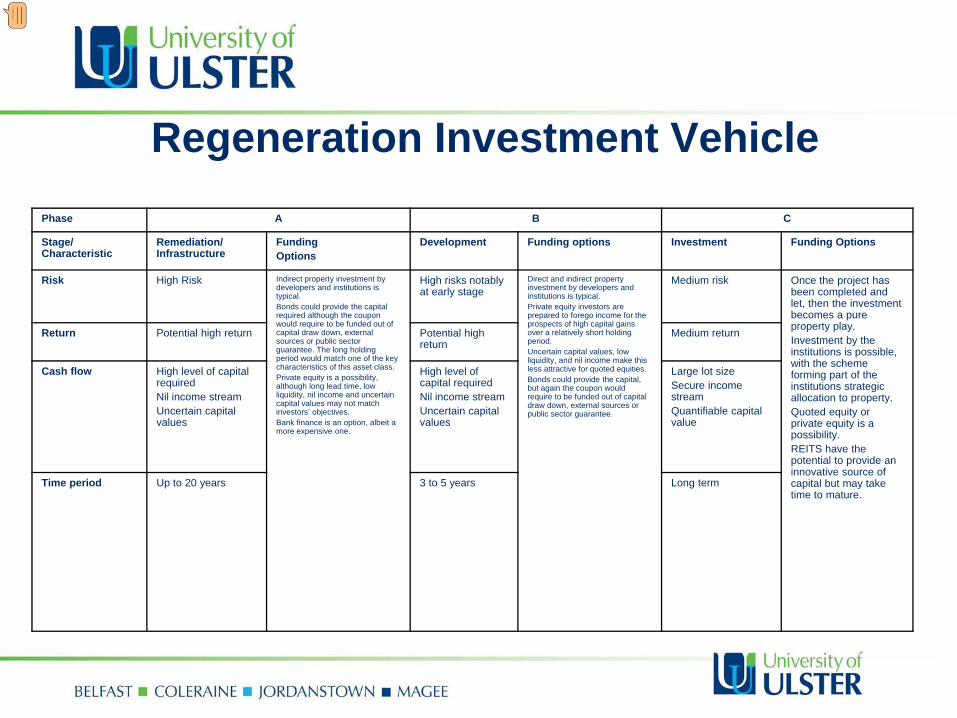
Regeneration Investment VehiclePhase A B C
Stage/ Characteristic
Remediation/ Infrastructure
Funding Options
Development Funding options Investment Funding Options
Risk High Risk Indirect property investment by developers and institutions is typical.Bonds could provide the capital required although the coupon would require to be funded out of capital draw down, external sources or public sector guarantee. The long holding period would match one of the key characteristics of this asset class.Private equity is a possibility, although long lead time, low liquidity, nil income and uncertain capital values may not match investors’ objectives.Bank finance is an option, albeit a more expensive one.
High risks notably at early stage
Direct and indirect property investment by developers and institutions is typical.Private equity investors are prepared to forego income for the prospects of high capital gains over a relatively short holding period.Uncertain capital values, low liquidity, and nil income make this less attractive for quoted equities.Bonds could provide the capital, but again the coupon would require to be funded out of capital draw down, external sources or public sector guarantee.
Medium risk Once the project has been completed and let, then the investment becomes a pure property play. Investment by the institutions is possible, with the scheme forming part of the institutions strategic allocation to property.Quoted equity or private equity is a possibility.REITS have the potential to provide an innovative source of capital but may take time to mature.
Return Potential high return Potential high return
Medium return
Cash flow High level of capital requiredNil income streamUncertain capital values
High level of capital requiredNil income streamUncertain capital values
Large lot sizeSecure income streamQuantifiable capital value
Time period Up to 20 years 3 to 5 years Long term
Regeneration Investment Vehicle From a funding perspective, allows the combination of bond and indirect property investment/private equity elements coupled with traditional bank debt
From a structural perspective the vehicle facilitates efficient management whilst offering tax efficiency, liquidity and flexibility to investors
A viable fund model that can meet most of the funding and structural objectives
Scope of permitted activities would allow the development of and investment in “qualifying” regeneration projects
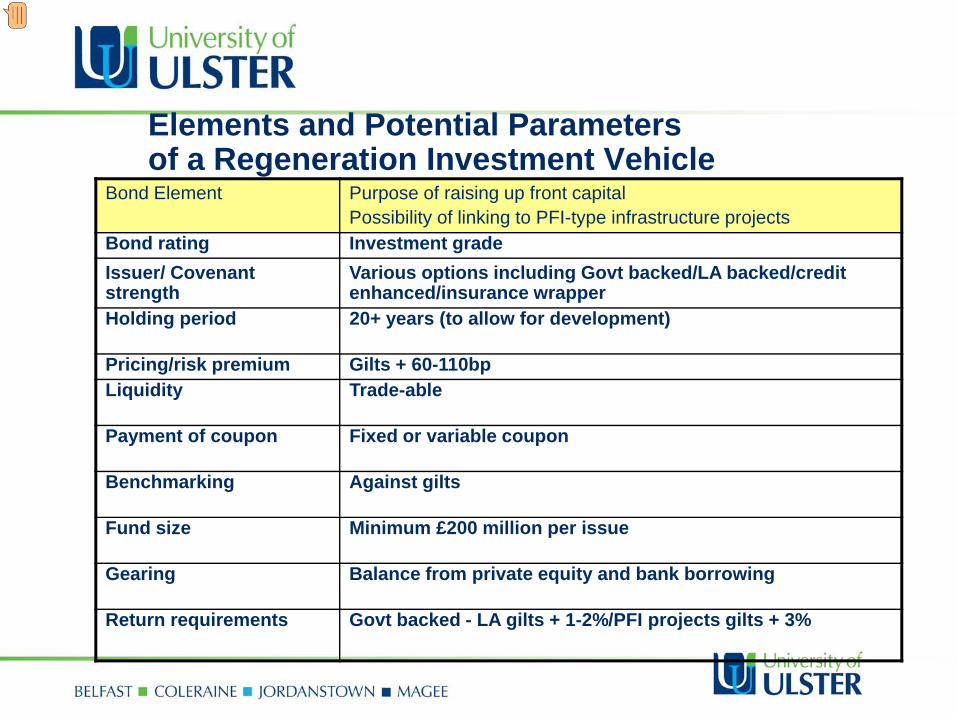
Elements and Potential Parameters of a Regeneration Investment Vehicle
Bond Element Purpose of raising up front capitalPossibility of linking to PFI-type infrastructure projects
Bond rating Investment gradeIssuer/ Covenant strength
Various options including Govt backed/LA backed/credit enhanced/insurance wrapper
Holding period 20+ years (to allow for development)
Pricing/risk premium Gilts + 60-110bp Liquidity Trade-able
Payment of coupon Fixed or variable coupon
Benchmarking Against gilts
Fund size Minimum £200 million per issue
Gearing Balance from private equity and bank borrowing
Return requirements Govt backed - LA gilts + 1-2%/PFI projects gilts + 3%
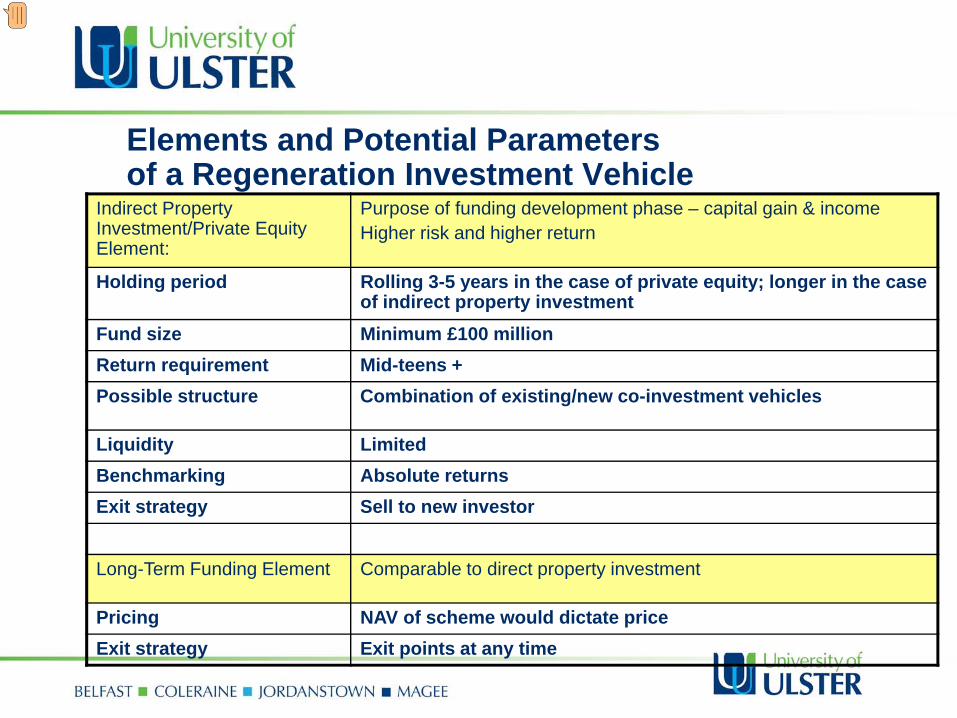
Elements and Potential Parameters of a Regeneration Investment Vehicle
Indirect Property Investment/Private Equity Element:
Purpose of funding development phase – capital gain & incomeHigher risk and higher return
Holding period Rolling 3-5 years in the case of private equity; longer in the case of indirect property investment
Fund size Minimum £100 millionReturn requirement Mid-teens +Possible structure Combination of existing/new co-investment vehicles
Liquidity LimitedBenchmarking Absolute returnsExit strategy Sell to new investor
Long-Term Funding Element Comparable to direct property investment
Pricing NAV of scheme would dictate priceExit strategy Exit points at any time
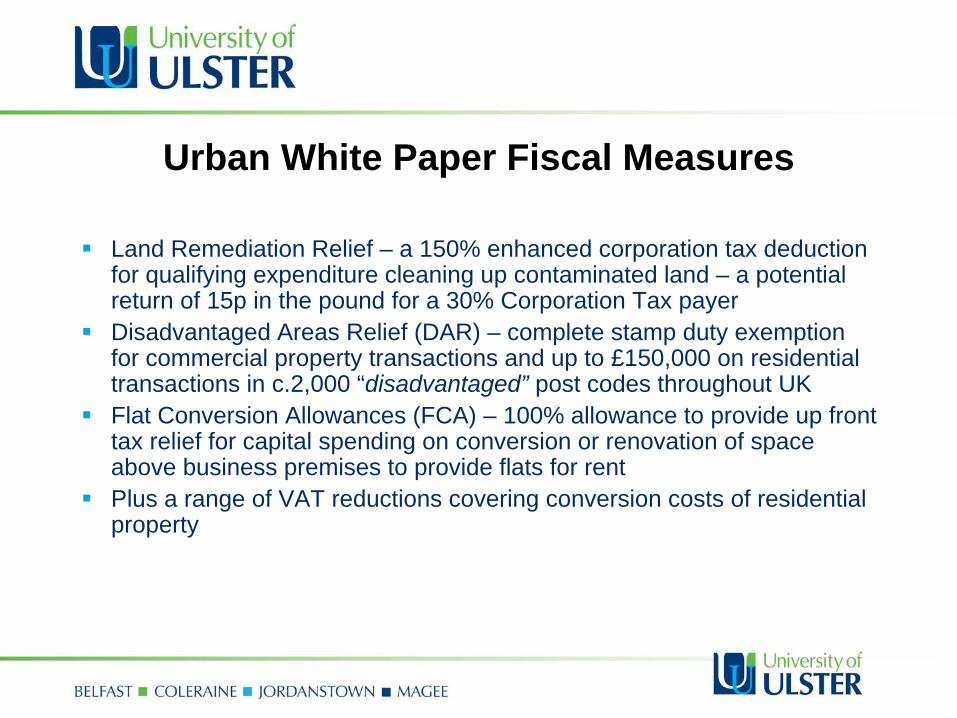
Urban White Paper Fiscal Measures
Land Remediation Relief – a 150% enhanced corporation tax deduction for qualifying expenditure cleaning up contaminated land – a potential return of 15p in the pound for a 30% Corporation Tax payerDisadvantaged Areas Relief (DAR) – complete stamp duty exemption for commercial property transactions and up to £150,000 on residential transactions in c.2,000 “disadvantaged” post codes throughout UKFlat Conversion Allowances (FCA) – 100% allowance to provide up front tax relief for capital spending on conversion or renovation of space above business premises to provide flats for rentPlus a range of VAT reductions covering conversion costs of residential property
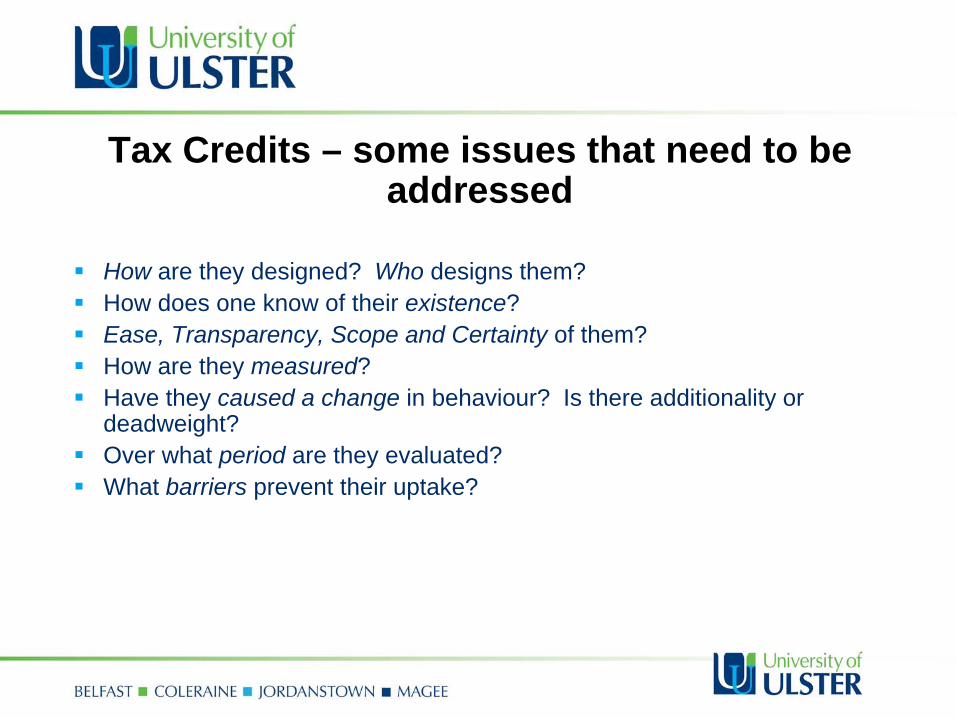
Tax Credits – some issues that need to be addressed
How are they designed? Who designs them?How does one know of their existence?Ease, Transparency, Scope and Certainty of them?How are they measured?Have they caused a change in behaviour? Is there additionality or deadweight?Over what period are they evaluated?What barriers prevent their uptake?
LRR – Some Conclusions
Knowledge of LRR outside the developer community was patchy at time of undertaking the studyIncreased use will mean increasing cost to HMRCBrownfield development is contingent to property development in generalLRR is one aspect in the consideration of how to clean up sitesThe vast majority of sites are judged on commercial profitability rather than tax incentivesLRR reckoned to be less than 1.5% of total development costsLocal authorities are major players in terms of ownership, clean up and being development partnersCentral government should market LRR more effectively, particularly with local authorities
2009 Current State of Regeneration in the UK (IPF)
New generation of regionally focussed Regeneration Investment Vehicles (RIVs)
Property Regeneration Partnerships/Asset Backed Structures: Regional Development Agencies (RDAs) commit a portfolio of land/property for regeneration matched by an investment partner.
The devolution in regeneration decision making has seen the Asset Backed Structure rolled out to local authority level – Local Asset Backed Vehicles (LABVs) eg “Croydon Council Urban Regeneration Vehicle”
The LABV model will be complemented by the introduction of Community Infrastructure Levy (CIL) and Supplementary Business Rates (SBR).
Property Market Downturn: Implications for Regeneration
Investor appetite for risk has receded in the wake of the current property market downturn – as a result regeneration schemes are likely to find it difficult to attract investment in the current climate.
Regeneration investment vehicles which include a public sector partner may however prove an attractive option for investors as they provide reassurance and reduce risk.
Major development and infrastructure projects have been shelved amidst the ongoing uncertainty in both the property and financial markets.
Government proposals to increase pubic sector spending on major projects including social housing provision may provide some stimulus for regeneration schemes.
Future Research
Examination of Regeneration Investment Vehicles in the UK drawing comparison with international models such as TIFs.
International models of best practice: Empowering local authorities to make strategic regeneration decisions.
The retail sector along with house price growth were fundamental to the performance and commercial viability of regeneration schemes – what are the prospects in a post-recessionary environment?
What is the future prospects for large scale commercial property development in the UK including regeneration schemes.


