Oklahoma
Oklahoma
1
Data Sources:
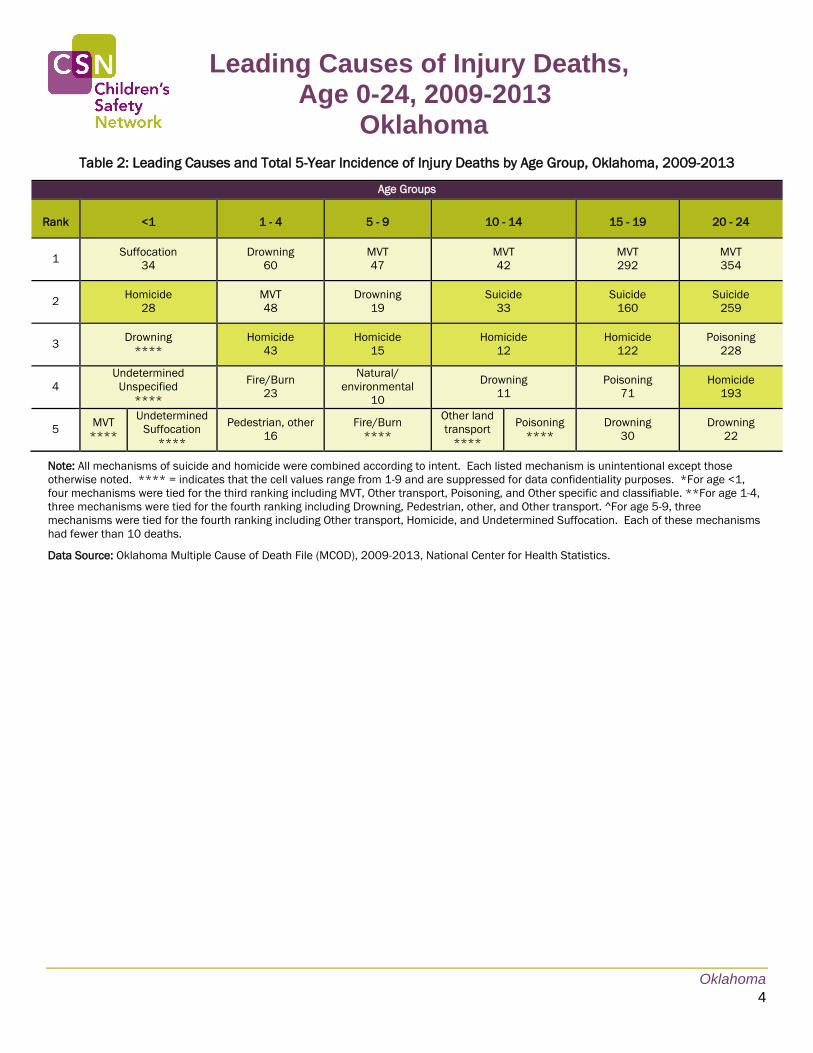
Multiple Cause of Death (MCOD) Files, 2009-2013, National Center for Health Statistics. The MCOD file is a census
of all deaths in the U.S. and some territories. Five years data were combined to compute stable rates. Nevertheless,
for some specific causes and in small states and territories, the cumulative number of deaths are less than ten and
could not be reported. The counts presented in this fact sheet were generated from an analysis of the raw data files
by the CSN Economics and Data Analysis Resource Center (EDARC).
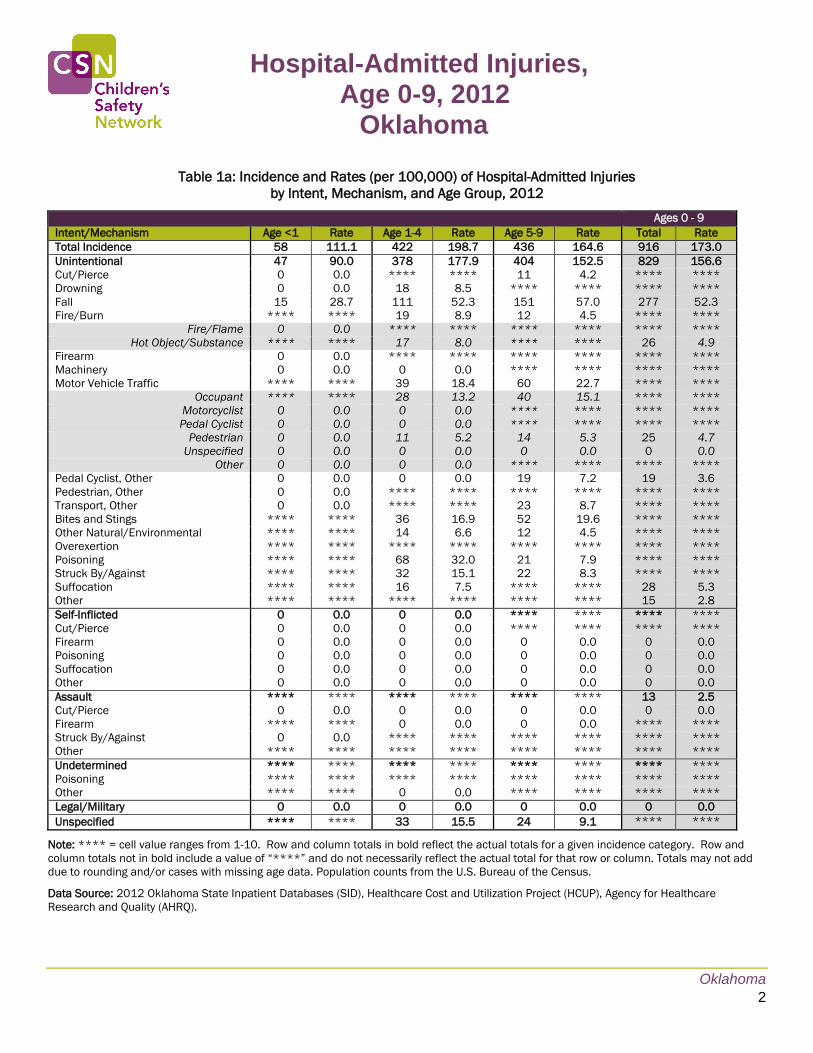
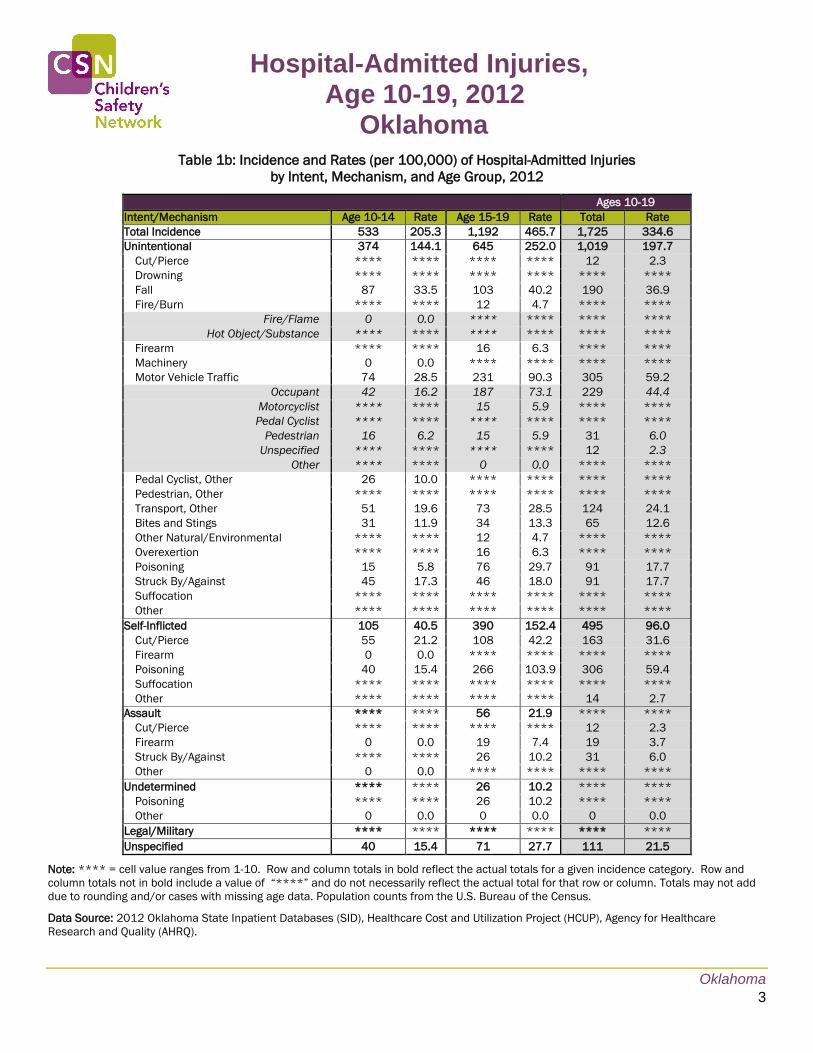
State Inpatient Databases (SID), 2012, Healthcare Utilization Project, Agency for Healthcare Research and Quality
(AHRQ). The AHRQ sponsors a Federal-State-Industry partnership, known as HCUP, which includes the largest
collection of health care databases and associated software and products in the country, including the SID, from
collaborating states. The SID is a census of hospital discharge data compiled from, currently, 46 states. The counts
presented in this fact sheet were generated from an analysis of the raw data files by the CSN EDARC. Counts
exclude patients dead at the time of discharge, chronic/overuse injuries, and/or injuries treated at hospitals that do
not meet the American Hospital Association's (AHA) criteria of a short-term community hospital. To prevent double-
counting, readmission cases, transfers, and medical misadventures were excluded. All counts based on the patients'
state of residence. To find out more about the SID and HCUP, please visit http://www.hcup-
us.ahrq.gov/sidoverview.jsp.
Fatal Analysis Reporting System (FARS), 2009-2013, National Highway Traffic Safety Administration. The FARS is a
census of all motor vehicle-related crashes involving one or more fatalities. FARS provides data on all vehicles
involved in fatal crashes, including driver information. Five years data were combined to compute stable rates. Like
the MCOD, some states and the territories had fewer than 10 deaths and could not be reported. The counts
presented in this data sheet were generated from an analysis of the raw data files by the CSN EDARC.
Population statistics (Ages 0 - 24 years): United States Department of Health and Human Services (US DHHS),
Centers for Disease Control and Prevention (CDC), National Center for Health Statistics (NCHS), Bridged-Race
Population Estimates, United States July 1st resident population by state. Retrieved from:
http://wonder.cdc.gov/bridged-race-v2013.html.
Note regarding small numbers of cases: In compliance with the privacy standards recommended by the National
Center for Health Statistics and in order to avoid inadvertent disclosure of individual cases, no figure, including
totals, is less than 10 in tabulations for sub-national geographic areas, regardless of the number of years combined.
Instead, the symbol “*” is used to denote less than 10 cases.
Suggested reference: Children’s Safety Network State Fact Sheets, Children's Safety Network Economics and Data
Analysis Resource Center (CSN EDARC), at the Pacific Institute for Research and Evaluation (PIRE), Calverton, MD,
April, 2016.
Hospital-Admitted Injuries, Age 0-9, 2012
Oklahoma
Oklahoma
2
Table 1a: Incidence and Rates (per 100,000) of Hospital-Admitted Injuries
by Intent, Mechanism, and Age Group, 2012
Ages 0 - 9
Intent/Mechanism Age <1 Rate Age 1-4 Rate Age 5-9 Rate Total Rate
Total Incidence 58 111.1 422 198.7 436 164.6 916 173.0
Unintentional 47 90.0 378 177.9 404 152.5 829 156.6
Cut/Pierce 0 0.0 **** **** 11 4.2 **** ****
Drowning 0 0.0 18 8.5 **** **** **** ****
Fall 15 28.7 111 52.3 151 57.0 277 52.3
Fire/Burn **** **** 19 8.9 12 4.5 **** ****
Fire/Flame 0 0.0 **** **** **** **** **** ****
Hot Object/Substance **** **** 17 8.0 **** **** 26 4.9
Firearm 0 0.0 **** **** **** **** **** ****
Machinery 0 0.0 0 0.0 **** **** **** ****
Motor Vehicle Traffic **** **** 39 18.4 60 22.7 **** ****
Occupant **** **** 28 13.2 40 15.1 **** ****
Motorcyclist 0 0.0 0 0.0 **** **** **** ****
Pedal Cyclist 0 0.0 0 0.0 **** **** **** ****
Pedestrian 0 0.0 11 5.2 14 5.3 25 4.7
Unspecified 0 0.0 0 0.0 0 0.0 0 0.0
Other 0 0.0 0 0.0 **** **** **** ****
Pedal Cyclist, Other 0 0.0 0 0.0 19 7.2 19 3.6
Pedestrian, Other 0 0.0 **** **** **** **** **** ****
Transport, Other 0 0.0 **** **** 23 8.7 **** ****
Bites and Stings **** **** 36 16.9 52 19.6 **** ****
Other Natural/Environmental **** **** 14 6.6 12 4.5 **** ****
Overexertion **** **** **** **** **** **** **** ****
Poisoning **** **** 68 32.0 21 7.9 **** ****
Struck By/Against **** **** 32 15.1 22 8.3 **** ****
Suffocation **** **** 16 7.5 **** **** 28 5.3
Other **** **** **** **** **** **** 15 2.8
Self-Inflicted 0 0.0 0 0.0 **** **** **** ****
Cut/Pierce 0 0.0 0 0.0 **** **** **** ****
Firearm 0 0.0 0 0.0 0 0.0 0 0.0
Poisoning 0 0.0 0 0.0 0 0.0 0 0.0
Suffocation 0 0.0 0 0.0 0 0.0 0 0.0
Other 0 0.0 0 0.0 0 0.0 0 0.0
Assault **** **** **** **** **** **** 13 2.5
Cut/Pierce 0 0.0 0 0.0 0 0.0 0 0.0
Firearm **** **** 0 0.0 0 0.0 **** ****
Struck By/Against 0 0.0 **** **** **** **** **** ****
Other **** **** **** **** **** **** **** ****
Undetermined **** **** **** **** **** **** **** ****
Poisoning **** **** **** **** **** **** **** ****
Other **** **** 0 0.0 **** **** **** ****
Legal/Military 0 0.0 0 0.0 0 0.0 0 0.0
Unspecified **** **** 33 15.5 24 9.1 **** ****
Note: **** = cell value ranges from 1-10. Row and column totals in bold reflect the actual totals for a given incidence category. Row and
column totals not in bold include a value of “****” and do not necessarily reflect the actual total for that row or column. Totals may not add
due to rounding and/or cases with missing age data. Population counts from the U.S. Bureau of the Census.
Data Source: 2012 Oklahoma State Inpatient Databases (SID), Healthcare Cost and Utilization Project (HCUP), Agency for Healthcare
Research and Quality (AHRQ).
Hospital-Admitted Injuries, Age 10-19, 2012
Oklahoma
Oklahoma
3
Table 1b: Incidence and Rates (per 100,000) of Hospital-Admitted Injuries
by Intent, Mechanism, and Age Group, 2012
Ages 10-19
Intent/Mechanism Age 10-14 Rate Age 15-19 Rate Total Rate
Total Incidence 533 205.3 1,192 465.7 1,725 334.6
Unintentional 374 144.1 645 252.0 1,019 197.7
Cut/Pierce **** **** **** **** 12 2.3
Drowning **** **** **** **** **** ****
Fall 87 33.5 103 40.2 190 36.9
Fire/Burn **** **** 12 4.7 **** ****
Fire/Flame 0 0.0 **** **** **** ****
Hot Object/Substance **** **** **** **** **** ****
Firearm **** **** 16 6.3 **** ****
Machinery 0 0.0 **** **** **** ****
Motor Vehicle Traffic 74 28.5 231 90.3 305 59.2
Occupant 42 16.2 187 73.1 229 44.4
Motorcyclist **** **** 15 5.9 **** ****
Pedal Cyclist **** **** **** **** **** ****
Pedestrian 16 6.2 15 5.9 31 6.0
Unspecified **** **** **** **** 12 2.3
Other **** **** 0 0.0 **** ****
Pedal Cyclist, Other 26 10.0 **** **** **** ****
Pedestrian, Other **** **** **** **** **** ****
Transport, Other 51 19.6 73 28.5 124 24.1
Bites and Stings 31 11.9 34 13.3 65 12.6
Other Natural/Environmental **** **** 12 4.7 **** ****
Overexertion **** **** 16 6.3 **** ****
Poisoning 15 5.8 76 29.7 91 17.7
Struck By/Against 45 17.3 46 18.0 91 17.7
Suffocation **** **** **** **** **** ****
Other **** **** **** **** **** ****
Self-Inflicted 105 40.5 390 152.4 495 96.0
Cut/Pierce 55 21.2 108 42.2 163 31.6
Firearm 0 0.0 **** **** **** ****
Poisoning 40 15.4 266 103.9 306 59.4
Suffocation **** **** **** **** **** ****
Other **** **** **** **** 14 2.7
Assault **** **** 56 21.9 **** ****
Cut/Pierce **** **** **** **** 12 2.3
Firearm 0 0.0 19 7.4 19 3.7
Struck By/Against **** **** 26 10.2 31 6.0
Other 0 0.0 **** **** **** ****
Undetermined **** **** 26 10.2 **** ****
Poisoning **** **** 26 10.2 **** ****
Other 0 0.0 0 0.0 0 0.0
Legal/Military **** **** **** **** **** ****
Unspecified 40 15.4 71 27.7 111 21.5
Note: **** = cell value ranges from 1-10. Row and column totals in bold reflect the actual totals for a given incidence category. Row and
column totals not in bold include a value of “****” and do not necessarily reflect the actual total for that row or column. Totals may not add
due to rounding and/or cases with missing age data. Population counts from the U.S. Bureau of the Census.
Data Source: 2012 Oklahoma State Inpatient Databases (SID), Healthcare Cost and Utilization Project (HCUP), Agency for Healthcare
Research and Quality (AHRQ).
Leading Causes of Injury Deaths, Age 0-24, 2009-2013
Oklahoma
Oklahoma
4
Table 2: Leading Causes and Total 5-Year Incidence of Injury Deaths by Age Group, Oklahoma, 2009-2013
Age Groups
Rank <1 1 - 4 5 - 9 10 - 14 15 - 19 20 - 24
1 Suffocation
34
Drowning
60
MVT
47
MVT
42
MVT
292
MVT
354
2 Homicide
28
MVT
48
Drowning
19
Suicide
33
Suicide
160
Suicide
259
3 Drowning
****
Homicide
43
Homicide
15
Homicide
12
Homicide
122
Poisoning
228
4
Undetermined
Unspecified
****
Fire/Burn
23
Natural/
environmental
10
Drowning
11
Poisoning
71
Homicide
193
5 MVT
****
Undetermined
Suffocation
****
Pedestrian, other
16
Fire/Burn
****
Other land
transport
****
Poisoning
****
Drowning
30
Drowning
22
Note: All mechanisms of suicide and homicide were combined according to intent. Each listed mechanism is unintentional except those
otherwise noted. **** = indicates that the cell values range from 1-9 and are suppressed for data confidentiality purposes. *For age <1,
four mechanisms were tied for the third ranking including MVT, Other transport, Poisoning, and Other specific and classifiable. **For age 1-4,
three mechanisms were tied for the fourth ranking including Drowning, Pedestrian, other, and Other transport. ^For age 5-9, three
mechanisms were tied for the fourth ranking including Other transport, Homicide, and Undetermined Suffocation. Each of these mechanisms
had fewer than 10 deaths.
Data Source: Oklahoma Multiple Cause of Death File (MCOD), 2009-2013, National Center for Health Statistics.
Leading Causes of Hospital-Admitted Injuries, Age 0-24, 2012
Oklahoma
Oklahoma
5
Table 3: Leading Causes and Annual Incidence of Hospital-Admitted
Injuries by Age Group, Oklahoma, 2012
Age Groups
Rank <1 1 - 4 5 - 9 10 - 14 15 - 19 20 - 24
1 Assault
22
Fall
111
Fall
151
Self-Inflicted
109
Self-Inflicted
398
Self-Inflicted
416
2 Fall
15
Poisoning
68
MVT
60
Fall
87
MVT
231
MVT
376
3
Unintentional
Unspecified
11
Other spec &
classifiable
45
Bites
and stings
52
MVT
74
Fall
103
Assault
146
4
Other
specified, NEC
*
MVT
39
MVT
Occupant
40
Transport,
other
51
Poisoning
76
Poisoning
128
5
Three
Tied†
*
Assault
37
Unspecified
24
Struck by/
against
45
Assault
75
Fall
101
Note: All mechanisms of assault and self-inflicted injury and were combined according to intent. Each listed mechanism is unintentional
except those labeled "Unspecified" or otherwise noted. MVT = Motor Vehicle Traffic. NEC = Not Elsewhere Classifiable. Spec = Specified.
Nat/Env = Natural/Environmental. * = cell values that range from 1-10 were suppressed for data confidentiality purposes. †For ages < 1, six
mechanisms were tied for the third ranking including Fall, Hot Object/Substance, Other Natural/Environmental, Suffocation, Other Spec &
Classifiable, And Other Specified, NEC. ††For ages <5-9, four mechanisms were tied for the fourth ranking including Pedal Cyclist, Other;
Other Natural/Env; Unintentional Unspecified; and Unspecified. †††For ages 5-9, four mechanisms were tied for the fifth ranking including
Hot object/substance; Transport, Other; Other Spec & Classifiable; and Other Specified, NEC. Source: Children's Safety Network Economics
and Data Analysis Resource Center (CSN EDARC), at Pacific Institute for Research and Evaluation (PIRE), Calverton, MD, April, 2015.
Incidence based on 2012 Oklahoma State Inpatient Databases (SID), Healthcare Cost and Utilization Project (HCUP), Agency for Healthcare
Research and Quality (AHRQ). Counts exclude patients dead at the time of discharge, chronic/overuse injuries, and/or injuries treated at
hospitals that do not meet the American Hospital Association's (AHA) criteria of a short-term community hospital. To prevent double-counting,
readmission cases, transfers, and medical misadventures were excluded. All counts based on the patients' state of residence.
Data Source: Oklahoma State Inpatient Databases, 2012, Healthcare Utilization Project, Agency for Healthcare Research and Quality.
Child Passenger Injuries, Age 0-14
Oklahoma
Oklahoma
6
Table 4a: Child Passenger Deaths and Hospitalizations
Passengers
Deaths1
(2009-2013)
Deaths1 per
100,000
Hospital
Admissions2
(2012)
Hospital
Admissions2 per
100,000
Total
Hospital Days
Median
Hospital Days
Age 0-4 38 0.71 29 10.96 176 2
Age 5-9 33 0.61 40 15.10 163 2.5
Age 10-14 36 0.64 42 16.18 231 4
Total Age 0-14 107 0.65 111 14.07 570 4
Table 4b: Restraint Use of Children Killed In Crashes1
Not restrained, Age 0-4 31.6%
Not restrained, Age 5-9 33.3%
Not restrained, Age 10-14 61.1%
Not restrained, Age 0-14 42.1%
Table 4c: Who Is Driving When a Child Passenger Is Killed1
Driver reported by police as alcohol-involved 4.7%
Driver reported by police as drug-involved 1.9%
Driver of other vehicle in crash reported alcohol-involved 7.5%
Driver reported using a cellphone 0.0%
Data Sources: Population counts from the U.S. Bureau of the Census. 1 Fatal Analysis Reporting System, 2009-2013, National Highway Traffic
Safety Administration. 2 State Inpatient Databases, 2012, Healthcare Utilization Project, Agency for Healthcare Research and Quality.
* = Less than 10.
n/a = Not available.
Teen Occupant Injuries, Age 15-19 Oklahoma
Oklahoma
7
Table 5a: Teenage Motor Vehicle Occupant Deaths and Hospitalizations
Motor Vehicle
Occupant
Age 15-19
Deaths1
(2009-2013)
Deaths1 per
100,000
Hospital
Admissions2
(2012)
Hospital
Admissions2 per
100,000
Total
Hospital Days
Median
Hospital
Days
Total Occupants 294 4.89 202 78.92 974 3
Vehicle 277 4.61 187 73.06 893 3
Motorcycle 17 0.28 15 5.86 81 4
Table 5b: Restraint and Helmet Use of Teen Occupants Killed in Crashes1
Vehicle occupants not restrained 58.2%
Motorcycle riders not wearing a helmet, or wearing non-DOT-compliant helmet 76.5%
Table 5c: Alcohol Involvement in Crashes Where a Teen Occupant is Killed1
Any driver reported by police as alcohol-involved 24.1%
Teen driver of teen killed reported by police as alcohol-involved 8.2%
Table 5d: Driver Cell Phone Use in Crashes Where a Teen Occupant is Killed1
Drivers reported using a cellphone (2010-2013) 0.9%
Data Sources: Population counts from the U.S. Bureau of the Census. 1 Fatal Analysis Reporting System, 2009-2013, National Highway Traffic
Safety Administration. 2 State Inpatient Databases, 2012, Healthcare Utilization Project, Agency for Healthcare Research and Quality.
* = Less than 10.
n/a = Not available.
Suicide & Self-Harm, Age 10-19 Oklahoma
Oklahoma
8
Table 6a: Suicide Deaths and Self-Harm Hospitalizations Among 10 to 19 Year-Olds
Age 10-19
Suicide/Self-harm
Deaths1
(2009-2013)
Deaths1 per
100,000
Hospital
Admissions2
(2012)
Hospital
Admissions2 per
100,000
Total
Hospital Days
Median
Hospital Days
Total 193 7.46 507 98.35 2746 6
Cut/Pierce * * 163 31.62 1652 6
Poisoning * * 306 59.36 662 1
Firearm 105 4.06 * * * *
Data Sources: Population counts from the U.S. Bureau of the Census. 1 Multiple Cause of Death File, 2009-2013, National Center for Health
Statistics. 2 State Inpatient Databases, 2012, Healthcare Utilization Project, Agency for Healthcare Research and Quality.
* = Less than 10.
n/a = Not available.
Interpersonal Violence, Age 0-19
Oklahoma
Oklahoma
9
Table 7a: Homicide Deaths and Assault Hospitalizations Among 0 to 19 Year-Olds
Homicide/Assault
Deaths1
(2009-2013)
Deaths1 per
100,000
Hospital
Admissions2
(2012)
Hospital
Admissions2
per 100,000
Total
Hospital
Days
Median
Hospital
Days
Age 0-9 86 3.27 15 2.83 59 3
Age 10-19 134 2.57 82 15.91 517 2.5
Child Maltreatment, Age 0-3 21 1.99 n/a n/a n/a n/a
Data Sources: Population counts from the U.S. Bureau of the Census. 1 Multiple Cause of Death File, 2009-2013, National Center for Health
Statistics. 2 State Inpatient Databases, 2012, Healthcare Utilization Project, Agency for Healthcare Research and Quality.
* = Less than 10.
n/a = Not available.
Falls & Struck by /Against Injuries, Age 0-19
Oklahoma
Oklahoma
10
Table 8: Fall and Struck By/Against Deaths and Hospitalizations Among 0 to 19 Year-Olds, with Sports/Recreation-
Related and Furniture/Stair-Related Injuries Highlighted
Unintentional Falls and Struck
By/Against Injuries
Deaths1
(2009-20123
Deaths1 per
100,000
Hospital
Admissions2
(2012)
Hospital
Admissions2
per 100,000
Total
Hospital Days
Median
Hospital Days
Age 0-9, Total * * 332 62.71 638 1
Sports/Recreation 77 14.54 105 1
Furniture/Stairs 75 14.17 172 1
Age 10-19, Total * * 281 54.51 1168 2
Sports/Recreation 111 21.53 355 2
Furniture/Stairs 14 2.72 142 3
Data Sources: Population counts from the U.S. Bureau of the Census. 1 Multiple Cause of Death File, 2009-2013, National Center for Health
Statistics. 2 State Inpatient Databases, 2012, Healthcare Utilization Project, Agency for Healthcare Research and Quality.
* = Less than 10.
n/a = Not available.
Drug Poisoning Among Youths Ages 15-24 Oklahoma
Oklahoma
11
Figure 2: MVT, Suicide and Drug Poisoning Fatality Rates Among Youths
Aged 15 through 24, Oklahoma, 2009-2013
Figure 3: Fatal Unintentional and Undetermined Drug Poisoning Rate Among
Youths Aged 15 through 24, Oklahoma and U.S., 2009-2013
0
5
10
15
20
25
30
2009 2010 2011 2012 2013
Rat
e p
er 1
00
,00
0 P
op
ula
tio
n
Motor Vehicle Traffic
Suicide
Unintentional/Undetermined Drug Poisoning
0
2
4
6
8
10
12
14
2009 2010 2011 2012 2013
Rat
e p
er 1
00
,00
0 P
op
ula
tio
n
Oklahoma United States