SPRING 2005 O KLAHOMA C LIMATE ALSO INSIDE: Photos from the Field • Winter 2004-2005 Summary • Agricultural Weather Watch Topping the Century Mark Science Fair PARMS Portable Automated Research Micrometeorological Stations
Transcript
SPRING 2005
OKLAHOMA CLIMATE
ALSO INSIDE: Photos from the Field • Winter 2004-2005 Summary • Agricultural Weather Watch
Topping the Century Mark
Science Fair
PARMSPortable Automated Research Micrometeorological Stations
2 OKLAHOMA CLIMATE SPRING 2005
I’m sure this issue will get a few incredulous looks from folks thinking: “It’s spring; where are the tornado pictures? Where are the articles on the history of Oklahoma’s severe thunderstorms of years past? Not even a decent lightning picture?” Well, in truth, most Oklahomans already qualify as severe weather experts. Where else in the world would a garden variety thunderstorm elicit a map covering a quarter of your television screen, and where storm-chase vehicles have now gone airborne? Rest assured, we will return next spring to inundate you with severe weather information in endless minutiae. So for now, relax and take a break from the severe weather hysteria and enjoy this edition of “Oklahoma Climate.”
For this issue, we wanted to delve into a sundry of topics that might not get the ratings-grabbing hoopla of severe weather, but are important nonetheless. We start out with a bit of weather history, as Acting State Climatologist Derek Arndt brings the past to life with an article on the first National Weather Service building (then the United States Weather Bureau) constructed in the heart of Oklahoma City 100 years ago. OCS has a thriving Outreach division, and one of their primary missions is to further science education in our fair state. Read more on how that effort is enhanced with the ARM/Mesonet science fair, held every year at OU. Dr. Jeff Basara, Director of Research at OCS, provides details on the PARMS project, an attempt to match the world-class Mesonet on an even smaller scale. The staff at OCS has written an absolutely fantastic new lab manual, “Expectations in Meteorology.” We give you a preview of the manual with an exercise meant for the kiddos, and detail the manual’s creation in a feature article. Those of you stricken with your annual sneezing fits will appreciate our article on springtime allergens, and more importantly, how you can reduce your exposure to the offending particles. As usual, our friendly Mesonet Assistant Extension Specialist from Oklahoma State, Al Sutherland, will fill you agricultural types in on weather of interest during winter 2004-05, and update all you gardeners on important dates for your spring gardening needs. And lastly, a review of this past winter’s weather is included.
We at the Oklahoma Climatological Survey hope you enjoy this 7th edition of “Oklahoma Climate.” If you have any comments or suggestions, please feel free to contact me at [email protected].
Gary McManus – Editor
The Oklahoma Climatological Survey is the State Climate Office for Oklahoma
Dr. Renee McPherson, Acting DirectorDerek Arndt, Acting State Climatologist
Editorial BoardDerek ArndtStdrovia Blackburn (advisor) Brad Illston Cerry Leffler Gary McManus Dr. Renee McPhersonAndrea MelvinAl Sutherland
MESSAGE FROM THE EDITOR
Cover Photo: The sun sets over Lake Pawhuska. Photo by Ken Meyers. If you have a photo that you would like to be considered for the cover of Oklahoma Climate, please contact Gary McManus at [email protected].
Table of Contents
Topping the Century Mark.................................3 Science Fair.......................................................8
By Derek ArndtActing State ClimatologistOklahoma Climatological Survey
OKLAHOMA CLIMATE SPRING 2005 3
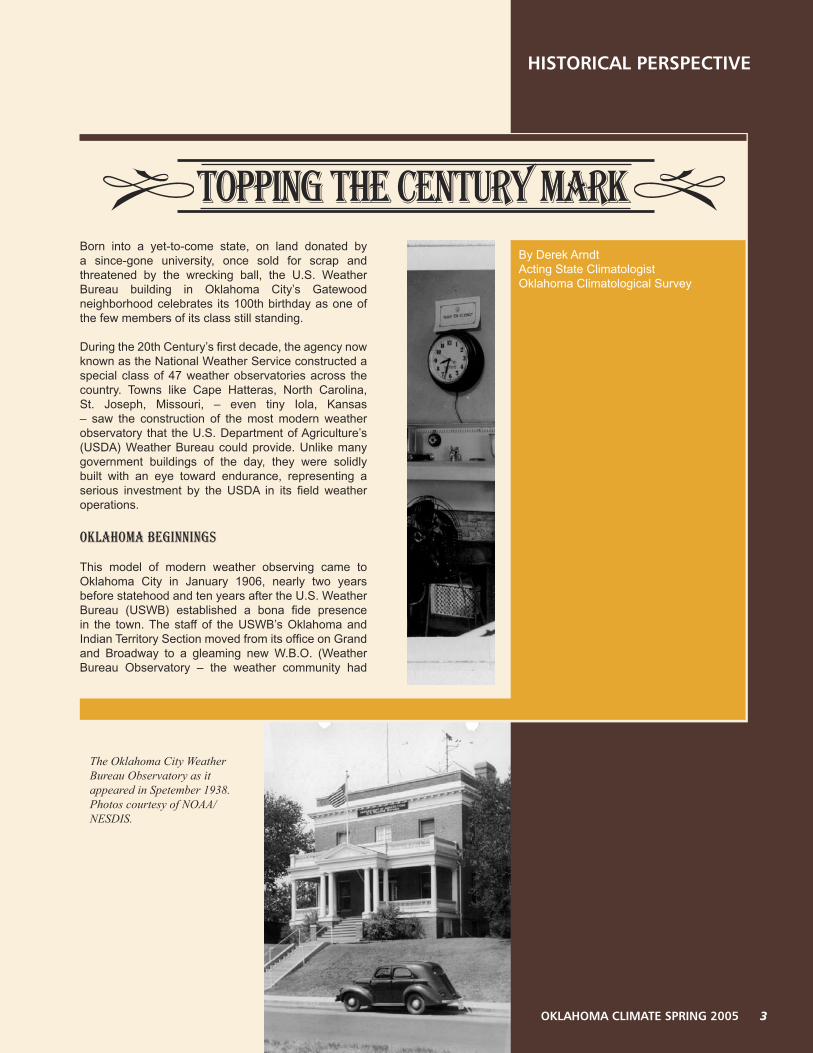
Born into a yet-to-come state, on land donated by a since-gone university, once sold for scrap and threatened by the wrecking ball, the U.S. Weather Bureau building in Oklahoma City’s Gatewood neighborhood celebrates its 100th birthday as one of the few members of its class still standing.
During the 20th Century’s first decade, the agency now known as the National Weather Service constructed a special class of 47 weather observatories across the country. Towns like Cape Hatteras, North Carolina, St. Joseph, Missouri, – even tiny Iola, Kansas – saw the construction of the most modern weather observatory that the U.S. Department of Agriculture’s (USDA) Weather Bureau could provide. Unlike many government buildings of the day, they were solidly built with an eye toward endurance, representing a serious investment by the USDA in its field weather operations.
Oklahoma Beginnings
This model of modern weather observing came to Oklahoma City in January 1906, nearly two years before statehood and ten years after the U.S. Weather Bureau (USWB) established a bona fide presence in the town. The staff of the USWB’s Oklahoma and Indian Territory Section moved from its office on Grand and Broadway to a gleaming new W.B.O. (Weather Bureau Observatory – the weather community had
Topping the Century Mark
The Oklahoma City Weather Bureau Observatory as it appeared in Spetember 1938. Photos courtesy of NOAA/NESDIS.
4 OKLAHOMA CLIMATE SPRING 2005
already contracted its strange lust for acronyms) at 1923 Classen Boulevard. That month’s edition of Climatological Data bubbled with excitement over the new building:
“On January 17th, the office quarters of the Section Center were moved ... to the new Weather Bureau Observatory, located on the campus of Epworth University in the northwestern section of the city. The building is a handsome, modern, two story and basement, brick structure, designed especially for the Weather Bureau, with a view to affording convenient and commodious office quarters and the most advantageous exposure for the instruments ...”
HISTORICAL PERSPECTIVE
The lot was donated to the USDA by Epworth University of Oklahoma City. This delighted Weather Bureau officials, who encouraged staffers to lecture and instruct at local higher education institutions. The practice introduced college students to the field of atmospheric science and familiarized the educated class with the limitations of forecasting. The Weather Bureau also recognized that it was still competing with many homegrown and widely accepted – if often a bit mystical – forecasting methods. Involvement with a local college helped market the Bureau’s forecasting techniques as “the only ones known to the scientific world that will bear investigation, and stand the test of reason and practical utility.” Educational work was considered “a legitimate and profitable field of usefulness for the Bureau and it’s [sic] Officials”.
The OKC W.B.O. shared the same dimensions and floor plan as half of its 46 classmates. Steve Doty, retired from the National Climatic Data Center in Asheville, North Carolina, highlights the thinking behind the consistent floor plan. “Even in the early 20th Century, weathermen often moved up the professional ladder through transfers – so it helped if an experienced meteorologist from the Abilene office could make his way blindfolded through the Oklahoma City building.”
At the W.B.O., surface observations were collected in the south lawn. Barometric pressure was recorded in the first floor weather office. Blank maps, spare instruments and supplies were kept in the basement. Payroll records, offices and other necessities of the weather workplace occupied most of the first floor’s remainder. Weather balloons and signal flags (weather forecasts were relayed via flags in the early century) were launched and raised from rooftop platforms.
The observatory underwent many changes of life in mid-century. The building was the American Business College for a number of years. This picture was taken around 1970. Photo from the collection of Howard K. Berry III.
4 OKLAHOMA CLIMATE SPRING 2005
Detail from a USDA postcard, circa 1906.
OKLAHOMA CLIMATE SPRING 2005 5
HISTORICAL PERSPECTIVE
For all their practical utility, W.B.O.s were much more than “handsome, modern” offices. They also served as the home of the Section Chief (akin to today’s National Weather Service Meteorologist-in-Charge), and his family. While the building accommodated the daily buzz of a round-the-clock weather operation, it also witnessed the love, arguments, silliness, discipline, and tragedies that accompany family life. The clackety-clack of the teletype echoed the pitter-patter of little feet in the hallway. Analytical meteorologists tracked the mercury of the first-floor barometer; anxious mothers with sick kids did likewise with a thermometer in the bedroom above. The crisp office smell of ink and stationery competed with the tantalizing aroma of tonight’s chicken from the kitchen.
The Old Man and the Melancholy Swede
The building’s first Chief was also its longest-serving. J. Pemberton Slaughter began his weather career with the War Department’s Signal Corps in 1883. He moved, along with most civilian meteorologists, to the USDA in 1891. He was already a 22-year veteran of the Weather Bureau when he left Pueblo, Colorado, to seize the reins of the Oklahoma City office just three weeks before the move to the new building.
Grim-faced, even sour at first appearance, Slaughter was by all accounts an enormously kind, charming and funny man. A believer in public outreach and educational potential of the Weather Bureau, he quickly endeared himself to Oklahoma’s farmers and city dwellers alike. Slaughter was particularly popular with the print media. Scribes throughout the state lovingly quoted “The Old Man” in their weather and climate reporting.
OKLAHOMA CLIMATE SPRING 2005 5
Slaughter’s most enduring talent may lay in his writings. His phrasing ran quick and clever, yet steered clear of silliness. He always navigated somewhere between prim and playful, and he held a rather famed penchant for using the word “decidedly”. Compared to the bleakness typical in climate reporting, the words remain refreshingly rich, even to this day.
In 1928, tragedy struck the Oklahoma City office and family home. Slaughter’s 20-year-old son John, who grew up in the building, was killed in a farm accident in Nevada. His remains were returned to Oklahoma City for burial. Several Weather Bureau meteorologists, including Slaughter’s longtime deputy Harry F. Wahlgren, served as pall bearers. Overcome by grief, Dora Slaughter died twelve hours after the funeral. A single week had claimed the lives of Slaughter’s son and wife.
J. Pemberton Slaughter became a beloved local figure in his quarter-century as Section Chief of the Oklahoma City office. Photo from the collection of Howard K. Berry III.
Chief meteorologist Harry F. Wahlgren reads a forecast over Oklahoma City radio juggernaut WKY around 1940. Photo from the collection of Howard K. Berry III.
6 OKLAHOMA CLIMATE SPRING 20056 OKLAHOMA CLIMATE SPRING 2005
The toll on Slaughter was undeniable. After four years of decline, he died of pneumonia in December 1932, six weeks short of fifty years’ service with the Weather Bureau. The Oklahoman and Times ran two front page articles on Slaughter’s life and death. One of them stated: “It was doubtful that anyone would deny that he was the most accommodating public official who ever lived in Oklahoma.” Wahlgren, friend and assistant of 22 years, picked up Slaughter’s duties by writing the December 1923 edition of Climatological Data. His first phrase was “It was a decidedly cold month ...”
Wahlgren shared Slaughter’s cozy relationship with the Sooner State’s media. The Oklahoman and Times played an influential role in ensuring his permanent succession to Section Chief (the national office initially preferred to transfer the next Chief into OKC). Wahlgren continued Slaughter’s practice of reading forecasts on the air for Oklahoma City AM radio juggernaut WKY. He became known as “The Melancholy Swede”, thanks to his tranquil, almost morose radio voice.
The Machine Gun Kelly Caper
Wahlgren’s popularity among Oklahoma City citizens and media members rivaled that of Slaughter. But he may always be known as the weatherman who helped bring down Charles “Machine Gun” Kelly.
On a hot July night in 1933, two gunmen kidnapped Charles Urschel, an Oklahoma City oil millionaire, while he played bridge with his wife and another couple. Three days later, Urschel’s tycoon friend J.G. Catlett received a ransom note demanding $200,000 in used bills for his safe return. The ransom was paid, and Urschel indeed returned home after eight days in captivity. Although exhausted, his memory yielded extraordinary detail about his captors and his captive environment, including the precise times of frontal passages and precipitation.
Wahlgren and meteorologists from the Weather Bureau’s Dallas office determined that, according to Urschel’s recollection, he had been held captive somewhere near Paradise, Texas. The location was corroborated by flight records matching Urschel’s memory of the time of airplane overflights. Within two weeks, five kidnappers and conspirators were taken into custody at a farmhouse near Paradise, Texas. By year’s end, 21 criminals associated with the case were captured and eventually convicted. Most of the ransom money was recovered, and Wahlgren received a letter of commendation from FBI Director J. Edgar Hoover.
Wahlgren was transferred to St. Louis in 1943. Upon leaving, he called Oklahoma City “the best place on God’s earth”. He and his wife returned to Oklahoma City upon his retirement in 1957. They both died in the autumn of 1973
HISTORICAL PERSPECTIVE
The Oklahoma City observation platform housed a wind vane and cup ane-mometer to measure wind direction, plus additional instruments to measure sunshine and sleet. Around the time of this photo (September 1938), routine radiosonde (weather balloon) observations began from this rooftop. Photo courtesy of NOAA/NESDIS.
OKLAHOMA CLIMATE SPRING 2005 7 OKLAHOMA CLIMATE SPRING 2005 7
Disrepair
After nearly fifty years of service at the Classen Boulevard location, the Weather Bureau began moving its offices and operations to newer facilities near Will Rogers World Airport in southwest Oklahoma City. By the end of the 1940s, the building was no longer a residence for the Section Chief. In 1951, the office began to scale back its measurements. On May 21st, 1953 the W.B.O.’s era officially ended with a rendition notice’s single line: “Consolidation of City and Airport Offices and moving both to new quarters.” The Weather Bureau abandoned the site and the grounds fell into dilapidation.
With abandonment, the land title reverted back to Oklahoma City University, which, after two gyrations and a stint in Guthrie as the Methodist University of Oklahoma, was the legal descendant of Epworth University. The USDA was obliged to tear down and remove the building and restore the lot to its original condition. Bids for the job poked well into the thousands, and the USDA hesitated to spend such money on a lost building that cost only $10,000 to build in 1905. The university proposed to purchase the building for $605 dollars – the estimated scrap value of its bricks. The USDA accepted.
Within a few years, the university sold the property at great profit to an Oklahoma City investor. That investor started several business ventures in the building, the most successful of which was the “American Business College”, which was, for lack of a better term, a charm school for young ladies entering the business world. The college lasted into the 1970s, when it went the way of most charm schools. The building then became a collection of small, separate one-person offices – each padlocked room containing an appraiser’s or agent’s answering machine and desk.
Rebirth
In 1980, Howard K. Berry, Jr. and his son Howard K. Berry III purchased the building with the intent of housing their law firm. This was a decidedly fortuitous moment for the old W.B.O. It took months to mend decades of use and abuse, but the Berrys restored many of its features to match the original look. For nearly a quarter-century now, the building has served once again as a handsome host to its professional occupants, the Berry & Van Meter law firm.
As the building approaches its 100th anniversary of service, Howard K. Berry III and his staff have uncovered many photographs and documents related to the buildings original purpose. The USDA Weather Bureau Observatory is now listed in the National Registry of Historic Places. Berry has been in touch with Harry F. Wahlgren’s daughters, who grew up in the observatory. They helped unlock some of its long-held secrets.
The author would like to thank Howard K. Berry III for his caring attention to the W.B.O., for his hospitality and for his assistance with research related to this article. Mr. Berry’s collaboration was invaluable to this article. Likewise, the author thanks Steve Doty for sparking an initial interest in the building’s history and journey into its Second Century. Mr. Doty is compiling a history of the class of 47 W.B.O.s that were built in the early 20th Century. His advice is much appreciated.
HISTORICAL PERSPECTIVE
The building’s dual role of observatory and residence shows in this picture from April 1934. The south side of the building features a nephoscope (a device that measures cloud movement), rain gauge, snow gauge, instru-ment shelter and a clothesline for drying the Wahlgren family wardrobe. Photo courtesy of NOAA/NESDIS.
The Weather Bureau Observatory, built in 1905 and opened in 1906, approaches its 100th birthday as the well-tended offices of an Oklahoma City law firm. Photo courtesy of Derek Arndt.
8 OKLAHOMA CLIMATE SPRING 20058 OKLAHOMA CLIMATE SPRING 2005
Every year students from across the state of Oklahoma come to Norman for the ARM/Mesonet Science Fair. Students compete in two categories: lower division, which is kindergarten through seventh grade; and upper division, covering grades eight through twelve. Projects are required to use data from the National Weather Service, the Atmospheric Radiation Measurement (ARM) program, or the Oklahoma Mesonet.
This was the fourth year Jefferson Middle School from Oklahoma City participated in the science fair. Mary Hynes has supported her students each year, working with them to develop projects and collect data. Mary’s class is the first time students learn about meteorology, and many of them have no background on science fairs, the Oklahoma Mesonet, weather, or even the scientific method. Most students don’t have access to a computer at home and time at the school library computers is limited. Mary helps the students by printing any graphs or charts they need, and also purchases materials for the projects including printer ink, paper, glue and their project boards. She keeps her classroom open before and after school to work on the science projects.
Jefferson Middle School’s first two years at the science fair were a learning experience. After the first year, the students took home comments from the judges but few awards beyond Honorable Mention. The second and third years showed improvement, but they
FEATURE ARTICLE
SCIENCEFAIR
By Loren GmachlOutreach Program Assistant
Oklahoma Climatological Survey
Angel Beauchamp of Weathernews, Inc. talks with Buddy Mullins and Donovan Arnold about
their project. (Photo Above)
OKLAHOMA CLIMATE SPRING 2005 9
OCS FEATURE ARTICLE
Lower Division:
First Place: Hay Fever! by Jesus Lugo, 7th, Jefferson Middle SchoolSecond Place: Wind Effects by Keindra Williams, 6th, Monroe ElementaryThird Place: Follow the Bouncing Ball by Bristow Mercedes, Amanda McKinney, and Denise Warner, 7th, Jefferson Middle School
Upper Division:
First Place: Wind – Renewable Alternative Energy – It’s About Time! by Kasey Painter, 11th, Enid High SchoolSecond Place: Accuracy Counts by Rachel Devia, Morgan Giboney, and Andreina Martinez, 8th, Holy Family Cathedral SchoolThird Place: Forecasting Moods by Brenda Ned and Lisa Wilkerson, 8th, Holy Family Cathedral SchoolThird Place: Dogs: In, Out and About by Abby Hathcock, Amanda Hurney, and Amy Sanders, 8th, Holy Family Cathedral School
Mary Hynes is a 7th grade science teacher at Thomas Jefferson Middle School in OKC.Lori Painter is a 6th grade teacher at Monroe Elementary in Enid.Steve Podany is a 7th and 8th grade science teacher at Holy Family Cathedral School in Tulsa.
still weren’t achieving the scores they wanted. The past two years Andrea Melvin and I have visited with the students before the fair working with them to gather data, do research, and guide them in pulling their projects together.
Since Mary’s first ARM/Oklahoma Mesonet Science Fair, she says there is now a better understanding of how the fair works. The judge’s comments give them areas of weakness to work on, and projects have improved each year. The creative elements are better each year as they look back on past projects and try to improve. Mary finds the changes in the students the best part of all. She gets to see the students “wake up” to science and find out how much science is a part of everything in life. By participating in the science fair, Mary is able to learn more about her students and is challenged daily by them to keep up with their thoughts, abilities, and energy.
The students found the fair to be a fun learning experience. They found that they had the confidence to do the project and explain it to the judges. Others discovered that working in a team is better than going it alone. They learned how to collect data, read graphs, and use the scientific method. Many students expressed great interest in returning to the science fair next year.
It was very exciting for Jefferson Middle School when the first place winner was announced at the award’s ceremony: “First place for the lower division goes to Jesus Lugo!” Shortly after the science fair, Jefferson Middle School had a special parent meeting and the principal had the students set up their projects for the parents to see. The names of the winners were announced and many congratulations ensued. Mary says, “I get to brag about my students for weeks afterward. I love this fair and will keep on loving it”.
OKLAHOMA CLIMATE SPRING 2005 9
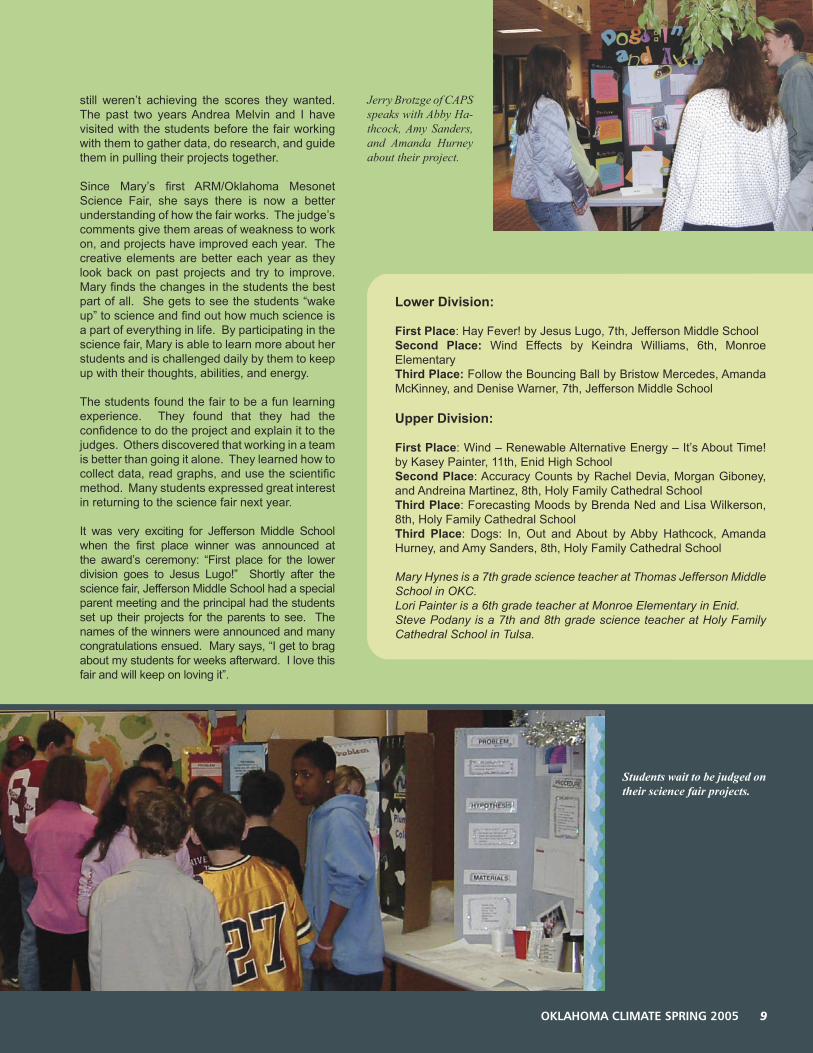
Jerry Brotzge of CAPS speaks with Abby Ha-thcock, Amy Sanders, and Amanda Hurney about their project.
Students wait to be judged on their science fair projects.
10 OKLAHOMA CLIMATE SPRING 2005
FEATURE ARTICLE
The Oklahoma Mesonet is one of the finest en-vironmental monitoring networks in the world. The stations collect observations that have been utilized by a wide range of users, including sci-entists, decision makers, emergency managers, and K-12 students. To keep pace with the inno-vation represented by the Oklahoma Mesonet, a project was developed to design and build a portable network of automated stations used to study atmospheric conditions at various spatial and temporal scales. In other words, these new stations would be deployed near Mesonet sites or anywhere else where a particular process was to be studied. As the case with the Mesonet, these new Portable Automated Research Micro-meteorological Stations, or PARMS, must col-lect research quality data, be durable enough to withstand extended periods of deployment in the field, and must be user friendly such that stu-dents and researchers can utilize the equipment for a variety of research projects. However, un-like typical Mesonet sites which are fixed in one location, the PARMS must be easily deployable from one location to another,
The PARMS were designed to be lightweight yet robust (Fig. 1). Thus, key features incorporated into the design include an aluminum frame and detachable concrete pedestals which can be raised or lowered to level the site. It is anticipated that the PARMS sites will be deployed at periods spanning varying lengths. For example, the sites may be deployed in a location for as little as a week to study a specific atmospheric phenome-non or several months for air quality monitoring.
During transport from one location to another, a PARMS is loaded into a standard pickup truck with the concrete pads detached (Fig. 2). Each concrete pad weighs approximately 35 kg and when attached, which provides a low center of gravity and enhanced stability to the site. In addition, the sensor booms swivel toward the center of the site which decreases the overall length during transport. A PARMS has a foot-print that spans approximately 1 m by 2.5 m during transport.
By Dr. Jeff BasaraDirector of ResearchOklahoma Climatological Survey
Portable Automated Research Micrometeorological Stations
Figure 1. A typical PARMS.
Figure 2. PARMS sites loaded for transport.
OKLAHOMA CLIMATE SPRING 2005 11
FEATURE ARTICLE
The sites were also designed for quick setup at any deployment location. As such, two or more individuals can deploy the site(s) in approximately 30-45 minutes. Tasks include: placing the frame on the concrete ped-estals, leveling the frame and all instruments, attaching guy wires for additional stability, connecting the battery to the datalogger and solar panel, and inspection of initial data collection. Once deployed, the site spans approximately 2 m (wide) by 5 m (long) by 2 m (tall), and data is collected at an interval of 1 minute.
Each PARMS site includes instruments to measure air temperature, relative humidity, downwelling solar ra-diation, reflected solar radiation, net radiation, surface skin temperature, and the horizontal and vertical wind components. In addition, each site includes a datalog-ger, 2 solar panels, a spread spectrum radio, and a battery. It should be noted that most of the instruments installed on PARMS are also installed at Oklahoma Mesonet sites.
Testing of the PARMS prototype station was completed on property adjacent to Max Westheimer Airport in Nor-man, Oklahoma, at the Oklahoma Mesonet instrument test facilities from September 8-21, 2004. The prototype station was placed in close proximity to the operational Norman (NRMN) Mesonet site. In addition, an identical sonic anemometer was placed immediately adjacent to the station on a sturdy tripod. Intercomparisons were completed using measurements collected by the proto-type PARMS and both the NRMN Mesonet station and the tripod-mounted reference sonic anemometer.
The initial deployment of the PARMS prototype to the Tar Creek study area near Miami, Oklahoma, occurred from October 8 - November 19, 2004. During the six-week period, high-resolution atmospheric data was collected to support air quality monitoring at the site.
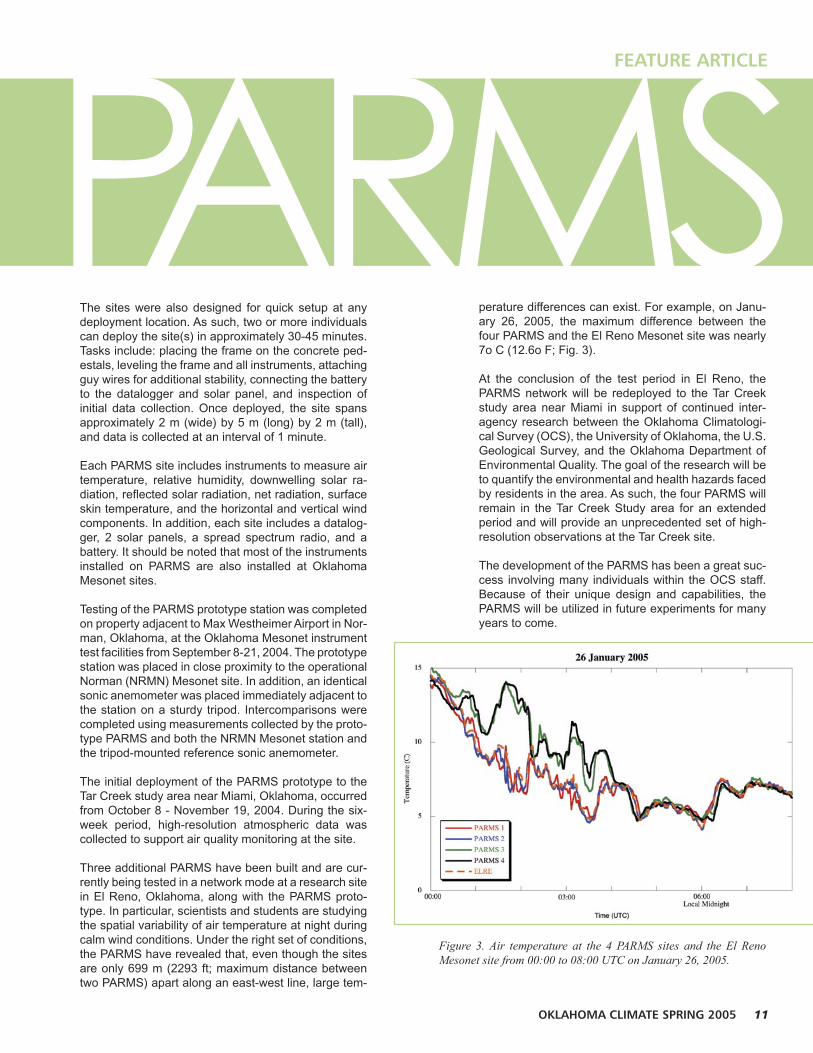
Three additional PARMS have been built and are cur-rently being tested in a network mode at a research site in El Reno, Oklahoma, along with the PARMS proto-type. In particular, scientists and students are studying the spatial variability of air temperature at night during calm wind conditions. Under the right set of conditions, the PARMS have revealed that, even though the sites are only 699 m (2293 ft; maximum distance between two PARMS) apart along an east-west line, large tem-
perature differences can exist. For example, on Janu-ary 26, 2005, the maximum difference between the four PARMS and the El Reno Mesonet site was nearly 7o C (12.6o F; Fig. 3).
At the conclusion of the test period in El Reno, the PARMS network will be redeployed to the Tar Creek study area near Miami in support of continued inter-agency research between the Oklahoma Climatologi-cal Survey (OCS), the University of Oklahoma, the U.S. Geological Survey, and the Oklahoma Department of Environmental Quality. The goal of the research will be to quantify the environmental and health hazards faced by residents in the area. As such, the four PARMS will remain in the Tar Creek Study area for an extended period and will provide an unprecedented set of high-resolution observations at the Tar Creek site.
The development of the PARMS has been a great suc-cess involving many individuals within the OCS staff. Because of their unique design and capabilities, the PARMS will be utilized in future experiments for many years to come.
Portable Automated Research Micrometeorological Stations PARMS
Figure 3. Air temperature at the 4 PARMS sites and the El Reno Mesonet site from 00:00 to 08:00 UTC on January 26, 2005.
12 OKLAHOMA CLIMATE SPRING 200512 OKLAHOMA CLIMATE SPRING 2005
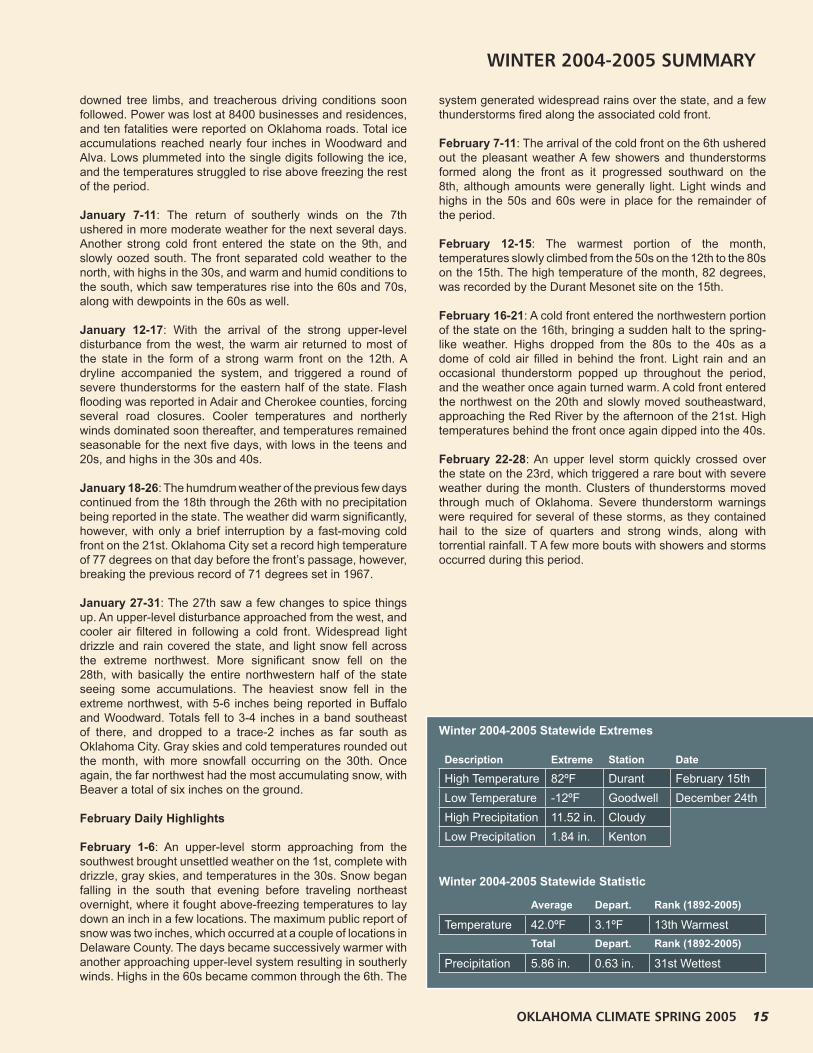
A sunset over Griffin Park, Norman, OK.Photo courtesy of Andrea Melvin.
12 OKLAHOMA CLIMATE SPRING 2005
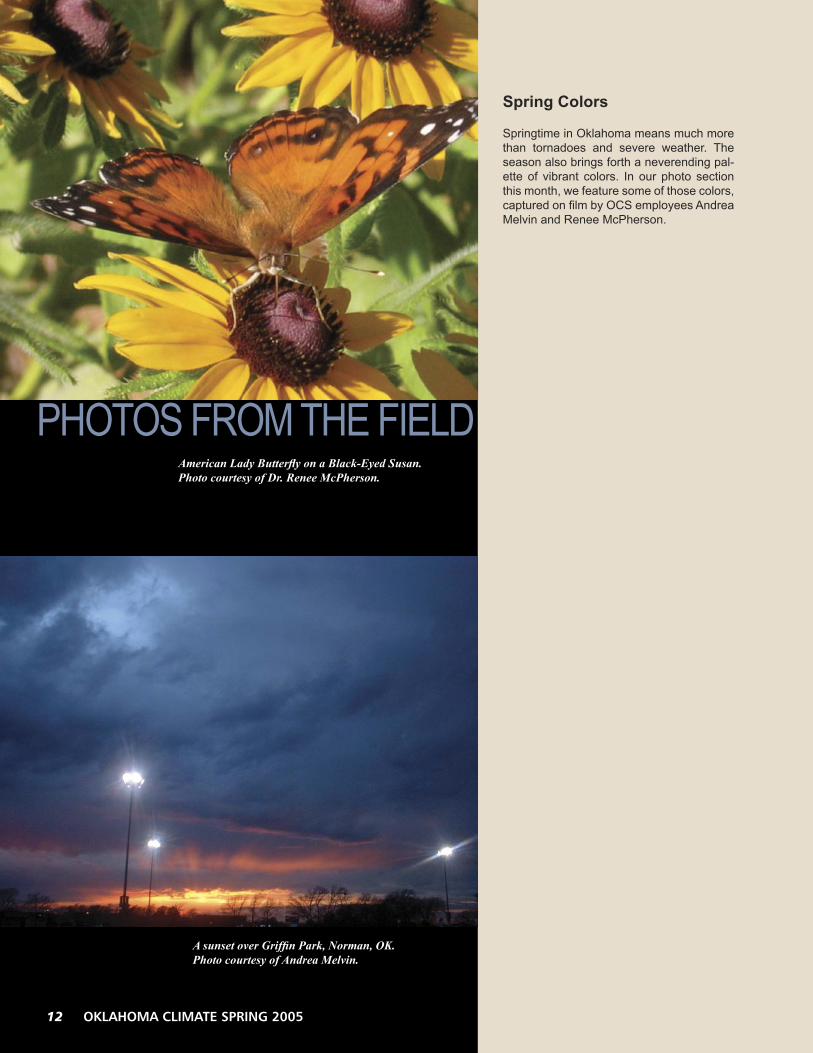
American Lady Butterfly on a Black-Eyed Susan.Photo courtesy of Dr. Renee McPherson.
PHOTOS FROM THE FIELD
Spring Colors
Springtime in Oklahoma means much more than tornadoes and severe weather. The season also brings forth a neverending pal-ette of vibrant colors. In our photo section this month, we feature some of those colors, captured on film by OCS employees Andrea Melvin and Renee McPherson.
OKLAHOMA CLIMATE SPRING 2005 13 OKLAHOMA CLIMATE SPRING 2005 13
PHOTOS FROM THE FIELD
OKLAHOMA CLIMATE SPRING 2005 13
Missouri Evening Primrose.Photo courtesy of Dr. Renee McPherson.
Whirling Butterfly.Photo courtesy of Dr. Renee McPherson.
Indian Paintbrush.Photo courtesy of Dr. Renee McPherson.
14 OKLAHOMA CLIMATE SPRING 2005
The winter of 2004-05 seems easy to quantify at a mere glance. It was decidedly mild, ranking as the 17th warmest winter in the record books. The data from each winter month concur, as December, January and February each ranked in the warmest one-third such periods on record. The precipitation totals for the winter period are a bit misleading, however. While the winter as a whole ranked as the 31st wettest since 1895, the season’s individual months vary greatly. December, for instance, was significantly dry; the 19th driest in history, in fact. That was countered the following month by the 5th wettest January on record. The season’s precipitation was rounded out by a quite ordinary February. Given the unusual warmth of the season, the precipitation that did fall was predominantly liquid. Only two winter snowstorms of note graced the state. The first granted southern Oklahoma a rare “white Christmas,” while the second blanketed the northwestern half of the state in late January. The only other frozen precipitation of significance arrived in the form of ice in early January, coating the northwestern one-third of the state
Precipitation
With the exception of portions of southern Oklahoma, especially the southeastern corner, virtually the entire state enjoyed a precipitation surplus for the season. The northern one-third of the state was fortunate to experience ample precipitation. In fact, the northeast, north central, and Panhandle regions had their 18th, 22nd, and 20th wettest winters since 1895, respectively. The primary region with a deficit was the southeast, where the precipitation total finished at just over one-half of an inch below normal. The Oklahoma Mesonet site at Cloudy, in Pushmataha County, recorded the season’s greatest precipitation total of 11.52 inches. Kenton brought up the rear with 1.84 inches; a meager-looking total, but still more than a half of an inch above the normal winter precipitation of 1.24 inches for that location.
Temperature
The statewide-averaged temperature for the winter was over three degrees above normal, which was true to within a few tenths of a degree for each region of the state as well. The warmest stretch of weather occurred in mid-February, as highs in the upper 70s and low 80s were widespread across the state. The season’s high temperature of 82 degrees occurred at Durant during this period, on the 15th. The coldest weather arrived just in time for the Christmas holiday, with the state’s low temperature of -12 degrees occurring at Goodwell on December 24th.
December Daily Highlights
December 1-4: Seasonable weather greeted 2004’s final month. The first four days provided plenty of sunshine with lows falling as low as the teens in the far northwest to 30s and 40s in the southeast. Highs followed the same pattern as temperatures rose into the 40s and 50s in the northwest, whereas the southeast saw 50s and 60s.
December 5-7: The state’s only real bout with severe weather occurred on the 6th, although even that was tame by Oklahoma standards. Highs on the 6th reached into the upper 60s, with a 70 degree reading being recorded at the Idabel Mesonet site.
December 8-12: Lows on the 8th were 10 degrees warmer than the previous day across most parts of Oklahoma, dropping only into the 40s. Overall, the weather was pleasantly warm throughout these five days. High temperatures were mainly in the 50s and 60s, although a few areas in western Oklahoma managed to reach the mid-to-upper 70s on the 11th.
December 13-20: The string without precipitation continued for another eight days, similar to the previous five. The temperatures cooled down for the 13th-16th behind northerly winds, allowing wind chills to drop into the upper teens in the northwest, and the 20s elsewhere. The temperatures rebounded back into the 50s and 60s on the 17th with the winds switching around to a southerly direction in advance of an upper-level storm system spinning over the southwestern U.S. A fast-moving cold front pushed through on the 19th. Low temperatures fell into the low-mid 20s across the northern half of the state, and the 30s elsewhere. Highs were 10-20 degrees cooler than the previous day, with the northern section remaining in the 30s. As the upper-level storm approached from the west, the southerly winds increased and high temperatures exploded into the upper 70s across southern Oklahoma.
December 21-24: The coldest weather of the season thus far arrived just in time for the holiday season. A strong cold front blasted through the state on the 22nd, bringing a rare snowstorm to southern Oklahoma. Amounts ranged from trace amounts in central Oklahoma to four inches at Durant. Temperatures plummeted throughout this period. Lows reached into below-zero territory in northwestern Oklahoma on the 23rd and 24th, with Goodwell suffering through a bone-chilling -12 degrees on Christmas Eve.
December 25-31: The temperatures rebounded quite nicely on the holiday with highs rebounding into the upper 50s and 60s. The remainder of the year played out played out similarly, with temperatures 10-20 degrees above normal in addition to the strong southerly winds.
January Daily Highlights
January 1-7: The New Year entered on a pleasant note. Low temperatures on the 1st were 20-30 degrees above normal, remaining above the normal high temperatures for that date. A record warm low temperature of 56 degrees was set in Oklahoma City for New Year’s Day. High temperatures were also above normal, rising into the 60s and 70s statewide. A cold front overnight on the month’s second day spoiled the pleasant weather, however. The cold front slowly sagged south over the next couple of days, triggering heavy rainfall along its boundary. Many locations in the southeast received over two inches of liquid precipitation on the 3rd. The weather turned nasty on the 4th and 5th with the arrival of a significant ice storm. Most of the northwestern two-thirds of the state received at least some ice, although the northwestern one-third of the state was the hardest hit. The ice began falling on the morning of the 4th in northwestern Oklahoma, and power outages,
WINTER 2004-2005 SUMMARY
14 OKLAHOMA CLIMATE SPRING 2005
OKLAHOMA CLIMATE SPRING 2005 15
downed tree limbs, and treacherous driving conditions soon followed. Power was lost at 8400 businesses and residences, and ten fatalities were reported on Oklahoma roads. Total ice accumulations reached nearly four inches in Woodward and Alva. Lows plummeted into the single digits following the ice, and the temperatures struggled to rise above freezing the rest of the period.
January 7-11: The return of southerly winds on the 7th ushered in more moderate weather for the next several days. Another strong cold front entered the state on the 9th, and slowly oozed south. The front separated cold weather to the north, with highs in the 30s, and warm and humid conditions to the south, which saw temperatures rise into the 60s and 70s, along with dewpoints in the 60s as well.
January 12-17: With the arrival of the strong upper-level disturbance from the west, the warm air returned to most of the state in the form of a strong warm front on the 12th. A dryline accompanied the system, and triggered a round of severe thunderstorms for the eastern half of the state. Flash flooding was reported in Adair and Cherokee counties, forcing several road closures. Cooler temperatures and northerly winds dominated soon thereafter, and temperatures remained seasonable for the next five days, with lows in the teens and 20s, and highs in the 30s and 40s.
January 18-26: The humdrum weather of the previous few days continued from the 18th through the 26th with no precipitation being reported in the state. The weather did warm significantly, however, with only a brief interruption by a fast-moving cold front on the 21st. Oklahoma City set a record high temperature of 77 degrees on that day before the front’s passage, however, breaking the previous record of 71 degrees set in 1967.
January 27-31: The 27th saw a few changes to spice things up. An upper-level disturbance approached from the west, and cooler air filtered in following a cold front. Widespread light drizzle and rain covered the state, and light snow fell across the extreme northwest. More significant snow fell on the 28th, with basically the entire northwestern half of the state seeing some accumulations. The heaviest snow fell in the extreme northwest, with 5-6 inches being reported in Buffalo and Woodward. Totals fell to 3-4 inches in a band southeast of there, and dropped to a trace-2 inches as far south as Oklahoma City. Gray skies and cold temperatures rounded out the month, with more snowfall occurring on the 30th. Once again, the far northwest had the most accumulating snow, with Beaver a total of six inches on the ground.
February Daily Highlights
February 1-6: An upper-level storm approaching from the southwest brought unsettled weather on the 1st, complete with drizzle, gray skies, and temperatures in the 30s. Snow began falling in the south that evening before traveling northeast overnight, where it fought above-freezing temperatures to lay down an inch in a few locations. The maximum public report of snow was two inches, which occurred at a couple of locations in Delaware County. The days became successively warmer with another approaching upper-level system resulting in southerly winds. Highs in the 60s became common through the 6th. The
system generated widespread rains over the state, and a few thunderstorms fired along the associated cold front.
February 7-11: The arrival of the cold front on the 6th ushered out the pleasant weather A few showers and thunderstorms formed along the front as it progressed southward on the 8th, although amounts were generally light. Light winds and highs in the 50s and 60s were in place for the remainder of the period.
February 12-15: The warmest portion of the month, temperatures slowly climbed from the 50s on the 12th to the 80s on the 15th. The high temperature of the month, 82 degrees, was recorded by the Durant Mesonet site on the 15th.
February 16-21: A cold front entered the northwestern portion of the state on the 16th, bringing a sudden halt to the spring-like weather. Highs dropped from the 80s to the 40s as a dome of cold air filled in behind the front. Light rain and an occasional thunderstorm popped up throughout the period, and the weather once again turned warm. A cold front entered the northwest on the 20th and slowly moved southeastward, approaching the Red River by the afternoon of the 21st. High temperatures behind the front once again dipped into the 40s.
February 22-28: An upper level storm quickly crossed over the state on the 23rd, which triggered a rare bout with severe weather during the month. Clusters of thunderstorms moved through much of Oklahoma. Severe thunderstorm warnings were required for several of these storms, as they contained hail to the size of quarters and strong winds, along with torrential rainfall. T A few more bouts with showers and storms occurred during this period.
Average Depart. Rank (1892-2005)
Temperature 42.0ºF 3.1ºF 13th Warmest
Total Depart. Rank (1892-2005)
Precipitation 5.86 in. 0.63 in. 31st Wettest
Winter 2004-2005 Statewide Statistic
Description Extreme Station Date
High Temperature 82ºF Durant February 15th
Low Temperature -12ºF Goodwell December 24th
High Precipitation 11.52 in. Cloudy
Low Precipitation 1.84 in. Kenton
Winter 2004-2005 Statewide Extremes
OKLAHOMA CLIMATE SPRING 2005 15
WINTER 2004-2005 SUMMARY
16 OKLAHOMA CLIMATE SPRING 2005
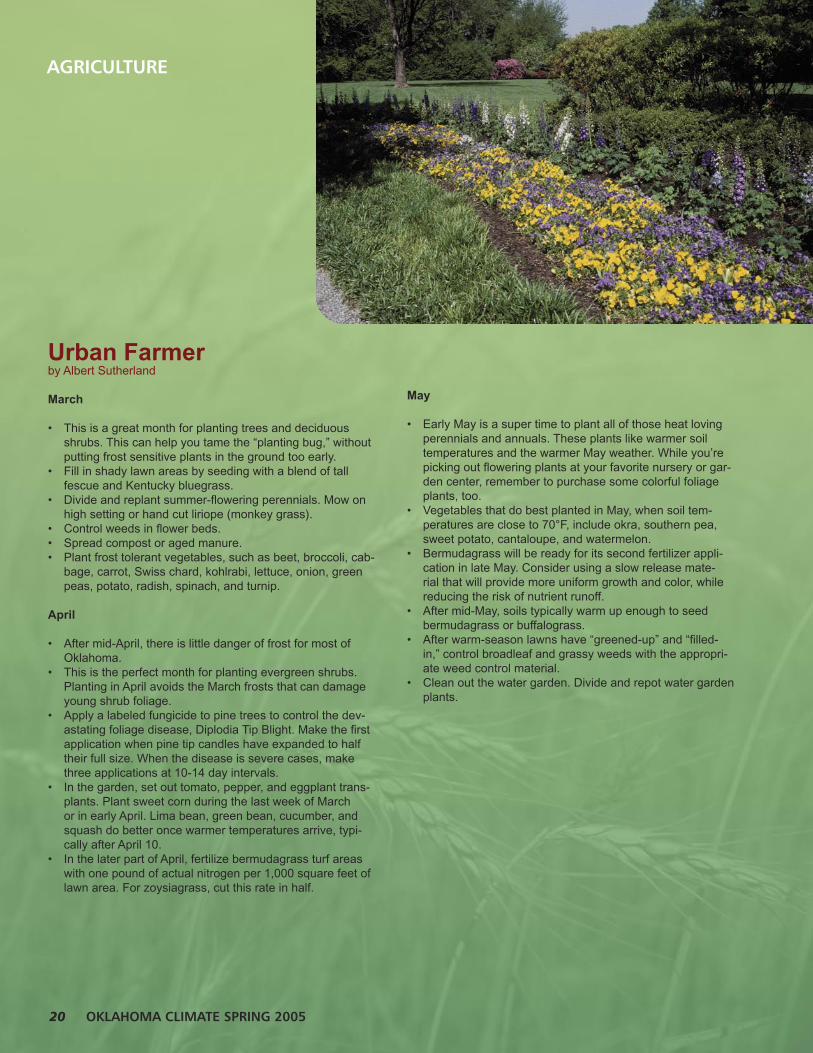
Observed Rainfall
Rainfall Departure from Normal
WINTER 2004-2005 SUMMARY
OKLAHOMA CLIMATE SPRING 2005 17
Average Temperature
Temperature Departure from Normal
WINTER 2004-2005 SUMMARY
18 OKLAHOMA CLIMATE SPRING 2005
Climate DivisionPrecipitation
(inches)Departure from Normal (inches) Rank since 1895
Panhandle 77 Jan 21st Arnett -12 Dec 24th Goodwell 4.05 Buffalo 1.59 Jan 4th Arnett
North Central 78 Jan 21st Woodward -3 Dec 24th Woodward 5.88 Newkirk 2.36 Jan 4th Cherokee
Northeast 80 Feb 20th Inola 3 Dec 24th Burbank 10.85 Jay 2.72 Jan 4th Jay
West Central 78 Feb 14th Erick -1 Dec 24th Camargo 4.15 Putnam 1.42 Jan 4th Butler
Central 78 Feb 20th Chandler 5 Dec 24th Oilton 9.14 Okemah 2.59 Jan 3rd Okemah
East Central 79 Feb 15th Sallisaw 7 Dec 24th Westville 10.89 Westville 3.10 Jan 3rd McAlester
Southwest 79 Feb 14th Hollis 5 Dec 24th Mangum 4.70 Walters 1.18 Jan 5th Altus
South Central 82 Feb 15th Durant 6 Dec 23rd Burneyville 8.50 Centrahoma 3.32 Jan 3rd Centrahoma
Southeast 80 Feb 15th Clayton 7 Dec 23rd Mt Herman 11.52 Cloudy 2.89 Jan 3rd Broken Bow
Statewide 82 Feb 15th Durant -12 Dec 24th Goodwell 11.52 Cloudy 3.32 Jan 3rd Centrahoma
Winter 2004-2005 Mesonet Precipitation Comparison
Winter 2004-2005 Mesonet Temperature Comparison
Winter 2004-2005 Mesonet Extremes
WINTER 2004-2005 SUMMARY
OKLAHOMA CLIMATE SPRING 2005 19
Agriculture Weather WatchBy Albert Sutherland, CPH, CCAMesonet Assistant Extension SpecialistOklahoma State University
Agricultural producers are starting out 2005 with the highest soil moisture levels they have seen for many years. We have had a winter of widespread, gentle, regular rainfall with little runoff. These types of rains lead to water soaking deep into the soil profile. With plant yield and quality so closely tied to good soil moisture, starting out the growing season with a soil profile of high moisture is like starting the year with unexpected extra money in the checkbook. Now we’ll need to see if the rest of the cropping season will allow this to become extra profit.
The downside of a winter of high rainfall has been that saturated wheat fields made for bad cattle grazing conditions. A high percentage of wheat fields planted for grazing were turned into “stomp-lots.” This new term, coined by Roger Gribble, OSU Northwest District Agronomist, accurately describes muddy wheat fields packed and punctuated with hoof tracks. In the worst fields, the cattle have tromped the wheat into the soil to such a degree that the plants are not producing any tillers. Wheat tillers are side shoots that can each produce a wheat head. The higher the number of tillers, the higher the yield potential is. Wheat plants with few or no tillers have no potential to produce a normal grain crop. So for wheat growers with “stomp-lot” fields, the harvest already looks bleak.
“Stomp-lot” fields not only will produce little wheat, but the cattle pastured in these fields had daily gain drop from a typical 2-3 pounds per day to a gain of only 1 pound per day. This makes for a double punch of “little gain and no grain.”
Producers with better drained pastures were able to move their cattle to improve cattle gain and wheat grain. The producers who leased their pasture were left with no option and had to place the cattle on the land as dictated in the grazing lease agreement.
One lesson to remember from this winter is that what is good weather for one producer can have serious negative impact on other agricultural operations. This is one of the reasons why those of us working with the Oklahoma Mesonet have created a wide variety of weather data products and decision support tools. People are often surprised at the many ways they can view wind, rain, and temperature data. While this may seem like a duplication of effort, the different data sets and different display formats allows each user to look at the data in a way that best fits their need. You can be assured that we will continue to do our best to create products that take weather information and show how that data applies to everyday, real-life situations.
If you see a need for a new weather data format or have ideas for a new agricultural application, please, let us know. You can contact me, Albert Sutherland, by phone at 405-224-2216 or by email at [email protected].
AGRICULTURE
OKLAHOMA CLIMATE SPRING 2005 19
20 OKLAHOMA CLIMATE SPRING 2005
Urban Farmerby Albert Sutherland
March
• This is a great month for planting trees and deciduous shrubs. This can help you tame the “planting bug,” without putting frost sensitive plants in the ground too early.
• Fill in shady lawn areas by seeding with a blend of tall fescue and Kentucky bluegrass.
• Divide and replant summer-flowering perennials. Mow on high setting or hand cut liriope (monkey grass).
• Control weeds in flower beds.• Spread compost or aged manure.• Plant frost tolerant vegetables, such as beet, broccoli, cab-
bage, carrot, Swiss chard, kohlrabi, lettuce, onion, green peas, potato, radish, spinach, and turnip.
April
• After mid-April, there is little danger of frost for most of Oklahoma.
• This is the perfect month for planting evergreen shrubs. Planting in April avoids the March frosts that can damage young shrub foliage.
• Apply a labeled fungicide to pine trees to control the dev-astating foliage disease, Diplodia Tip Blight. Make the first application when pine tip candles have expanded to half their full size. When the disease is severe cases, make three applications at 10-14 day intervals.
• In the garden, set out tomato, pepper, and eggplant trans-plants. Plant sweet corn during the last week of March or in early April. Lima bean, green bean, cucumber, and squash do better once warmer temperatures arrive, typi-cally after April 10.
• In the later part of April, fertilize bermudagrass turf areas with one pound of actual nitrogen per 1,000 square feet of lawn area. For zoysiagrass, cut this rate in half.
AGRICULTURE
20 OKLAHOMA CLIMATE SPRING 2005
May
• Early May is a super time to plant all of those heat loving perennials and annuals. These plants like warmer soil temperatures and the warmer May weather. While you’re picking out flowering plants at your favorite nursery or gar-den center, remember to purchase some colorful foliage plants, too.
• Vegetables that do best planted in May, when soil tem-peratures are close to 70°F, include okra, southern pea, sweet potato, cantaloupe, and watermelon.
• Bermudagrass will be ready for its second fertilizer appli-cation in late May. Consider using a slow release mate-rial that will provide more uniform growth and color, while reducing the risk of nutrient runoff.
• After mid-May, soils typically warm up enough to seed bermudagrass or buffalograss.
• After warm-season lawns have “greened-up” and “filled-in,” control broadleaf and grassy weeds with the appropri-ate weed control material.
• Clean out the water garden. Divide and repot water garden plants.
OKLAHOMA CLIMATE SPRING 2005 21
INTERPRETATION ARTICLE
The new lab manual, Explorations in Meteorology, written by staff at the Oklahoma Climatological Survey, provides students with an opportunity to learn meteorological concepts using data from real-world events. In this interpretation article, we will focus on a supercell thunderstorm from Lab 11 of this manual. For help with terminology, please consult our weather glossary located at http://earthstorm.ocs.ou.edu/materials/glossary.php.
Thunderstorm Classification
Thunderstorms are classified into four types: single-cell, multi-cell, supercell, and squall line. We will focus on supercell storms.
Although single-cell and multi-cell storms can produce severe weather, supercell storms almost always produce severe weather. These prolific severe storms often persist for several hours and travel several hundred miles. The supercell develops in an environment with strong vertical wind shear (e.g., stronger winds aloft than at the surface). As a result, the updrafts of supercells are tilted with height, physically separating the updraft regions (Figure 1). The separation of the updraft and downdraft allows precipitation to fall without destroying the storm or its updraft. Most supercells also rotate as a result of the vertical wind shear being deflected into the horizontal. Most violent and damaging tornadoes are associated with supercells.
The Environment of Thunderstorms
Thunderstorms require a supply of unstable air (usually warm and moist) for fuel. They also require a source of lift, allowing deep clouds to initiate in the unstable air. The lifting mechanism can originate at the surface (e.g., from orography, a front, or a dryline) or aloft (e.g., from an upper-level storm system or jet stream).
In their wake, thunderstorms normally leave a footprint of more stable air (usually cooler and drier) from the downdraft. The boundary between the warm, humid environment and the cool, dry thunderstorm outflow is called a gust front (see Figure 2). As the gust front moves away from its parent thunderstorm, it can act as a lifting mechanism to help generate additional storms.
22 OKLAHOMA CLIMATE SPRING 2005
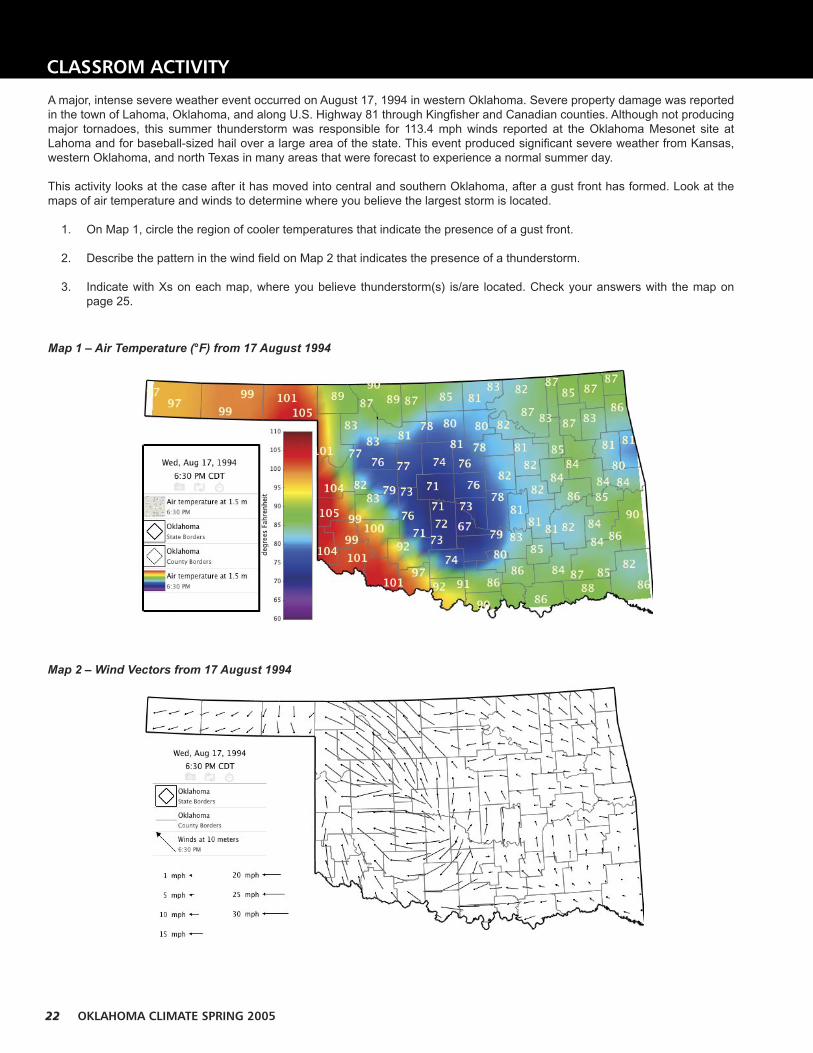
A major, intense severe weather event occurred on August 17, 1994 in western Oklahoma. Severe property damage was reported in the town of Lahoma, Oklahoma, and along U.S. Highway 81 through Kingfisher and Canadian counties. Although not producing major tornadoes, this summer thunderstorm was responsible for 113.4 mph winds reported at the Oklahoma Mesonet site at Lahoma and for baseball-sized hail over a large area of the state. This event produced significant severe weather from Kansas, western Oklahoma, and north Texas in many areas that were forecast to experience a normal summer day.
This activity looks at the case after it has moved into central and southern Oklahoma, after a gust front has formed. Look at the maps of air temperature and winds to determine where you believe the largest storm is located.
1. On Map 1, circle the region of cooler temperatures that indicate the presence of a gust front.
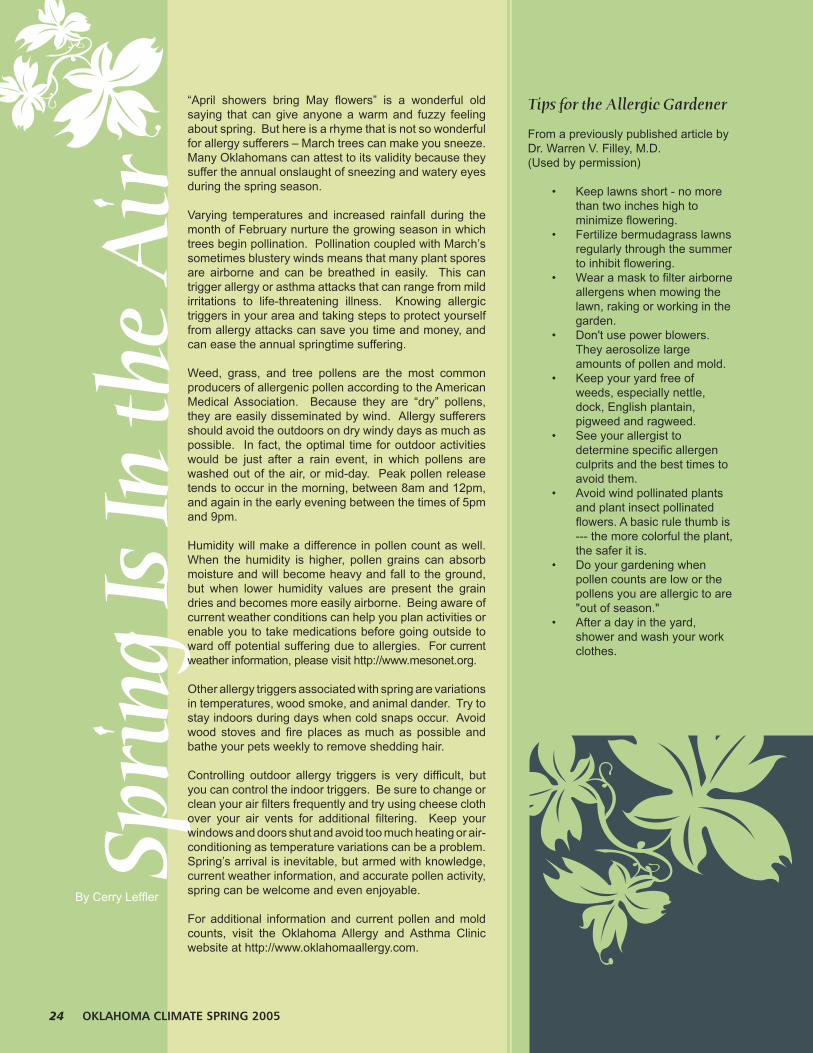
2. Describe the pattern in the wind field on Map 2 that indicates the presence of a thunderstorm.
3. Indicate with Xs on each map, where you believe thunderstorm(s) is/are located. Check your answers with the map on page 25.
Map 1 – Air Temperature (°F) from 17 August 1994
Map 2 – Wind Vectors from 17 August 1994
CLASSROM ACTIVITY
OKLAHOMA CLIMATE SPRING 2005 23
The Oklahoma Climatological Survey (OCS) conducts a host of educational workshops throughout the year, teaching public safety officials, K-12 educators, and others how to apply weather data to their jobs. One benefit of the hundreds of hours of planning for these workshops is that OCS meteorologists have prepared many learning activities that can be used by students who study meteorology, either for their major or for general interest.
Earlier this year, many of these written materials were packaged into a set of 16 laboratory activities and were published as a manual called Explorations in Meteorology. Explorations in Meteorology places a strong emphasis on helping students to understand weather and climate by using real meteorological data. The activities in this lab manual require that students tap into the OCS archives of meteorological data in order to complete meteorological exercises. Full-color pictures and graphs help students visually understand weather and severe weather topics. The lab manual also challenges students by providing optional questions intended for honors students, making this lab manual appropriate for both introductory and honors meteorology courses.
Published by Brooks-Cole, Inc., Explorations in Meteorology highlights data from the Oklahoma Mesonet (a joint program of the University of Oklahoma and Oklahoma State University); the National Oceanic and Atmospheric Administration (through the National Weather Service and the National Environmental Satellite, Data, and Information Service); and the Atmospheric Radiation Measurement Program (a research facility of the U.S. Department of Energy). The activities have been tested for several semesters by the faculty, graduate teaching assistants, and undergraduate scholars of the School of Meteorology at the University of Oklahoma.
The full-color maps and graphs used in Explorations in Meteorology were created using visualization software developed by OCS software engineers. OCS artists designed the manual’s layout and graphics. OCS meteorologists and climatologists developed the content and completed the final editing. Overall, Explorations in Meteorology represents the efforts of a large team of experts who desired to positively influence the education of future meteorologists, climatologists, geographers, and other weather-related professionals.
OCS’s NEW TEACHING TOOL
OKLAHOMA CLIMATE SPRING 2005 23
By Renee McPhersonActing DirectorOklahoma Climatological Survey
24 OKLAHOMA CLIMATE SPRING 2005
Spri
ng Is
In th
e A
ir
24 OKLAHOMA CLIMATE SPRING 2005
“April showers bring May flowers” is a wonderful old saying that can give anyone a warm and fuzzy feeling about spring. But here is a rhyme that is not so wonderful for allergy sufferers – March trees can make you sneeze. Many Oklahomans can attest to its validity because they suffer the annual onslaught of sneezing and watery eyes during the spring season.
Varying temperatures and increased rainfall during the month of February nurture the growing season in which trees begin pollination. Pollination coupled with March’s sometimes blustery winds means that many plant spores are airborne and can be breathed in easily. This can trigger allergy or asthma attacks that can range from mild irritations to life-threatening illness. Knowing allergic triggers in your area and taking steps to protect yourself from allergy attacks can save you time and money, and can ease the annual springtime suffering.
Weed, grass, and tree pollens are the most common producers of allergenic pollen according to the American Medical Association. Because they are “dry” pollens, they are easily disseminated by wind. Allergy sufferers should avoid the outdoors on dry windy days as much as possible. In fact, the optimal time for outdoor activities would be just after a rain event, in which pollens are washed out of the air, or mid-day. Peak pollen release tends to occur in the morning, between 8am and 12pm, and again in the early evening between the times of 5pm and 9pm.
Humidity will make a difference in pollen count as well. When the humidity is higher, pollen grains can absorb moisture and will become heavy and fall to the ground, but when lower humidity values are present the grain dries and becomes more easily airborne. Being aware of current weather conditions can help you plan activities or enable you to take medications before going outside to ward off potential suffering due to allergies. For current weather information, please visit http://www.mesonet.org.
Other allergy triggers associated with spring are variations in temperatures, wood smoke, and animal dander. Try to stay indoors during days when cold snaps occur. Avoid wood stoves and fire places as much as possible and bathe your pets weekly to remove shedding hair.
Controlling outdoor allergy triggers is very difficult, but you can control the indoor triggers. Be sure to change or clean your air filters frequently and try using cheese cloth over your air vents for additional filtering. Keep your windows and doors shut and avoid too much heating or air-conditioning as temperature variations can be a problem. Spring’s arrival is inevitable, but armed with knowledge, current weather information, and accurate pollen activity, spring can be welcome and even enjoyable.
For additional information and current pollen and mold counts, visit the Oklahoma Allergy and Asthma Clinic website at http://www.oklahomaallergy.com.
Tips for the Allergic Gardener
From a previously published article by Dr. Warren V. Filley, M.D.(Used by permission)
• Keep lawns short - no more than two inches high to minimize flowering.
• Fertilize bermudagrass lawns regularly through the summer to inhibit flowering.
• Wear a mask to filter airborne allergens when mowing the lawn, raking or working in the garden.
• Don't use power blowers. They aerosolize large amounts of pollen and mold.
• Keep your yard free of weeds, especially nettle, dock, English plantain, pigweed and ragweed.
• See your allergist to determine specific allergen culprits and the best times to avoid them.
• Avoid wind pollinated plants and plant insect pollinated flowers. A basic rule thumb is --- the more colorful the plant, the safer it is.
• Do your gardening when pollen counts are low or the pollens you are allergic to are "out of season."
• After a day in the yard, shower and wash your work clothes.
By Cerry Leffler
OKLAHOMA CLIMATE SPRING 2005 25 OKLAHOMA CLIMATE SPRING 2005 25
Flowers and Groundcovers:• Almost all annual flowers, except Composite
family flowers, such as mums and marigolds.• Bulbs of all types• Most perennial flowers• Ajuga (Ajuga species)• Daylily (Hemerocallis species)• English Ivy (Helix species)• Hosta (Hosta species)• Iris (Iris species and hybrids)• Moneywort (Lysimachia nummularia)• Monkey grass (Liriope species)• Sedum (Sedum species)• Vinca (Vinca species)
Answer Key
Radar echoes and Air Temperature Contours from 17 August 1994
Contrary to what many people believe, the worst plant allergens are grasses, weeds and certain trees, not the beautiful landscape flowers and shrubs.
Here are some common Oklahoma landscape plants known for their non-allergenic properties.
Oklahoma Climatological Survey100 East Boyd, Suite 1210Norman, OK 73019-1012phone 405.325.2541 fax 405.325.2550http://www.ocs.ou.eduemail [email protected]
Black-Eyed Susans. Photo courtesy of Renee McPherson.
Did You Know…By Cerry Leffler
• Allergic rhinitis is characterized by inflammation of the nasal lining and can result in symptoms such as congestion, sneezing, headache, and can contribute to asthma attacks. This is the official diagnosis for those that say they have allergies.
• The condition can be seasonal or chronic and originates from airborne agents such as pollens and mold spores.
• A recent study showed that 25.5 percent of American Indian children and 20 percent of American Indian adults had been diagnosed with asthma. These percentages were higher than any other group.
• Oklahoma has the highest population of American Indians in the nation with 7.9 percent of our total population claiming full heritage.
• A child’s susceptibility to allergies increase to approximately 25 percent if one parent suffers from allergies. If the child has two parents that suffer from the disease, the chances increase to between 75 and 80 percent.
• Although a child may inherit their parent’s susceptibility to allergies, they are not necessarily allergic to the same things.
• A study on the cost of productivity losses associated with allergic rhinitis completed in 1995 stated that the loss due to missed days at work was estimated at $601 million annually.
• In the same study, at-work productivity loss range from $2.4 billion to $4.6 billion.
• You can check the daily pollen and mold report at the Oklahoma Allergy & Asthma Clinic (http://www.oklahomaallergy.com/pollen.htm) before starting your day. This may help you determine your schedule and need for medication.