Oklahoma Rural Elementary Schools: A Descriptive Study Maridyth M. McBee, Ph.D Dae-Young So, M.A. Educational Training, Evaluation, Assessment and Measurement College of Continuing Education University of Oklahoma
Transcript
Oklahoma Rural Elementary Schools: A Descriptive Study Maridyth M. McBee, Ph.D Dae-Young So, M.A.
Educational Training, Evaluation, Assessment and Measurement College of Continuing Education University of Oklahoma
A Descriptive Study of Oklahoma Rural Elementary Schools 2
Table of Contents
Purpose of Study ------------------------------------------------------------------ 4
Procedure and Participants---------------------------------------------------4 Evaluation Questions---------------------------------------------------------4 Data Analysis------------------------------------------------------------------5
Self-Report Survey Results-------------------------------------------------------5 Results of Superintendents---------------------------------------------------5 Results of Teachers-----------------------------------------------------------7 Results of Parents-------------------------------------------------------------9 Results of Students----------------------------------------------------------11 Summary of Questionnaire Survey----------------------------------------13
Case Study Results-----------------------------------------------------------------13
School Environment---------------------------------------------------------14 Superintendent Responses--------------------------------------------------14 Teacher Responses----------------------------------------------------------18 Student Responses----------------------------------------------------------19 Test Score Results-------------------------------------------------------------------20
A Descriptive Study of Oklahoma Rural Elementary Schools 3
List of Tables Table 1. Ethnicity of K-8 Students………………………………………………………5 Table 2. List of Extracurricular Activities……………………………………………….6 Table 3. List of opportunities for Leadership role Experience…………………………..6 Table 4. The frequency of Computer Use………………………………………………..6 Table 5. The frequency of the Curricular Offered by K-8 Schools……………………...7 Table 6. Demographic Data for Class, Teachers, and Superintendents………………….7 Table 7. Teacher’s Evaluation on the Technology Level of Their Schools……………...9 Table 8. Other Characteristics of 9th Students………………………………………….11 Table 9. Frequency of Extracurricular Activity Participation………………………….12 Table 10. Comparison of Homework Assignment………………………………………13 List of Figures Figure 1. Acceptance, Preparedness, Participation Level of K-8 Students………………7 Figure 2. Academic Skill & Motivation Level of K-8 Students………………………….8 Figure 3. Strength & Weakness of K-8 Students…………………………………………8 Figure 4. Parent’s Evaluations on K-8 Students’ Acceptance, Preparedness, & Grade Level…………………………………………………………………..9 Figure 5. Parents’ Evaluation on the Educational Quality of K-8 & K-12 Schools…….10 Error! No table of figures entries found.Figure 6. Parent’s Evaluation on Their Children’s gains & Loss……………………….10 Figure 7. Acceptance & Preparedness of K-8 Students in 9th Grade……………………11 Figure 8. Perceived Academic Ability of K-8 Graduates……………………………….12 Figure 9. Gains & Losses from Attending K-8 Schools (Student Report)……………...12 Figure 10 Percent of Rural Elementary Districts Scoring At or Above the State or National Average on the Iowa Test of Basic Skills (3rd Grade)…20 Figure 11. Percent of Rural Elementary Districts Scoring At or Above the State or National Average on the Iowa Test of Basic Skill (7th Grade)….20 Figure 12. Percent of Rural Elementary Districts Scoring Above State Average Grade 5 Oklahoma Core Curriculum…………………………………………21 Figure 13. Percent of Rural Elementary Districts Scoring Above State Average, Grade 8 Oklahoma Core Curriculum…………………………………………21
A Descriptive Study of Oklahoma Rural Elementary Schools 4
The primary purpose of the present study was to describe the educational experiences of students attending schools in Oklahoma’s Rural Elementary Districts, and to explore how the students who graduate from the Rural Elementary Districts perform at the next level of instruction and beyond. The present study evaluates through self-report survey and case-study interview the educational features of Oklahoma’s Rural Elementary Schools, the satisfaction level of the students and parents with the school experience, and the preparation of the students for attending high schools in another district. Methods Procedure and Participants The data were collected using a mail-back survey method from 9th grade students who graduated from Rural Elementary schools, their parents, teachers, and superintendents in the population of 115 Rural Elementary Districts in Oklahoma. Packets containing a cover letter and four different questionnaires constructed specifically for students, parents, teachers, and superintendents were mailed to the superintendent of each school in the population. The superintendents were asked to distribute the questionnaire to three randomly selected 9th grade students, their parents, and three teachers. The superintendents collected the completed questionnaires from each participant and returned them by mail. Case-interviews following the survey were conducted to collect more in-depth information on the educational experiences of students attending the schools in Rural Elementary Districts. Superintendents, students and teachers from 10 rural elementary schools across state were interviewed and observed. Evaluation Questions Each of the four questionnaires included open-ended questions as well as close-ended questions such as dichotomous (yes or no question), rank order, and Likert Scale questions. The open-ended questions allowed the respondents to report their observations regarding opportunities that K-8 students missed or gained at K-8 schools and skills that they lacked or possessed. Some questions were used repeatedly in each of the student, parent, and teacher questionnaires to investigate the same issue from different perspectives. The major evaluation questions for each questionnaire included: For superintendents: a) grades, b) graduation rates, c) demographic information, d) dropout rate, and e) teacher credentials; For teachers: a) acceptance of K-8 students, b) inclusion rate of all students, c) extra-curricular activities, d) attitude toward K-8 schools, and e) level of participation/leadership f) preparedness of K-8 students; For parents: a) difficulties in transition, b) student attitude, c) interest in school, d) opportunities for participation/leadership, and e) parent involvement; For students: a) perceived preparedness for 9th through 12th grade, b) acceptance at 9-12 level, c) opportunities they missed at K-8, d) opportunities they gained at K-8, and e) plans after graduation f) extra-curricular activities g) level of individual attention.
A Descriptive Study of Oklahoma Rural Elementary Schools 5
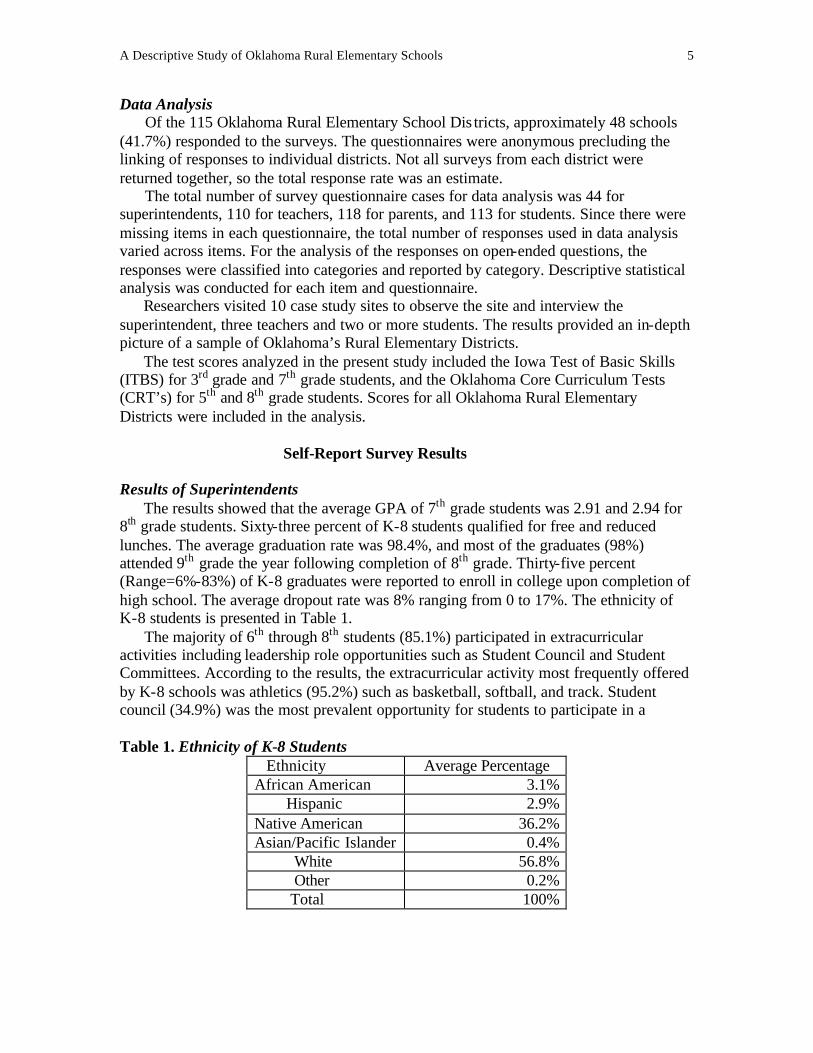
Data Analysis Of the 115 Oklahoma Rural Elementary School Dis tricts, approximately 48 schools (41.7%) responded to the surveys. The questionnaires were anonymous precluding the linking of responses to individual districts. Not all surveys from each district were returned together, so the total response rate was an estimate. The total number of survey questionnaire cases for data analysis was 44 for superintendents, 110 for teachers, 118 for parents, and 113 for students. Since there were missing items in each questionnaire, the total number of responses used in data analysis varied across items. For the analysis of the responses on open-ended questions, the responses were classified into categories and reported by category. Descriptive statistical analysis was conducted for each item and questionnaire. Researchers visited 10 case study sites to observe the site and interview the superintendent, three teachers and two or more students. The results provided an in-depth picture of a sample of Oklahoma’s Rural Elementary Districts. The test scores analyzed in the present study included the Iowa Test of Basic Skills (ITBS) for 3rd grade and 7th grade students, and the Oklahoma Core Curriculum Tests (CRT’s) for 5th and 8th grade students. Scores for all Oklahoma Rural Elementary Districts were included in the analysis. Self-Report Survey Results Results of Superintendents The results showed that the average GPA of 7th grade students was 2.91 and 2.94 for 8th grade students. Sixty-three percent of K-8 students qualified for free and reduced lunches. The average graduation rate was 98.4%, and most of the graduates (98%) attended 9th grade the year following completion of 8th grade. Thirty-five percent (Range=6%-83%) of K-8 graduates were reported to enroll in college upon completion of high school. The average dropout rate was 8% ranging from 0 to 17%. The ethnicity of K-8 students is presented in Table 1. The majority of 6th through 8th students (85.1%) participated in extracurricular activities including leadership role opportunities such as Student Council and Student Committees. According to the results, the extracurricular activity most frequently offered by K-8 schools was athletics (95.2%) such as basketball, softball, and track. Student council (34.9%) was the most prevalent opportunity for students to participate in a Table 1. Ethnicity of K-8 Students
Ethnicity Average Percentage African American 3.1% Hispanic 2.9% Native American 36.2% Asian/Pacific Islander 0.4% White 56.8% Other 0.2% Total 100%
A Descriptive Study of Oklahoma Rural Elementary Schools 6
leadership role in their schools. The lists and frequencies of extracurricular activities and leadership role opportunities are summarized in table 2 and 3. The number of average field trips per each class was 2.93. Most of K-8 students were reported to use a computer every day or at least twice a week at school. The frequency data for computer use are summarized in Table 4. The superintendents (N=43) reported that 99.1% of their teachers were certified in the areas in which they taught. Table 5 summarizes the courses K-8 schools were offering. Ranging from 60.5% to 86%, most schools offered foreign language, art, music, and athletics through 3rd grade to 8th grade. The least frequently offered course was drama (4.6% to 13.9%). Other summary data regarding teachers and staff members are presented in Table 6. Table 2. List of Extracurricular Activities
Categories of Extracurricular Activities
Percentage of Offering Schools (N=42)
Athletics 95.2% Social & Leadership Activities 66.7% Academic Activities 41.8% Art-Related Activities 27.9% Computer-Related Activities 9.5% Foreign Language 2.4%
Table 3. List of Opportunities for Leadership Role Experience
Categories of Opportunities
Percentage of Offering Schools
Student Council 34.9% 4-H Club 32.5% School Committee
13.9%
Cheerleading 13.9% Table 4. The Frequency of Computer Use
Frequency Grades K-2 Grades 3-4 Grades 5-6 Grades 7-8 Every day 14 (37.8%) 19 (45.2%) 25 (58.1%) 24 (64.8%) At least twice/week
15 (40.5%) 14 (33.3%) 12 (27.9%) 8 (21.6%)
At least once/week
8 (21.7%) 8 (19.0%) 5 (11.9%) 4 (10.8%)
At least once/month
0 1 (2.5%) 1 (2.1%) 1 (2.8%)
Total 37 (100%) 42 (100%) 43 (100%) 37 (100%)
A Descriptive Study of Oklahoma Rural Elementary Schools 7
Table 5. The Frequency of the Curricula Offered by K-8 Schools (N=43) Course Grades K-2 Grades 3-4 Grades 5-6 Grades 7-8 Art 33 (76.7%) 35 (81.4%) 36 (83.7%) 30 (69.7%) Music 31 (72.1%) 32 (74.4%) 33 (76.7%) 29 (67.4%) Drama 2 (4.6%) 3 (6.9%) 6 (13.9%) 4 (9.3%) Foreign Language
33 (76.7%) 36 (83.7%) 37 (86.0%) 32 (74.4%)
Intramural Athletics
12 (27.9%) 26 (60.5%) 31 (72.1%) 28 (65.1%)
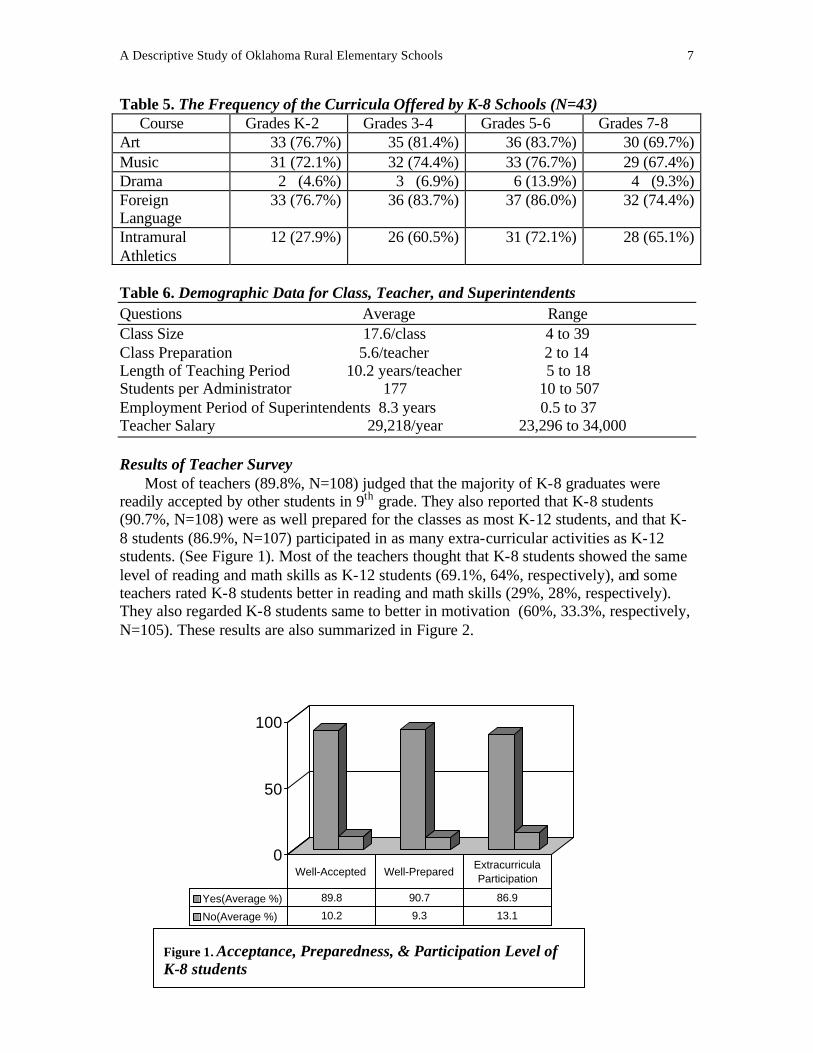
Table 6. Demographic Data for Class, Teacher, and Superintendents Questions Average Range Class Size 17.6/class 4 to 39 Class Preparation 5.6/teacher 2 to 14 Length of Teaching Period 10.2 years/teacher 5 to 18 Students per Administrator 177 10 to 507 Employment Period of Superintendents 8.3 years 0.5 to 37 Teacher Salary 29,218/year 23,296 to 34,000 Results of Teacher Survey Most of teachers (89.8%, N=108) judged that the majority of K-8 graduates were readily accepted by other students in 9th grade. They also reported that K-8 students (90.7%, N=108) were as well prepared for the classes as most K-12 students, and that K-8 students (86.9%, N=107) participated in as many extra-curricular activities as K-12 students. (See Figure 1). Most of the teachers thought that K-8 students showed the same level of reading and math skills as K-12 students (69.1%, 64%, respectively), and some teachers rated K-8 students better in reading and math skills (29%, 28%, respectively). They also regarded K-8 students same to better in motivation (60%, 33.3%, respectively, N=105). These results are also summarized in Figure 2.
Figure 1. Acceptance, Preparedness, & Participation Level of K-8 students
A Descriptive Study of Oklahoma Rural Elementary Schools 8
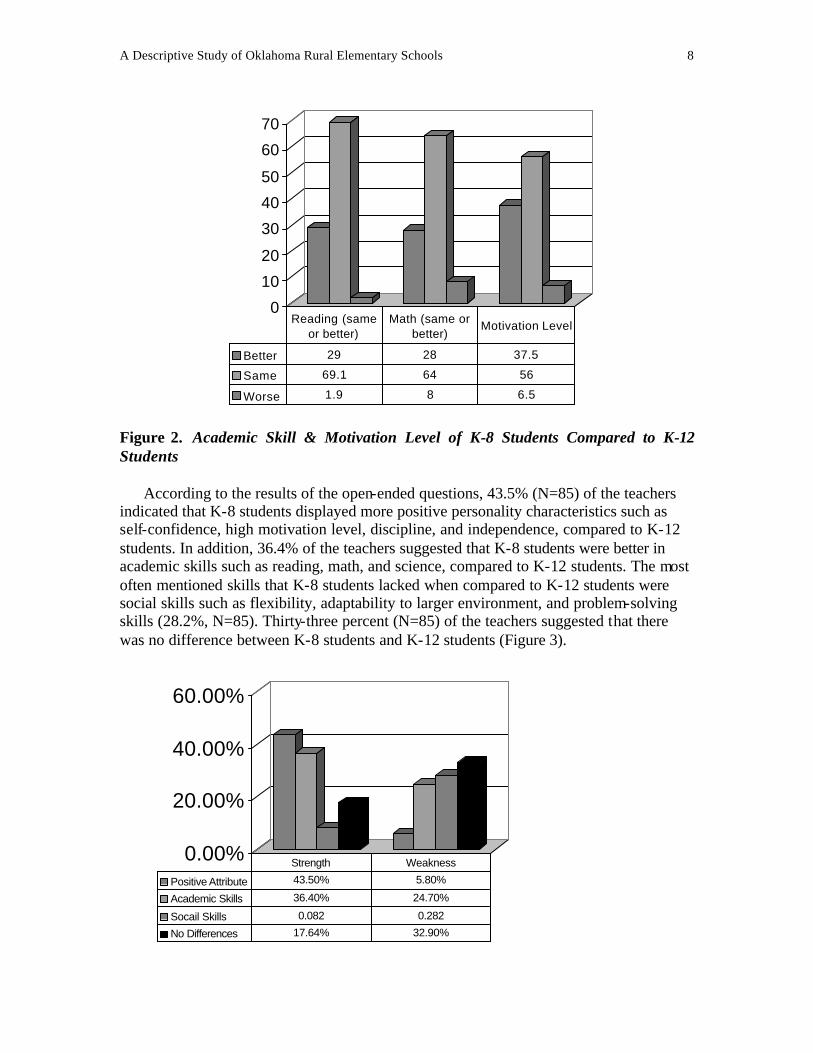
Figure 2. Academic Skill & Motivation Level of K-8 Students Compared to K-12 Students According to the results of the open-ended questions, 43.5% (N=85) of the teachers indicated that K-8 students displayed more positive personality characteristics such as self-confidence, high motivation level, discipline, and independence, compared to K-12 students. In addition, 36.4% of the teachers suggested that K-8 students were better in academic skills such as reading, math, and science, compared to K-12 students. The most often mentioned skills that K-8 students lacked when compared to K-12 students were social skills such as flexibility, adaptability to larger environment, and problem-solving skills (28.2%, N=85). Thirty-three percent (N=85) of the teachers suggested that there was no difference between K-8 students and K-12 students (Figure 3).
0
10
20
30
40
50
60
70
Better 29 28 37.5
Same 69.1 64 56
Worse 1.9 8 6.5
Reading (same or better)
Math (same or better)
Motivation Level
0.00%
20.00%
40.00%
60.00%
Positive Attribute 43.50% 5.80%
Academic Skills 36.40% 24.70%
Socail Skills 0.082 0.282
No Differences 17.64% 32.90%
Strength Weakness
A Descriptive Study of Oklahoma Rural Elementary Schools 9
Figure 3. Strengths & Weakness of K-8 Graduate Table 7. Teachers’ Evaluation on the Technology Level of Their Schools Categories Average Percentage (# Responses) Poor 2.0% (2) Fair 13.3% (14) Average 42.8% (45) Very Good 29.5% (31) Excellent 12.4% (13) Total 100% (105) The graduation rate of K-8 students from high school was 93.29%. The dropout rate of K-8 graduates was 2.4% compared to 4.8% of K-12 students. According to teachers, K-8 graduates had the same technology level as K-12 students (90.7%, N=107) and required the same or less personal attention than K-12 students (84.1%, N=107). The technology level reported by the teachers is presented in table 7. Parent involvement of K-8 graduates did not differ from the one of K-12 students. Ninety-three percent (N=107) of the teachers reported that parents of K-8 students were involved in school functions as much as or more than parents of K-12 students. Overall, the teachers reported that K-8 students were the same as or better than K-12 students in several areas such as academic skills, positive behavioral characteristics, and motivation level, even though K-8 students were considered to lack social skills necessary to adjust to the new and larger environment. Results of Parents Most parents (92.2%, N=116) of K-8 students did not consider that their child had a difficult time at his/her new school. Moreover, 78.9% of the parents (N=109) reported that their child had more interest in school this year compared to last year.
Figure 4. Parents’ Evaluations on Their Children’s Acceptance, Preparedness, & Grade
0
20
40
60
80
100
Yes (Average %) 92.2 96.2 93.9
No (Average %) 7.8 3.8 6.1
Well-AdjustedWell-
PreparedGrade (same
or better)
A Descriptive Study of Oklahoma Rural Elementary Schools 10
More than 96.2% of parents (N=109) regarded their students adequately or exceptionally prepared for the 9th grade. In addition, 93.9% (N=117) of parents answered that their child’s grades were same or better compared to the previous year. Figure 4 summarizes parents’ evaluations of their children’s acceptance, preparedness, and grade level. Eighty-three percent (N=118) of parents answered that they often or always attended school functions (38.9%, 47.4% respectively). Almost all (N=116) of parents described the quality of K-8 schools good or excellent, while 82.6% of the parents described K-12 schools as good or excellent. (See Figure 5). The results of open-ended questions were similar to those of the teacher survey. Parents thought that K-8 students experienced more positive emotional experiences and closeness (57.5%, N=106) at K-8 schools, and gained desirable behavioral characteristics such as respectfulness, discipline, and self-confidence (34.9%). Although 62.3% of parents regarded that their children had not missed anything at K-8 schools, 23.6% suggested that their child had missed opportunities to take part in various extracurricular activities and sports programs. (See Figure 6).
Figure 5. Parents’ Evaluation on the Educational Quality of K-8 & K-12 Schools Figure 6. Parents’ Evaluation on Their Children’s Gains & Losses from K-8 Schools
0
20
40
60
80
100
K-8 Schools 0 1.7 98.2
K-12 Schools 0 17.4 82.6
Poor (Average %) Fair (Average %) Good to Excellent
(Average %)
0
20
40
60
Gains 57.5 34.9 17.9 14.1
Closeness
Positive
Academic
Social Skills 0
10
20
30
40
50
60
70
Losses 62.3 23.6 6.6 1.9 2.8 3.8
Nothing
Various
Social
Academ
Technol
Others
A Descriptive Study of Oklahoma Rural Elementary Schools 11
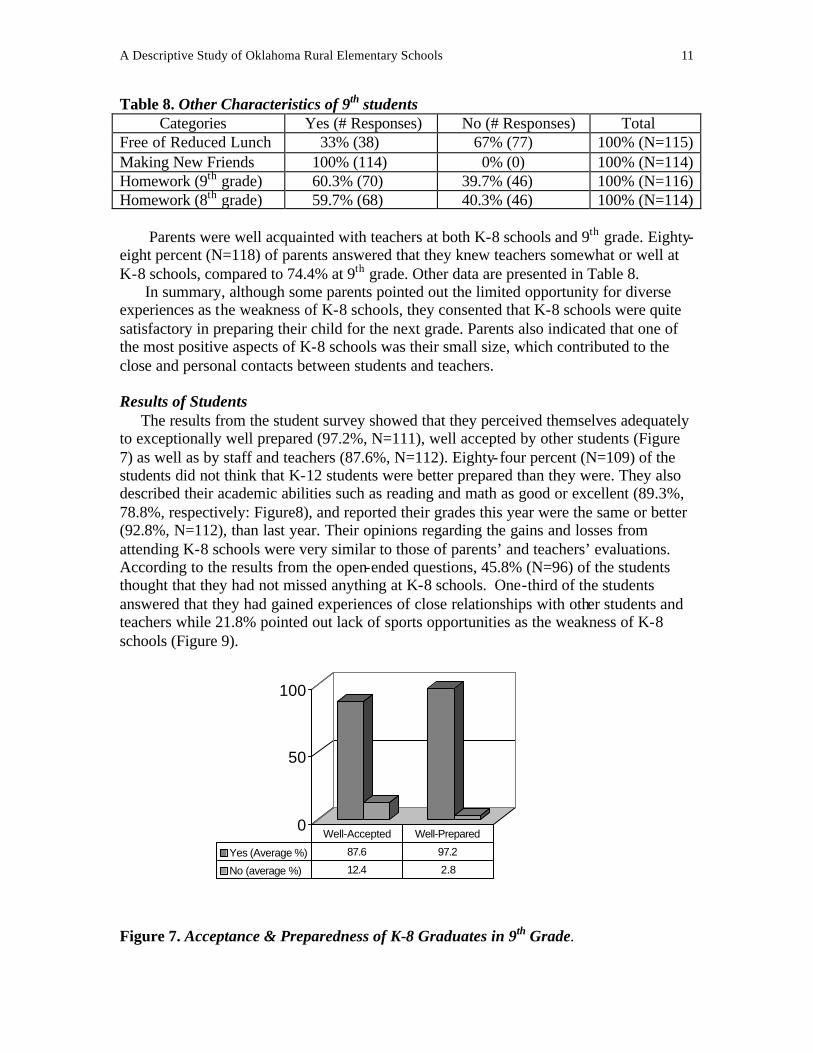
Table 8. Other Characteristics of 9th students Categories Yes (# Responses) No (# Responses) Total Free of Reduced Lunch 33% (38) 67% (77) 100% (N=115) Making New Friends 100% (114) 0% (0) 100% (N=114) Homework (9th grade) 60.3% (70) 39.7% (46) 100% (N=116) Homework (8th grade) 59.7% (68) 40.3% (46) 100% (N=114) Parents were well acquainted with teachers at both K-8 schools and 9th grade. Eighty-eight percent (N=118) of parents answered that they knew teachers somewhat or well at K-8 schools, compared to 74.4% at 9th grade. Other data are presented in Table 8. In summary, although some parents pointed out the limited opportunity for diverse experiences as the weakness of K-8 schools, they consented that K-8 schools were quite satisfactory in preparing their child for the next grade. Parents also indicated that one of the most positive aspects of K-8 schools was their small size, which contributed to the close and personal contacts between students and teachers. Results of Students The results from the student survey showed that they perceived themselves adequately to exceptionally well prepared (97.2%, N=111), well accepted by other students (Figure 7) as well as by staff and teachers (87.6%, N=112). Eighty-four percent (N=109) of the students did not think that K-12 students were better prepared than they were. They also described their academic abilities such as reading and math as good or excellent (89.3%, 78.8%, respectively: Figure8), and reported their grades this year were the same or better (92.8%, N=112), than last year. Their opinions regarding the gains and losses from attending K-8 schools were very similar to those of parents’ and teachers’ evaluations. According to the results from the open-ended questions, 45.8% (N=96) of the students thought that they had not missed anything at K-8 schools. One-third of the students answered that they had gained experiences of close relationships with other students and teachers while 21.8% pointed out lack of sports opportunities as the weakness of K-8 schools (Figure 9).
Figure 7. Acceptance & Preparedness of K-8 Graduates in 9th Grade.
0
50
100
Yes (Average %) 87.6 97.2
No (average %) 12.4 2.8
Well-Accepted Well-Prepared
A Descriptive Study of Oklahoma Rural Elementary Schools 12
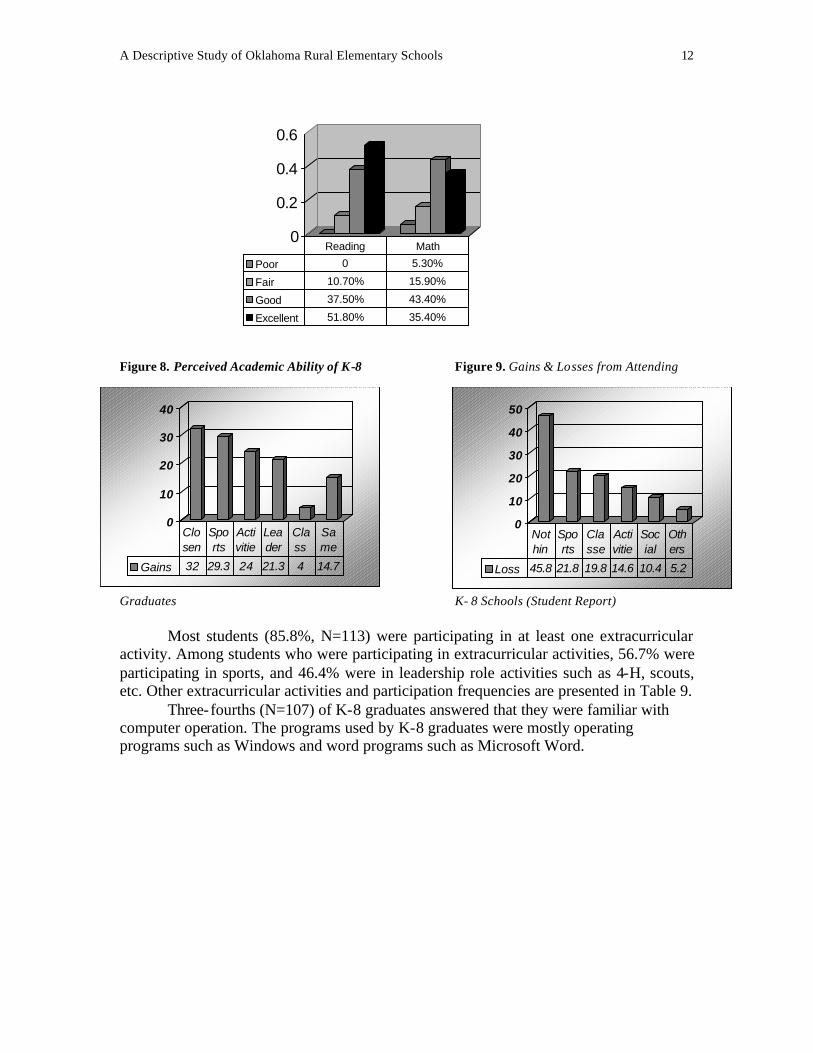
Figure 8. Perceived Academic Ability of K-8 Figure 9. Gains & Losses from Attending
Graduates K- 8 Schools (Student Report) Most students (85.8%, N=113) were participating in at least one extracurricular activity. Among students who were participating in extracurricular activities, 56.7% were participating in sports, and 46.4% were in leadership role activities such as 4-H, scouts, etc. Other extracurricular activities and participation frequencies are presented in Table 9.
Three-fourths (N=107) of K-8 graduates answered that they were familiar with computer operation. The programs used by K-8 graduates were mostly operating programs such as Windows and word programs such as Microsoft Word.
0
0.2
0.4
0.6
Poor 0 5.30%
Fair 10.70% 15.90%
Good 37.50% 43.40%
Excellent 51.80% 35.40%
Reading Math
0
10
20
30
40
Gains 32 29.3 24 21.3 4 14.7
Closen
Sports
Activitie
Leader
Class
Same
0
10
20
30
40
50
Loss 45.8 21.8 19.8 14.6 10.4 5.2
Nothin
Sports
Classe
Activitie
Social
Others
A Descriptive Study of Oklahoma Rural Elementary Schools 13
Art Activities (Music, Drama, etc) 9.2% (9) Percentage of Participation 85.8% (97-118) Table 10. Comparison of Homework Assignment Time Spent for Homework 8th Grade at K-8 9th Grade at High Schools < 1 hour each night 65.4% 65.7% 1-2 hours each night 30.8% 28.6% 2 or more hours each night 3.7% 5.7% Total 100% 100% Eighty-four percent (N=108) were given an orientation to familiarize them with the high school before they started the 9th grade. One-third of K-8 graduates felt that teachers demanded more from them in the 9th grade, compared to 8th grade, while 37.5% felt it was the same. Almost all (N=112) of K-8 graduates reported that they made new friends at the new schools. K-8 and K-12 students did not differ in the amount of homework completed. Two-thirds of K-8 graduates spent less than one hour doing homework (Table 10). Most students (90.8%, N=109) were planning to attend college or university after graduation while only 2.7% of the students decided to work after graduation. Overall, the results showed that students were highly satisfied with the quality of K-8 schools. In addition, parallel to the results from the parent survey and the teacher survey, they regarded closeness due to small size as the most positive aspect of K-8 schools. Summary of Questionnaire Survey The results from the questionnaire surveys revealed that K-8 schools were satisfactory to student and parents, the actual consumers of K-8 schools. Teachers of the 9th grade verified that K-8 graduates were well prepared and accepted in the new school settings, and that they showed the same or better level of academic achievement. Most K-8 graduates and their parents emphasized as positive the fact that K-8 schools were able to offer opportunities to experience close relationships and positive emotional exchange between peers as well as with teachers. Though students and parents were less satisfied with the limited opportunities for various activities, they appeared to value the positive aspects more than regret the negative aspects of K-8 schools. In the following two sections, the case-study interview data and test scores are analyzed. These two sets of data provide more in-depth information regarding the educational experiences of K-8 students and objective measures to validate the self-report data measured via questionnaire survey.
A Descriptive Study of Oklahoma Rural Elementary Schools 14
Case Study Interview Results To provide an in-depth look at a sample of Elementary Rural Schools, site visits were conducted in ten school districts. The district sites were located in each of the four quadrants across the state. During the visits, the researchers conducted interviews with the superintendents, three or more teachers, and three or more students. The interviewer’s guide is found in the Appendix. The results of the case study interviews are described below. School Environment The school structures ranged from metal buildings to relatively new permanent structures. Most of the buildings were at least 50 years old. A number of schools had expanded space, but in all cases, the old and the new blended nicely. At one site the administration building was a house structure than had been purchased for less than $10,000 and moved to the campus. Most of the buildings and surrounding grounds were well kept. About half of the sites included an athletic field or gym. A number of sites contain playground equipment as well. The interiors of the school buildings were found to be typically clean and neat. Most halls were decorated with student work. One site had a spacious cafeteria containing objects of interest such as a 1957 Chevy in the wall, a jukebox, and booths for the students of month. Another site displayed photographs depicting history of the school and the significance of the school to the community. Yet another site showcased a shell collection next to student art. Classrooms were usually organized with desks in rows facing the front of the classroom. There were some larger, open-area rooms. One site emphasized psychomotor activities. Classrooms at that site contained large areas filled with interactive equipment and activity materials, slogans, and posters. Computers were in the majority of the classrooms. Computer labs were common as well. A frequent observation across all sites was students hugging teachers and staffs in greeting. There appeared to be close relationships between the adults and the students. Interactions were observed to be conducted with mutual respect as students moved from room to another room or to the playground. Superintendent Responses Educational Opportunities for Students When asked what educational opportunities were available to students at their school, the superintendents responded with a strong focus on the state’s core curriculum. Pre-school programs were common. Other content areas emphasized frequently were:
• Art • Drama • Special Education • Gifted/Talented • Physical Education • Band • Alternative Classes for Students Struggling in the Traditional Environment
A Descriptive Study of Oklahoma Rural Elementary Schools 15
• Field Trips • Technology • Tutoring
At one site, teachers made every effort to match instruction to student’s learning style. Teaching techniques were adapted to reach all students. It was determined that many of the Native American Students served learned best through a psycho-motor program that reinforced language concepts through visual and auditory cues as well as body movement. Bilingual and bicultural teaching concepts are used as well. For example, young students learn to say numbers, colors, and letters of alphabet in both Cherokee and English so that all students have the opportunity to be successful regardless of their first language. Another site used a role-up and role-back approach to instruction in mathematics and reading. All students were tested in reading and mathematics achievement. If students were performing at the next grade level higher, they joined next grade class for reading or mathematics. Likewise, if students were performing one grade level below in reading and mathematics, they went to the grade below for instruction. Students more than one year behind attended a laboratory class for reading or mathematics instruction. This same site also used a cognitive behavioral discipline plan. Stoplights in every classroom and on the playground let students know the expectations for their behavior. Green light meant that students could talk and move around. Yellow light meant talking must be in a low voice. Red light meant no talking. The discipline plan also included a thinking area and a time out area. The thinking area was a quiet spot with activities designed to let students get in touch with feelings and plan appropriate behaviors. The time-out area was designated as a consequence if thinking area did not accomplish the behavioral goal. This plan along with a licensed psychologist on site at least two days per week allowed the school to mainstream in the regular classroom 74 special education students, 20 of whom were severely emotionally disturbed. Another site began a “looping” system where students remained with the same teacher for two consecutive years. This allowed teachers to build and maintain relationships with students over an extended period of time. Most interviewed stressed the importance in their school of providing each student with the educational program that was best for the individual. The teachers and administrators looked for strengths in each student to nurture and sought to help each student overcome his or her weaknesses. One superintendent emphasized that the school was not merely preparing students to succeed in high school but to succeed in college. Student Mobility Almost all the sites interviewed stated that mobility of students was little to none. Most students began in the kindergarten or pre-kindergarten grades and stayed at the K-8 site throughout their elementary careers. In sites where students did leave, the most common reason for the move was family finances. One site indicated that if students in the upper grades needed a particular extracurricular activity not available at their school, the student was encouraged to transfer out. This recommendation was rarely made, but the superintendent emphasized that the needs of the individual student were the impetus for all educational decisions. Many sites did state that students frequently transferred into
A Descriptive Study of Oklahoma Rural Elementary Schools 16
the district. One site indicated that there was a waiting list of 60-70 students who wanted to transfer to their school. Extracurricular Activities The superintendents listed a number of extra-curricular activities available to students in their schools. The most frequently given were:
• Athletics (basketball, baseball, and softball) • Academic Bowls • 4H • Music (Band or Choir) • Scouting • Student Council
Each site also described activities that were unique to them. One site provided an opportunity for students to learn character education through working with horses. The students were given opportunities to care for and ride the horses as part of the experience. The teacher emphasized that horses react based on the way they are treated. This opportunity was stated to be especially helpful to students from abusive homes to learn better ways to relate to people. Multi-handicapped students also benefited from the experience. Another site serving predominantly Native American students offered a Heritage Club to enable students to learn about Native American culture. Students elected a chief and vice-chief. Talent shows and cultural awareness days were organized through the club. A Buddy system was established at two other sites to provide opportunities for students to practice being role models. Second graders were paired with kindergarten students and eighth graders were paired with fifth and sixth graders. The “Buddies” attended field trips together, and worked together at school. The pairing of students was stated to help foster a sense of belonging to all the students in the school. The superintendents indicated that most of the upper grade students participated in extra-curricular activities. In two sites, it was estimated that half of the students choose at least one extra-curricular activity. In another site, all seventh and eighth grade students participated in either a sport or a music activity. One superintendent pointed out that even though the school did not offer as wide a range of activities available at some larger schools, a higher percent of their students were able to participate in the activities that were offered. Most superintendents emphasized that all students were allowed to play on the sport team or participate in the activities regardless of talent and ability. This approach allowed students to develop their talents and abilities in areas where their talent might not be readily apparent in the early grades. Student Experiences at the School The superintendents were asked to describe the educational experiences of their brightest, average, and struggling students. The typical bright student was depicted as a leader in the classroom. They excelled academically and took advantage of accelerated curriculum and projects. Most were involved in extra-curricular activities, though not necessarily athletics. They developed very good social skills and enjoyed positive relationships with peers and teachers. Some superintendents stated that the positive
A Descriptive Study of Oklahoma Rural Elementary Schools 17
experiences of the brightest students came in part from the individual attention given to fostering their success. One student was described as a low-income, introverted child who may have gone unnoticed in a larger setting. He was nurtured to become academically successful and eventually became the Academic Bowl state champion. He is now very successful both academically and socially in high school. Another bright first grader was bored in class. The superintendent worked with the student in advances reading. Administrator, teachers, and/or librarians at each site typically helped to provide challenging projects for the bright students. Superintendents frequently mentioned their goal of providing an academic program that fostered optimal growth for all students regardless of ability. A number of the superintendents objected to the characterization of any of their student as “average.” They emphasized that they had high expectations for all students and that all students were provided a challenging academic program. However, the typical student was described as active in the classroom, involved in extra-curricular activities, and enjoying good relationships with the teachers as well as their classmates. The superintendents were frequently quite emphatic that struggling students were not allowed to struggle alone. No one was allowed to become the “invisible” student. One superintendent stated that the teachers were required to have a passion for assisting students. Individual attention and tutoring were offered at all sites. A number of other programs were in place to assist students as well. Examples included computer labs, one-hour daily study hall where individual attention was available, alternative education programs, peer tutoring, and counseling. Inclusion was most commonly practiced with special education students. Parent/Community Involvement Parent involvement varied across the sites. Some sites expressed having extensive parental involvement. One superintendent states that the school had 4-5 parent volunteers daily and had many more willing to help if asked. Another site described parents as active in the daycare, community classes held at the school and athletics. In this site, parents are included on the committees that recommended the hiring of teachers and other school staff. Typically, the sites had active parent-teacher organization that assisted with fund raising, assisting with field trips, and special events at the school. A number of the sites described making the effort to let all parents know that they are welcome at school. Sights with less extensive parental involvement indicated serving low socio-economic level students whose parents are limited in resources, or the large number of transfer students to the school which made the distance from home quite far. Community involvement was described as more limited. In some case the parents were the community. Most of the sites did not have a Chamber of Commerce or an active community outside of the school. The closest town was sometimes quite a distance away. One site did describe strong support from the area merchants for such things as buying books for the reading program and donations to projects. Another site stated that the local fire department was very active in helping school. At another site, the superintendent stated that community assistance was limited to one fundraiser per year for Christmas gifts for the students. The reasoning for not asking for more resources was that the community as a whole was disadvantaged and the school did not wish to be burden. However, the school was a resource to the community. The community was invited to use
A Descriptive Study of Oklahoma Rural Elementary Schools 18
the fitness room and swimming pool. In addition, classes were offered to the community on topics such as quilting, GED preparation, and literacy. Special Projects and Grants The superintendents named a number of resources obtained from grants and federal programs. Most obtain funds from the federal Title programs, Safe and Drug-Free Schools, and Impact Aid. Several of the sites received technology grant funds. One site had received Comprehensive School Reform Funds. Another received a 21st Century grant, Even Start funds and an Oklahoma Small school grant. Yet another received two IDEA grants. Student Experiences After Leaving the School The superintendents universally described their students as going to high school after graduating from their rural elementary school. All stated that the students thought that they were well prepared academically. A number of the superintendents said that the students found high school to be less challenging than their elementary program. However, some mentioned that students sometimes took up to a year to become socially adjusted. Several superintendents did state that students told them that they missed the close “family- like” relationships they experienced at the elementary school. After high school, students were described as attending college, attending vocational-technical schools, or entering the workforce. Graduates were teachers, business owners, pharmacists, CPA’s, doctors, attorneys, engineers, nurses, sheriffs, college instructors, state senators, and missionaries. A noteworthy graduate of a rural elementary school, Stuart Roosa, became a command module pilot for Apollo 14. Teacher Responses Two to three teachers were interviewed at each case study site. Each teacher was asked to describe what it was like to teach at his or her school. All teachers interviewed were positive about their school. For example, one teacher stated that she “Would rather teach here than anywhere else. There are a unique bunch of teachers here that really care about the students.” Frequent comments included:
• There is a good teaching environment here. • The administrative support is good. • We have the materials that we need. • There is a lack of “red tape” to accomplish what needs to be done. • We have good community support • Our kids are the best in the country • We have a close knit group with which to work • There is not a lot of teacher turnover here • There is good parental involvement • We have freedom in how we teach the objectives • Having taught in a large school, I would rather never go back • There is a family atmosphere here, including a good bond between the students,
teachers, and administration • At this school you get to know the kids and their parents • The class size is small
A Descriptive Study of Oklahoma Rural Elementary Schools 19
• Students get lots of one-on-one attention • There is less professional envy here than in larger schools. • At this school, students come first.
One teacher summed up the typical comments with these words, “It is like one big family. I know my students as individuals beyond just a teacher/student relationship. A lot of the students come back to visit on a regular basis because of the friendship that develop. We watch these kids grow up and we don’t just have them a couple of years. I have known a lot of these kids for many years.” When asked what they were teaching this week, teachers responded with a variety of academic subjects. Examples included:
• English grammar and punctuation • Spelling • Pronouns and antecedents • Reading comprehension • Two digit multiplication and place value • Spanish sentence writing, weather terms, and days of the week • Oklahoma during the Civil War • Presidents Lincoln and Washington • The five senses in science • The circulatory system including frog dissection • Mythology • Astronomy • Algebraic variables • Fractions • Revolutionary war • Cherokee • Seven Habits of Highly Successful Teens • Music • Painting • Alternative education such as daily functional life skills
The typical day for students began with breakfast. Frequently an early class, study time or an elective was offered before school. The days were filled with academics and elective classes. Several sites separated boys from the girls for some academic subjects. Teachers supported this class structure as an optimal way for both boys and girls to learn. Student Response At least two students were interviewed at each case site. Each student was asked what it was like to go to his or her school. A typical answer was “It is fun. You never know what the teachers are going to have you do. It is interesting and educational. I have good relationships with all students. The roll up program challenges our minds. I do not want to leave.” Another students responded with “I used to live in California and went to a bigger school. Here you get more one-on-one time with the teachers. They all help you after school or anytime. I like school here.” Another student responded with “It is different here. We have more classes. There are eight classes in 45-minute periods and
A Descriptive Study of Oklahoma Rural Elementary Schools 20
not as many students in the classrooms. We also have close relationships with the teachers and all the students know each other. There is not anyone in the 8th grade I do not know. Most of us have been together since kindergarten and the basketball team has been playing together since 4th grade. We are in first place. On the negative side, there is not enough sports and we only have French as a foreign language.” The most common response included the elements listed below:
• It is fun. • We have a lot to do here. • We have good teachers. • Our classes are smaller than the bigger schools. • We get individual attention when we need it. • More is taught here than at a larger school.
Students were asked what they were learning this week. The students described a variety of academic and other content areas. Two examples typify the responses. Student One: In physical science, we are learning chemistry and periodic tables. In Civics, we are learning how the government works and the Constitution. In English, we are learning antonyms, synonyms, and doing college preparation work by researching colleges in the country and learning what a college degree means. In gym, we are playing basketball. In Math, we are learning algebra and proportions. Student Two: In Social Studies, we are learning about the Revolutionary War and George Washington crossing the Delaware. In Math, we are learning percents. In reading, we are doing biographical reports. In science, we are reading maps. In gym, we are playing dodgeball. Most of the students interviewed participated in at least one extra-curricular activity. All of the students indicated plans to attend area high schools following graduation from their elementary school. They all planned to attend college following high school. Some had selected colleges, but most were leaving that decision for the future. Test Score Results The performance of all Oklahoma rural elementary schools on the state required norm-referenced test and criterion-referenced achievement test was examined to determine how well students learned the academic subjects. The test used were the Iowa Tests of Basic Skills (ITBS) for students in Grades 3 and 7, and the Oklahoma Core Curriculum Tests (CRT’s) for students in Grades 5 and 8. The results indicated that across all of the Rural Elementary Districts in Oklahoma, less than half the districts (46.1%) had average ITBS Composite scores above the state average in Grade 3 and more than half of the districts (52.8%) had average ITBS Composite scores above the state average in Grade 7. Almost all the districts had average ITBS Composite scores at Grades 3 and 7 above the national average, 82.4% and 79.8% respectively.
82.4
46.1
0
20
40
60
80
100
NationalAverage
StateAverage
A Descriptive Study of Oklahoma Rural Elementary Schools 21
Figure 10. Percent of Rural Elementary Districts Scoring At or Above the State or National Average on the Iowa Test of Basic Skills (3rd Grade)
Figure 11. Percent of Rural Elementary Districts Scoring At or Above the State or National Average on the Iowa Test of Basic Skills (7th Grade)
79.8
52.8
0
20
40
60
80
NationalAverage
State Average
58.2
38.9
51.6 50.5
43.2 42.1
0
10
20
30
40
50
60
Writing Reading Math Science History Geography
A Descriptive Study of Oklahoma Rural Elementary Schools 22
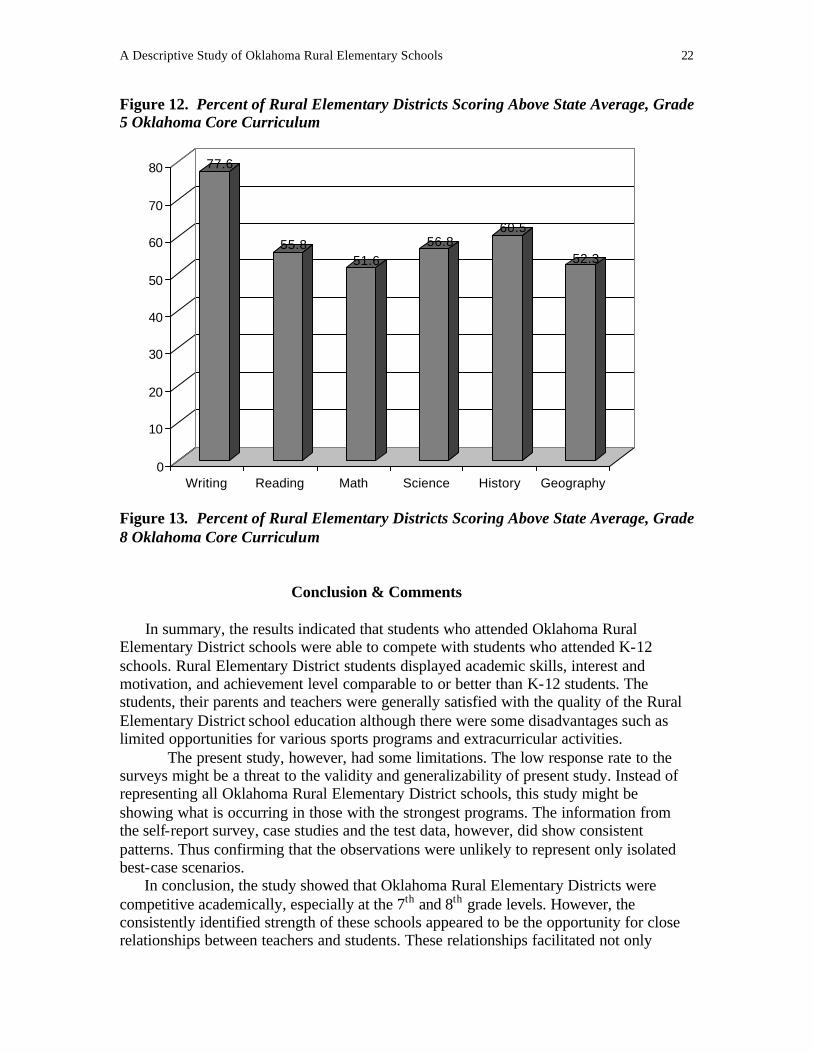
Figure 12. Percent of Rural Elementary Districts Scoring Above State Average, Grade 5 Oklahoma Core Curriculum
Figure 13. Percent of Rural Elementary Districts Scoring Above State Average, Grade 8 Oklahoma Core Curriculum Conclusion & Comments In summary, the results indicated that students who attended Oklahoma Rural Elementary District schools were able to compete with students who attended K-12 schools. Rural Elementary District students displayed academic skills, interest and motivation, and achievement level comparable to or better than K-12 students. The students, their parents and teachers were generally satisfied with the quality of the Rural Elementary District school education although there were some disadvantages such as limited opportunities for various sports programs and extracurricular activities.
The present study, however, had some limitations. The low response rate to the surveys might be a threat to the validity and generalizability of present study. Instead of representing all Oklahoma Rural Elementary District schools, this study might be showing what is occurring in those with the strongest programs. The information from the self-report survey, case studies and the test data, however, did show consistent patterns. Thus confirming that the observations were unlikely to represent only isolated best-case scenarios. In conclusion, the study showed that Oklahoma Rural Elementary Districts were competitive academically, especially at the 7th and 8th grade levels. However, the consistently identified strength of these schools appeared to be the opportunity for close relationships between teachers and students. These relationships facilitated not only
77.6
55.851.6
56.860.5
52.3
0
10
20
30
40
50
60
70
80
Writing Reading Math Science History Geography
A Descriptive Study of Oklahoma Rural Elementary Schools 23
academic learning, but also helped students acquire the personal character skills needed to become productive citizens.
A Descriptive Study of Oklahoma Rural Elementary Schools 24
Appendix: Survey Questionnaires
A Descriptive Study of Oklahoma Rural Elementary Schools 25
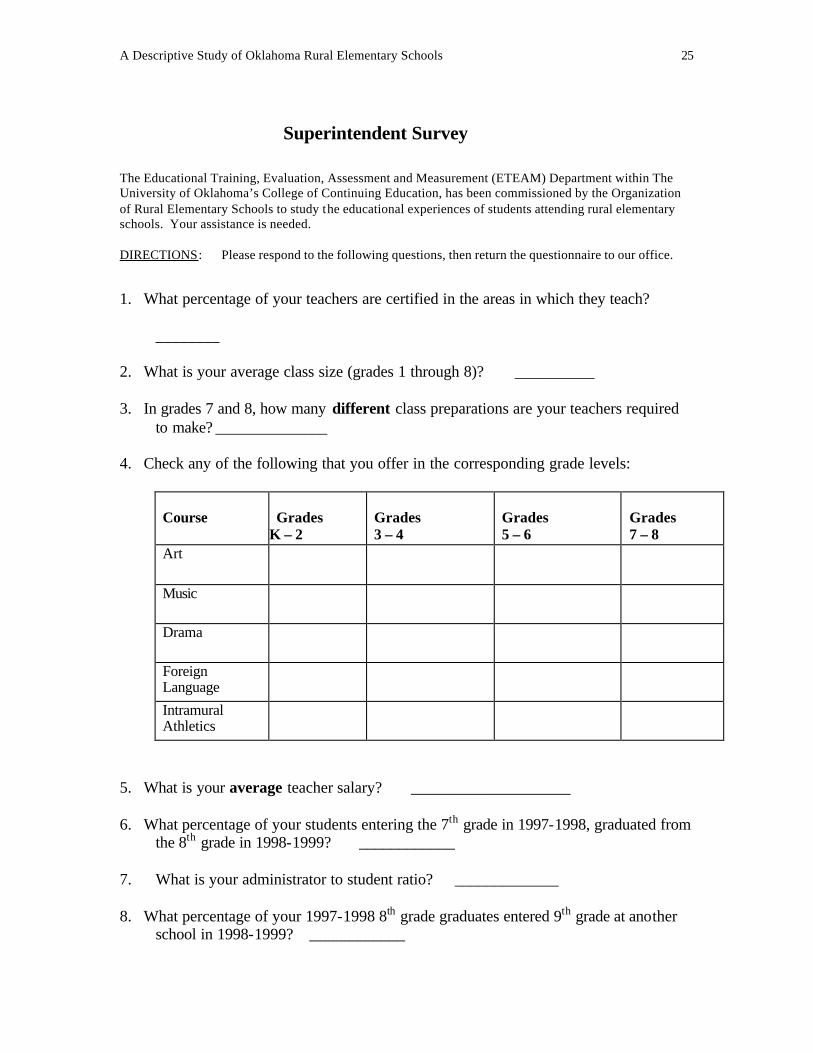
Superintendent Survey
The Educational Training, Evaluation, Assessment and Measurement (ETEAM) Department within The University of Oklahoma’s College of Continuing Education, has been commissioned by the Organization of Rural Elementary Schools to study the educational experiences of students attending rural elementary schools. Your assistance is needed. DIRECTIONS: Please respond to the following questions, then return the questionnaire to our office.
1. What percentage of your teachers are certified in the areas in which they teach?
________
2. What is your average class size (grades 1 through 8)? __________
3. In grades 7 and 8, how many different class preparations are your teachers required to make? ______________
4. Check any of the following that you offer in the corresponding grade levels:
Course
Grades
K – 2
Grades 3 – 4
Grades 5 – 6
Grades 7 – 8
Art
Music
Drama
Foreign Language
Intramural Athletics
5. What is your average teacher salary? ____________________
6. What percentage of your students entering the 7th grade in 1997-1998, graduated from the 8th grade in 1998-1999? ____________
7. What is your administrator to student ratio? _____________ 8. What percentage of your 1997-1998 8th grade graduates entered 9th grade at another
school in 1998-1999? ____________
A Descriptive Study of Oklahoma Rural Elementary Schools 26
9. What percentage of your students qualify for free and reduced lunches?____________
10. List opportunities for students to participate in leadership roles in your school:
12. What is the average length of time teachers have taught in your system?
_____________
13. What percentages of your students are of the following racial categories?
Black/African American _________
Hispanic _________
Native American _________
Asian/Pacific Islander _________
White _________
Other _________
14. What percentage of your students in grades 6 through 8 has transferred in from another school? ____________
15. On the average, how many field trips does each class take per year?
_____________
16. How many serious incidents involving the safety of students have occurred at your school during the last two years (incidents like students bringing weapons to school, outsiders threatening students or school personnel, etc.)? ____________
17. What is the average GPA of your:
7th grade students _______________
8th grade students _______________
A Descriptive Study of Oklahoma Rural Elementary Schools 27
18. How would you describe your school facility?
________ 40 years or older
________ 31-40 years old
________ 21-30 years old
________ 10-20 years old
________ Less than 10 years old
19. How would you describe your library/media center?
________ Inadequate
________ Adequate
________ Excellent
20. List all outside grants your school currently receives:
21. How would you rate your community/parental support?
________ Poor
________ Fair
________ Average
________ Very good
________ Excellent
22. What percentage of your 6th through 8th grade students participate in extracurricular activities? ____________
23. What percentage of your 1998-1999 students enrolled in August, and remained until
the last day of school? ____________
A Descriptive Study of Oklahoma Rural Elementary Schools 28
24. Which category best describes how frequently your students at each grade level use computers at school?
Frequency
Grades
K – 2
Grades 3 – 4
Grades 5 – 6
Grades 7 – 8
Every day
At least twice a week
At least once a week
At least once a month
Less than once a month
Our students do not use computers at school
25. How long have you been superintendent of this school? __________________
26. How many of your students have gone on to be Valedictorian or Salutatorian in neighboring high schools? _____________
27. Has your school received any state or national honors? ÿ Yes ÿ No Which
ones?
______________
28. During the past five years, what percentage of your 8th grade graduates has enrolled in college upon completion of high school? ___________
A Descriptive Study of Oklahoma Rural Elementary Schools 29
29. As superintendent, which of these jobs do you als o fill?
ÿ Principal
ÿ Athletic Director
ÿ Business Manager
ÿ Federal Program Director
ÿ Transportation Director
ÿ Curriculum Director
ÿ Counselor
ÿ Testing Coordinator
ÿ Technology Director
ÿ Special Education Director
ÿ Librarian
ÿ Maintenance Director
ÿ Grant Writer
ÿ Bus Driver
ÿ Other
A Descriptive Study of Oklahoma Rural Elementary Schools 30
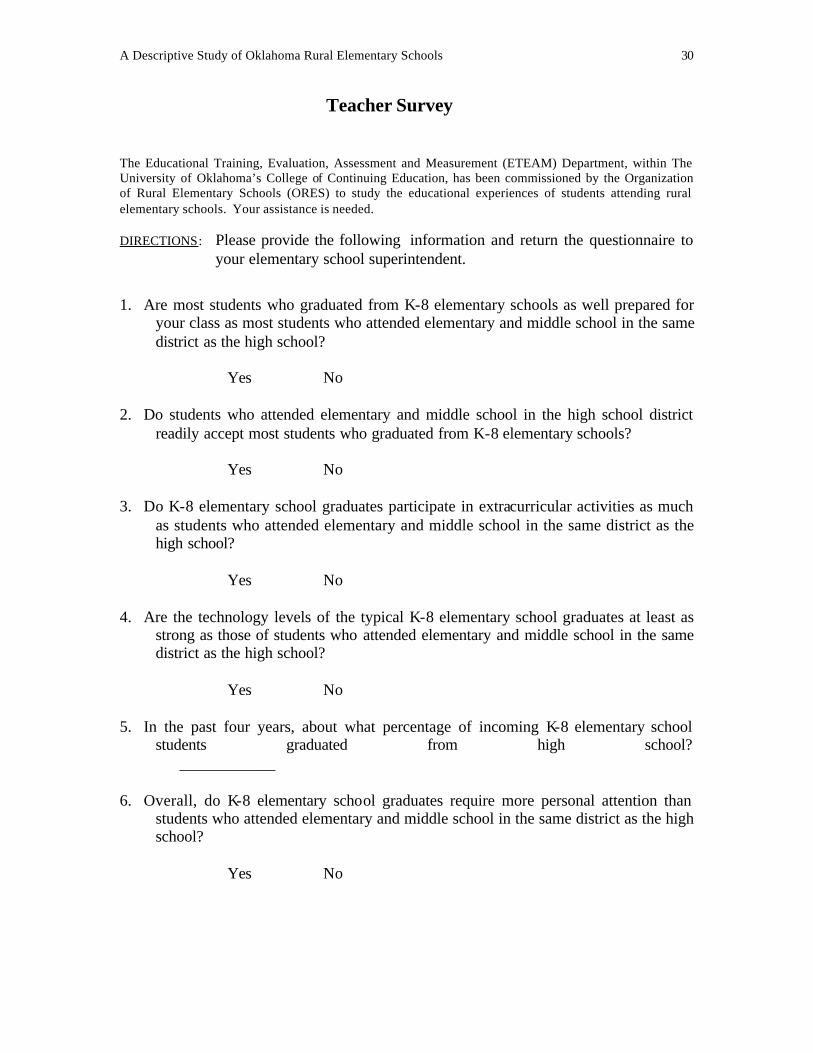
Teacher Survey
The Educational Training, Evaluation, Assessment and Measurement (ETEAM) Department, within The University of Oklahoma’s College of Continuing Education, has been commissioned by the Organization of Rural Elementary Schools (ORES) to study the educational experiences of students attending rural elementary schools. Your assistance is needed. DIRECTIONS: Please provide the following information and return the questionnaire to
your elementary school superintendent.
1. Are most students who graduated from K-8 elementary schools as well prepared for your class as most students who attended elementary and middle school in the same district as the high school?
ð Yes ð No 2. Do students who attended elementary and middle school in the high school district
readily accept most students who graduated from K-8 elementary schools? ð Yes ð No
3. Do K-8 elementary school graduates participate in extracurricular activities as much as students who attended elementary and middle school in the same district as the high school?
ð Yes ð No 4. Are the technology levels of the typical K-8 elementary school graduates at least as
strong as those of students who attended elementary and middle school in the same district as the high school?
ð Yes ð No 5. In the past four years, about what percentage of incoming K-8 elementary school
students graduated from high school? ____________
6. Overall, do K-8 elementary school graduates require more personal attention than
students who attended elementary and middle school in the same district as the high school?
ð Yes ð No
A Descriptive Study of Oklahoma Rural Elementary Schools 31
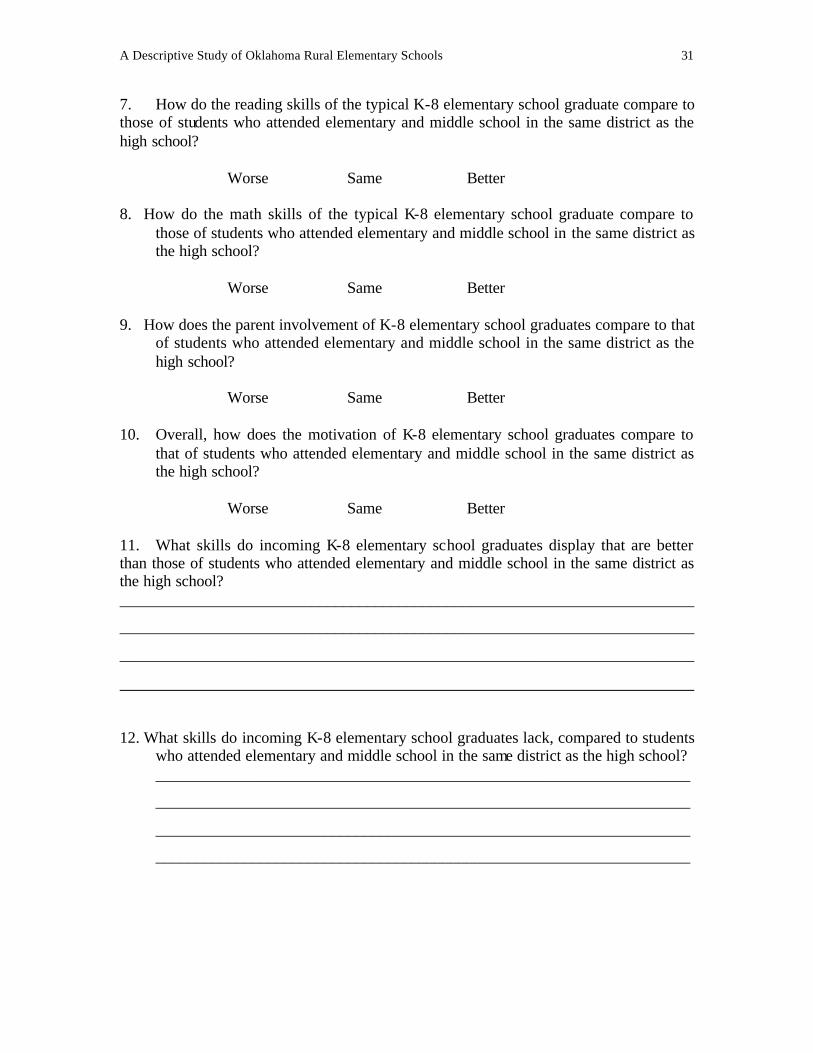
7. How do the reading skills of the typical K-8 elementary school graduate compare to those of students who attended elementary and middle school in the same district as the high school?
ð Worse ð Same ð Better 8. How do the math skills of the typical K-8 elementary school graduate compare to
those of students who attended elementary and middle school in the same district as the high school?
ð Worse ð Same ð Better
9. How does the parent involvement of K-8 elementary school graduates compare to that
of students who attended elementary and middle school in the same district as the high school?
ð Worse ð Same ð Better
10. Overall, how does the motivation of K-8 elementary school graduates compare to
that of students who attended elementary and middle school in the same district as the high school?
ð Worse ð Same ð Better
11. What skills do incoming K-8 elementary school graduates display that are better than those of students who attended elementary and middle school in the same district as the high school? ________________________________________________________________________
A Descriptive Study of Oklahoma Rural Elementary Schools 32
13. How would you describe the technology of your school?
ð Poor
ð Fair
ð Average
ð Very good
ð Excellent
14. During the last four years, about what percentage of incoming K-8 students dropped out before the end of the 9th grade? ____________ 15. During the last four years, about what percentage of incoming K-12 students
dropped out before the end of the 9th grade? ____________
A Descriptive Study of Oklahoma Rural Elementary Schools 33
Parent Survey
The Educational Training, Evaluation, Assessment and Measurement (ETEAM) Department, within The University of Oklahoma’s College of Continuing Education, has been commissioned by the Organization of Rural Elementary Schools (ORES) to study the educational experiences of students attending rural elementary schools. Your assistance is needed. DIRECTIONS: Please provide the following information and return the questionnaire to
your student’s elementary school superintendent. 7. Has your child had a difficult time at his/her new school this year?
ð Yes ð No
8. Does your child have more or less interest in school this year, compared to last year?
ð More ð Less
9. Is your child participating in extracurricular activities this year?
ð Yes ð No
10. How are your child’s grades this year, compared to last year?
ð Worse ð Same ð Better
11. How well did the K-8 school your child attended last year prepare him/her to succeed in the 9th grade?
ð Exceptionally prepared
ð Adequately prepared
ð Barely prepared
ð Slight unprepared
ð Unprepared
12. How often do you attend school functions?
ð Never
ð Sometimes
ð Often
ð Always
13. How well did you know your child’s teachers in the K-8 school?
ð Did not know them
A Descriptive Study of Oklahoma Rural Elementary Schools 34
ð Knew them somewhat
ð Knew them well
8. How well do you know your child’s teachers this year?
ð Do not know them
ð Know them somewhat
ð Know them well
9. Does your child plan to graduate from high school? ð Yes ð No
10. What do you think your child will do after high school?
11. What skills do you feel your child gained from attending a K-8 school that he/she would not have gained in a K-12 school? ___________________________________________________________________
12. What skills do you feel your child missed due to attending a K-8 school that he/she would have gained in a K-12 school? ___________________________________________________________________
A Descriptive Study of Oklahoma Rural Elementary Schools 35
13. How would you describe the quality of the K-8 school your child attended last
year?
ð Poor
ð Fair
ð Good
ð Excellent
14. How would you describe the quality of the school your child is attending this year?
ð Poor
ð Fair
ð Good
ð Excellent
15. Does your child receive free or reduced lunches? ð Yes ð No
16. How many times have you moved during the past three years? ____________
17. Has your child made new friends at this year’s school? ð Yes ð No
18. Does your child bring homework home most nights? ð Yes ð No
19. Did your child bring much homework home last year? ð Yes ð No
A Descriptive Study of Oklahoma Rural Elementary Schools 36
Student Survey
The Educational Training, Evaluation, Assessment and Measurement (ETEAM) Department, within The University of Oklahoma’s College of Continuing Education, has been commissioned by the Organization of Rural Elementary Schools (ORES) to study the educational experiences of students attending rural elementary schools. Your assistance is needed. DIRECTIONS: Please provide the following information and return the questionnaire to
your elementary school superintendent.
1. How well did your K-8 school prepare you for the work you are required to do at your present school?
ð Exceptionally prepared
ð Adequately prepared
ð Barely prepared
ð Slightly under-prepared
ð Unprepared 2. How have the other students accepted you at your present school?
ð Not accepted
ð Somewhat accepted
ð Well accepted 3. How have the teachers and staff accepted you at your present school?
ð Not accepted
ð Somewhat accepted
ð Well accepted 4. What do you feel you might have missed by attending a K-8 school (activities,
A Descriptive Study of Oklahoma Rural Elementary Schools 37
5. What types of things were you able to do at your K-8 school that you would not have done in a K-12 school (leadership roles, activities, sports, classes)? ___________________________________________________________________
7. Were your classmates who went to the K-12 school better prepared for the 9th grade than you were? ð Yes ð No 8. Do you have a good background in operating a computer? ð Yes ð No If so, what software have you used?
9. How would you describe your reading ability?
ð Poor
ð Fair
ð Good
ð Excellent 10. How would you describe your math ability?
ð Poor
ð Fair
ð Good
ð Excellent 11. Were you given an orientation to familiarize you with the high school before you started the 9th grade? ð Yes ð No
A Descriptive Study of Oklahoma Rural Elementary Schools 38
12. In what extracurricular activities are you now participating?