23
Families’ Journeys: Are we there yet? Oklahoma’s Family Assessment Measure Data from Fiscal Years 2013-2016.
Families’ Journeys:Are we there yet?
Oklahoma’sFamily Assessment
MeasureData from Fiscal Years 2013-2016.
OKSOC provides services to children, youth, and young adults experiencing serious emotional disturbance.
Beginning in 2 communities in 1999, state and federal financing and the active sponsorship of the Oklahoma Department of Mental Health and Substance Abuse Services (ODMHSAS) have helped OKSOC expand across the state.
OKSOC supports, maintains, and grows local systems of care communities by providing infrastructure, training and technical assistance, and staff professional development.
Contact Info
Gerri MullendoreOKSOC Coordinator of Family [email protected](405) 522-4155
Geneva StrechAssociate Director, ETEAMUniversity of [email protected]
Oklahoma Systems of Care (OKSOC)Systems of Care is an organizational framework for providing supports for children, youth, and young adults with a serious emotional disturbance. Their families are also provided supports.
The Systems of Care philosophy involves collaboration across agencies, families, children, youth, and young adults.
Systems of Care improves access to and expands the array of coordinated supports for these families.
OKSOC ValuesCommunity-BasedOklahoma Systems of Care brings services to the family’s home community. The responsibility for decision-making is placed at the local level.
Family-DrivenFamilies have a primary decision-making role in the care of their children as well as in the policies and procedures governing care for all children in their community, state, tribe, territory, and nation.
OKSOC ValuesYouth/Young Adult-GuidedYouths/Young Adults are engaged as equal partners in creating systems change in policies and procedures at the individual, community, state, and national levels.
Culturally and Linguistically CompetentServices and supports must be tailored to the unique culture of the child and family.
Family DrivenFamilies have a primary decision-making role in the care of their children as well as in the policies and procedures governing care for all children in their community, state, tribe, territory, and nation.
• Choosing supports, services, and providers• Setting goals• Designing and implementing programs• Monitoring outcomes• Partnering in funding decisions• Determining the effectiveness of all efforts to promote the mental
health and well-being of children, youth, and young adults
Data Informed Decision MakingData-informed organizations have the use of assessment, revision, and learning built into the way they plan, manage, and operate. A data-informed organization has continuous improvement embedded in the way it functions.
• We understand that developing our positions on various issues requires more than opinions, assumptions or ideas.
• Indeed, the credibility of the family movement depends on our ability to bring forth accurate, reliable and valid information.
• The underlying premise is simple. The more informed by data, the better the decision.
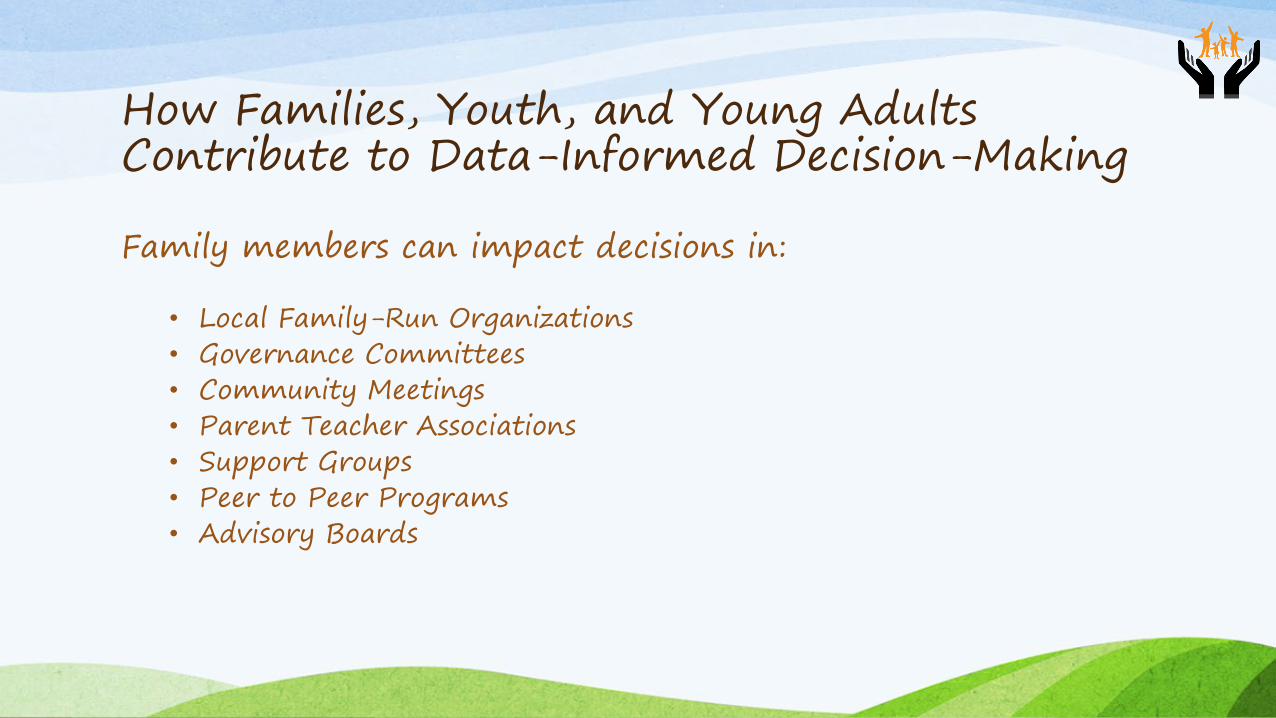
Family members can impact decisions in:
• Local Family-Run Organizations• Governance Committees• Community Meetings• Parent Teacher Associations• Support Groups• Peer to Peer Programs• Advisory Boards
How Families, Youth, and Young Adults Contribute to Data-Informed Decision-Making
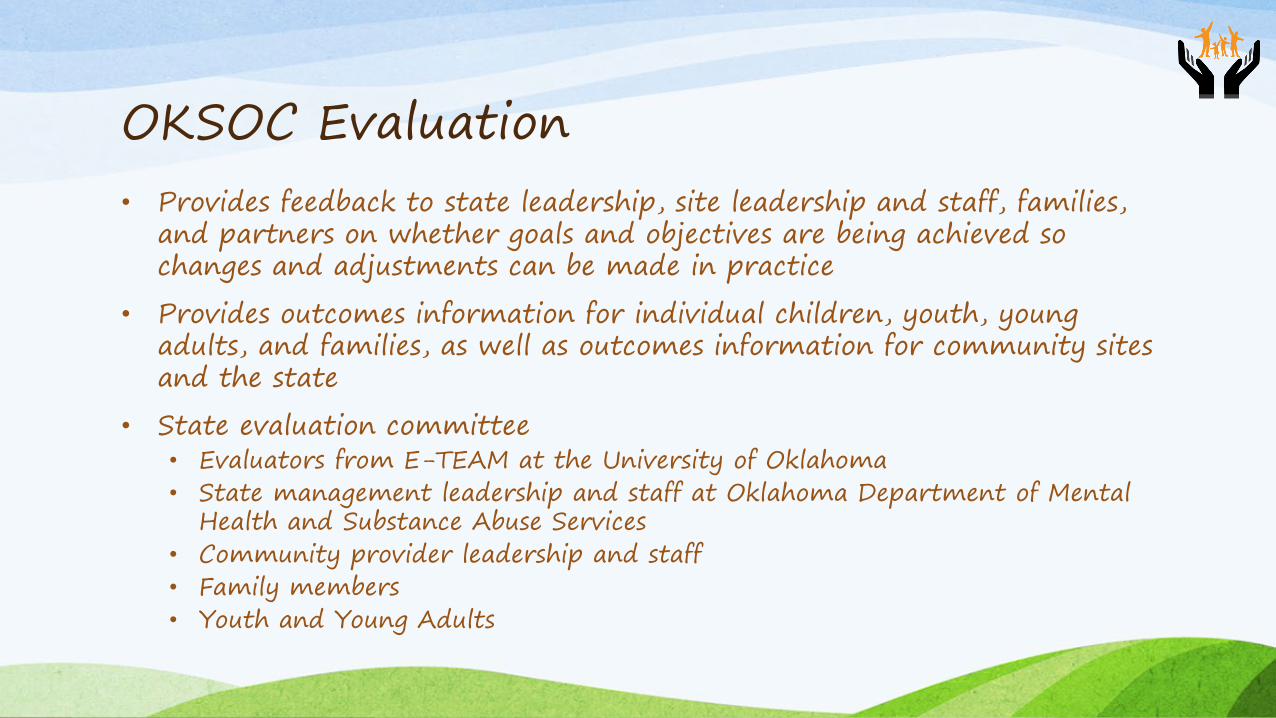
OKSOC Evaluation• Provides feedback to state leadership, site leadership and staff, families,
and partners on whether goals and objectives are being achieved so changes and adjustments can be made in practice
• Provides outcomes information for individual children, youth, young adults, and families, as well as outcomes information for community sites and the state
• State evaluation committee• Evaluators from E-TEAM at the University of Oklahoma• State management leadership and staff at Oklahoma Department of Mental
Health and Substance Abuse Services• Community provider leadership and staff• Family members• Youth and Young Adults
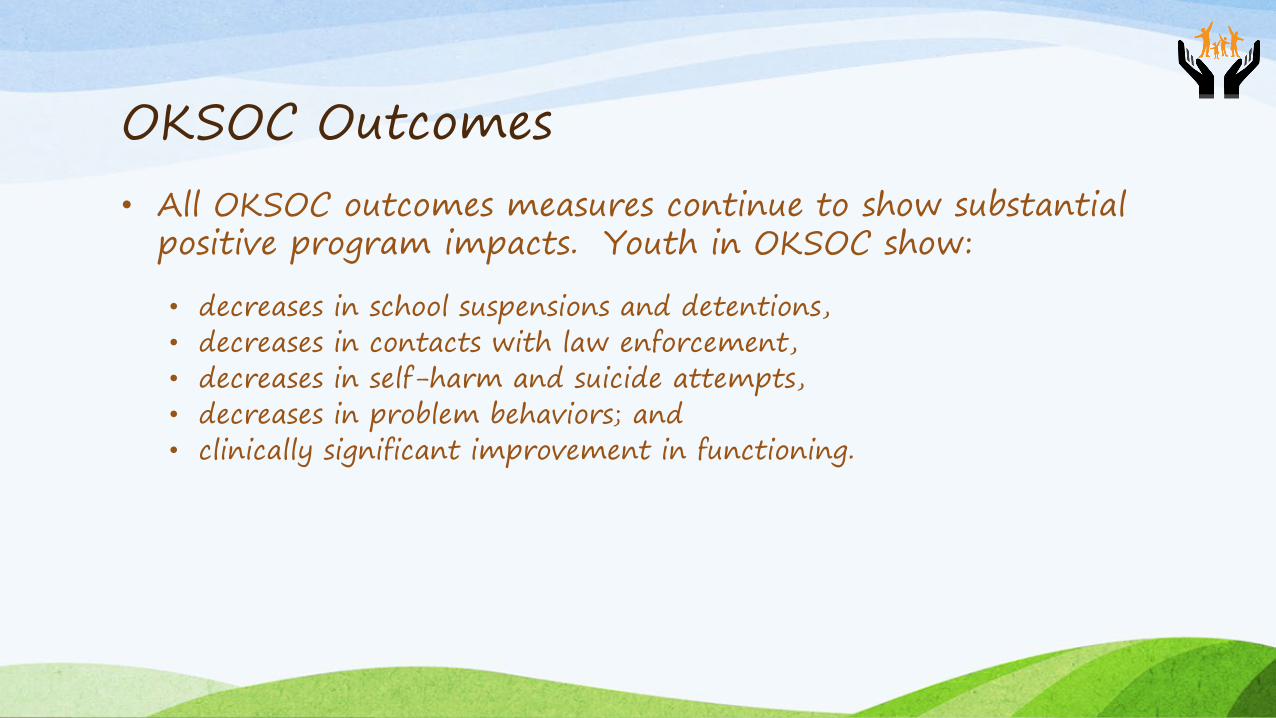
OKSOC Outcomes• All OKSOC outcomes measures continue to show substantial
positive program impacts. Youth in OKSOC show:
• decreases in school suspensions and detentions, • decreases in contacts with law enforcement, • decreases in self-harm and suicide attempts, • decreases in problem behaviors; and• clinically significant improvement in functioning.
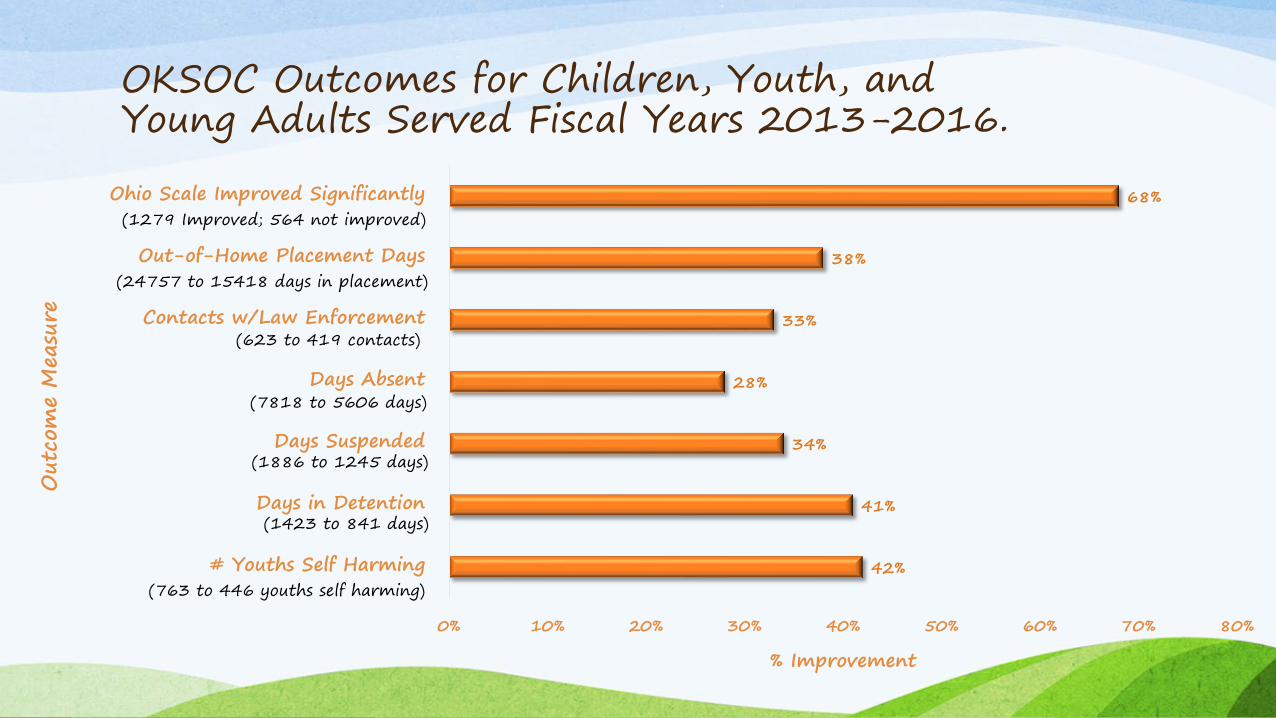
OKSOC Outcomes for Children, Youth, and Young Adults Served Fiscal Years 2013-2016.
42%
41%
34%
28%
33%
38%
68%
0% 10% 20% 30% 40% 50% 60% 70% 80%
# Youths Self Harming
Days in Detention
Days Suspended
Days Absent
Contacts w/Law Enforcement
Out-of-Home Placement Days
Ohio Scale Improved Significantly
% Improvement
Out
com
e M
easu
re
(24757 to 15418 days in placement)
(623 to 419 contacts)
(7818 to 5606 days)
(1886 to 1245 days)
(1423 to 841 days)
(763 to 446 youths self harming)
(1279 Improved; 564 not improved)

Are we there yet?
Why a Family Assessment?
To Tell a Family’s Story.To Hear a Family’s Story.To Make Families’ Stories Count!
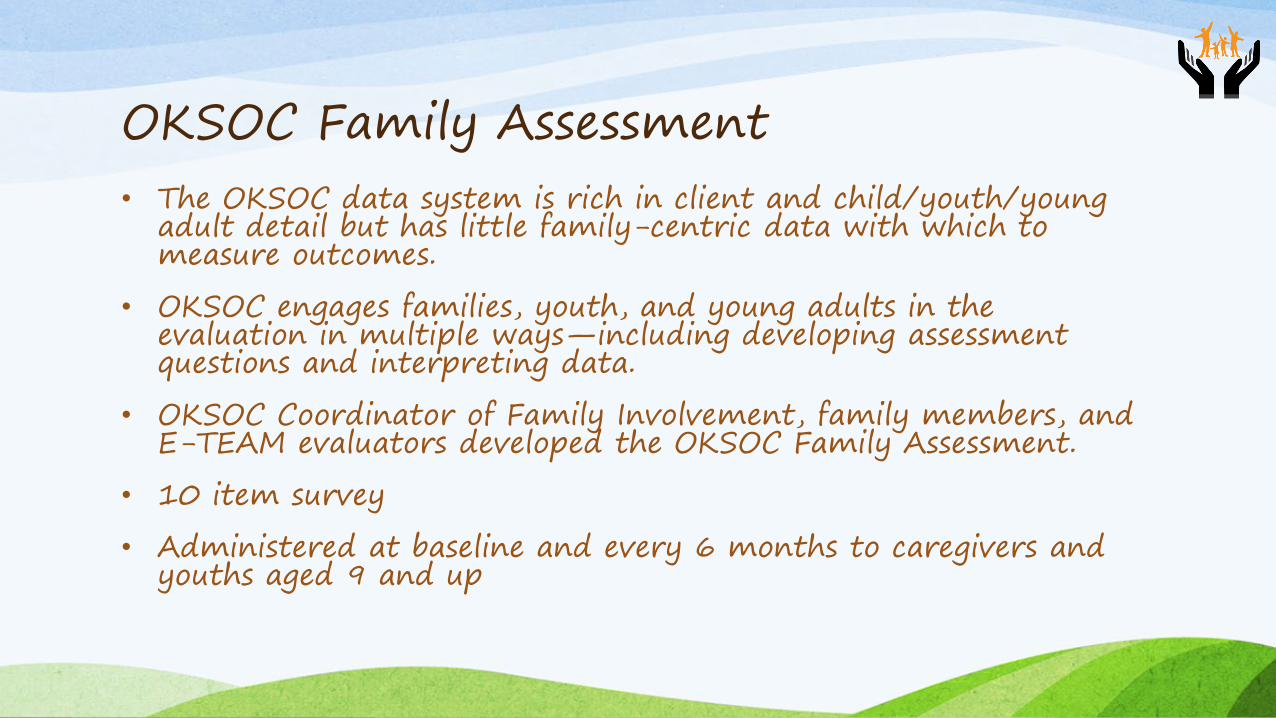
• The OKSOC data system is rich in client and child/youth/young adult detail but has little family-centric data with which to measure outcomes.
• OKSOC engages families, youth, and young adults in the evaluation in multiple ways—including developing assessment questions and interpreting data.
• OKSOC Coordinator of Family Involvement, family members, and E-TEAM evaluators developed the OKSOC Family Assessment.
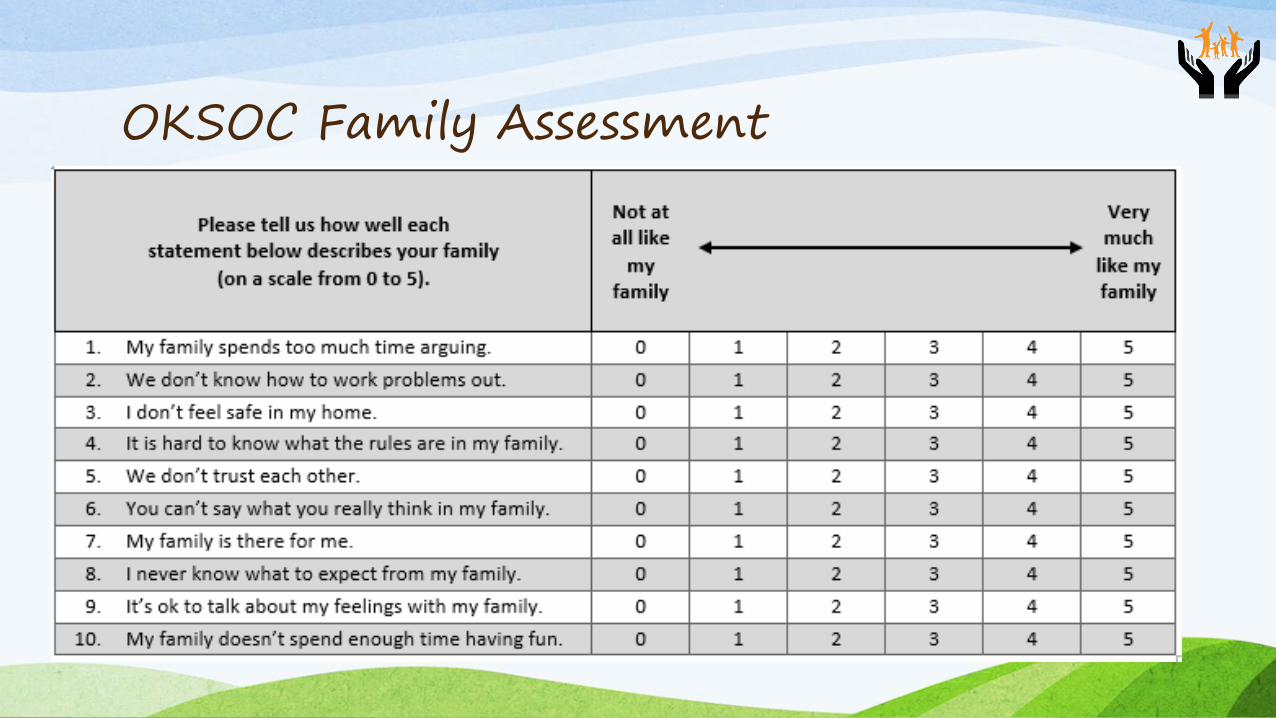
• 10 item survey
• Administered at baseline and every 6 months to caregivers and youths aged 9 and up
OKSOC Family Assessment
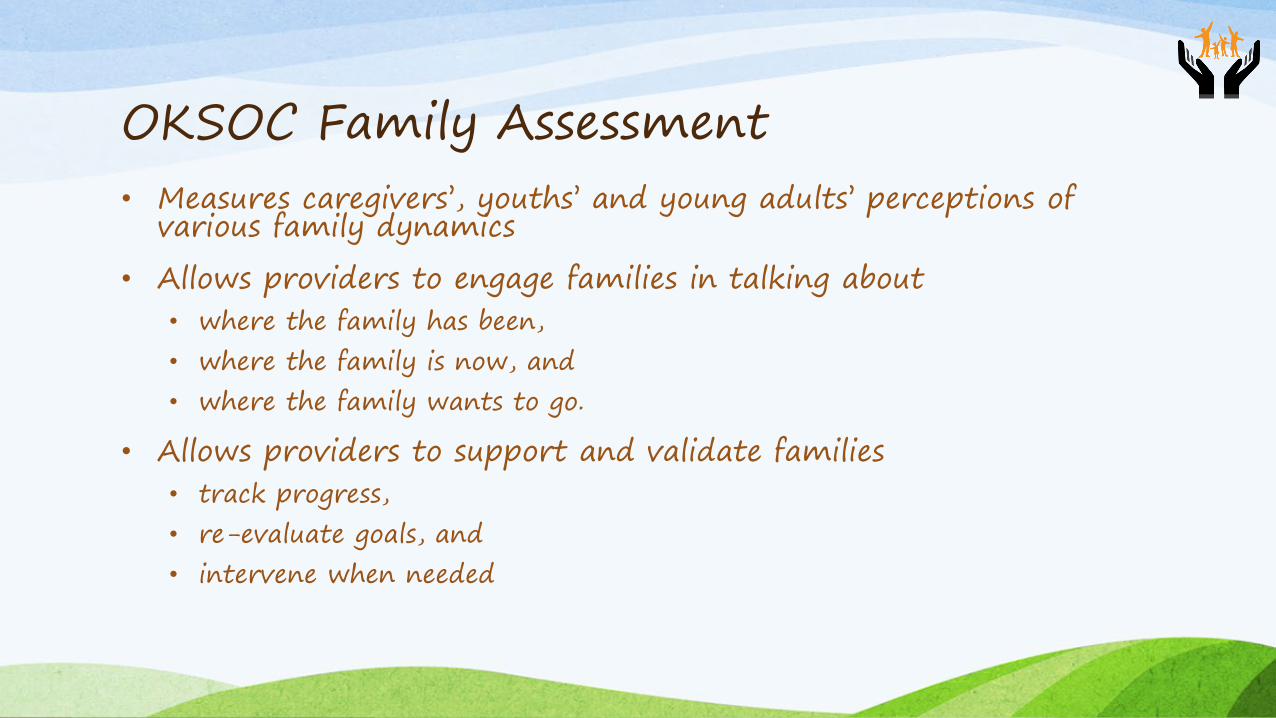
• Measures caregivers’, youths’ and young adults’ perceptions of various family dynamics
• Allows providers to engage families in talking about • where the family has been, • where the family is now, and • where the family wants to go.
• Allows providers to support and validate families• track progress,• re-evaluate goals, and • intervene when needed
OKSOC Family Assessment
OKSOC Family Assessment
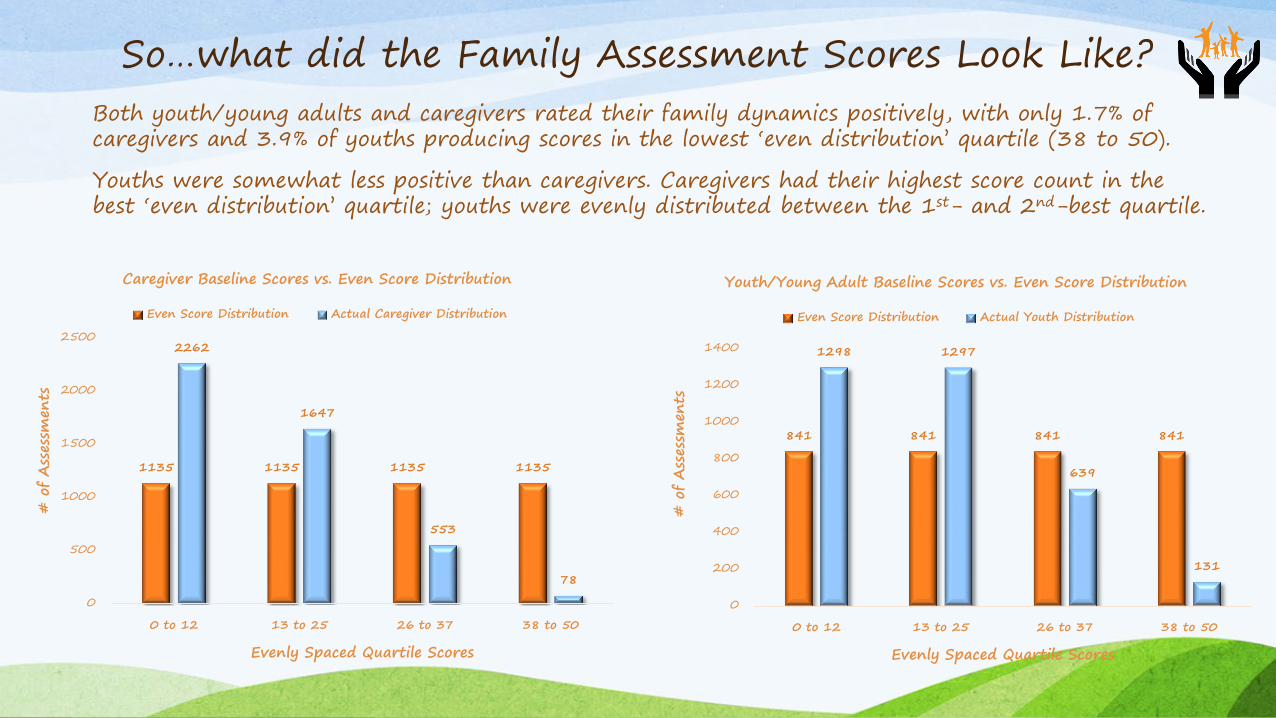
So…what did the Family Assessment Scores Look Like?Both youth/young adults and caregivers rated their family dynamics positively, with only 1.7% of caregivers and 3.9% of youths producing scores in the lowest ‘even distribution’ quartile (38 to 50).
Youths were somewhat less positive than caregivers. Caregivers had their highest score count in the best ‘even distribution’ quartile; youths were evenly distributed between the 1st- and 2nd-best quartile.
1135 1135 1135 1135
2262
1647
553
78
0
500
1000
1500
2000
2500
0 to 12 13 to 25 26 to 37 38 to 50
# o
f Ass
essm
ents
Evenly Spaced Quartile Scores
Caregiver Baseline Scores vs. Even Score Distribution
Even Score Distribution Actual Caregiver Distribution
841 841 841 841
1298 1297
639
131
0
200
400
600
800
1000
1200
1400
0 to 12 13 to 25 26 to 37 38 to 50
# o
f Ass
essm
ents
Evenly Spaced Quartile Scores
Youth/Young Adult Baseline Scores vs. Even Score Distribution
Even Score Distribution Actual Youth Distribution
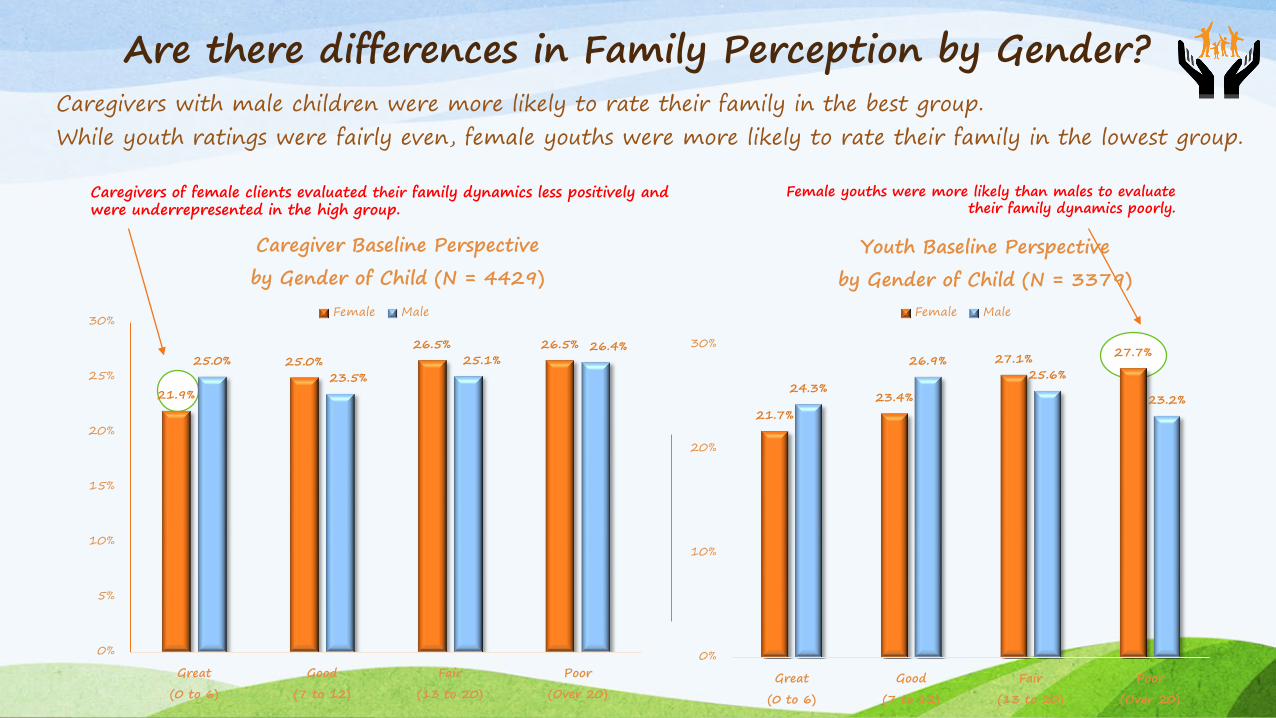
Female youths were more likely than males to evaluate their family dynamics poorly.
Are there differences in Family Perception by Gender?Caregivers with male children were more likely to rate their family in the best group.While youth ratings were fairly even, female youths were more likely to rate their family in the lowest group.
Caregivers of female clients evaluated their family dynamics less positively and were underrepresented in the high group.
21.7%23.4%
27.1% 27.7%
24.3%
26.9%25.6%
23.2%
0%
10%
20%
30%
Great
(0 to 6)
Good
(7 to 12)
Fair
(13 to 20)
Poor
(Over 20)
Youth Baseline Perspective
by Gender of Child (N = 3379)Female Male
21.9%
25.0%26.5% 26.5%
25.0%23.5%
25.1%26.4%
0%
5%
10%
15%
20%
25%
30%
Great
(0 to 6)
Good
(7 to 12)
Fair
(13 to 20)
Poor
(Over 20)
Caregiver Baseline Perspective
by Gender of Child (N = 4429)Female Male
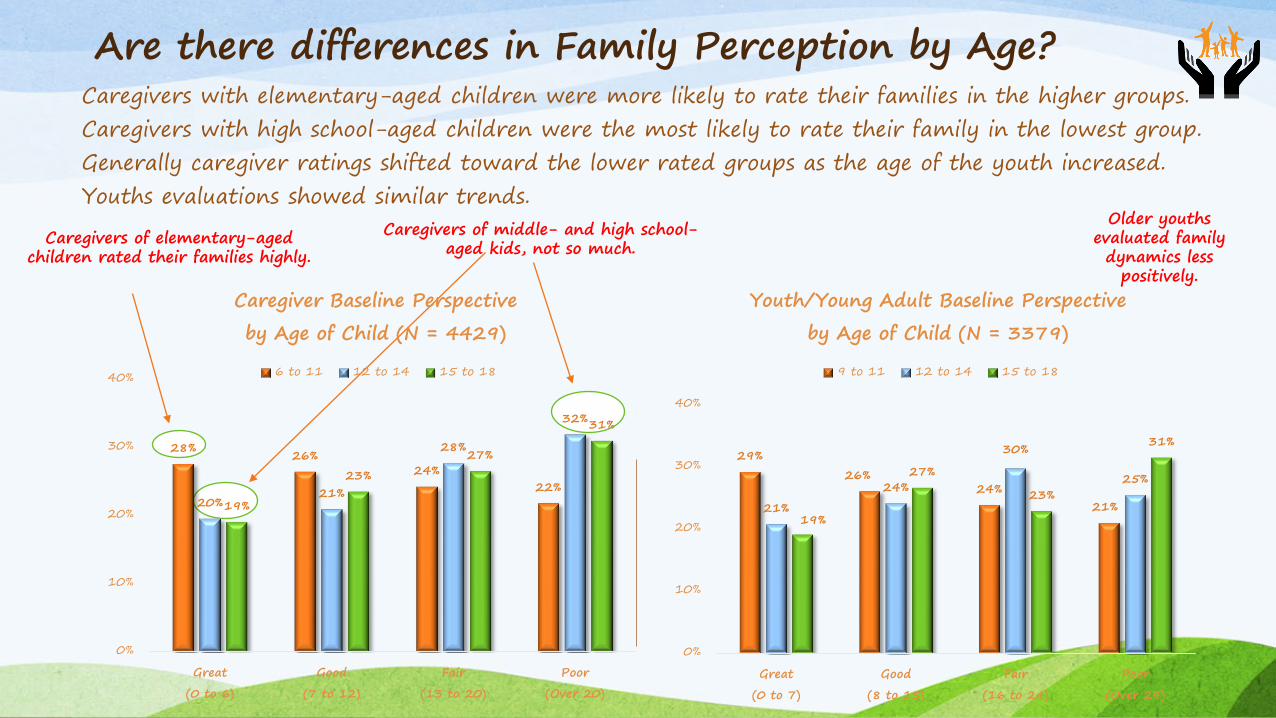
Are there differences in Family Perception by Age?Caregivers with elementary-aged children were more likely to rate their families in the higher groups.Caregivers with high school-aged children were the most likely to rate their family in the lowest group.Generally caregiver ratings shifted toward the lower rated groups as the age of the youth increased.Youths evaluations showed similar trends.
Older youths evaluated family dynamics less
positively.
Caregivers of elementary-aged children rated their families highly.
Caregivers of middle- and high school-aged kids, not so much.
29%26%
24%21%21%
24%
30%
25%
19%
27%
23%
31%
0%
10%
20%
30%
40%
Great
(0 to 7)
Good
(8 to 15)
Fair
(16 to 24)
Poor
(Over 24)
Youth/Young Adult Baseline Perspective
by Age of Child (N = 3379)
9 to 11 12 to 14 15 to 18
28% 26%24%
22%20%
21%
28%
32%
19%
23%
27%
31%
0%
10%
20%
30%
40%
Great
(0 to 6)
Good
(7 to 12)
Fair
(13 to 20)
Poor
(Over 20)
Caregiver Baseline Perspective
by Age of Child (N = 4429)
6 to 11 12 to 14 15 to 18
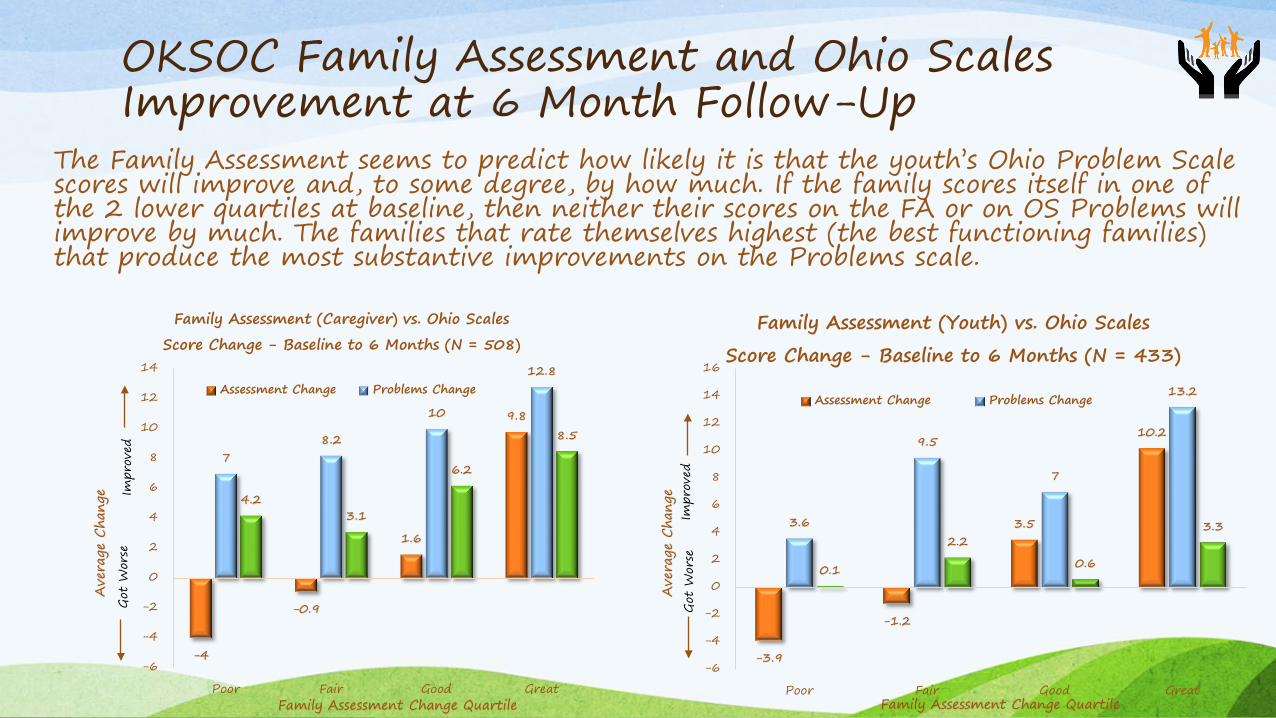
OKSOC Family Assessment and Ohio Scales Improvement at 6 Month Follow-Up
The Family Assessment seems to predict how likely it is that the youth’s Ohio Problem Scale scores will improve and, to some degree, by how much. If the family scores itself in one of the 2 lower quartiles at baseline, then neither their scores on the FA or on OS Problems will improve by much. The families that rate themselves highest (the best functioning families) that produce the most substantive improvements on the Problems scale.
-4
-0.9
1.6
9.8
78.2
10
12.8
4.23.1
6.2
8.5
-6
-4
-2
0
2
4
6
8
10
12
14
Poor Fair Good Great
Ave
rage
Cha
nge
Family Assessment Change Quartile
Family Assessment (Caregiver) vs. Ohio Scales
Score Change - Baseline to 6 Months (N = 508)
Assessment Change Problems Change
Got
Wor
seIm
prov
ed
-3.9
-1.2
3.5
10.2
3.6
9.5
7
13.2
0.1
2.2
0.6
3.3
-6
-4
-2
0
2
4
6
8
10
12
14
16
Poor Fair Good Great
Ave
rage
Cha
nge
Family Assessment Change Quartile
Family Assessment (Youth) vs. Ohio Scales
Score Change - Baseline to 6 Months (N = 433)
Assessment Change Problems Change
Got
Wor
seIm
prov
ed
Families’ Journeys:We’re getting there!
The E-TEAM at the University of Oklahoma is a full service department with senior researchers, data analysts, technical writers, and data base developers and managers representing decades of experience in all phases of research data processing. E-TEAM also has several years’ experience as evaluation manager for Oklahoma Systems of Care (OKSOC), implementing its national and local evaluations as well as special OKSOC collaborative studies with child welfare and juvenile justice.


![Revising Unmet Need for Family Planning [AS25] - Measure DHS](https://static.documents.pub/doc/80x56/6206538b8c2f7b173006b028/revising-unmet-need-for-family-planning-as25-measure-dhs.jpg)


