71
ComponentOne OLAP for WPF and Silverlight

ComponentOne
OLAP for WPF andSilverlight
GrapeCity US
GrapeCity201 South Highland Avenue, Suite 301Pittsburgh, PA 15206Tel: 1.800.858.2739 | 412.681.4343Fax: 412.681.4384Website: https://www.grapecity.com/en/E-mail: [email protected]
Trademarks
The ComponentOne product name is a trademark and ComponentOne is a registered trademark of GrapeCity, Inc. Allother trademarks used herein are the properties of their respective owners.
Warranty
ComponentOne warrants that the media on which the software is delivered is free from defects in material andworkmanship, assuming normal use, for a period of 90 days from the date of purchase. If a defect occurs during thistime, you may return the defective media to ComponentOne, along with a dated proof of purchase, andComponentOne will replace it at no charge. After 90 days, you can obtain a replacement for the defective media bysending it and a check for $25 (to cover postage and handling) to ComponentOne.
Except for the express warranty of the original media on which the software is delivered is set forth here,ComponentOne makes no other warranties, express or implied. Every attempt has been made to ensure that theinformation contained in this manual is correct as of the time it was written. ComponentOne is not responsible for anyerrors or omissions. ComponentOne’s liability is limited to the amount you paid for the product. ComponentOne isnot liable for any special, consequential, or other damages for any reason.
Copying and Distribution
While you are welcome to make backup copies of the software for your own use and protection, you are notpermitted to make copies for the use of anyone else. We put a lot of time and effort into creating this product, and weappreciate your support in seeing that it is used by licensed users only.
Table of ContentsOLAP for WPF and Silverlight Overview 3
What is C1Olap 4
Introduction to OLAP 5-6
Key Features 7
C1Olap Architecture 8
C1OlapPage 8-9
C1OlapPanel 9-11
C1OlapGrid 11
C1OlapChart 11
C1OlapPrintDocument 11
C1Olap Quick Start 12
A simple OLAP application 12-13
Creating OLAP Views 13-15
Summarizing Data 15-16
Drilling Down on the Data 16-17
Customizing the C1OlapPage 17
Configuring Fields in Code 17-20
Persisting OLAP views in Local Storage 20-21
Creating Predefined Views 21-25
Updating the OLAP View 25-26
Conditional Formatting 26-28
Large Data Sources 28-39
Building a Custom User Interface 39-45
XAML Quick Reference 46
OLAP for WPF and Silverlight Design-Time Support 47
Using the C1OlapPage ToolStrip 47
Using the Grid Menu 47
Using the Chart Menu 47-53
Using the Report Menu 53-55
OLAP Cubes 56
Connecting to an OLAP Cube 56-57
Loading a Local Cube File 57
Using Cube Data Sources 57-58
OLAP for WPF and Silverlight Task-Based Help 59
OLAP for WPF and Silverlight 1
Copyright © 2017 GrapeCity, Inc. All rights reserved.

Binding C1OlapPage or C1OlapPanel a Data Source 59-60
Binding C1OlapChart to a C1OlapPanel 60
Binding C1OlapGrid to a C1OlapPanel 60
Removing a Field from a Data View 60
Filtering Data in a Field 60-62
Specifying a Subtotal Function 62-63
Formatting Numeric Data 63-64
Calculating Weighted Averages and Sums 64-65
Exporting a Grid 65
Grouping Data 65-69
Creating a Report 69
OLAP for WPF and Silverlight 2
Copyright © 2017 GrapeCity, Inc. All rights reserved.
OLAP for WPF and Silverlight OverviewDeliver in-depth business intelligence (BI) functionality with OLAP for WPF and Silverlight. Create pivot grids andcharts that slice and dice your tabular and cube data to give you real-time information, insights, and results inseconds. The easy to use controls are modeled after Microsoft Excel® Pivot Tables, so they’re powerful and familiarfor all users.
Note: ComponentOne OLAP for WPF and Silverlight controls (C1OlapPage, C1OlapPanel, C1OlapGrid andC1OlapChart) require a separate OLAP for WPF and Silverlight license in order to run without unlicensedmessages.
OLAP for WPF and Silverlight 3
Copyright © 2017 GrapeCity, Inc. All rights reserved.

What is C1OlapOLAP for WPF and Silverlight is a suite of Silverlight controls that provide analytical processing features similar tothose found in Microsoft Excel’s Pivot Tables and Pivot Charts. Asynchronous processing improves the performance ofthe controls as multiple processes can occur simultaneously on separate threads.
For example: In case of synchronous processing, when you make any heavy update, the entire application stopsresponding to any action made by the user till the update is completed. In case of C1Olap, that supportsasynchronous processing, when you make any heavy update (such as adding multiple fields to row or column box of aC1OlapPage), the application responds to all user actions even while the update is in progress.
Asynchronous processing is available in WPF only.
OLAP for WPF and Silverlight takes raw data in any format and provides an easy-to-use interface so users canquickly and intuitively create summaries that display the data in different ways, uncovering trends and providingvaluable insights interactively. As the user modifies the way in which he wants to see the data, OLAP for WPF andSilverlight instantly provides pivot grids and charts (and soon reporting) that can be saved, exported, or printed.
OLAP for WPF and Silverlight 4
Copyright © 2017 GrapeCity, Inc. All rights reserved.
Introduction to OLAPOLAP means "online analytical processing". It refers to technologies that enable the dynamic visualization and analysisof data.
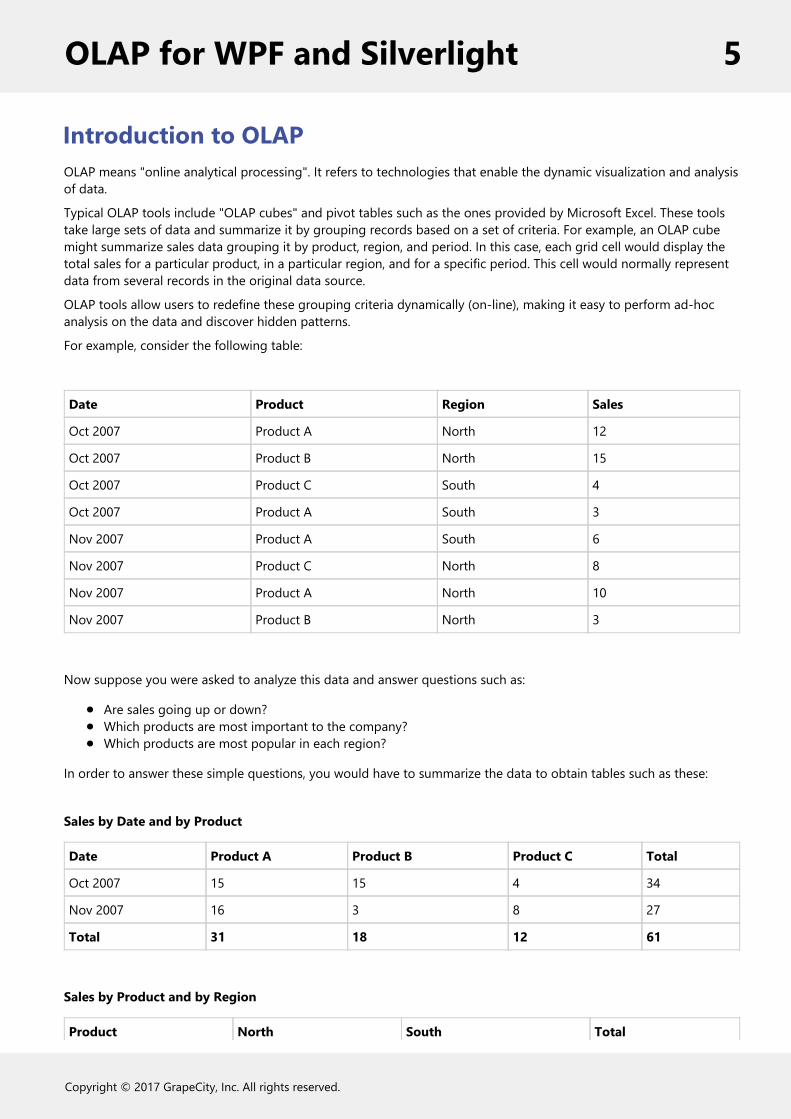
Typical OLAP tools include "OLAP cubes" and pivot tables such as the ones provided by Microsoft Excel. These toolstake large sets of data and summarize it by grouping records based on a set of criteria. For example, an OLAP cubemight summarize sales data grouping it by product, region, and period. In this case, each grid cell would display thetotal sales for a particular product, in a particular region, and for a specific period. This cell would normally representdata from several records in the original data source.
OLAP tools allow users to redefine these grouping criteria dynamically (on-line), making it easy to perform ad-hocanalysis on the data and discover hidden patterns.
For example, consider the following table:
Date Product Region Sales
Oct 2007 Product A North 12
Oct 2007 Product B North 15
Oct 2007 Product C South 4
Oct 2007 Product A South 3
Nov 2007 Product A South 6
Nov 2007 Product C North 8
Nov 2007 Product A North 10
Nov 2007 Product B North 3
Now suppose you were asked to analyze this data and answer questions such as:
Are sales going up or down?Which products are most important to the company?Which products are most popular in each region?
In order to answer these simple questions, you would have to summarize the data to obtain tables such as these:
Sales by Date and by Product
Date Product A Product B Product C Total
Oct 2007 15 15 4 34
Nov 2007 16 3 8 27
Total 31 18 12 61
Sales by Product and by Region
Product North South Total
OLAP for WPF and Silverlight 5
Copyright © 2017 GrapeCity, Inc. All rights reserved.
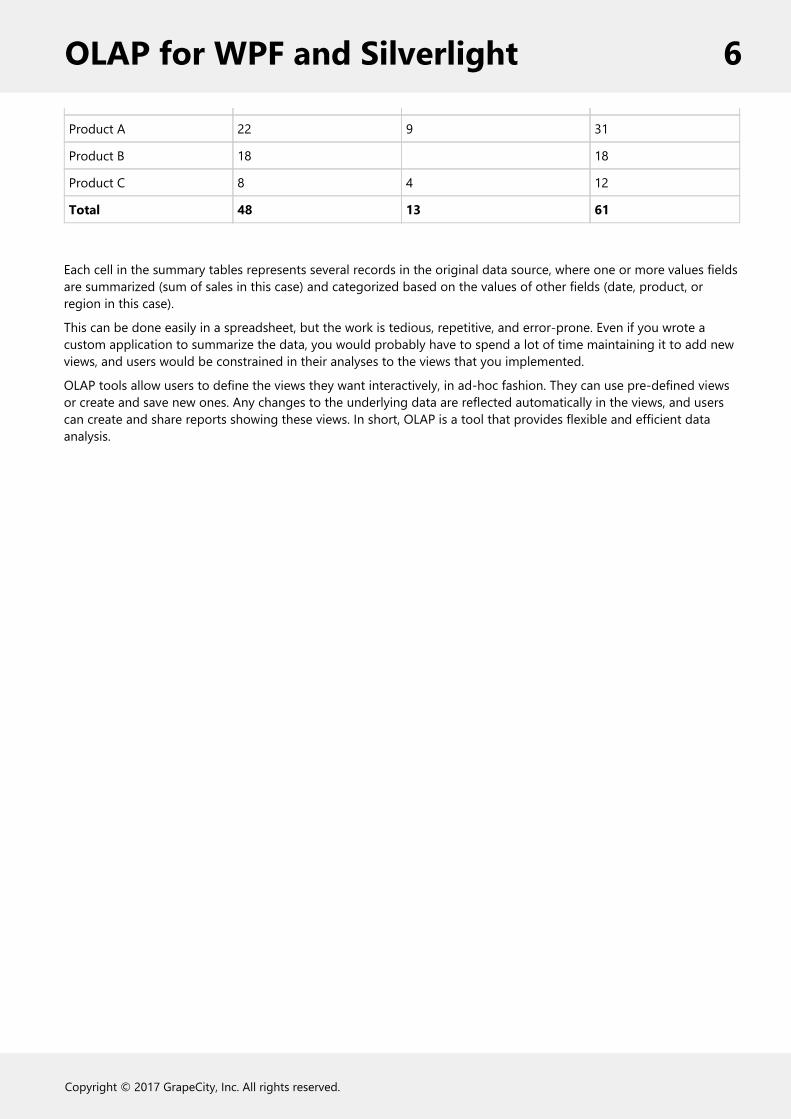
Product A 22 9 31
Product B 18 18
Product C 8 4 12
Total 48 13 61
Each cell in the summary tables represents several records in the original data source, where one or more values fieldsare summarized (sum of sales in this case) and categorized based on the values of other fields (date, product, orregion in this case).
This can be done easily in a spreadsheet, but the work is tedious, repetitive, and error-prone. Even if you wrote acustom application to summarize the data, you would probably have to spend a lot of time maintaining it to add newviews, and users would be constrained in their analyses to the views that you implemented.
OLAP tools allow users to define the views they want interactively, in ad-hoc fashion. They can use pre-defined viewsor create and save new ones. Any changes to the underlying data are reflected automatically in the views, and userscan create and share reports showing these views. In short, OLAP is a tool that provides flexible and efficient dataanalysis.
OLAP for WPF and Silverlight 6
Copyright © 2017 GrapeCity, Inc. All rights reserved.
Key FeaturesThe following are some of the main features of OLAP for WPF and Silverlight that you may find useful:
OLAP for WPF and Silverlight provides ultimate flexibility for building OLAP applicationsDrop one control, C1OlapPage, on your form and set the data source to start displaying your data in a grid orchart–it's that easy! But suppose you need to show multiple charts or grids. No problem. OLAP for WPF andSilverlight also provides the C1OlapPanel, C1OlapChart, and C1OlapGrid controls to give you the flexibility youneed. See the C1Olap Architecture topic for an overview of each of the controls.Choose from five chart types and twenty-two palette options to enhance your chartsC1OlapChart provides the most common chart types to display your information, including: Bar, Column, Area,Line, and Scatter. You can select from twenty-two palette options that define the colors of the chart and legenditems. See Using the Chart Menu to view all of the chart types and palettes.Print, preview, or export data to PDFYou can create and preview reports containing data, grids, or charts and then print or export them to PDF.See Creating a Report and the OLAP for WPF and Silverlight Task-Based Help for more information.Remove a field or data in a field from the grid or chart viewYou can easily filter a field so it doesn't appear in your grid or chart view. Simply drag the field to the Filterarea of a C1OlapPanel; see Removing a Field from a Data View for more information. If you want to filter ondata in a field, for example, if you want to find all employees whose last names start with "Sim", you can usethe Field Settings dialog box. See Filtering Data in a Field for detailed steps.Display information in a grid or chart viewOLAP for WPF and Silverlight provides a C1OlapGrid and C1OlapChart control to display data. These controlsare built into the C1OlapPage control, but they are also available as separate controls so you can customizeyour OLAP application. See the C1Olap Architecture topic for an overview of each of the controls.Decide how information is displayed at run timeUse the C1OlapPanel to determine which fields of your data source should be used to display your data andhow. Drag fields between the lower areas of the C1OlapPanel to create a filter, column headers, row headers,or get the sum of values from a column or row. See the C1OlapPanel topic for more information.OLAP for WPF provides cube supportOlap (C1Olap) allows you to connect to OLAP data sources from Microsoft® SQL Server® Analysis Services(SSAS). Build a complete front-end or dashboard for your database using OLAP while writing just a couple linesof code. With C1Olap, users can build a multi-dimensional pivot table that slices and dices the dimensions,measures and Key Performance Indicators (KPIs) present in the OLAP cube. See OLAP Cubes for moreinformation on cube support.Asynchronous Processing: Multiple processes can run simultaneously and independent of each other.
Asynchronous processing is available in WPF only.
OLAP for WPF and Silverlight 7
Copyright © 2017 GrapeCity, Inc. All rights reserved.
C1Olap ArchitectureOLAP includes the following controls:
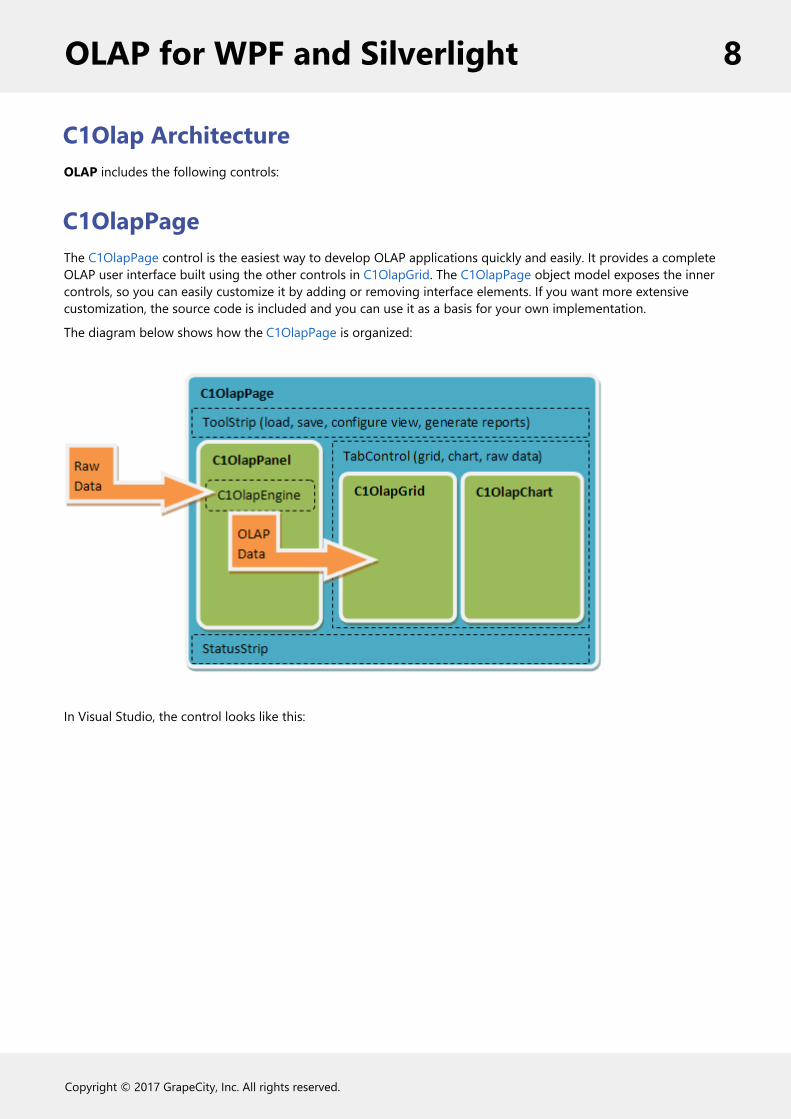
C1OlapPageThe C1OlapPage control is the easiest way to develop OLAP applications quickly and easily. It provides a completeOLAP user interface built using the other controls in C1OlapGrid. The C1OlapPage object model exposes the innercontrols, so you can easily customize it by adding or removing interface elements. If you want more extensivecustomization, the source code is included and you can use it as a basis for your own implementation.
The diagram below shows how the C1OlapPage is organized:
In Visual Studio, the control looks like this:
OLAP for WPF and Silverlight 8
Copyright © 2017 GrapeCity, Inc. All rights reserved.
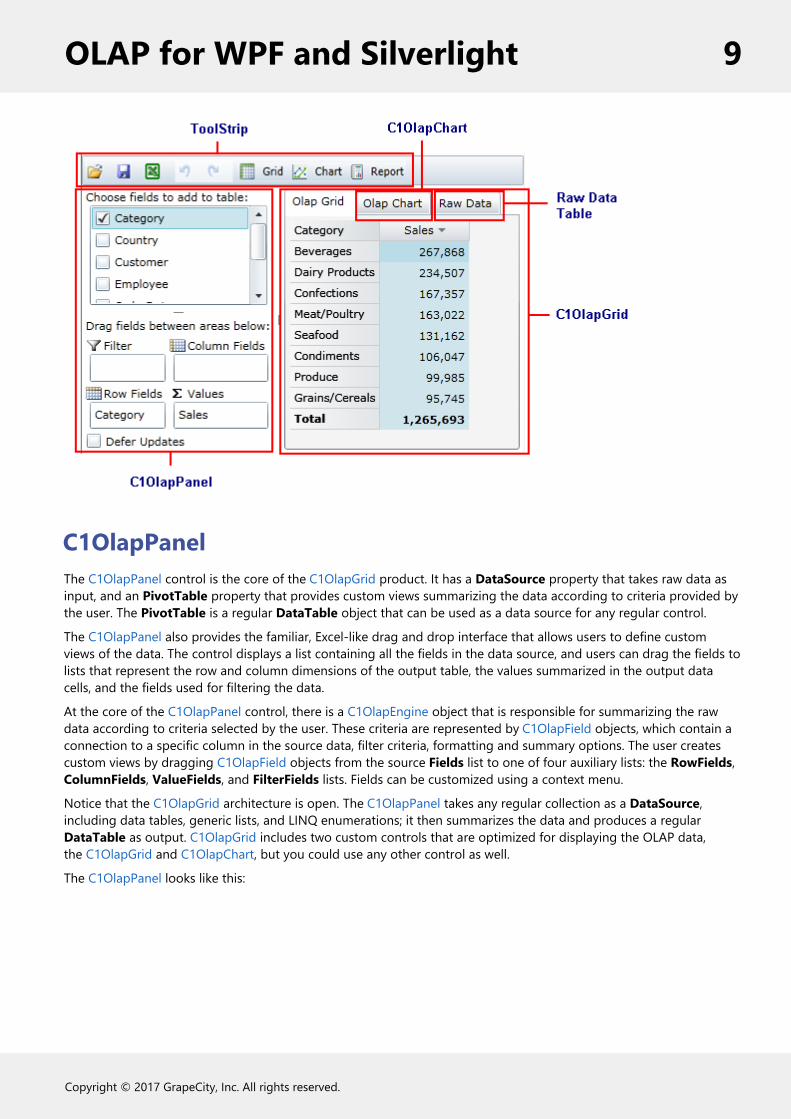
C1OlapPanelThe C1OlapPanel control is the core of the C1OlapGrid product. It has a DataSource property that takes raw data asinput, and an PivotTable property that provides custom views summarizing the data according to criteria provided bythe user. The PivotTable is a regular DataTable object that can be used as a data source for any regular control.
The C1OlapPanel also provides the familiar, Excel-like drag and drop interface that allows users to define customviews of the data. The control displays a list containing all the fields in the data source, and users can drag the fields tolists that represent the row and column dimensions of the output table, the values summarized in the output datacells, and the fields used for filtering the data.
At the core of the C1OlapPanel control, there is a C1OlapEngine object that is responsible for summarizing the rawdata according to criteria selected by the user. These criteria are represented by C1OlapField objects, which contain aconnection to a specific column in the source data, filter criteria, formatting and summary options. The user createscustom views by dragging C1OlapField objects from the source Fields list to one of four auxiliary lists: the RowFields,ColumnFields, ValueFields, and FilterFields lists. Fields can be customized using a context menu.
Notice that the C1OlapGrid architecture is open. The C1OlapPanel takes any regular collection as a DataSource,including data tables, generic lists, and LINQ enumerations; it then summarizes the data and produces a regularDataTable as output. C1OlapGrid includes two custom controls that are optimized for displaying the OLAP data,the C1OlapGrid and C1OlapChart, but you could use any other control as well.
The C1OlapPanel looks like this:
OLAP for WPF and Silverlight 9
Copyright © 2017 GrapeCity, Inc. All rights reserved.

C1OlapPanel Area Description
Filter Specifies the field to filter.
Row Field The items in the field specified become the row headers of a grid. These itemspopulate the Y-axis in a chart.
Column Fields The items in the field specified become the column headers of a grid. These itemsare used to populate the legend in a chart.
Values Shows the sum of the field specified.
Defer Updates Suspends the automatic updates that occur while the user modifies the viewdefinition when this checkbox is selected.
If you right-click fields in the Filter, Column Fields, Row Fields, or Values area at run time, a context menu appears,allowing you to move the field to a different area. You can also remove the field or click Field Settings to format andapply a filter to the field. See Filtering Data in a Field for more information.
OLAP for WPF and Silverlight 10
Copyright © 2017 GrapeCity, Inc. All rights reserved.
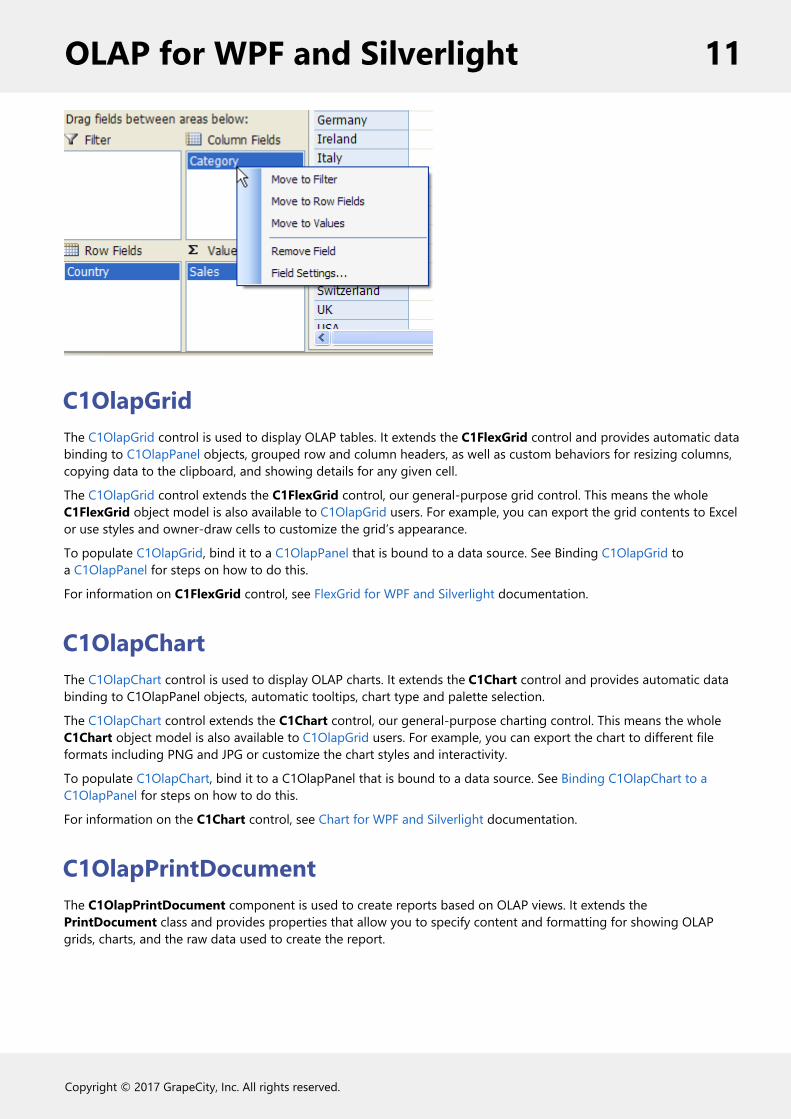
C1OlapGridThe C1OlapGrid control is used to display OLAP tables. It extends the C1FlexGrid control and provides automatic databinding to C1OlapPanel objects, grouped row and column headers, as well as custom behaviors for resizing columns,copying data to the clipboard, and showing details for any given cell.
The C1OlapGrid control extends the C1FlexGrid control, our general-purpose grid control. This means the wholeC1FlexGrid object model is also available to C1OlapGrid users. For example, you can export the grid contents to Excelor use styles and owner-draw cells to customize the grid’s appearance.
To populate C1OlapGrid, bind it to a C1OlapPanel that is bound to a data source. See Binding C1OlapGrid toa C1OlapPanel for steps on how to do this.
For information on C1FlexGrid control, see FlexGrid for WPF and Silverlight documentation.
C1OlapChartThe C1OlapChart control is used to display OLAP charts. It extends the C1Chart control and provides automatic databinding to C1OlapPanel objects, automatic tooltips, chart type and palette selection.
The C1OlapChart control extends the C1Chart control, our general-purpose charting control. This means the wholeC1Chart object model is also available to C1OlapGrid users. For example, you can export the chart to different fileformats including PNG and JPG or customize the chart styles and interactivity.
To populate C1OlapChart, bind it to a C1OlapPanel that is bound to a data source. See Binding C1OlapChart to aC1OlapPanel for steps on how to do this.
For information on the C1Chart control, see Chart for WPF and Silverlight documentation.
C1OlapPrintDocumentThe C1OlapPrintDocument component is used to create reports based on OLAP views. It extends thePrintDocument class and provides properties that allow you to specify content and formatting for showing OLAPgrids, charts, and the raw data used to create the report.
OLAP for WPF and Silverlight 11
Copyright © 2017 GrapeCity, Inc. All rights reserved.
C1Olap Quick StartThis section presents code walkthroughs that start with the simplest WPF or Silverlight application and progress tointroduce commonly used features.
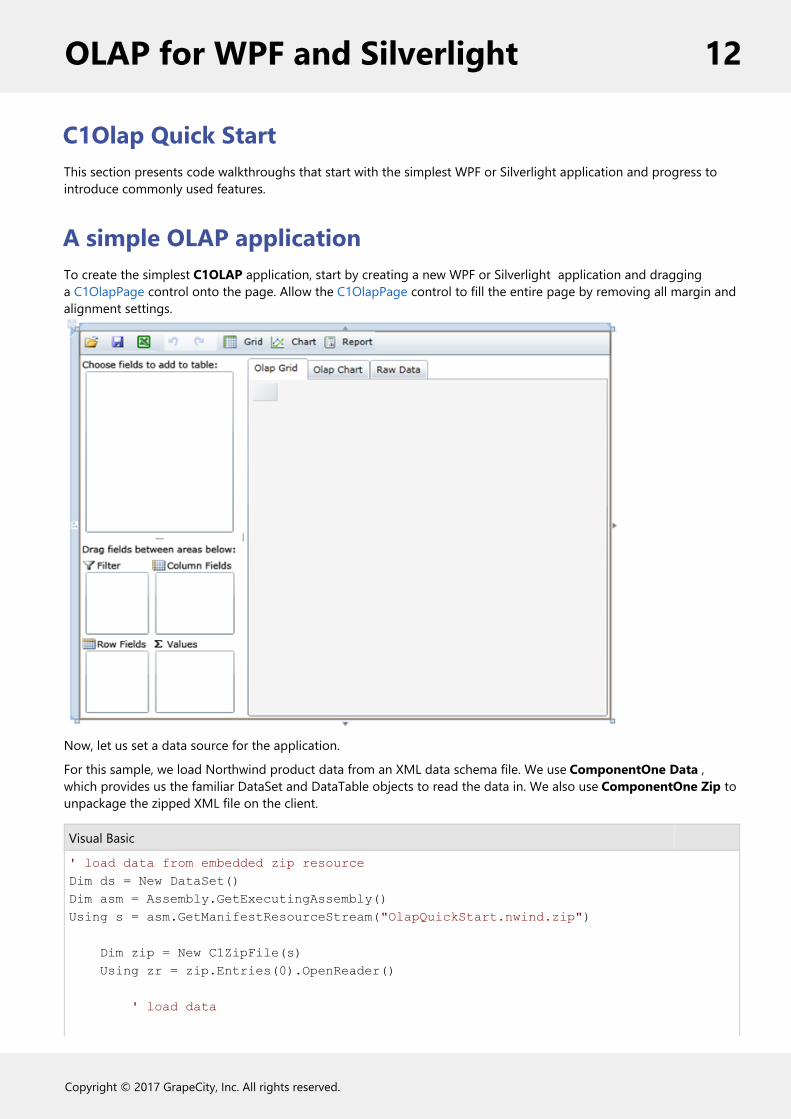
A simple OLAP applicationTo create the simplest C1OLAP application, start by creating a new WPF or Silverlight application and dragginga C1OlapPage control onto the page. Allow the C1OlapPage control to fill the entire page by removing all margin andalignment settings.
Now, let us set a data source for the application.
For this sample, we load Northwind product data from an XML data schema file. We use ComponentOne Data ,which provides us the familiar DataSet and DataTable objects to read the data in. We also use ComponentOne Zip tounpackage the zipped XML file on the client.
Visual Basic
' load data from embedded zip resourceDim ds = New DataSet()Dim asm = Assembly.GetExecutingAssembly()Using s = asm.GetManifestResourceStream("OlapQuickStart.nwind.zip")
Dim zip = New C1ZipFile(s) Using zr = zip.Entries(0).OpenReader()
' load data
OLAP for WPF and Silverlight 12
Copyright © 2017 GrapeCity, Inc. All rights reserved.

ds.ReadXml(zr) End UsingEnd Using
C#
// load data from embedded zip resourcevar ds = new DataSet();var asm = Assembly.GetExecutingAssembly();using (var s = asm.GetManifestResourceStream("OlapQuickStart.nwind.zip")) { var zip = new C1ZipFile(s); using (var zr = zip.Entries[0].OpenReader()) { // load data ds.ReadXml(zr); } }
Then we simply set the DataSource property on the C1OlapPage control. We could use any data binding method withthis control.
Visual Basic
' bind olap page to data_c1OlapPage.DataSource = ds.Tables(0).DefaultView
C#
// bind olap page to data_c1OlapPage.DataSource = ds.Tables[0].DefaultView;
The application is now ready. The following sections describe the functionality provided by default, without writingany code aside from configuring our data source.
Creating OLAP ViewsRun the application and you will see an interface similar to the one in Microsoft Excel. Drag the “Country” field to the“Row Fields” list and “Sales” to the “Values” list and you will see a summary of prices charged by country as shownbelow:
OLAP for WPF and Silverlight 13
Copyright © 2017 GrapeCity, Inc. All rights reserved.
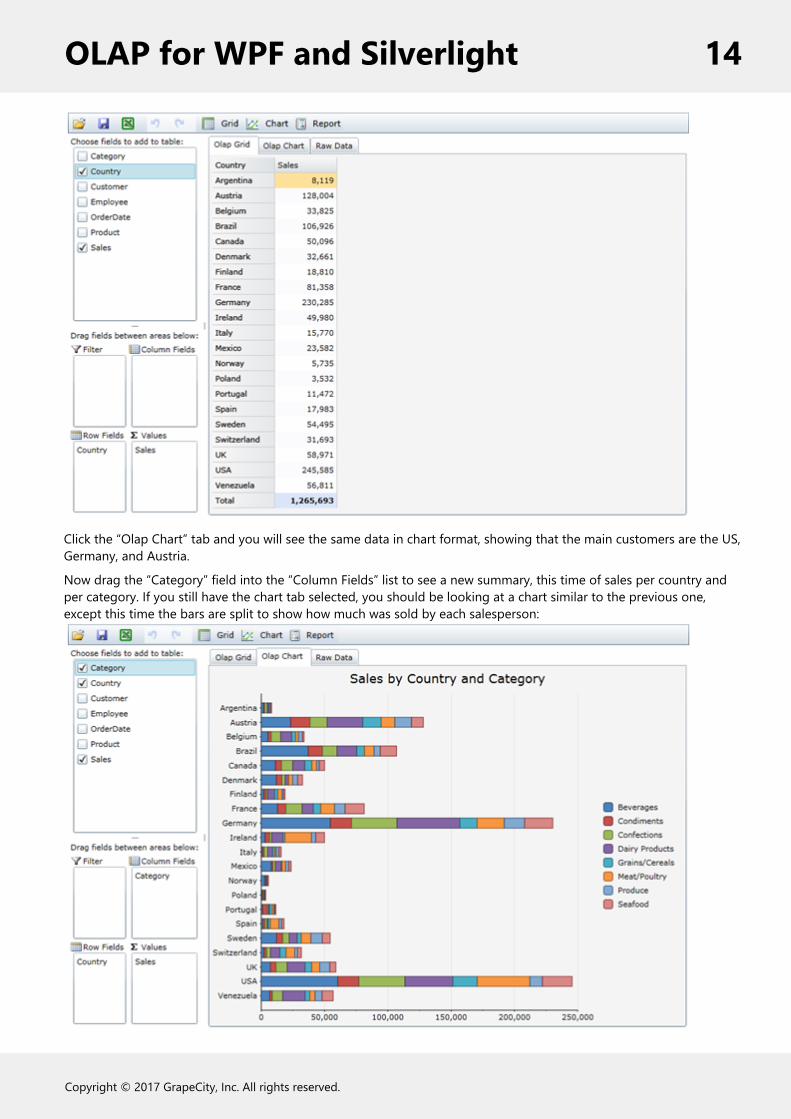
Click the “Olap Chart” tab and you will see the same data in chart format, showing that the main customers are the US,Germany, and Austria.
Now drag the “Category” field into the “Column Fields” list to see a new summary, this time of sales per country andper category. If you still have the chart tab selected, you should be looking at a chart similar to the previous one,except this time the bars are split to show how much was sold by each salesperson:
OLAP for WPF and Silverlight 14
Copyright © 2017 GrapeCity, Inc. All rights reserved.

Move the mouse over the chart and you will see tooltips that show the name of the category and the amount soldwhen you hover over the chart elements.
Now create a new view by swapping the “Category” and “Country” fields by dragging them to the opposite lists. Thiswill create a new chart that emphasizes category instead of country:
The chart shows that Beverages was the top selling category in the period being analyzed, followed closely by DairyProducts.
As we make changes to the view, the C1OlapPanel control keeps record. We can simply click the undo button inthe C1OlapPanel menu to go back to a previous view we created.
Summarizing DataLet’s create a new view to illustrate how you can easily summarize data in different ways.
This time, drag the “Employee” field to the “Row Fields” list and the “OrderDate” field to the “Column Fields” list. Theresulting view contains one column for each day when an order was placed. This is not very useful information,because there are too many columns to show any trends clearly. We would like to summarize the data by month oryear instead.
One way to do this would be to modify the source data, either by creating a new query in SQL or by using LINQ. Bothof these techniques will be described in later sections. Another way is simply to modify the parameters of the“OrderDate” field. To do this, right-click the “OrderDate” field and select the “Field Settings” menu. Then select the“Format” tab in the dialog, choose the “Custom” format, enter “yyyy”, and click OK.
The dates are now formatted and summarized by year, and the OLAP chart looks like this:
OLAP for WPF and Silverlight 15
Copyright © 2017 GrapeCity, Inc. All rights reserved.

If you wanted to check how sales are placed by month or weekday, you could simply change the format to “MMMM”or “dddd”.
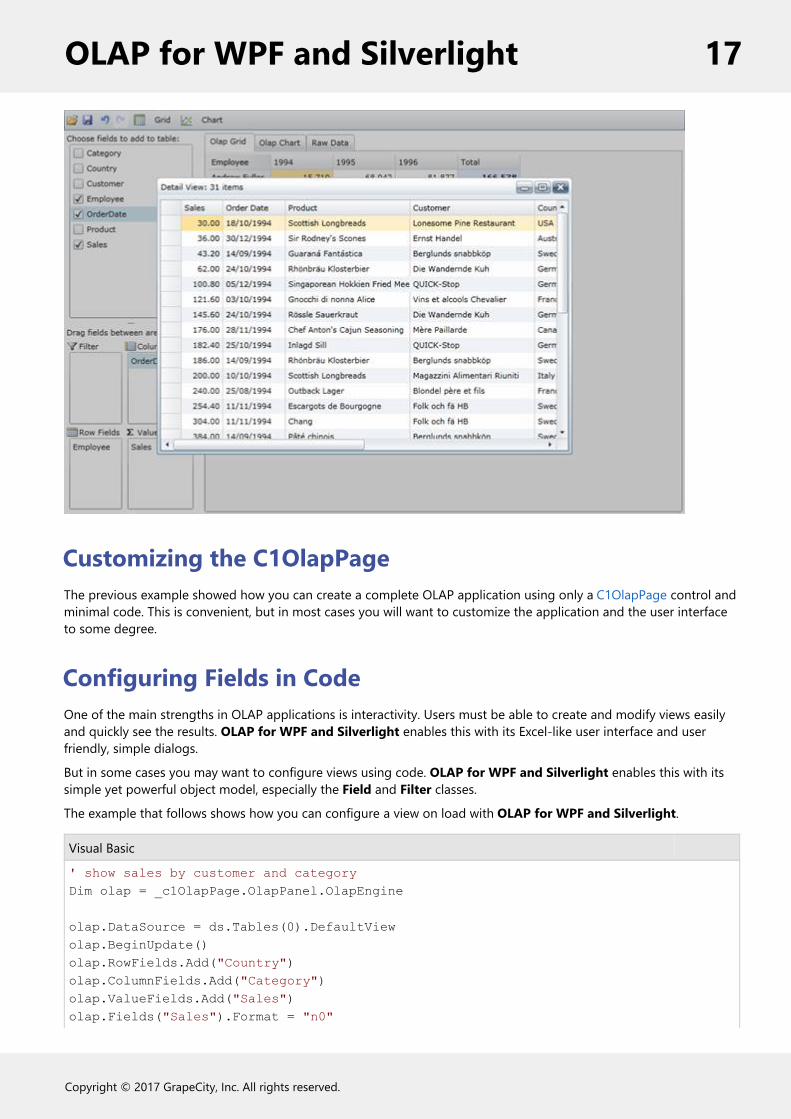
Drilling Down on the DataAs we mentioned before, each cell in the OLAP grid represents a summary of several records in the data source. Youcan see the underlying records behind each cell in the OLAP grid by double clicking it with the mouse.
To see this, click the “Olap Grid” tab and double-click the first cell on the grid, the one that represents AndrewFullers’s sales in 1994. You will see another grid showing the 31 records that were used to compute the total displayedin the Olap grid:
OLAP for WPF and Silverlight 16
Copyright © 2017 GrapeCity, Inc. All rights reserved.
Customizing the C1OlapPageThe previous example showed how you can create a complete OLAP application using only a C1OlapPage control andminimal code. This is convenient, but in most cases you will want to customize the application and the user interfaceto some degree.
Configuring Fields in CodeOne of the main strengths in OLAP applications is interactivity. Users must be able to create and modify views easilyand quickly see the results. OLAP for WPF and Silverlight enables this with its Excel-like user interface and userfriendly, simple dialogs.
But in some cases you may want to configure views using code. OLAP for WPF and Silverlight enables this with itssimple yet powerful object model, especially the Field and Filter classes.
The example that follows shows how you can configure a view on load with OLAP for WPF and Silverlight.
Visual Basic
' show sales by customer and categoryDim olap = _c1OlapPage.OlapPanel.OlapEngine
olap.DataSource = ds.Tables(0).DefaultViewolap.BeginUpdate()olap.RowFields.Add("Country")olap.ColumnFields.Add("Category")olap.ValueFields.Add("Sales")olap.Fields("Sales").Format = "n0"
OLAP for WPF and Silverlight 17
Copyright © 2017 GrapeCity, Inc. All rights reserved.
olap.EndUpdate()
C#
// show sales by customer and categoryvar olap = _c1OlapPage.OlapPanel.OlapEngine;
olap.DataSource = ds.Tables[0].DefaultView;olap.BeginUpdate();olap.RowFields.Add("Country");olap.ColumnFields.Add("Category");olap.ValueFields.Add("Sales");olap.Fields["Sales"].Format = "n0";olap.EndUpdate();
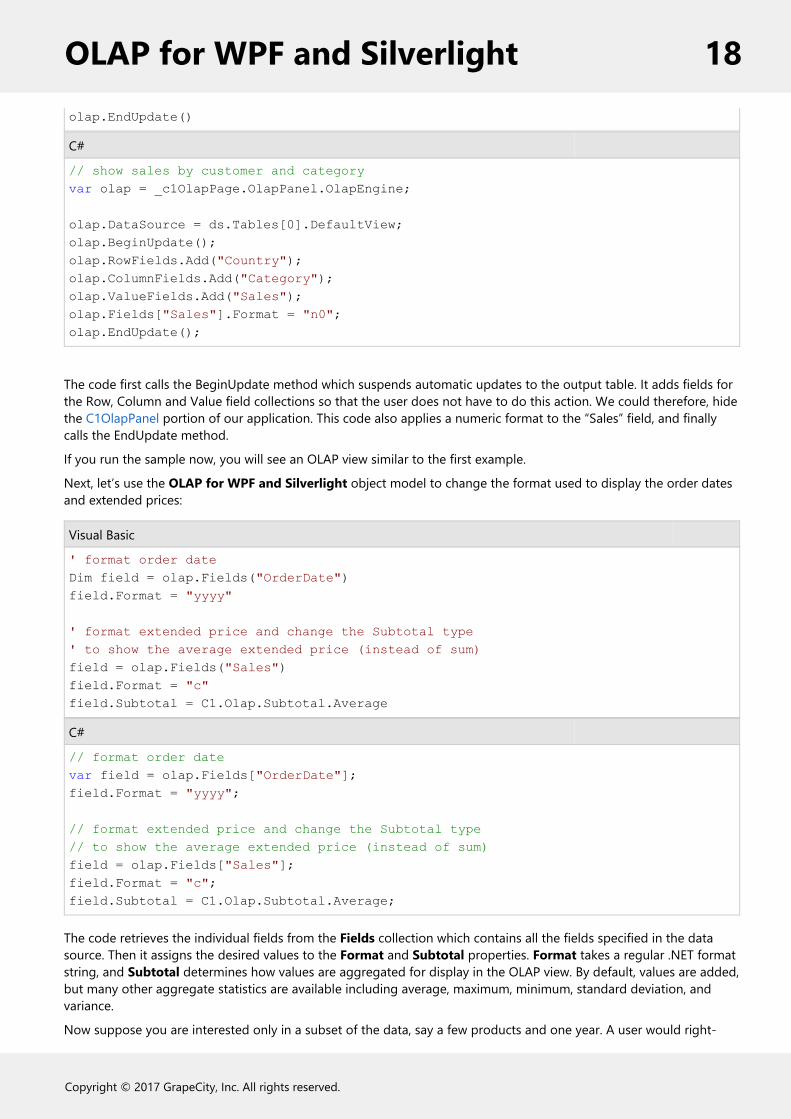
The code first calls the BeginUpdate method which suspends automatic updates to the output table. It adds fields forthe Row, Column and Value field collections so that the user does not have to do this action. We could therefore, hidethe C1OlapPanel portion of our application. This code also applies a numeric format to the “Sales” field, and finallycalls the EndUpdate method.
If you run the sample now, you will see an OLAP view similar to the first example.
Next, let’s use the OLAP for WPF and Silverlight object model to change the format used to display the order datesand extended prices:
Visual Basic
' format order dateDim field = olap.Fields("OrderDate")field.Format = "yyyy"
' format extended price and change the Subtotal type' to show the average extended price (instead of sum)field = olap.Fields("Sales")field.Format = "c"field.Subtotal = C1.Olap.Subtotal.Average
C#
// format order datevar field = olap.Fields["OrderDate"];field.Format = "yyyy";
// format extended price and change the Subtotal type// to show the average extended price (instead of sum)field = olap.Fields["Sales"];field.Format = "c";field.Subtotal = C1.Olap.Subtotal.Average;
The code retrieves the individual fields from the Fields collection which contains all the fields specified in the datasource. Then it assigns the desired values to the Format and Subtotal properties. Format takes a regular .NET formatstring, and Subtotal determines how values are aggregated for display in the OLAP view. By default, values are added,but many other aggregate statistics are available including average, maximum, minimum, standard deviation, andvariance.
Now suppose you are interested only in a subset of the data, say a few products and one year. A user would right-
OLAP for WPF and Silverlight 18
Copyright © 2017 GrapeCity, Inc. All rights reserved.
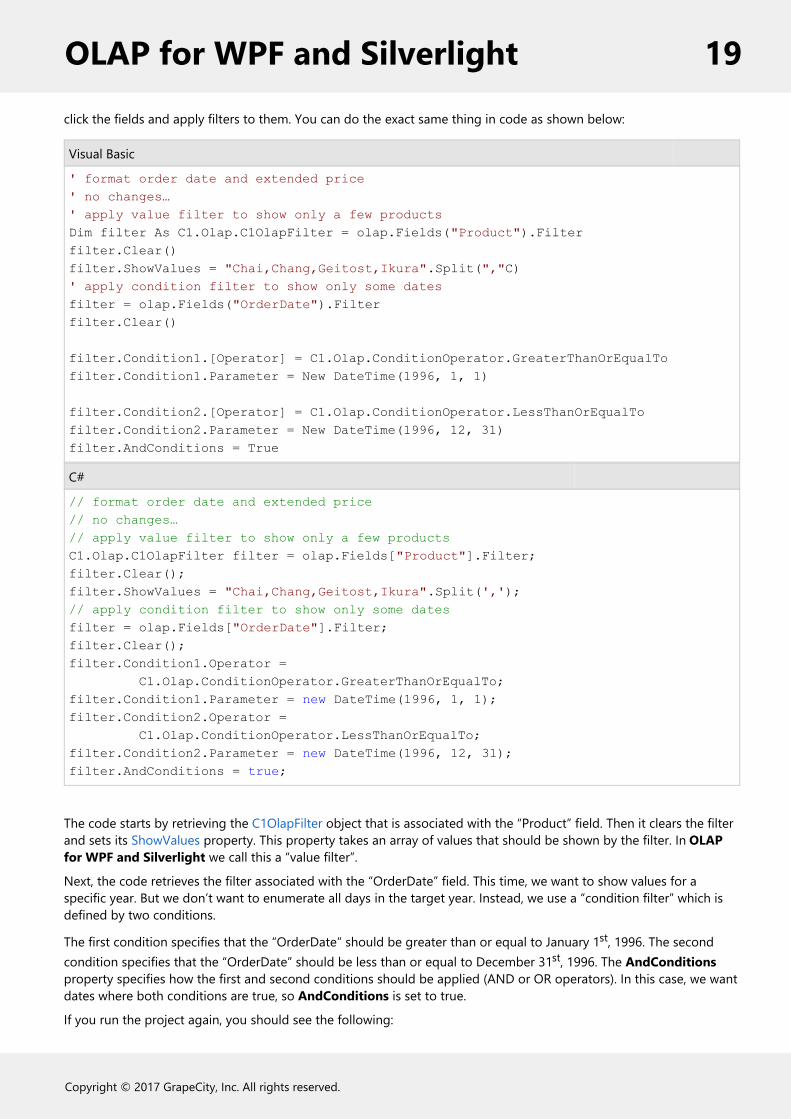
click the fields and apply filters to them. You can do the exact same thing in code as shown below:
Visual Basic
' format order date and extended price' no changes…' apply value filter to show only a few productsDim filter As C1.Olap.C1OlapFilter = olap.Fields("Product").Filterfilter.Clear()filter.ShowValues = "Chai,Chang,Geitost,Ikura".Split(","C)' apply condition filter to show only some datesfilter = olap.Fields("OrderDate").Filterfilter.Clear()
filter.Condition1.[Operator] = C1.Olap.ConditionOperator.GreaterThanOrEqualTofilter.Condition1.Parameter = New DateTime(1996, 1, 1)
filter.Condition2.[Operator] = C1.Olap.ConditionOperator.LessThanOrEqualTofilter.Condition2.Parameter = New DateTime(1996, 12, 31)filter.AndConditions = True
C#
// format order date and extended price// no changes…// apply value filter to show only a few productsC1.Olap.C1OlapFilter filter = olap.Fields["Product"].Filter;filter.Clear();filter.ShowValues = "Chai,Chang,Geitost,Ikura".Split(',');// apply condition filter to show only some datesfilter = olap.Fields["OrderDate"].Filter;filter.Clear();filter.Condition1.Operator = C1.Olap.ConditionOperator.GreaterThanOrEqualTo;filter.Condition1.Parameter = new DateTime(1996, 1, 1);filter.Condition2.Operator = C1.Olap.ConditionOperator.LessThanOrEqualTo;filter.Condition2.Parameter = new DateTime(1996, 12, 31);filter.AndConditions = true;
The code starts by retrieving the C1OlapFilter object that is associated with the “Product” field. Then it clears the filterand sets its ShowValues property. This property takes an array of values that should be shown by the filter. In OLAPfor WPF and Silverlight we call this a “value filter”.
Next, the code retrieves the filter associated with the “OrderDate” field. This time, we want to show values for aspecific year. But we don’t want to enumerate all days in the target year. Instead, we use a “condition filter” which isdefined by two conditions.
The first condition specifies that the “OrderDate” should be greater than or equal to January 1st, 1996. The secondcondition specifies that the “OrderDate” should be less than or equal to December 31st, 1996. The AndConditionsproperty specifies how the first and second conditions should be applied (AND or OR operators). In this case, we wantdates where both conditions are true, so AndConditions is set to true.
If you run the project again, you should see the following:
OLAP for WPF and Silverlight 19
Copyright © 2017 GrapeCity, Inc. All rights reserved.
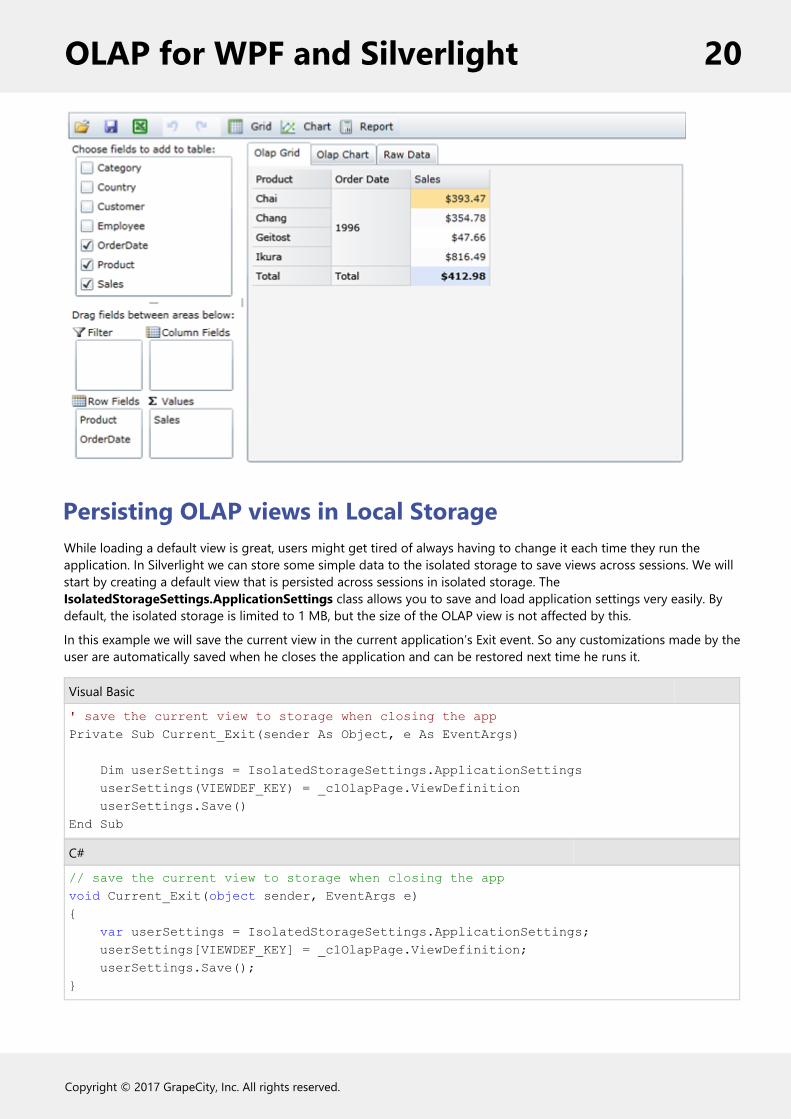
Persisting OLAP views in Local StorageWhile loading a default view is great, users might get tired of always having to change it each time they run theapplication. In Silverlight we can store some simple data to the isolated storage to save views across sessions. We willstart by creating a default view that is persisted across sessions in isolated storage. TheIsolatedStorageSettings.ApplicationSettings class allows you to save and load application settings very easily. Bydefault, the isolated storage is limited to 1 MB, but the size of the OLAP view is not affected by this.
In this example we will save the current view in the current application’s Exit event. So any customizations made by theuser are automatically saved when he closes the application and can be restored next time he runs it.
Visual Basic
' save the current view to storage when closing the appPrivate Sub Current_Exit(sender As Object, e As EventArgs)
Dim userSettings = IsolatedStorageSettings.ApplicationSettings userSettings(VIEWDEF_KEY) = _c1OlapPage.ViewDefinition userSettings.Save()End Sub
C#
// save the current view to storage when closing the appvoid Current_Exit(object sender, EventArgs e){ var userSettings = IsolatedStorageSettings.ApplicationSettings; userSettings[VIEWDEF_KEY] = _c1OlapPage.ViewDefinition; userSettings.Save();}
OLAP for WPF and Silverlight 20
Copyright © 2017 GrapeCity, Inc. All rights reserved.
Notice here we access the application settings using a unique key index. We store data from the ViewDefinitionproperty, a string in XML format which defines our view for this data set. At any point in our application we canrestore the OLAP view by reversing the second line of code. Next we will load the view from isolated storage.
Visual Basic
Const VIEWDEF_KEY As String = "C1OlapViewDefinition"
C#
const string VIEWDEF_KEY = "C1OlapViewDefinition";
Add this line of code which declares our VIEWDEF_KEY constant so we can easily use the same unique key to accessour stored data view throughout the application.
Application.Current.Exit += Current_Exit;
The above line of code attaches our exit event which will fire before the application closes. Next, we will load the viewfrom isolated storage by reversing the code used to save it.
Visual Basic
' initialize olap viewDim userSettings = IsolatedStorageSettings.ApplicationSettingsIf userSettings.Contains(VIEWDEF_KEY) Then
' load last used olap view from isolated storage
_c1OlapPage.ViewDefinition = TryCast(userSettings(VIEWDEF_KEY), String)End If
C#
// initialize olap viewvar userSettings = IsolatedStorageSettings.ApplicationSettings;if (userSettings.Contains(VIEWDEF_KEY)){ // load last used olap view from isolated storage _c1OlapPage.ViewDefinition = userSettings[VIEWDEF_KEY] as string;}
If you run the project now, you will notice that it starts with the default view created by code. If you make any changesto the view, close the application, and then re-start it, you will notice that your changes are restored.
Creating Predefined ViewsIn addition to the ViewDefinition property, which gets or sets the current view as an XML string, the C1OlapPagecontrol also exposes ReadXml and WriteXml methods that allow you to persist views to files and streams. Thesemethods are automatically invoked by the C1OlapPage when you click the “Load” and “Save” buttons in the built-inmenu.
These methods allow you to implement predefined views very easily. To do this, start by creating some views andsaving each one by pressing the “Save” button. For this sample, we will create five views showing sales by:
1. Product and Country
OLAP for WPF and Silverlight 21
Copyright © 2017 GrapeCity, Inc. All rights reserved.

2. Employee and Country3. Employee and Month4. Employee and Weekday5. Employee and Year
Once you have created and saved all the views, create a new XML file called “DefaultViews.xml” with a single“OlapViews” node, then copy and paste all your default views into this document. Next, add an “id” tag to each viewand assign each one a unique name. This name will be shown in the user interface (it is not required by C1OlapGrid).Your XML file should look like this:
XAML
<OlapViews> <C1OlapPage id="Product vs Country"> <!-- view definition omitted... --> <C1OlapPage id="Employee vs Country"> <!-- view definition omitted... --> <C1OlapPage id="Employee vs Month"> <!-- view definition omitted... --> <C1OlapPage id="Employee vs Weekday">> <!-- view definition omitted... --> <C1OlapPage id="Employee vs Year"> <!-- view definition omitted... --></OlapViews>
Now add this file to the project as a resource. To do this, add a new folder to your project and call it “Resources.” Thenright-click the Resources folder in the solution explorer, then select the “Add Existing File…” option. Select the XML fileand click OK.
Now that the view definitions are ready, we need to expose them in our menu so the user can select them. To do this,copy the following code into the project:
Visual Basic
Public Sub New()
InitializeComponent() 'no changes here '… ' get predefined views from XML resource Dim views = New Dictionary(Of String, String)() Using s = asm.GetManifestResourceStream("OlapQuickStart.Resources.OlapViews.xml") Using reader = XmlReader.Create(s)
' read predefined view definitions While reader.Read()
If reader.NodeType = XmlNodeType.Element AndAlso reader.Name = "C1OlapPage" Then
Dim id = reader.GetAttribute("id") Dim def = reader.ReadOuterXml()
OLAP for WPF and Silverlight 22
Copyright © 2017 GrapeCity, Inc. All rights reserved.
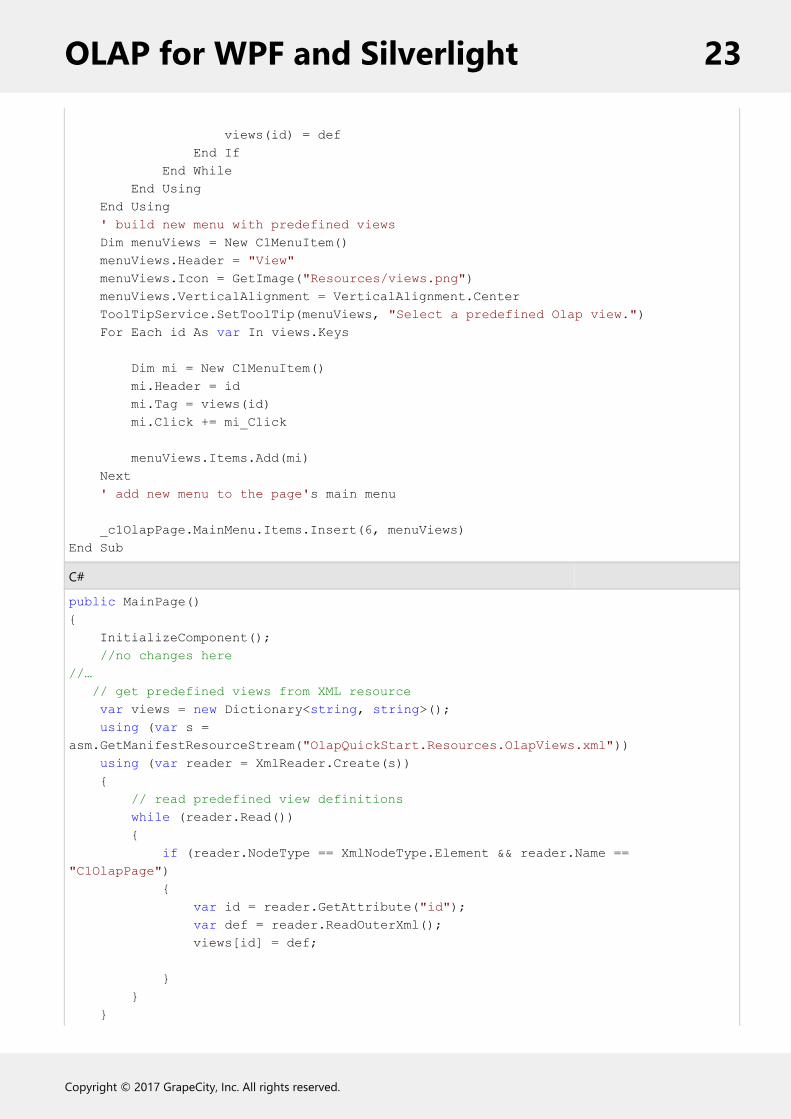
views(id) = def End If End While End Using End Using ' build new menu with predefined views Dim menuViews = New C1MenuItem() menuViews.Header = "View" menuViews.Icon = GetImage("Resources/views.png") menuViews.VerticalAlignment = VerticalAlignment.Center ToolTipService.SetToolTip(menuViews, "Select a predefined Olap view.") For Each id As var In views.Keys
Dim mi = New C1MenuItem() mi.Header = id mi.Tag = views(id) mi.Click += mi_Click
menuViews.Items.Add(mi) Next ' add new menu to the page's main menu
_c1OlapPage.MainMenu.Items.Insert(6, menuViews)End Sub
C#
public MainPage(){ InitializeComponent(); //no changes here//… // get predefined views from XML resource var views = new Dictionary<string, string>(); using (var s = asm.GetManifestResourceStream("OlapQuickStart.Resources.OlapViews.xml")) using (var reader = XmlReader.Create(s)) { // read predefined view definitions while (reader.Read()) { if (reader.NodeType == XmlNodeType.Element && reader.Name == "C1OlapPage") { var id = reader.GetAttribute("id"); var def = reader.ReadOuterXml(); views[id] = def;
} } }
OLAP for WPF and Silverlight 23
Copyright © 2017 GrapeCity, Inc. All rights reserved.
// build new menu with predefined views var menuViews = new C1MenuItem(); menuViews.Header = "View"; menuViews.Icon = GetImage("Resources/views.png"); menuViews.VerticalAlignment = VerticalAlignment.Center; ToolTipService.SetToolTip(menuViews, "Select a predefined Olap view."); foreach (var id in views.Keys) { var mi = new C1MenuItem(); mi.Header = id; mi.Tag = views[id]; mi.Click += mi_Click; menuViews.Items.Add(mi); } // add new menu to the page's main menu _c1OlapPage.MainMenu.Items.Insert(6, menuViews);}
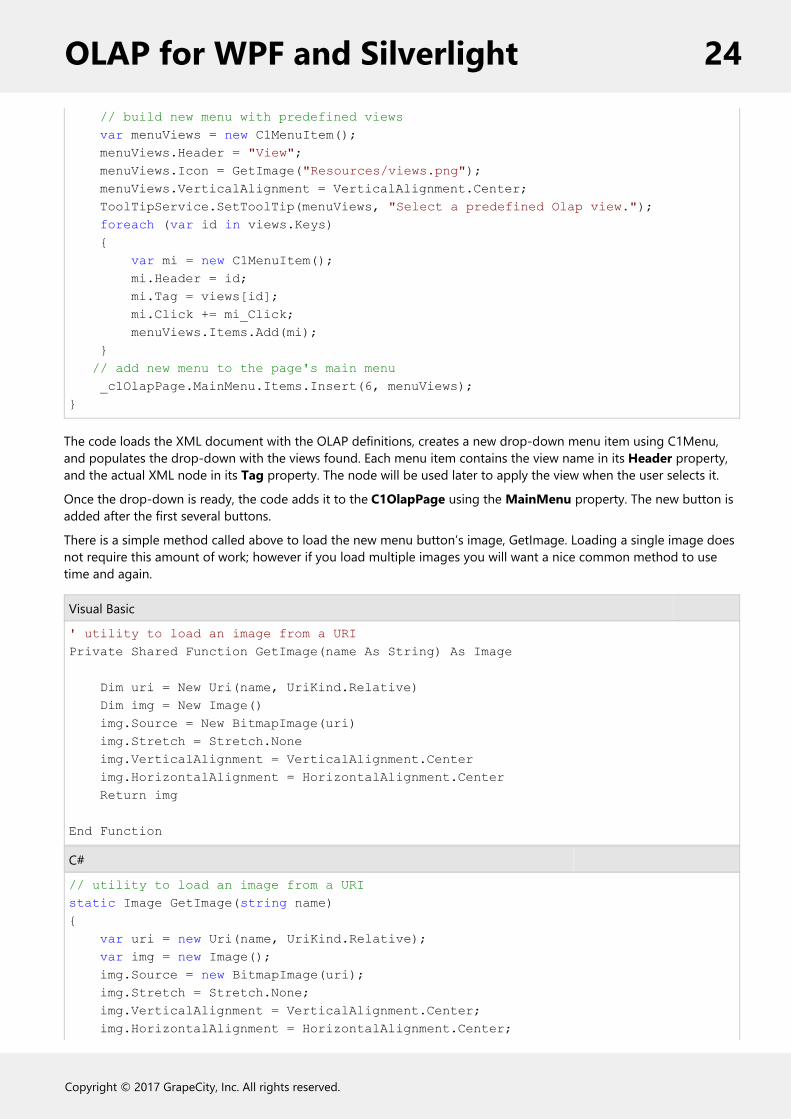
The code loads the XML document with the OLAP definitions, creates a new drop-down menu item using C1Menu,and populates the drop-down with the views found. Each menu item contains the view name in its Header property,and the actual XML node in its Tag property. The node will be used later to apply the view when the user selects it.
Once the drop-down is ready, the code adds it to the C1OlapPage using the MainMenu property. The new button isadded after the first several buttons.
There is a simple method called above to load the new menu button’s image, GetImage. Loading a single image doesnot require this amount of work; however if you load multiple images you will want a nice common method to usetime and again.
Visual Basic
' utility to load an image from a URIPrivate Shared Function GetImage(name As String) As Image
Dim uri = New Uri(name, UriKind.Relative) Dim img = New Image() img.Source = New BitmapImage(uri) img.Stretch = Stretch.None img.VerticalAlignment = VerticalAlignment.Center img.HorizontalAlignment = HorizontalAlignment.Center Return img
End Function
C#
// utility to load an image from a URIstatic Image GetImage(string name){ var uri = new Uri(name, UriKind.Relative); var img = new Image(); img.Source = new BitmapImage(uri); img.Stretch = Stretch.None; img.VerticalAlignment = VerticalAlignment.Center; img.HorizontalAlignment = HorizontalAlignment.Center;
OLAP for WPF and Silverlight 24
Copyright © 2017 GrapeCity, Inc. All rights reserved.
return img;
}
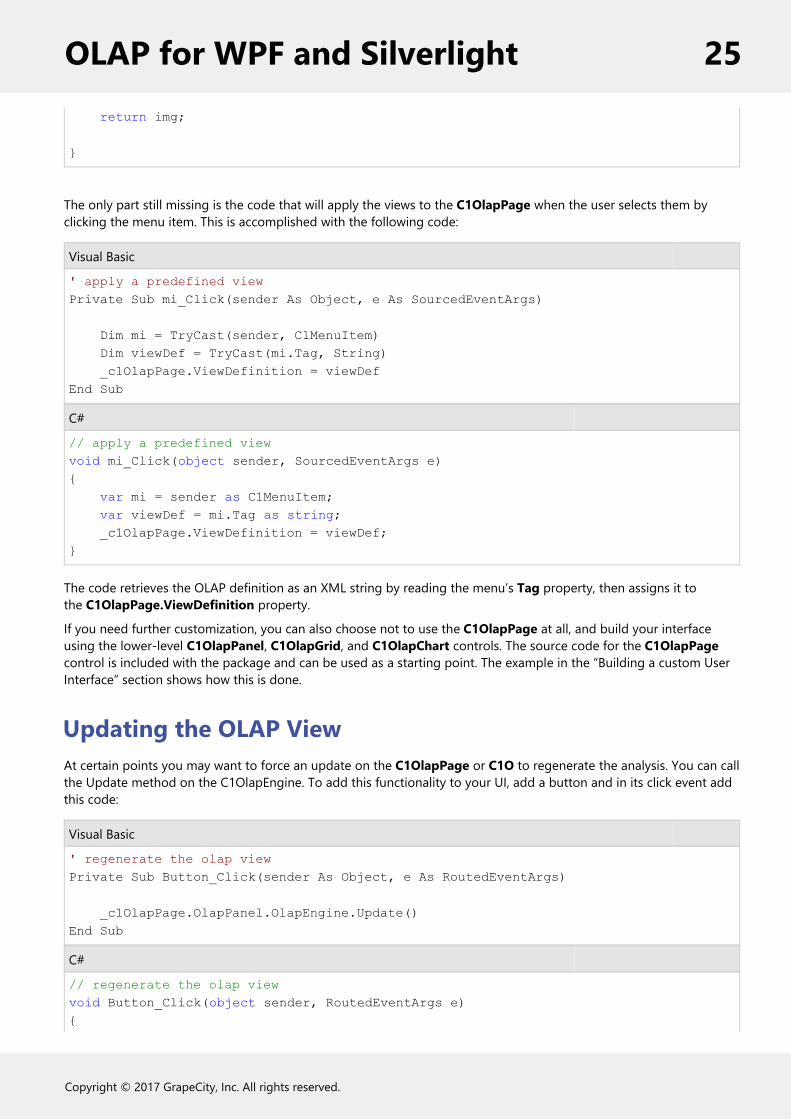
The only part still missing is the code that will apply the views to the C1OlapPage when the user selects them byclicking the menu item. This is accomplished with the following code:
Visual Basic
' apply a predefined viewPrivate Sub mi_Click(sender As Object, e As SourcedEventArgs)
Dim mi = TryCast(sender, C1MenuItem) Dim viewDef = TryCast(mi.Tag, String) _c1OlapPage.ViewDefinition = viewDefEnd Sub
C#
// apply a predefined viewvoid mi_Click(object sender, SourcedEventArgs e){ var mi = sender as C1MenuItem; var viewDef = mi.Tag as string; _c1OlapPage.ViewDefinition = viewDef;}
The code retrieves the OLAP definition as an XML string by reading the menu’s Tag property, then assigns it tothe C1OlapPage.ViewDefinition property.
If you need further customization, you can also choose not to use the C1OlapPage at all, and build your interfaceusing the lower-level C1OlapPanel, C1OlapGrid, and C1OlapChart controls. The source code for the C1OlapPagecontrol is included with the package and can be used as a starting point. The example in the “Building a custom UserInterface” section shows how this is done.
Updating the OLAP ViewAt certain points you may want to force an update on the C1OlapPage or C1O to regenerate the analysis. You can callthe Update method on the C1OlapEngine. To add this functionality to your UI, add a button and in its click event addthis code:
Visual Basic
' regenerate the olap viewPrivate Sub Button_Click(sender As Object, e As RoutedEventArgs)
_c1OlapPage.OlapPanel.OlapEngine.Update()End Sub
C#
// regenerate the olap viewvoid Button_Click(object sender, RoutedEventArgs e){
OLAP for WPF and Silverlight 25
Copyright © 2017 GrapeCity, Inc. All rights reserved.
_c1OlapPage.OlapPanel.OlapEngine.Update();}
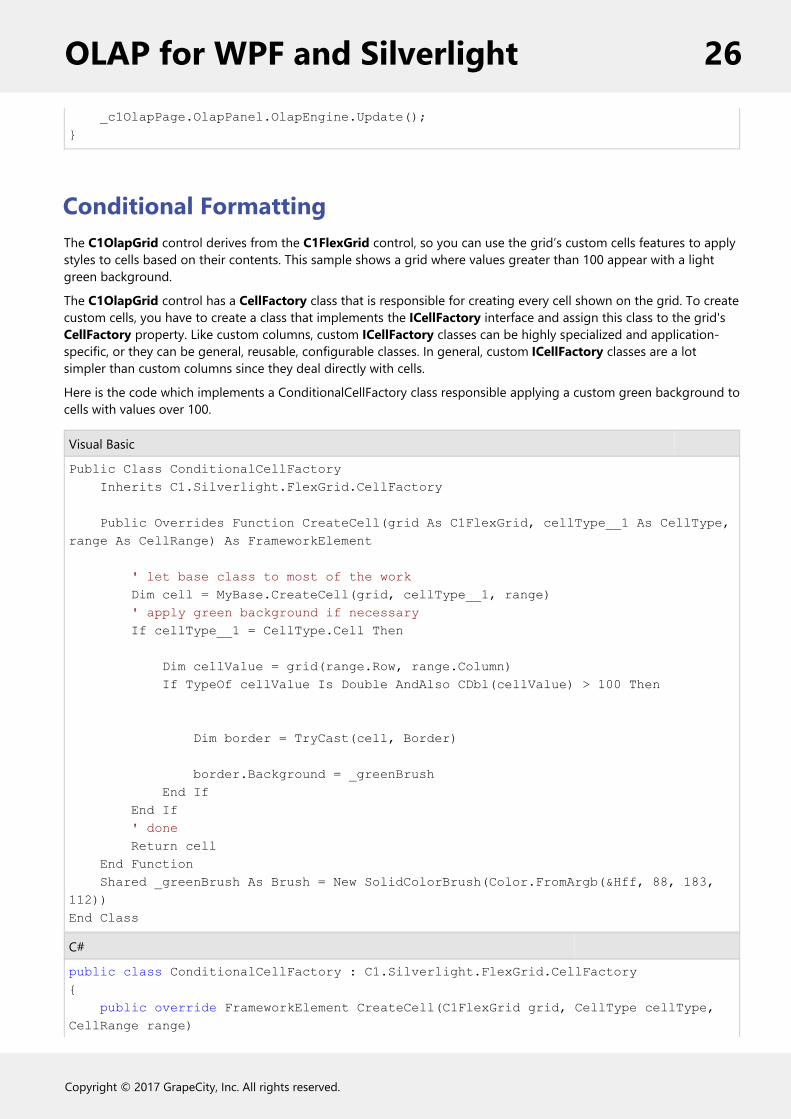
Conditional FormattingThe C1OlapGrid control derives from the C1FlexGrid control, so you can use the grid’s custom cells features to applystyles to cells based on their contents. This sample shows a grid where values greater than 100 appear with a lightgreen background.
The C1OlapGrid control has a CellFactory class that is responsible for creating every cell shown on the grid. To createcustom cells, you have to create a class that implements the ICellFactory interface and assign this class to the grid'sCellFactory property. Like custom columns, custom ICellFactory classes can be highly specialized and application-specific, or they can be general, reusable, configurable classes. In general, custom ICellFactory classes are a lotsimpler than custom columns since they deal directly with cells.
Here is the code which implements a ConditionalCellFactory class responsible applying a custom green background tocells with values over 100.
Visual Basic
Public Class ConditionalCellFactory Inherits C1.Silverlight.FlexGrid.CellFactory
Public Overrides Function CreateCell(grid As C1FlexGrid, cellType__1 As CellType, range As CellRange) As FrameworkElement
' let base class to most of the work Dim cell = MyBase.CreateCell(grid, cellType__1, range) ' apply green background if necessary If cellType__1 = CellType.Cell Then
Dim cellValue = grid(range.Row, range.Column) If TypeOf cellValue Is Double AndAlso CDbl(cellValue) > 100 Then
Dim border = TryCast(cell, Border)
border.Background = _greenBrush End If End If ' done Return cell End Function Shared _greenBrush As Brush = New SolidColorBrush(Color.FromArgb(&Hff, 88, 183, 112))End Class
C#
public class ConditionalCellFactory : C1.Silverlight.FlexGrid.CellFactory{ public override FrameworkElement CreateCell(C1FlexGrid grid, CellType cellType, CellRange range)
OLAP for WPF and Silverlight 26
Copyright © 2017 GrapeCity, Inc. All rights reserved.

{ // let base class to most of the work var cell = base.CreateCell(grid, cellType, range); // apply green background if necessary if (cellType == CellType.Cell) { var cellValue = grid[range.Row, range.Column]; if (cellValue is double && (double)cellValue > 100)
{ var border = cell as Border; border.Background = _greenBrush; } } // done return cell; } static Brush _greenBrush = new SolidColorBrush(Color.FromArgb(0xff, 88, 183, 112));}
And here is the code required to use this on our C1OlapGrid:
Visual Basic
' apply conditional formatting to grid cells_c1OlapPage.OlapGrid.CellFactory = New ConditionalCellFactory()
C#
// apply conditional formatting to grid cells_c1OlapPage.OlapGrid.CellFactory = new ConditionalCellFactory();
If you were to add this code to a previous example, you would see how this appears at run-time.
OLAP for WPF and Silverlight 27
Copyright © 2017 GrapeCity, Inc. All rights reserved.
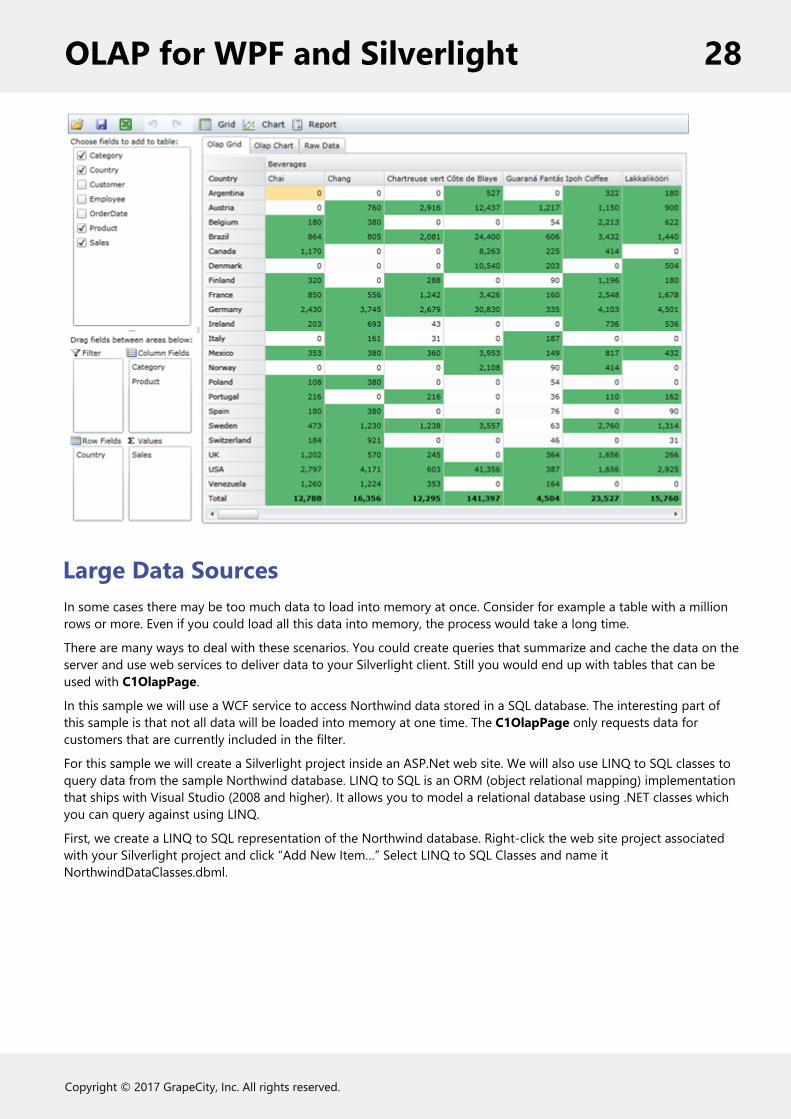
Large Data SourcesIn some cases there may be too much data to load into memory at once. Consider for example a table with a millionrows or more. Even if you could load all this data into memory, the process would take a long time.
There are many ways to deal with these scenarios. You could create queries that summarize and cache the data on theserver and use web services to deliver data to your Silverlight client. Still you would end up with tables that can beused with C1OlapPage.
In this sample we will use a WCF service to access Northwind data stored in a SQL database. The interesting part ofthis sample is that not all data will be loaded into memory at one time. The C1OlapPage only requests data forcustomers that are currently included in the filter.
For this sample we will create a Silverlight project inside an ASP.Net web site. We will also use LINQ to SQL classes toquery data from the sample Northwind database. LINQ to SQL is an ORM (object relational mapping) implementationthat ships with Visual Studio (2008 and higher). It allows you to model a relational database using .NET classes whichyou can query against using LINQ.
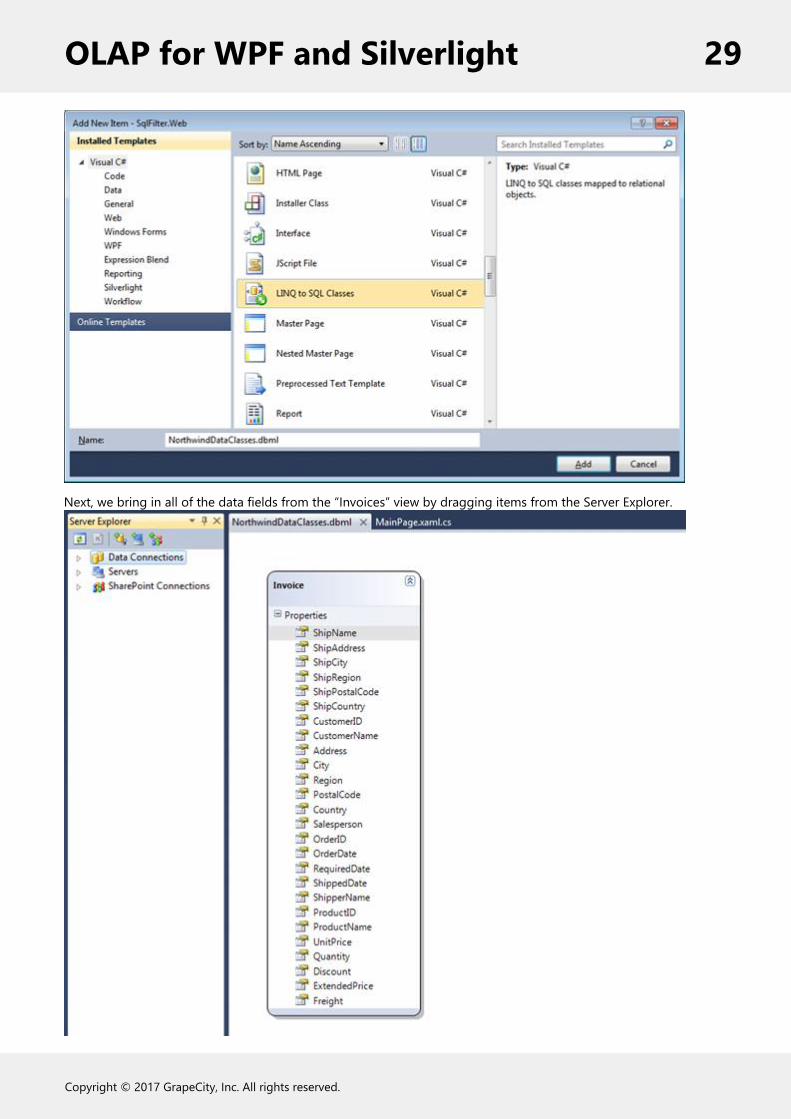
First, we create a LINQ to SQL representation of the Northwind database. Right-click the web site project associatedwith your Silverlight project and click “Add New Item…” Select LINQ to SQL Classes and name itNorthwindDataClasses.dbml.
OLAP for WPF and Silverlight 28
Copyright © 2017 GrapeCity, Inc. All rights reserved.
Next, we bring in all of the data fields from the “Invoices” view by dragging items from the Server Explorer.
OLAP for WPF and Silverlight 29
Copyright © 2017 GrapeCity, Inc. All rights reserved.

Then we create a WCF Service that queries this data using LINQ and our LINQ to SQL Classes (NorthwindDataClasses)just created. Right-click the web site project node and click “Add New Item…” Select WCF Service and name itNorthwindDataService.svc.
Replace the code in NorthwindDataService.svc with the following code:
Visual Basic
Imports System.LinqImports System.Runtime.SerializationImports System.ServiceModelImports System.ServiceModel.ActivationImports System.Collections.GenericImports System.TextNamespace SqlFilter.Web <ServiceContract([Namespace] := "")> _ <AspNetCompatibilityRequirements(RequirementsMode := AspNetCompatibilityRequirementsMode.Allowed)> _ Public Class NorthwindDataService ''' <summary>/// Get all invoices. /// </summary> [OperationContract] Public Function GetInvoices() As List(Of Invoice) Dim ctx = New NorthwindDataClassesDataContext() Dim invoices = From inv In ctx.Invoicesinv Return invoices.ToList() End Function ''' <summary>/// Get all customers. /// </summary> [OperationContract] Public Function GetCustomers() As List(Of String) Dim ctx = New NorthwindDataClassesDataContext() Dim customers = (From inv In ctx.Invoicesinv.CustomerName).Distinct() Return customers.ToList() End Function ''' <summary>/// Get all invoices for a specific set of customers. /// </summary> [OperationContract] Public Function GetCustomerInvoices(ParamArray customers As String()) As List(Of Invoice) ' build hashset var hash = new HashSet<string>(); For Each c As String In customers hash.Add(c) Next Dim customerList As String() = hash.ToArray() ' get invoices for customers in the list var ctx = new NorthwindDataClassesDataContext(); Dim invoices = From inv In ctx.Invoices Where customerList.Contains(inv.CustomerName)inv Return invoices.ToList() End Function End ClassEnd Namespace
C#
using System;using System.Linq;
OLAP for WPF and Silverlight 30
Copyright © 2017 GrapeCity, Inc. All rights reserved.
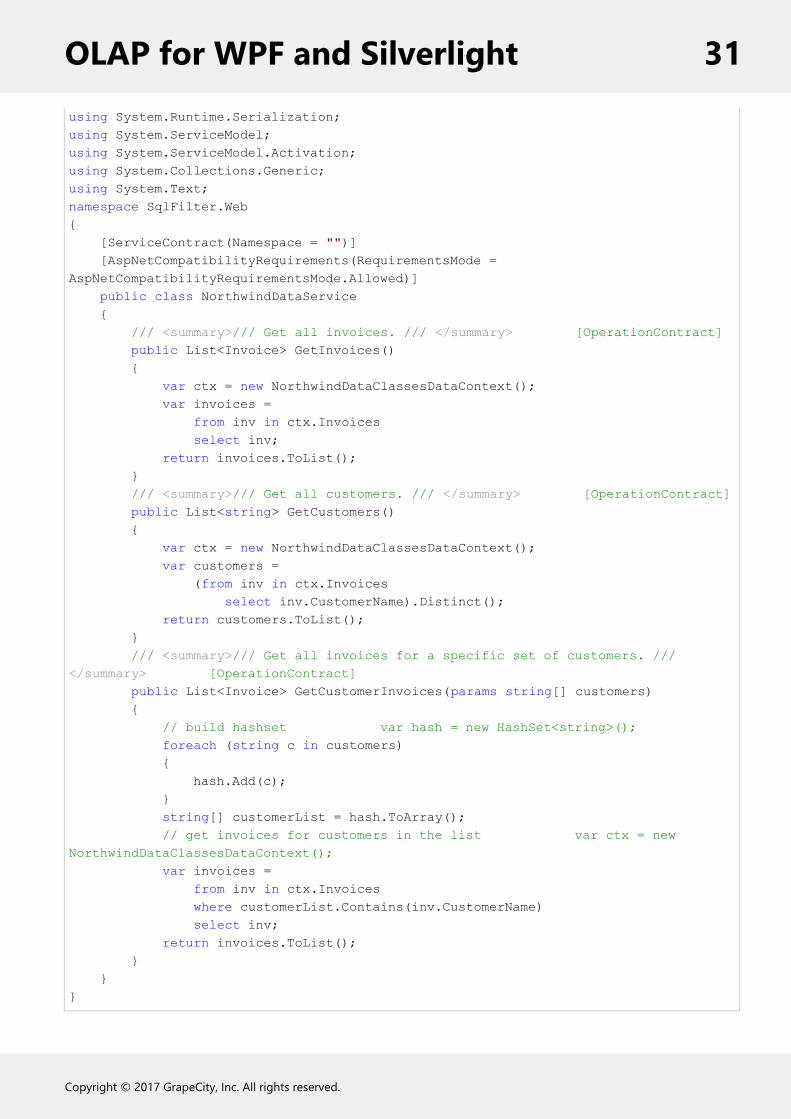
using System.Runtime.Serialization;using System.ServiceModel;using System.ServiceModel.Activation;using System.Collections.Generic;using System.Text;namespace SqlFilter.Web{ [ServiceContract(Namespace = "")] [AspNetCompatibilityRequirements(RequirementsMode = AspNetCompatibilityRequirementsMode.Allowed)] public class NorthwindDataService { /// <summary>/// Get all invoices. /// </summary> [OperationContract] public List<Invoice> GetInvoices() { var ctx = new NorthwindDataClassesDataContext(); var invoices = from inv in ctx.Invoices select inv; return invoices.ToList(); } /// <summary>/// Get all customers. /// </summary> [OperationContract] public List<string> GetCustomers() { var ctx = new NorthwindDataClassesDataContext(); var customers = (from inv in ctx.Invoices select inv.CustomerName).Distinct(); return customers.ToList(); } /// <summary>/// Get all invoices for a specific set of customers. /// </summary> [OperationContract] public List<Invoice> GetCustomerInvoices(params string[] customers) { // build hashset var hash = new HashSet<string>(); foreach (string c in customers) { hash.Add(c); } string[] customerList = hash.ToArray(); // get invoices for customers in the list var ctx = new NorthwindDataClassesDataContext(); var invoices = from inv in ctx.Invoices where customerList.Contains(inv.CustomerName) select inv; return invoices.ToList(); } }}
OLAP for WPF and Silverlight 31
Copyright © 2017 GrapeCity, Inc. All rights reserved.

Notice here we have defined 3 methods for our web service. The first two are simple Get methods which return a listof items using LINQ and our LINQ to SQL classes created earlier. The GetCustomerInvoices method is special in that itaccepts an array of customers as parameter. This is our filter that will be defined on the client in ourSilverlight C1OlapGrid project.
Before moving to the Silverlight project we must build the web site project, and add a reference to our web service. Toadd the reference, right-click the Silverlight project node in the Solution Explorer and click “Add Service Reference.”Then click “Discover” and select the NorthwindDataService.svc. Rename it “NorthwindDataServiceReference” and clickOK.
Now that the data source is ready, we need to connect it to C1OlapPage to ensure that:
1. The user can see all the customers in the filter (not just the ones that are currently loaded) and2. When the user modifies the filter, new data is loaded to show any new customers requested.
Before we accomplish these tasks we should set up our UI. In MainPage.XAML, add a C1OlapPage control and acouple of TextBlocks which will be used as status strips:
XAML
<Grid x:Name="LayoutRoot"><Grid.RowDefinitions> <RowDefinition /> <RowDefinition Height="Auto"/></Grid.RowDefinitions><olap:C1OlapPage x:Name="_c1OlapPage"/><TextBlock x:Name="_lblLoading"FontSize="24"Opacity=".5"Text="Loading data..."HorizontalAlignment="Center"VerticalAlignment="Center"/><TextBlock x:Name="_lblStatus"Text="Ready"HorizontalAlignment="Right"Grid.Row="1"/></Grid>
Then add the following code to the form:
Visula Basic
Dim _allCustomers As ObservableCollection(Of String)Dim _invoices As ObservableCollection(Of NorthwindDataServiceReference.Invoice)Dim _customerFilter As C1OlapFilter
C#
ObservableCollection<string> _allCustomers;ObservableCollection<NorthwindDataServiceReference.Invoice> _invoices;C1OlapFilter _customerFilter;
These fields will contain a complete list of all the customers in the database, a list of the customers currently selectedby the user, and the maximum number of customers that can be selected at any time.
We need to assign the complete list of customers to the C1OlapField.Values property. This property contains a list ofthe values that are displayed in the filter. By default, C1OlapPage populates this list with values found in the raw data.In this case, the raw data will only contain a partial list, so we need to provide the complete version instead. The_allCustomers ObservableCollection will hold our entire collection of possible customers for the user to select among.The C1OlapPage will actually work with the _invoices collection, which will be the dataset filtered by the selectedcustomers.
Replace the following code in MainPage():
OLAP for WPF and Silverlight 32
Copyright © 2017 GrapeCity, Inc. All rights reserved.
Visual Basic
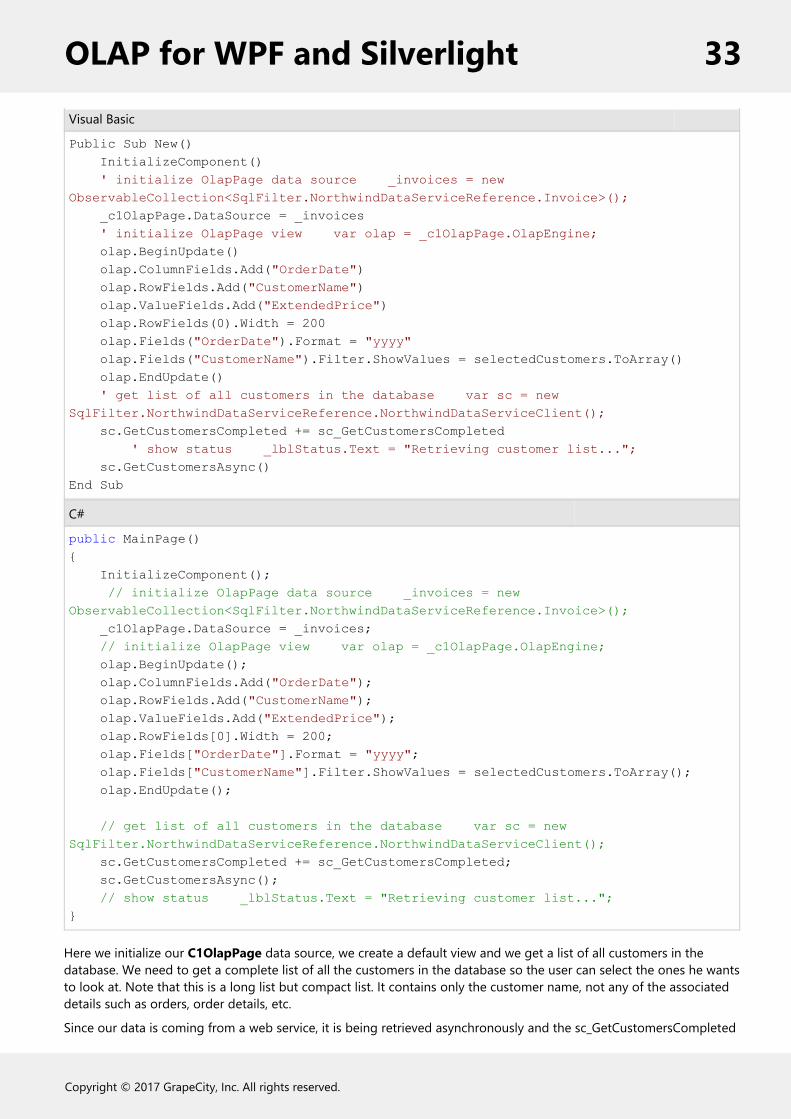
Public Sub New() InitializeComponent() ' initialize OlapPage data source _invoices = new ObservableCollection<SqlFilter.NorthwindDataServiceReference.Invoice>(); _c1OlapPage.DataSource = _invoices ' initialize OlapPage view var olap = _c1OlapPage.OlapEngine; olap.BeginUpdate() olap.ColumnFields.Add("OrderDate") olap.RowFields.Add("CustomerName") olap.ValueFields.Add("ExtendedPrice") olap.RowFields(0).Width = 200 olap.Fields("OrderDate").Format = "yyyy" olap.Fields("CustomerName").Filter.ShowValues = selectedCustomers.ToArray() olap.EndUpdate() ' get list of all customers in the database var sc = new SqlFilter.NorthwindDataServiceReference.NorthwindDataServiceClient(); sc.GetCustomersCompleted += sc_GetCustomersCompleted ' show status _lblStatus.Text = "Retrieving customer list..."; sc.GetCustomersAsync()End Sub
C#
public MainPage(){ InitializeComponent(); // initialize OlapPage data source _invoices = new ObservableCollection<SqlFilter.NorthwindDataServiceReference.Invoice>(); _c1OlapPage.DataSource = _invoices; // initialize OlapPage view var olap = _c1OlapPage.OlapEngine; olap.BeginUpdate(); olap.ColumnFields.Add("OrderDate"); olap.RowFields.Add("CustomerName"); olap.ValueFields.Add("ExtendedPrice"); olap.RowFields[0].Width = 200; olap.Fields["OrderDate"].Format = "yyyy"; olap.Fields["CustomerName"].Filter.ShowValues = selectedCustomers.ToArray(); olap.EndUpdate(); // get list of all customers in the database var sc = new SqlFilter.NorthwindDataServiceReference.NorthwindDataServiceClient(); sc.GetCustomersCompleted += sc_GetCustomersCompleted; sc.GetCustomersAsync(); // show status _lblStatus.Text = "Retrieving customer list...";}
Here we initialize our C1OlapPage data source, we create a default view and we get a list of all customers in thedatabase. We need to get a complete list of all the customers in the database so the user can select the ones he wantsto look at. Note that this is a long list but compact list. It contains only the customer name, not any of the associateddetails such as orders, order details, etc.
Since our data is coming from a web service, it is being retrieved asynchronously and the sc_GetCustomersCompleted
OLAP for WPF and Silverlight 33
Copyright © 2017 GrapeCity, Inc. All rights reserved.

event is fired when the data has finished loading.
Visula Basic
Private Sub sc_GetCustomersCompleted(sender As Object, e As SqlFilter.NorthwindDataServiceReference.GetCustomersCompletedEventArgs) ' hide 'loading' message _lblLoading.Visibility = Visibility.Collapsed; ' monitor CustomerName filter _customerFilter = _c1OlapPage.OlapEngine.Fields["CustomerName"].Filter; _customerFilter.PropertyChanged += filter_PropertyChanged ' monitor view definition to ensure CustomerName field is always active _c1OlapPage.ViewDefinitionChanged += _c1OlapPage_ViewDefinitionChanged; ' show available customers in the "CustomerName" field filter _allCustomers = e.Result; _customerFilter.Values = _allCustomers ' go get the data GetData();End Sub
C#
void sc_GetCustomersCompleted(object sender, SqlFilter.NorthwindDataServiceReference.GetCustomersCompletedEventArgs e){ // hide 'loading' message _lblLoading.Visibility = Visibility.Collapsed; // monitor CustomerName filter _customerFilter = _c1OlapPage.OlapEngine.Fields["CustomerName"].Filter; _customerFilter.PropertyChanged += filter_PropertyChanged; // monitor view definition to ensure CustomerName field is always active _c1OlapPage.ViewDefinitionChanged += _c1OlapPage_ViewDefinitionChanged; // show available customers in the "CustomerName" field filter _allCustomers = e.Result; _customerFilter.Values = _allCustomers; // go get the data GetData();}
This event gets the complete list of customers in the database. We store this to show in the filter. We need to listen tothe C1OlapField.PropertyChanged event, which fires when the user modifies any field properties including the filter.When this happens, we retrieve the list of customers selected by the user and pass that list to the data source.
And here is the event handler that updates the data source when the filter changes:
Visual Basic
' CustomerName field filter has changed: get new datavoid filter_PropertyChanged(object sender, System.ComponentModel.PropertyChangedEventArgs e)If True Then GetData()End If
C#
// CustomerName field filter has changed: get new datavoid filter_PropertyChanged(object sender, System.ComponentModel.PropertyChangedEventArgs e)
OLAP for WPF and Silverlight 34
Copyright © 2017 GrapeCity, Inc. All rights reserved.
{ GetData();}
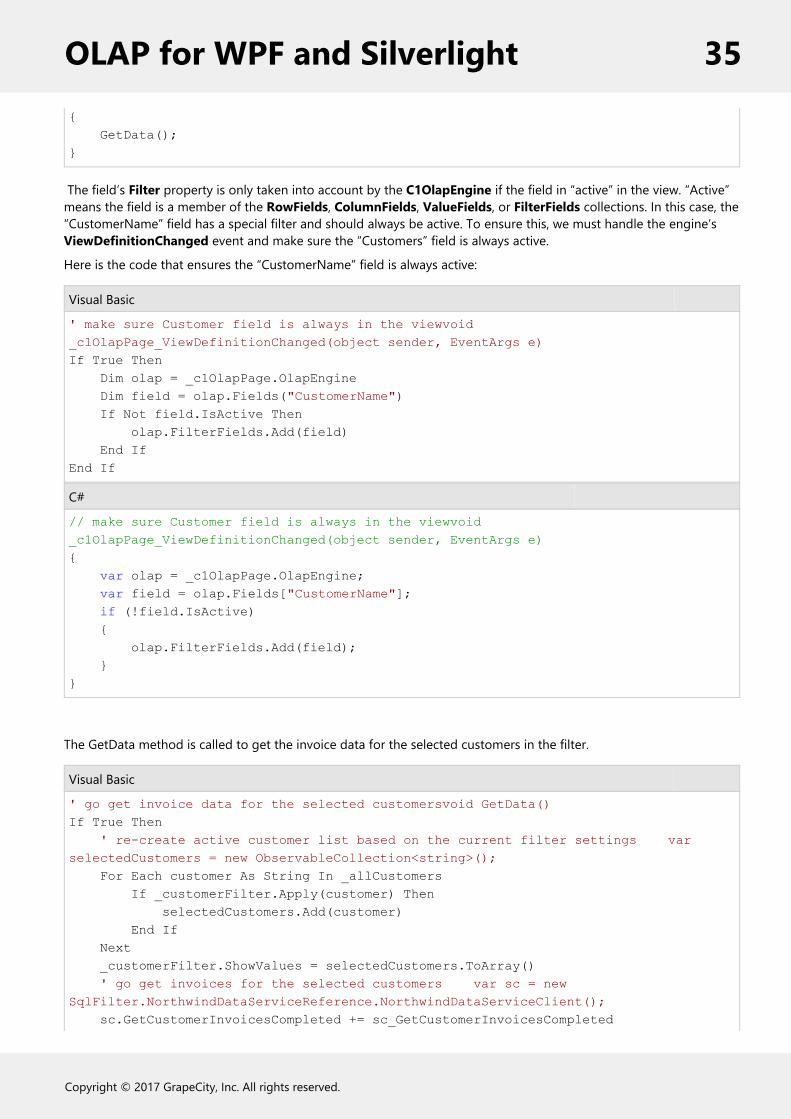
The field’s Filter property is only taken into account by the C1OlapEngine if the field in “active” in the view. “Active”means the field is a member of the RowFields, ColumnFields, ValueFields, or FilterFields collections. In this case, the“CustomerName” field has a special filter and should always be active. To ensure this, we must handle the engine’sViewDefinitionChanged event and make sure the “Customers” field is always active.
Here is the code that ensures the “CustomerName” field is always active:
Visual Basic
' make sure Customer field is always in the viewvoid _c1OlapPage_ViewDefinitionChanged(object sender, EventArgs e)If True Then Dim olap = _c1OlapPage.OlapEngine Dim field = olap.Fields("CustomerName") If Not field.IsActive Then olap.FilterFields.Add(field) End IfEnd If
C#
// make sure Customer field is always in the viewvoid _c1OlapPage_ViewDefinitionChanged(object sender, EventArgs e){ var olap = _c1OlapPage.OlapEngine; var field = olap.Fields["CustomerName"]; if (!field.IsActive) { olap.FilterFields.Add(field); }}
The GetData method is called to get the invoice data for the selected customers in the filter.
Visual Basic
' go get invoice data for the selected customersvoid GetData()If True Then ' re-create active customer list based on the current filter settings var selectedCustomers = new ObservableCollection<string>(); For Each customer As String In _allCustomers If _customerFilter.Apply(customer) Then selectedCustomers.Add(customer) End If Next _customerFilter.ShowValues = selectedCustomers.ToArray() ' go get invoices for the selected customers var sc = new SqlFilter.NorthwindDataServiceReference.NorthwindDataServiceClient(); sc.GetCustomerInvoicesCompleted += sc_GetCustomerInvoicesCompleted
OLAP for WPF and Silverlight 35
Copyright © 2017 GrapeCity, Inc. All rights reserved.
sc.GetCustomerInvoicesAsync(selectedCustomers) ' show status _lblStatus.Text = string.Format("Retrieving invoices for {0} customers...", selectedCustomers.Count);End If
C#
// go get invoice data for the selected customersvoid GetData(){ // re-create active customer list based on the current filter settings var selectedCustomers = new ObservableCollection<string>(); foreach (string customer in _allCustomers) { if (_customerFilter.Apply(customer)) { selectedCustomers.Add(customer); } } _customerFilter.ShowValues = selectedCustomers.ToArray(); // go get invoices for the selected customers var sc = new SqlFilter.NorthwindDataServiceReference.NorthwindDataServiceClient(); sc.GetCustomerInvoicesCompleted += sc_GetCustomerInvoicesCompleted; sc.GetCustomerInvoicesAsync(selectedCustomers); // show status _lblStatus.Text = string.Format("Retrieving invoices for {0} customers...", selectedCustomers.Count);}
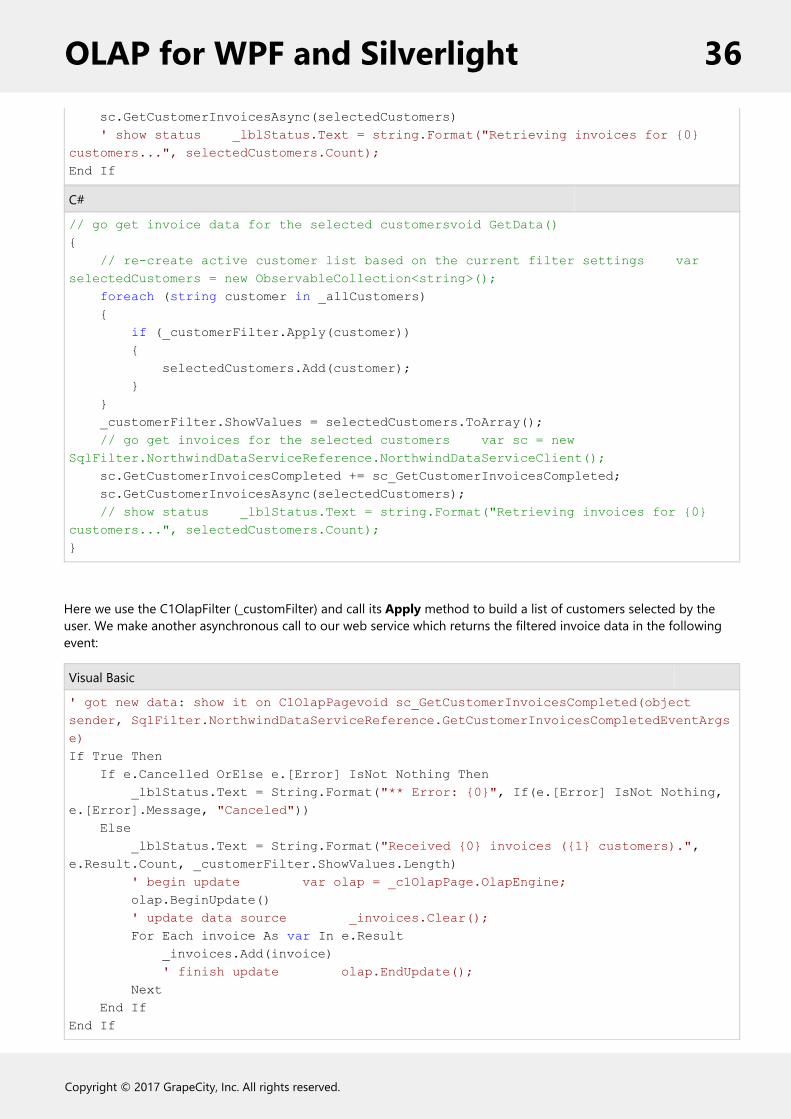
Here we use the C1OlapFilter (_customFilter) and call its Apply method to build a list of customers selected by theuser. We make another asynchronous call to our web service which returns the filtered invoice data in the followingevent:
Visual Basic
' got new data: show it on C1OlapPagevoid sc_GetCustomerInvoicesCompleted(object sender, SqlFilter.NorthwindDataServiceReference.GetCustomerInvoicesCompletedEventArgs e)If True Then If e.Cancelled OrElse e.[Error] IsNot Nothing Then _lblStatus.Text = String.Format("** Error: {0}", If(e.[Error] IsNot Nothing, e.[Error].Message, "Canceled")) Else _lblStatus.Text = String.Format("Received {0} invoices ({1} customers).", e.Result.Count, _customerFilter.ShowValues.Length) ' begin update var olap = _c1OlapPage.OlapEngine; olap.BeginUpdate() ' update data source _invoices.Clear(); For Each invoice As var In e.Result _invoices.Add(invoice) ' finish update olap.EndUpdate(); Next End IfEnd If
OLAP for WPF and Silverlight 36
Copyright © 2017 GrapeCity, Inc. All rights reserved.
C#
// got new data: show it on C1OlapPagevoid sc_GetCustomerInvoicesCompleted(object sender, SqlFilter.NorthwindDataServiceReference.GetCustomerInvoicesCompletedEventArgs e){ if (e.Cancelled || e.Error != null) { _lblStatus.Text = string.Format("** Error: {0}", e.Error != null ? e.Error.Message : "Canceled"); } else { _lblStatus.Text = string.Format("Received {0} invoices ({1} customers).", e.Result.Count, _customerFilter.ShowValues.Length); // begin update var olap = _c1OlapPage.OlapEngine; olap.BeginUpdate(); // update data source _invoices.Clear(); foreach (var invoice in e.Result) { _invoices.Add(invoice); } // finish update olap.EndUpdate(); }}
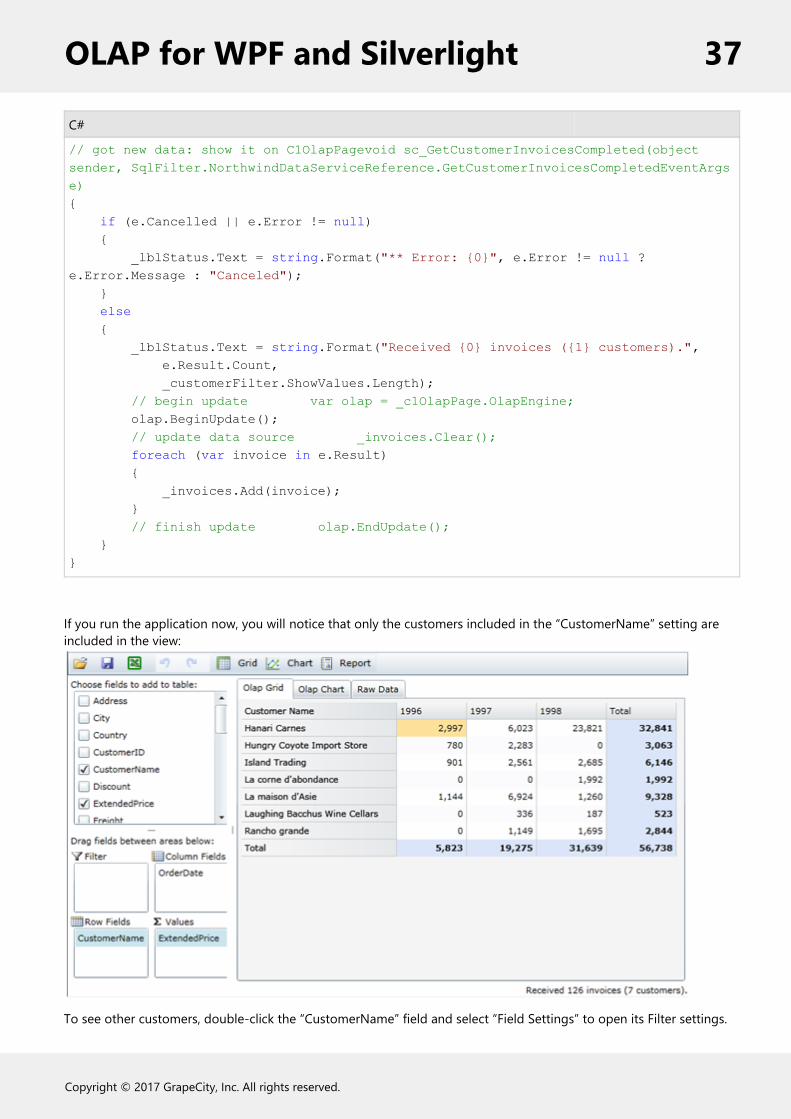
If you run the application now, you will notice that only the customers included in the “CustomerName” setting areincluded in the view:
To see other customers, double-click the “CustomerName” field and select “Field Settings” to open its Filter settings.
OLAP for WPF and Silverlight 37
Copyright © 2017 GrapeCity, Inc. All rights reserved.
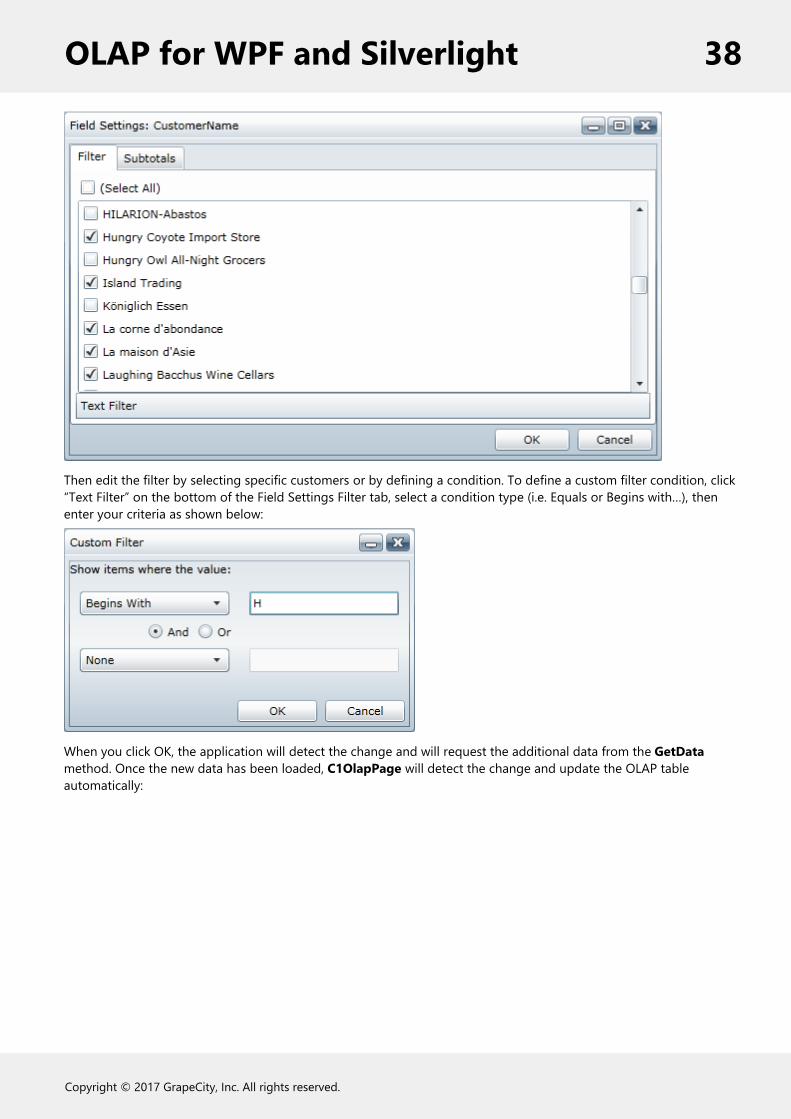
Then edit the filter by selecting specific customers or by defining a condition. To define a custom filter condition, click“Text Filter” on the bottom of the Field Settings Filter tab, select a condition type (i.e. Equals or Begins with…), thenenter your criteria as shown below:
When you click OK, the application will detect the change and will request the additional data from the GetDatamethod. Once the new data has been loaded, C1OlapPage will detect the change and update the OLAP tableautomatically:
OLAP for WPF and Silverlight 38
Copyright © 2017 GrapeCity, Inc. All rights reserved.
See the included sample “SqlFilter” for the full implementation described in the previous sections. We can extend thissample to also store the OLAP view with filters in local storage. See Persisting OLAP Views in Local Storage.
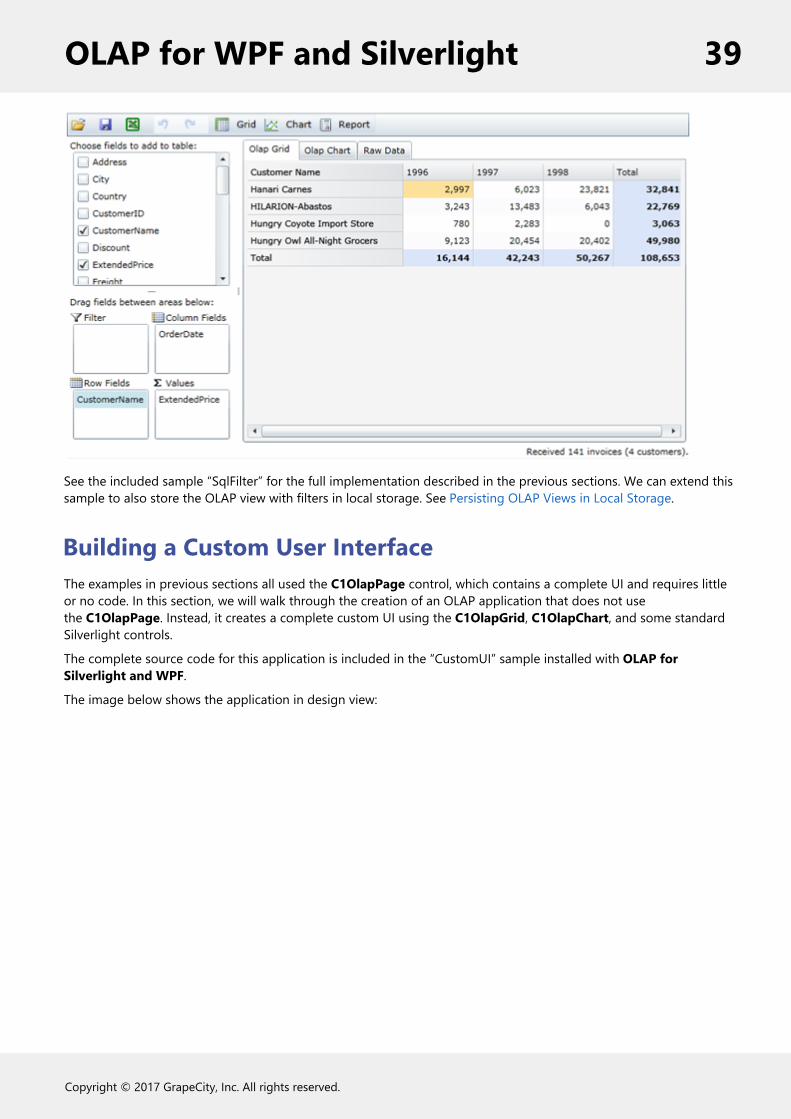
Building a Custom User InterfaceThe examples in previous sections all used the C1OlapPage control, which contains a complete UI and requires littleor no code. In this section, we will walk through the creation of an OLAP application that does not usethe C1OlapPage. Instead, it creates a complete custom UI using the C1OlapGrid, C1OlapChart, and some standardSilverlight controls.
The complete source code for this application is included in the “CustomUI” sample installed with OLAP forSilverlight and WPF.
The image below shows the application in design view:
OLAP for WPF and Silverlight 39
Copyright © 2017 GrapeCity, Inc. All rights reserved.

Our Grid layout consists of 2 rows and 4 columns. There is a TextBlock filling to the top row showing the applicationtitle. There is a vertical StackPanel control in the left-most column with two groups of buttons. The top group allowsusers to pick one of three pre-defined views: sales by salesperson, by product, or by country. The next group allowsusers to apply a filter to the data based on product price (expensive, moderate, or inexpensive).
The remaining columns have an empty C1OlapGrid, GridSplitter and an empty C1OlapChart respectively. These arethe controls that will display the view currently selected.
Once all the controls are in place, let’s add the code that connects them all and makes the application work.
In code we declare a C1OlapPanel. In previous examples the C1OlapPanel part is visible to the end-user. But in thissample we use it behind-the scenes, so users won’t ever see it. This invisible control is used as a data source for thegrid and the chart, and is responsible for filtering and summarizing the data. Both the grid and the chart have theirDataSource property set to the C1OlapPanel.
C1OlapPanel _olapPanel = new C1OlapPanel();
The code below first loads Northwind data from an XML data schema file. We use Data for Silverlight, whichprovides us the familiar DataSet and DataTable objects to read the data in. We also use Zip for Silverlight tounpackage the zipped XML file on the client. We assign the resulting DataTable to the C1OlapPanel.DataSourceproperty. We also assign our C1OlapPanel control to our C1OlapGrid and C1OlapChart controls DataSourceproperty. Finally, we simulate clicks on two buttons to initialize the current view and filter.
Visual Basic
Public MainPage() InitializeComponent()
Dim ds = New DataSet()
OLAP for WPF and Silverlight 40
Copyright © 2017 GrapeCity, Inc. All rights reserved.
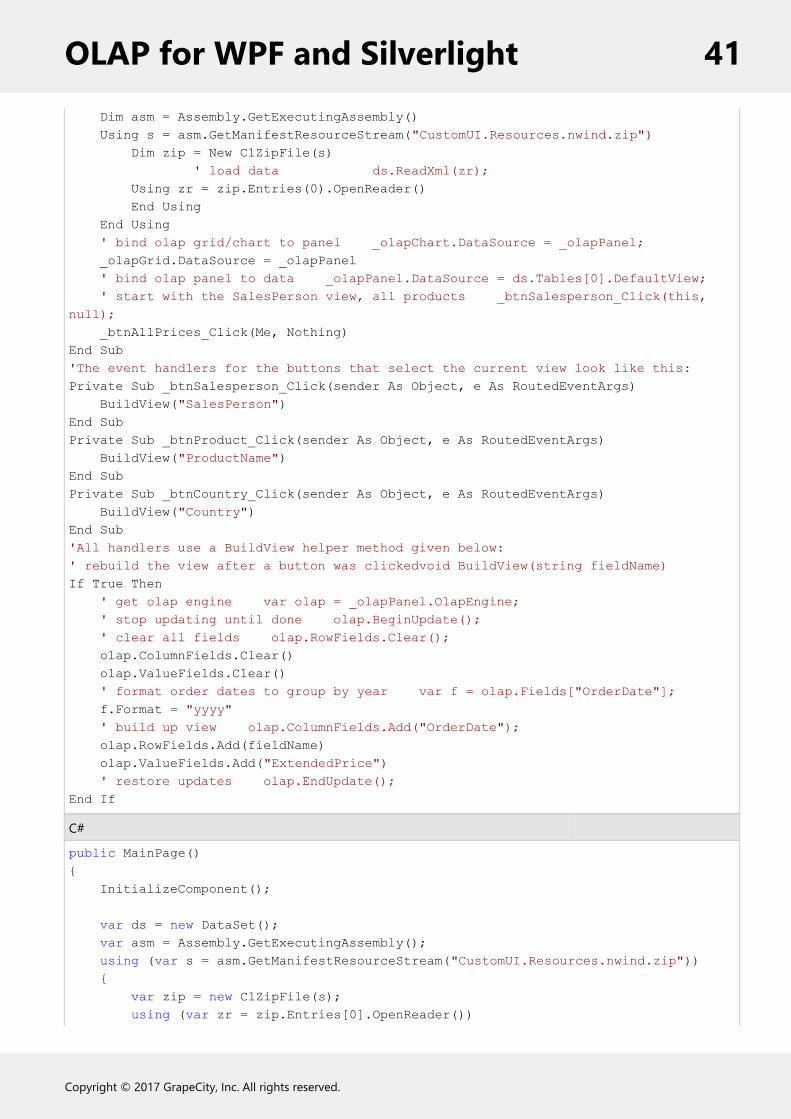
Dim asm = Assembly.GetExecutingAssembly() Using s = asm.GetManifestResourceStream("CustomUI.Resources.nwind.zip") Dim zip = New C1ZipFile(s) ' load data ds.ReadXml(zr); Using zr = zip.Entries(0).OpenReader() End Using End Using ' bind olap grid/chart to panel _olapChart.DataSource = _olapPanel; _olapGrid.DataSource = _olapPanel ' bind olap panel to data _olapPanel.DataSource = ds.Tables[0].DefaultView; ' start with the SalesPerson view, all products _btnSalesperson_Click(this, null); _btnAllPrices_Click(Me, Nothing)End Sub'The event handlers for the buttons that select the current view look like this:Private Sub _btnSalesperson_Click(sender As Object, e As RoutedEventArgs) BuildView("SalesPerson")End SubPrivate Sub _btnProduct_Click(sender As Object, e As RoutedEventArgs) BuildView("ProductName")End SubPrivate Sub _btnCountry_Click(sender As Object, e As RoutedEventArgs) BuildView("Country")End Sub'All handlers use a BuildView helper method given below:' rebuild the view after a button was clickedvoid BuildView(string fieldName)If True Then ' get olap engine var olap = _olapPanel.OlapEngine; ' stop updating until done olap.BeginUpdate(); ' clear all fields olap.RowFields.Clear(); olap.ColumnFields.Clear() olap.ValueFields.Clear() ' format order dates to group by year var f = olap.Fields["OrderDate"]; f.Format = "yyyy" ' build up view olap.ColumnFields.Add("OrderDate"); olap.RowFields.Add(fieldName) olap.ValueFields.Add("ExtendedPrice") ' restore updates olap.EndUpdate();End If
C#
public MainPage(){ InitializeComponent(); var ds = new DataSet(); var asm = Assembly.GetExecutingAssembly(); using (var s = asm.GetManifestResourceStream("CustomUI.Resources.nwind.zip")) { var zip = new C1ZipFile(s); using (var zr = zip.Entries[0].OpenReader())
OLAP for WPF and Silverlight 41
Copyright © 2017 GrapeCity, Inc. All rights reserved.
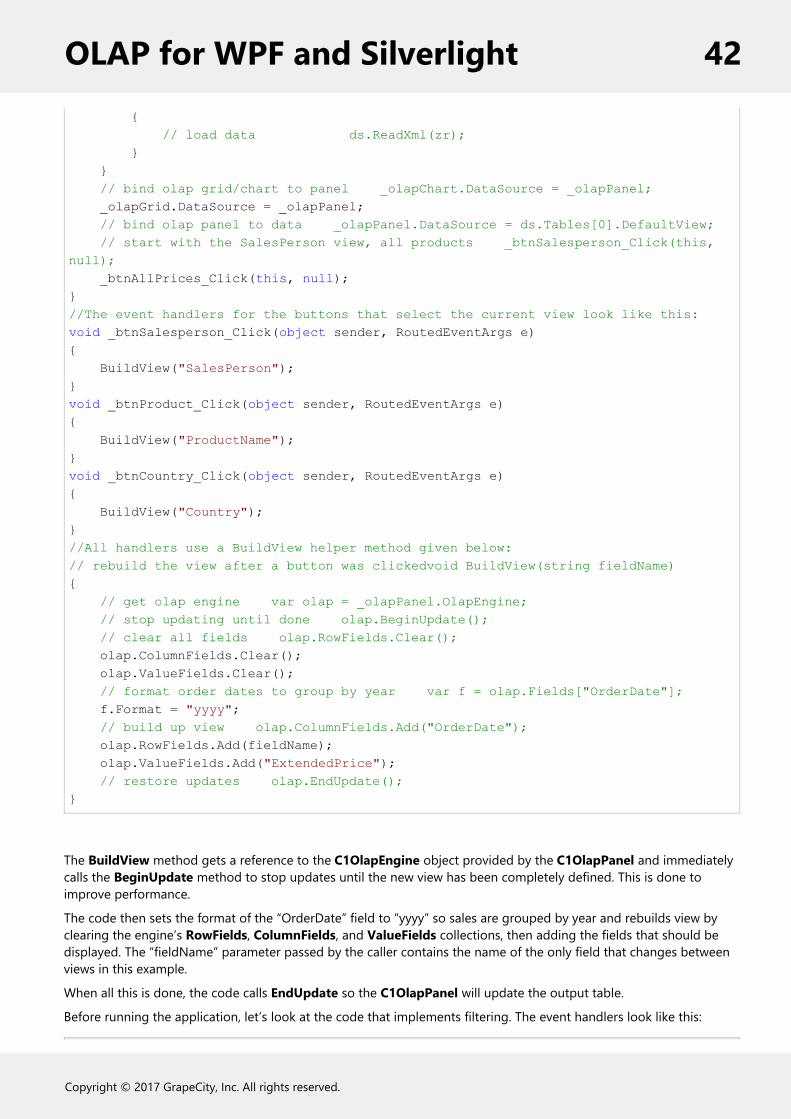
{ // load data ds.ReadXml(zr); } } // bind olap grid/chart to panel _olapChart.DataSource = _olapPanel; _olapGrid.DataSource = _olapPanel; // bind olap panel to data _olapPanel.DataSource = ds.Tables[0].DefaultView; // start with the SalesPerson view, all products _btnSalesperson_Click(this, null); _btnAllPrices_Click(this, null);}//The event handlers for the buttons that select the current view look like this:void _btnSalesperson_Click(object sender, RoutedEventArgs e){ BuildView("SalesPerson");}void _btnProduct_Click(object sender, RoutedEventArgs e){ BuildView("ProductName");}void _btnCountry_Click(object sender, RoutedEventArgs e){ BuildView("Country");}//All handlers use a BuildView helper method given below:// rebuild the view after a button was clickedvoid BuildView(string fieldName){ // get olap engine var olap = _olapPanel.OlapEngine; // stop updating until done olap.BeginUpdate(); // clear all fields olap.RowFields.Clear(); olap.ColumnFields.Clear(); olap.ValueFields.Clear(); // format order dates to group by year var f = olap.Fields["OrderDate"]; f.Format = "yyyy"; // build up view olap.ColumnFields.Add("OrderDate"); olap.RowFields.Add(fieldName); olap.ValueFields.Add("ExtendedPrice"); // restore updates olap.EndUpdate();}
The BuildView method gets a reference to the C1OlapEngine object provided by the C1OlapPanel and immediatelycalls the BeginUpdate method to stop updates until the new view has been completely defined. This is done toimprove performance.
The code then sets the format of the “OrderDate” field to “yyyy” so sales are grouped by year and rebuilds view byclearing the engine’s RowFields, ColumnFields, and ValueFields collections, then adding the fields that should bedisplayed. The “fieldName” parameter passed by the caller contains the name of the only field that changes betweenviews in this example.
When all this is done, the code calls EndUpdate so the C1OlapPanel will update the output table.
Before running the application, let’s look at the code that implements filtering. The event handlers look like this:
OLAP for WPF and Silverlight 42
Copyright © 2017 GrapeCity, Inc. All rights reserved.
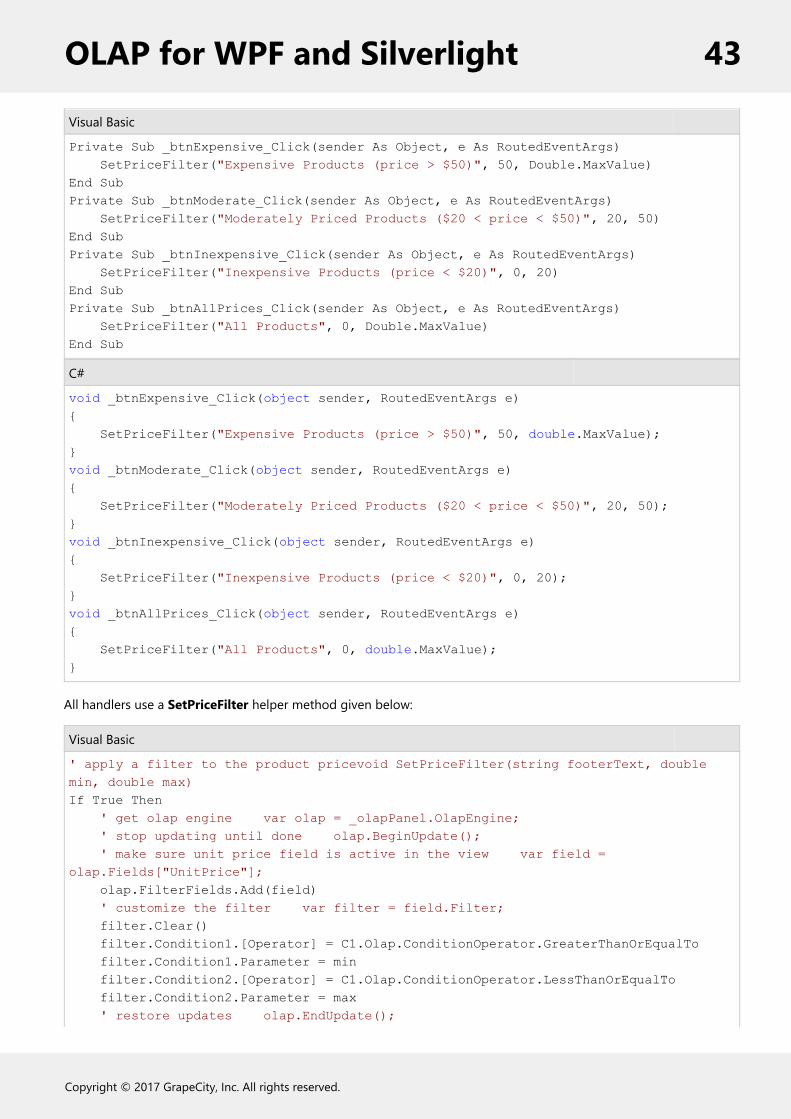
Visual Basic
Private Sub _btnExpensive_Click(sender As Object, e As RoutedEventArgs) SetPriceFilter("Expensive Products (price > $50)", 50, Double.MaxValue)End SubPrivate Sub _btnModerate_Click(sender As Object, e As RoutedEventArgs) SetPriceFilter("Moderately Priced Products ($20 < price < $50)", 20, 50)End SubPrivate Sub _btnInexpensive_Click(sender As Object, e As RoutedEventArgs) SetPriceFilter("Inexpensive Products (price < $20)", 0, 20)End SubPrivate Sub _btnAllPrices_Click(sender As Object, e As RoutedEventArgs) SetPriceFilter("All Products", 0, Double.MaxValue)End Sub
C#
void _btnExpensive_Click(object sender, RoutedEventArgs e){ SetPriceFilter("Expensive Products (price > $50)", 50, double.MaxValue);}void _btnModerate_Click(object sender, RoutedEventArgs e){ SetPriceFilter("Moderately Priced Products ($20 < price < $50)", 20, 50);}void _btnInexpensive_Click(object sender, RoutedEventArgs e){ SetPriceFilter("Inexpensive Products (price < $20)", 0, 20);}void _btnAllPrices_Click(object sender, RoutedEventArgs e){ SetPriceFilter("All Products", 0, double.MaxValue);}
All handlers use a SetPriceFilter helper method given below:
Visual Basic
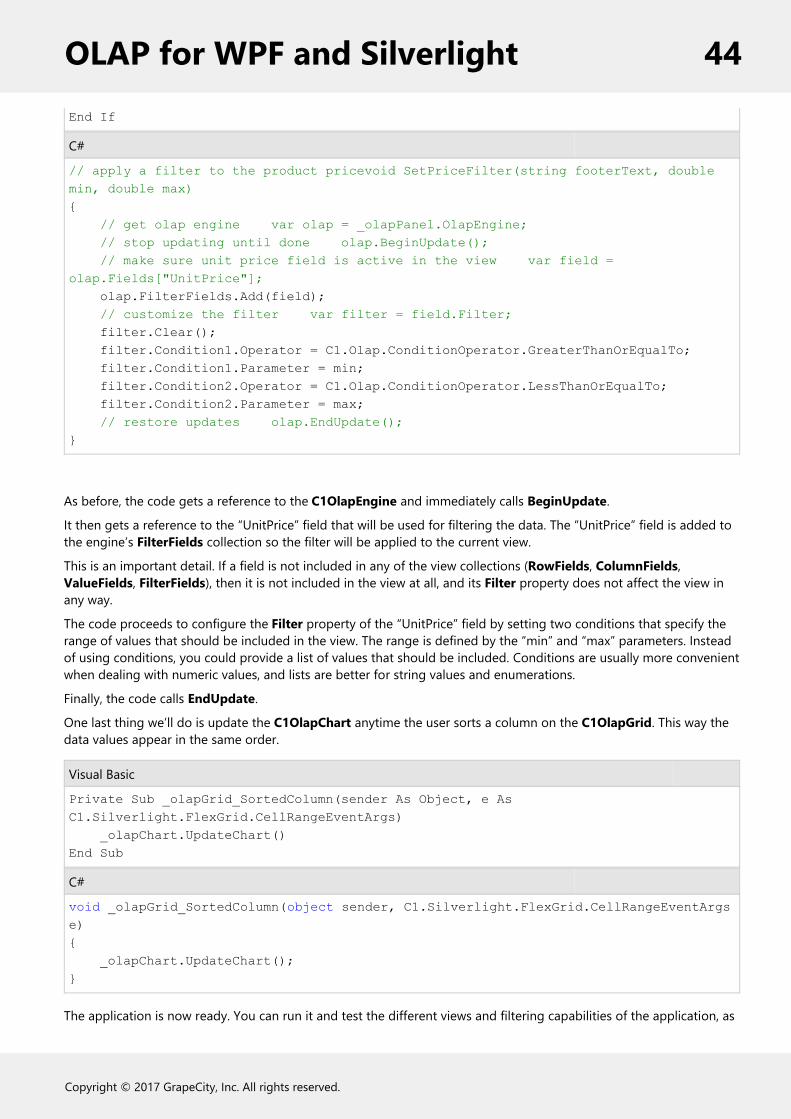
' apply a filter to the product pricevoid SetPriceFilter(string footerText, double min, double max)If True Then ' get olap engine var olap = _olapPanel.OlapEngine; ' stop updating until done olap.BeginUpdate(); ' make sure unit price field is active in the view var field = olap.Fields["UnitPrice"]; olap.FilterFields.Add(field) ' customize the filter var filter = field.Filter; filter.Clear() filter.Condition1.[Operator] = C1.Olap.ConditionOperator.GreaterThanOrEqualTo filter.Condition1.Parameter = min filter.Condition2.[Operator] = C1.Olap.ConditionOperator.LessThanOrEqualTo filter.Condition2.Parameter = max ' restore updates olap.EndUpdate();
OLAP for WPF and Silverlight 43
Copyright © 2017 GrapeCity, Inc. All rights reserved.
End If
C#
// apply a filter to the product pricevoid SetPriceFilter(string footerText, double min, double max){ // get olap engine var olap = _olapPanel.OlapEngine; // stop updating until done olap.BeginUpdate(); // make sure unit price field is active in the view var field = olap.Fields["UnitPrice"]; olap.FilterFields.Add(field); // customize the filter var filter = field.Filter; filter.Clear(); filter.Condition1.Operator = C1.Olap.ConditionOperator.GreaterThanOrEqualTo; filter.Condition1.Parameter = min; filter.Condition2.Operator = C1.Olap.ConditionOperator.LessThanOrEqualTo; filter.Condition2.Parameter = max; // restore updates olap.EndUpdate();}
As before, the code gets a reference to the C1OlapEngine and immediately calls BeginUpdate.
It then gets a reference to the “UnitPrice” field that will be used for filtering the data. The “UnitPrice” field is added tothe engine’s FilterFields collection so the filter will be applied to the current view.
This is an important detail. If a field is not included in any of the view collections (RowFields, ColumnFields,ValueFields, FilterFields), then it is not included in the view at all, and its Filter property does not affect the view inany way.
The code proceeds to configure the Filter property of the “UnitPrice” field by setting two conditions that specify therange of values that should be included in the view. The range is defined by the “min” and “max” parameters. Insteadof using conditions, you could provide a list of values that should be included. Conditions are usually more convenientwhen dealing with numeric values, and lists are better for string values and enumerations.
Finally, the code calls EndUpdate.
One last thing we’ll do is update the C1OlapChart anytime the user sorts a column on the C1OlapGrid. This way thedata values appear in the same order.
Visual Basic
Private Sub _olapGrid_SortedColumn(sender As Object, e As C1.Silverlight.FlexGrid.CellRangeEventArgs) _olapChart.UpdateChart()End Sub
C#
void _olapGrid_SortedColumn(object sender, C1.Silverlight.FlexGrid.CellRangeEventArgs e){ _olapChart.UpdateChart();}
The application is now ready. You can run it and test the different views and filtering capabilities of the application, as
OLAP for WPF and Silverlight 44
Copyright © 2017 GrapeCity, Inc. All rights reserved.
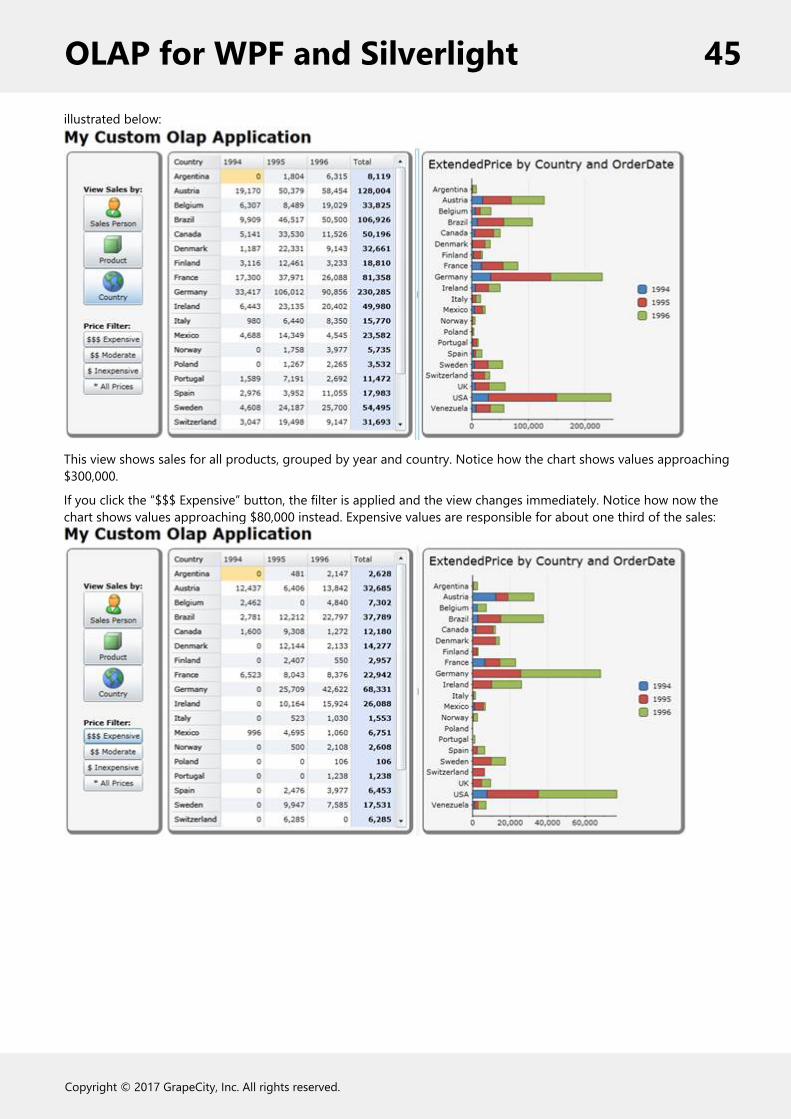
illustrated below:
This view shows sales for all products, grouped by year and country. Notice how the chart shows values approaching$300,000.
If you click the “$$$ Expensive” button, the filter is applied and the view changes immediately. Notice how now thechart shows values approaching $80,000 instead. Expensive values are responsible for about one third of the sales:
OLAP for WPF and Silverlight 45
Copyright © 2017 GrapeCity, Inc. All rights reserved.
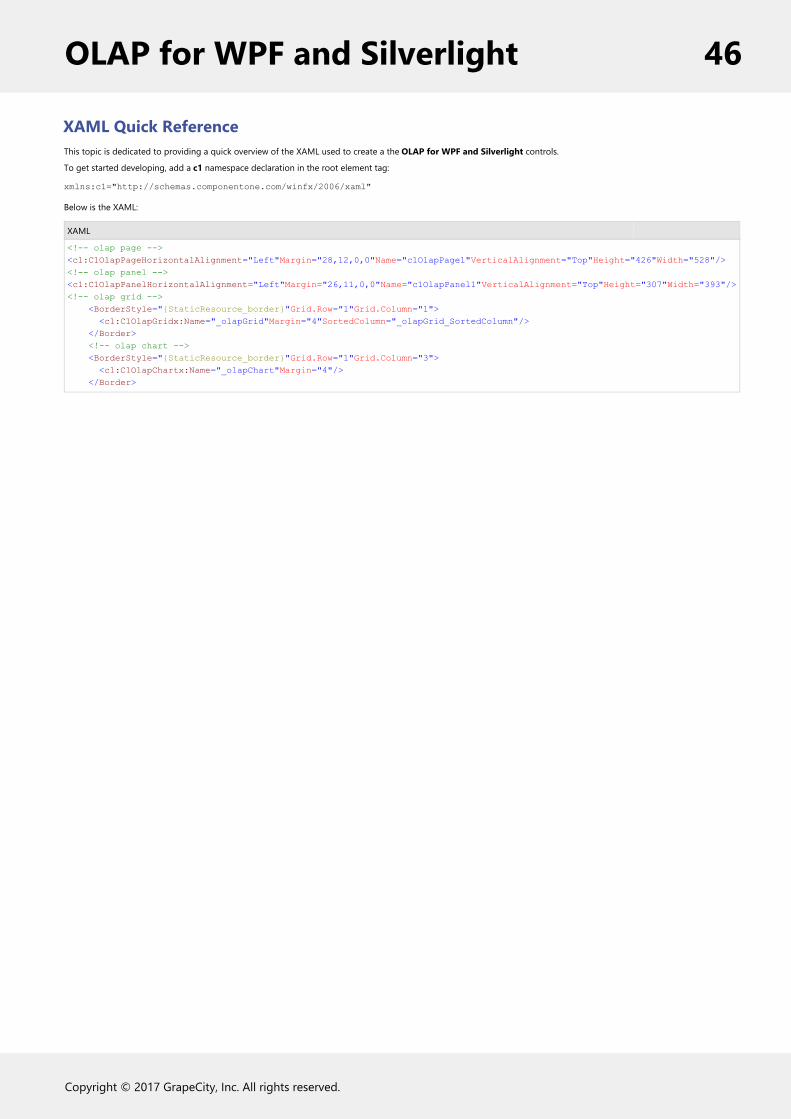
XAML Quick ReferenceThis topic is dedicated to providing a quick overview of the XAML used to create a the OLAP for WPF and Silverlight controls.
To get started developing, add a c1 namespace declaration in the root element tag:
xmlns:c1="http://schemas.componentone.com/winfx/2006/xaml"
Below is the XAML:
XAML
<!-- olap page --><c1:C1OlapPageHorizontalAlignment="Left"Margin="28,12,0,0"Name="c1OlapPage1"VerticalAlignment="Top"Height="426"Width="528"/><!-- olap panel --><c1:C1OlapPanelHorizontalAlignment="Left"Margin="26,11,0,0"Name="c1OlapPanel1"VerticalAlignment="Top"Height="307"Width="393"/><!-- olap grid --> <BorderStyle="{StaticResource_border}"Grid.Row="1"Grid.Column="1"> <c1:C1OlapGridx:Name="_olapGrid"Margin="4"SortedColumn="_olapGrid_SortedColumn"/> </Border> <!-- olap chart --> <BorderStyle="{StaticResource_border}"Grid.Row="1"Grid.Column="3"> <c1:C1OlapChartx:Name="_olapChart"Margin="4"/> </Border>
OLAP for WPF and Silverlight 46
Copyright © 2017 GrapeCity, Inc. All rights reserved.
OLAP for WPF and Silverlight Design-Time SupportThe following sections describe how to use the OLAP for Silverlight and WPF design-time environment to configurethe controls.
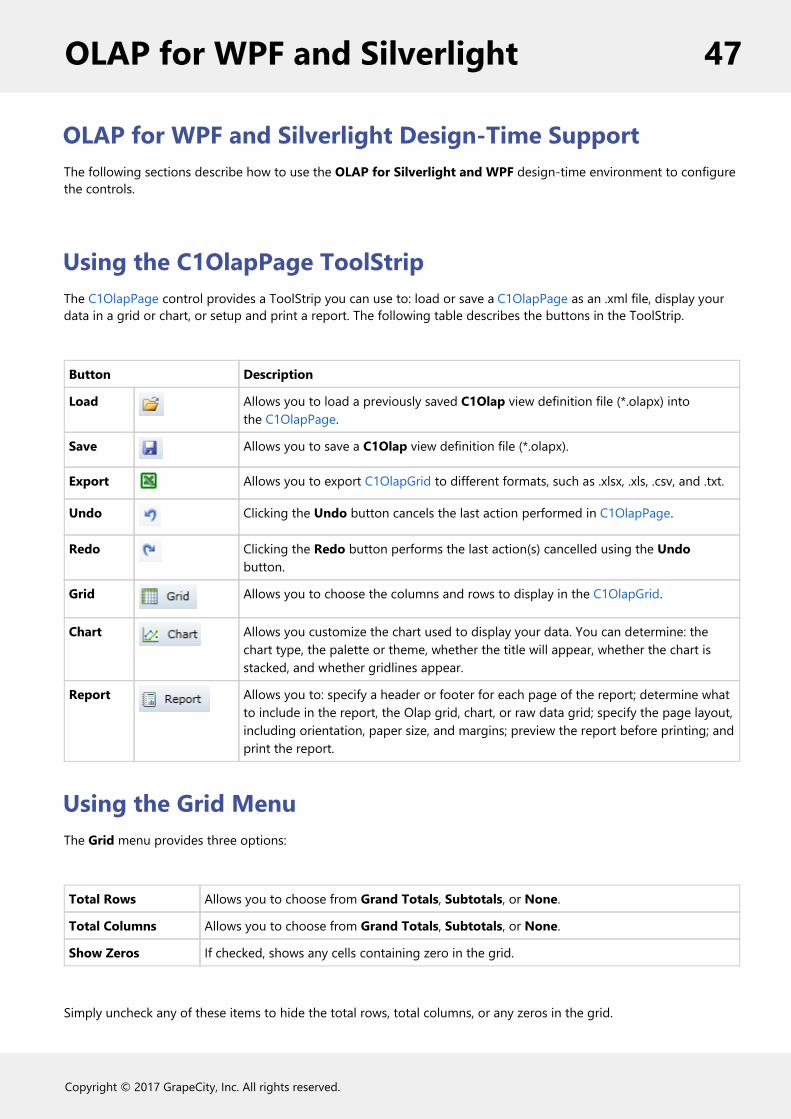
Using the C1OlapPage ToolStripThe C1OlapPage control provides a ToolStrip you can use to: load or save a C1OlapPage as an .xml file, display yourdata in a grid or chart, or setup and print a report. The following table describes the buttons in the ToolStrip.
Button Description
Load Allows you to load a previously saved C1Olap view definition file (*.olapx) intothe C1OlapPage.
Save Allows you to save a C1Olap view definition file (*.olapx).
Export Allows you to export C1OlapGrid to different formats, such as .xlsx, .xls, .csv, and .txt.
Undo Clicking the Undo button cancels the last action performed in C1OlapPage.
Redo Clicking the Redo button performs the last action(s) cancelled using the Undobutton.
Grid Allows you to choose the columns and rows to display in the C1OlapGrid.
Chart Allows you customize the chart used to display your data. You can determine: thechart type, the palette or theme, whether the title will appear, whether the chart isstacked, and whether gridlines appear.
Report Allows you to: specify a header or footer for each page of the report; determine whatto include in the report, the Olap grid, chart, or raw data grid; specify the page layout,including orientation, paper size, and margins; preview the report before printing; andprint the report.
Using the Grid MenuThe Grid menu provides three options:
Total Rows Allows you to choose from Grand Totals, Subtotals, or None.
Total Columns Allows you to choose from Grand Totals, Subtotals, or None.
Show Zeros If checked, shows any cells containing zero in the grid.
Simply uncheck any of these items to hide the total rows, total columns, or any zeros in the grid.
OLAP for WPF and Silverlight 47
Copyright © 2017 GrapeCity, Inc. All rights reserved.
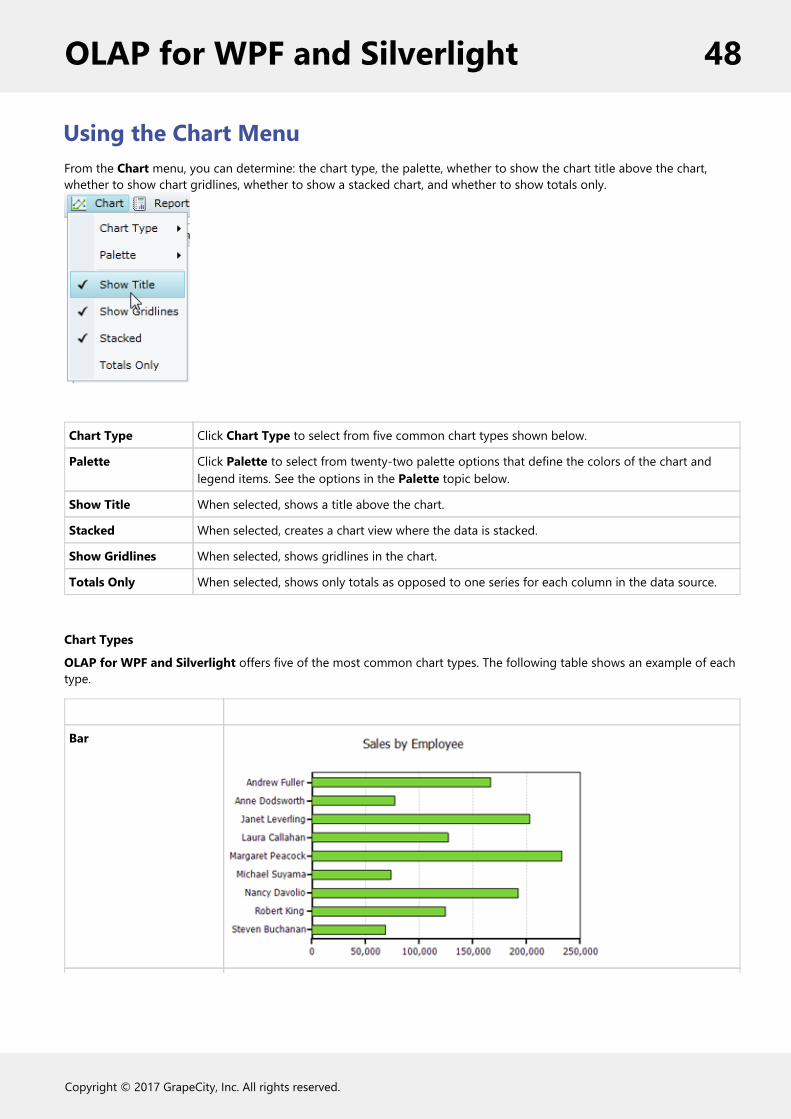
Using the Chart MenuFrom the Chart menu, you can determine: the chart type, the palette, whether to show the chart title above the chart,whether to show chart gridlines, whether to show a stacked chart, and whether to show totals only.
Chart Type Click Chart Type to select from five common chart types shown below.
Palette Click Palette to select from twenty-two palette options that define the colors of the chart andlegend items. See the options in the Palette topic below.
Show Title When selected, shows a title above the chart.
Stacked When selected, creates a chart view where the data is stacked.
Show Gridlines When selected, shows gridlines in the chart.
Totals Only When selected, shows only totals as opposed to one series for each column in the data source.
Chart Types
OLAP for WPF and Silverlight offers five of the most common chart types. The following table shows an example of eachtype.
Bar
OLAP for WPF and Silverlight 48
Copyright © 2017 GrapeCity, Inc. All rights reserved.
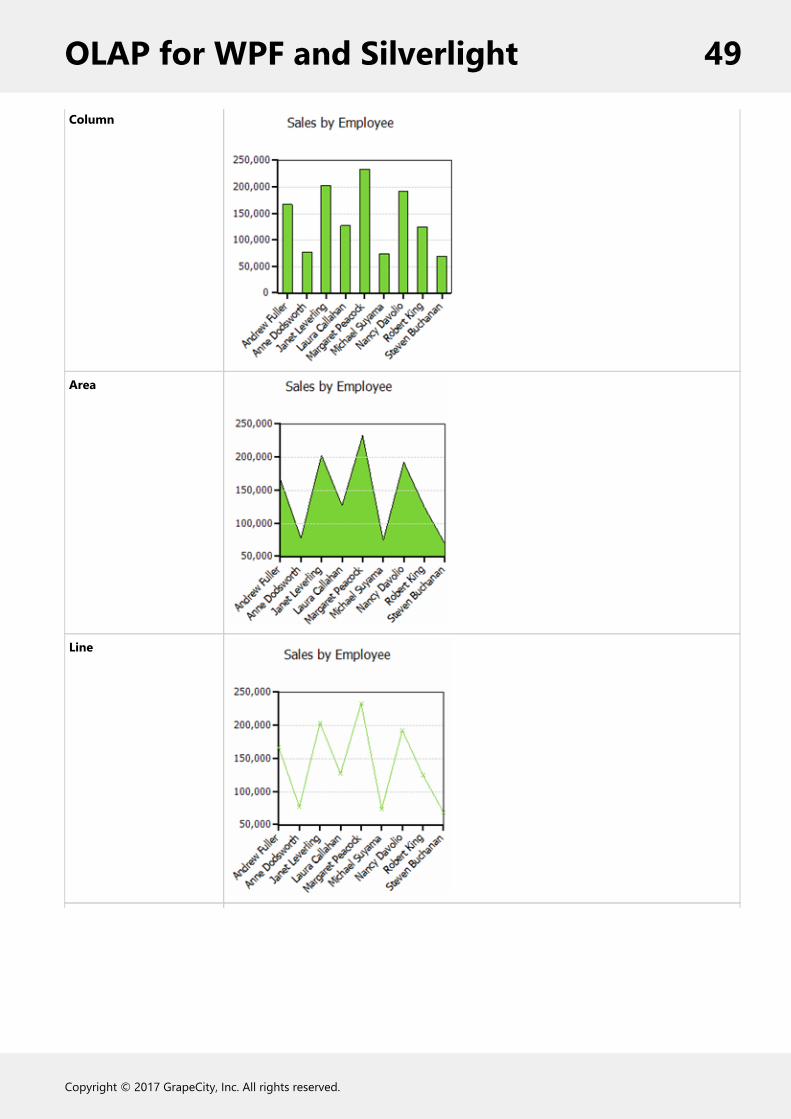
Column
Area
Line
OLAP for WPF and Silverlight 49
Copyright © 2017 GrapeCity, Inc. All rights reserved.

Scatter
Palette
The C1OlapChart palette is made up of twenty-two options that define the colors of the chart and legend items. Thefollowing table shows the colors for each palette option.
Standard Office GrayScale
Apex Aspect Civic
OLAP for WPF and Silverlight 50
Copyright © 2017 GrapeCity, Inc. All rights reserved.

Concourse Equity Flow
Foundry Median Metro
Module Opulent Oriel
OLAP for WPF and Silverlight 51
Copyright © 2017 GrapeCity, Inc. All rights reserved.

Origin Paper Solstice
Technic Trek Urban
Verve
OLAP for WPF and Silverlight 52
Copyright © 2017 GrapeCity, Inc. All rights reserved.
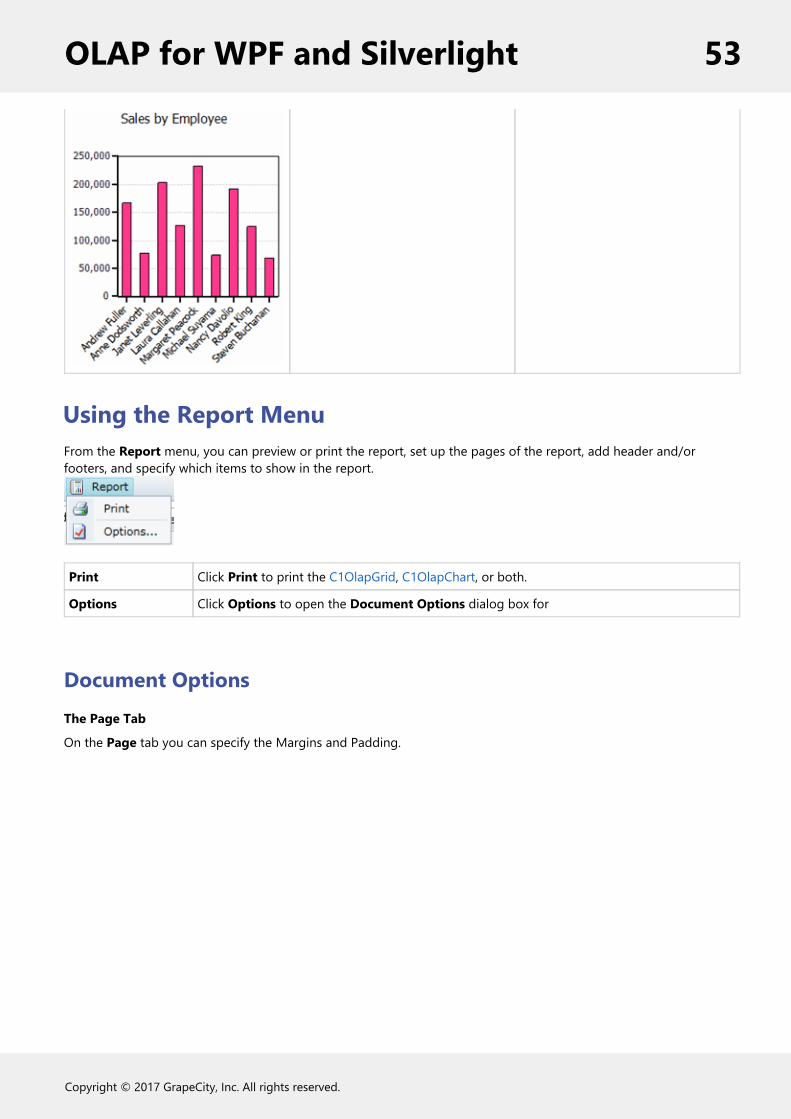
Using the Report MenuFrom the Report menu, you can preview or print the report, set up the pages of the report, add header and/orfooters, and specify which items to show in the report.
Print Click Print to print the C1OlapGrid, C1OlapChart, or both.
Options Click Options to open the Document Options dialog box for
Document OptionsThe Page Tab
On the Page tab you can specify the Margins and Padding.
OLAP for WPF and Silverlight 53
Copyright © 2017 GrapeCity, Inc. All rights reserved.
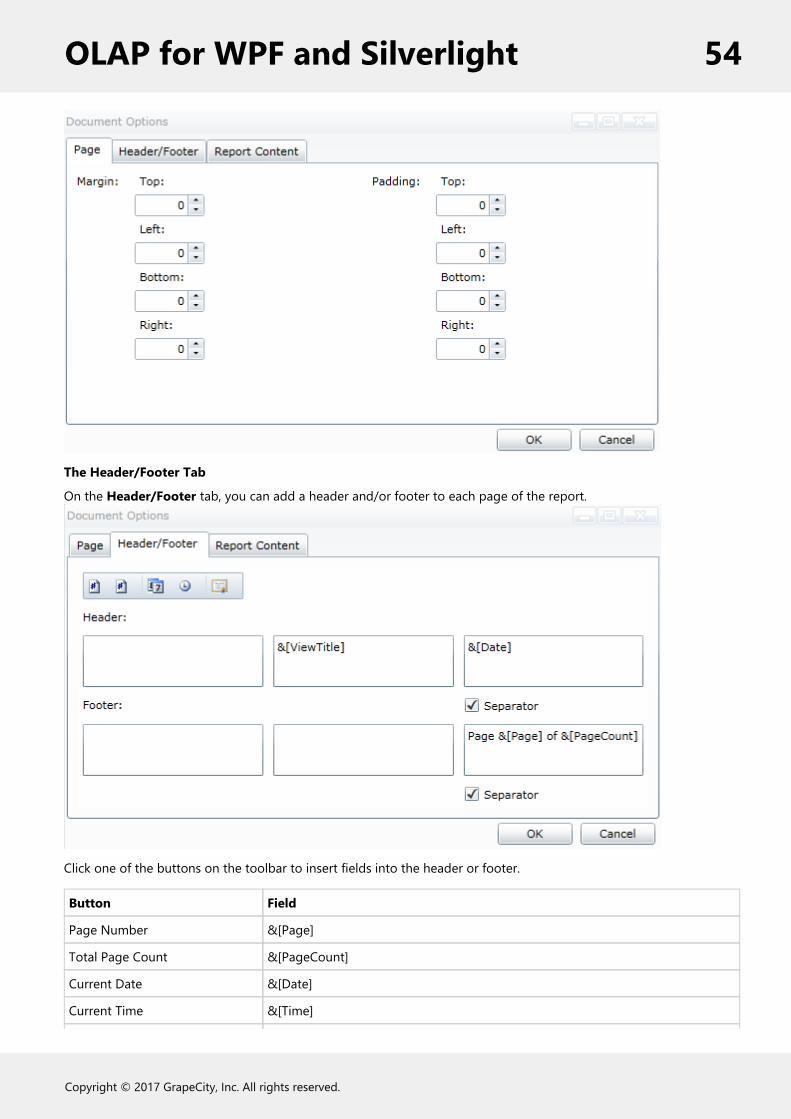
The Header/Footer Tab
On the Header/Footer tab, you can add a header and/or footer to each page of the report.
Click one of the buttons on the toolbar to insert fields into the header or footer.
Button Field
Page Number &[Page]
Total Page Count &[PageCount]
Current Date &[Date]
Current Time &[Time]
OLAP for WPF and Silverlight 54
Copyright © 2017 GrapeCity, Inc. All rights reserved.

Title &[ViewTitle]
Check the Separator box to show a separator line below the header or above the footer. Click the Font button tochange the font, style, size, or effects.
The Report Content Tab
On the Report Content tab, you can determine whether to include the OLAP Grid, Olap Chart, and/or the Raw DataGrid in your report. You can also scale the items as desired.
OLAP for WPF and Silverlight 55
Copyright © 2017 GrapeCity, Inc. All rights reserved.
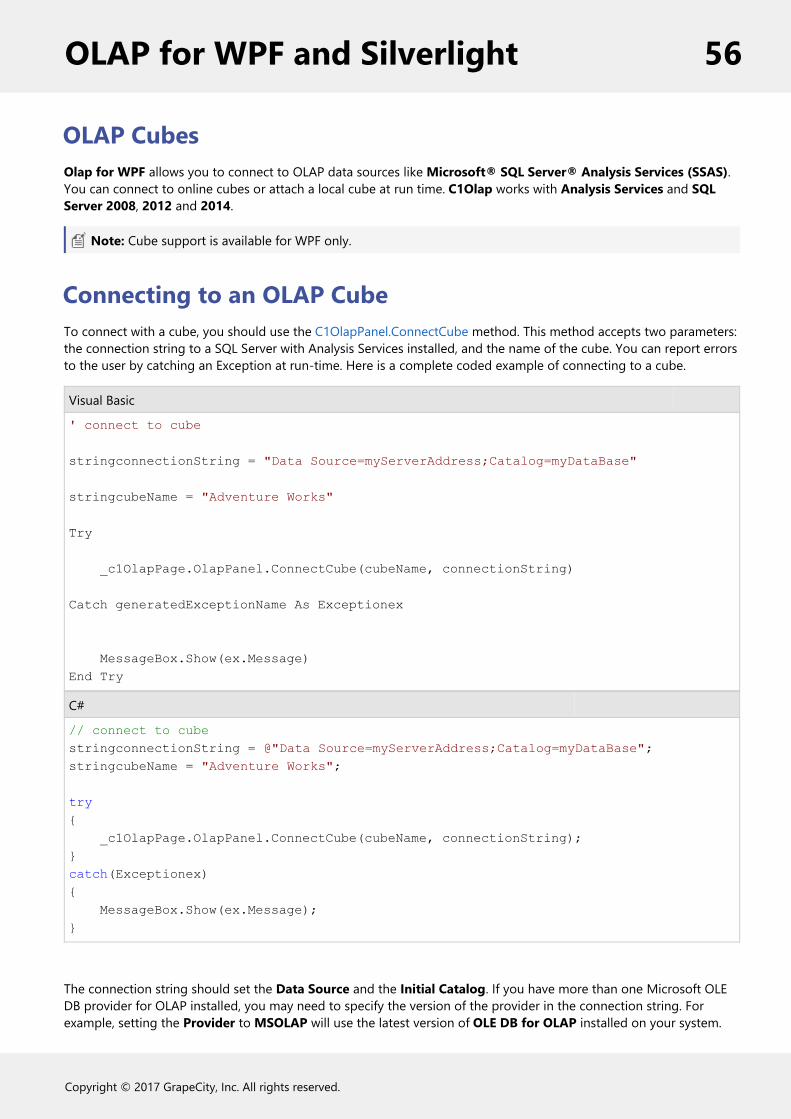
OLAP CubesOlap for WPF allows you to connect to OLAP data sources like Microsoft® SQL Server® Analysis Services (SSAS).You can connect to online cubes or attach a local cube at run time. C1Olap works with Analysis Services and SQLServer 2008, 2012 and 2014.
Note: Cube support is available for WPF only.
Connecting to an OLAP CubeTo connect with a cube, you should use the C1OlapPanel.ConnectCube method. This method accepts two parameters:the connection string to a SQL Server with Analysis Services installed, and the name of the cube. You can report errorsto the user by catching an Exception at run-time. Here is a complete coded example of connecting to a cube.
Visual Basic
' connect to cube
stringconnectionString = "Data Source=myServerAddress;Catalog=myDataBase"
stringcubeName = "Adventure Works"
Try
_c1OlapPage.OlapPanel.ConnectCube(cubeName, connectionString)
Catch generatedExceptionName As Exceptionex
MessageBox.Show(ex.Message)End Try
C#
// connect to cubestringconnectionString = @"Data Source=myServerAddress;Catalog=myDataBase";stringcubeName = "Adventure Works";
try{ _c1OlapPage.OlapPanel.ConnectCube(cubeName, connectionString);}catch(Exceptionex){ MessageBox.Show(ex.Message);}
The connection string should set the Data Source and the Initial Catalog. If you have more than one Microsoft OLEDB provider for OLAP installed, you may need to specify the version of the provider in the connection string. Forexample, setting the Provider to MSOLAP will use the latest version of OLE DB for OLAP installed on your system.
OLAP for WPF and Silverlight 56
Copyright © 2017 GrapeCity, Inc. All rights reserved.

Example:
Visual Basic
Provider = MSOLAPDim Source As Data = myServerAddressDim Catalog As Initial = myDataBase
C#
Provider=MSOLAP;Data Source=myServerAddress;Initial Catalog=myDataBase;
Note: If you’ve created a custom UI or are not using the C1OlapPage control, you can use the C1OlapPanelcontrol and its same C1OlapPanel.ConnectCube method.
Loading a Local Cube FileYou can use C1Olap with local cube files (.cub). For instance, if you have placed a cube file in a directory within theproject named Data, the connection string would look like the following.
Visual Basic
stringconnectionString = "Data Source=" + System.AppDomain.CurrentDomain.BaseDirectory + "\Data\LocalCube.cub;Provider=msolap"
stringcubeName = "LocalCube"
c1OlapPage1.OlapPanel.ConnectCube(cubeName, connectionString)
C#
stringconnectionString = @"Data Source="+ System.AppDomain.CurrentDomain.BaseDirectory + @"\Data\LocalCube.cub;Provider=msolap";stringcubeName = "LocalCube";c1OlapPage1.OlapPanel.ConnectCube(cubeName, connectionString);
Using Cube Data SourcesAt run-time users can build reports from cube data much like they would from regular data sets. The key difference isthat cube data sets are represented by a tree in the C1OlapPanel control with each node representing a dimensionalentity or an object for measure. All fields that can be added to the report are displayed with a checkbox. Objectsrepresented by the summation symbol (∑) are measures and can be added to the Values collection. Fields of entitiescan be added to the Rows or Columns collections.
OLAP for WPF and Silverlight 57
Copyright © 2017 GrapeCity, Inc. All rights reserved.

OLAP for WPF and Silverlight 58
Copyright © 2017 GrapeCity, Inc. All rights reserved.
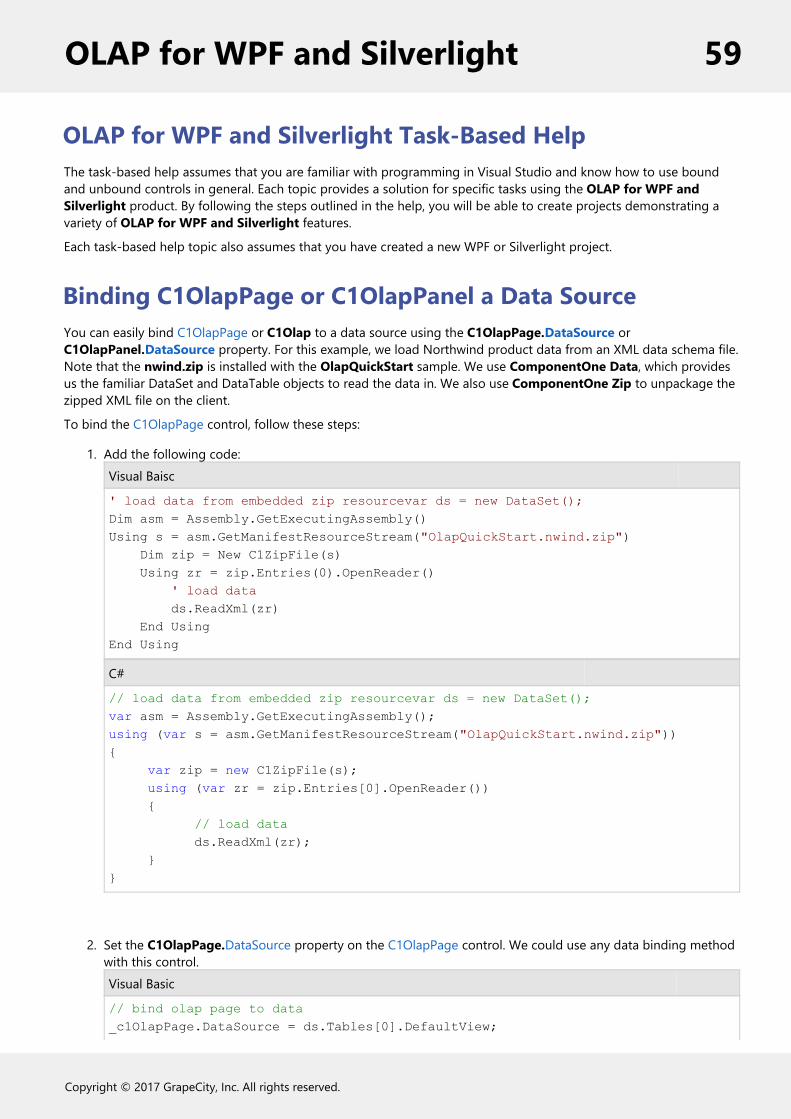
OLAP for WPF and Silverlight Task-Based HelpThe task-based help assumes that you are familiar with programming in Visual Studio and know how to use boundand unbound controls in general. Each topic provides a solution for specific tasks using the OLAP for WPF andSilverlight product. By following the steps outlined in the help, you will be able to create projects demonstrating avariety of OLAP for WPF and Silverlight features.
Each task-based help topic also assumes that you have created a new WPF or Silverlight project.
Binding C1OlapPage or C1OlapPanel a Data SourceYou can easily bind C1OlapPage or C1Olap to a data source using the C1OlapPage.DataSource orC1OlapPanel.DataSource property. For this example, we load Northwind product data from an XML data schema file.Note that the nwind.zip is installed with the OlapQuickStart sample. We use ComponentOne Data, which providesus the familiar DataSet and DataTable objects to read the data in. We also use ComponentOne Zip to unpackage thezipped XML file on the client.
To bind the C1OlapPage control, follow these steps:
1. Add the following code:Visual Baisc
' load data from embedded zip resourcevar ds = new DataSet();Dim asm = Assembly.GetExecutingAssembly()Using s = asm.GetManifestResourceStream("OlapQuickStart.nwind.zip") Dim zip = New C1ZipFile(s) Using zr = zip.Entries(0).OpenReader() ' load data ds.ReadXml(zr) End UsingEnd Using
C#
// load data from embedded zip resourcevar ds = new DataSet();var asm = Assembly.GetExecutingAssembly();using (var s = asm.GetManifestResourceStream("OlapQuickStart.nwind.zip")){ var zip = new C1ZipFile(s); using (var zr = zip.Entries[0].OpenReader()) { // load data ds.ReadXml(zr); }}
2. Set the C1OlapPage.DataSource property on the C1OlapPage control. We could use any data binding methodwith this control.Visual Basic
// bind olap page to data_c1OlapPage.DataSource = ds.Tables[0].DefaultView;
OLAP for WPF and Silverlight 59
Copyright © 2017 GrapeCity, Inc. All rights reserved.

C#
// bind olap page to data_c1OlapPage.DataSource = ds.Tables[0].DefaultView;
Binding C1OlapChart to a C1OlapPanelYou can populate a C1OlapChart control by binding it to a C1OlapPanel that is bound to a data source. Note that thistopic assumes you have a bound C1OlapPanel control on your form.
Set the C1OlapChart.DataSource property on the C1OlapChart to the C1OlapPanel that provides the Olap data.
Binding C1OlapGrid to a C1OlapPanelYou can populate a C1OlapGrid control by binding it to a C1OlapPanel that is bound to a data source. Note that thistopic assumes you have a bound C1OlapPanel control on your form.
Set the C1OlapGrid.DataSource property on the C1OlapGrid to the C1OlapPanel that provides the OLAP data.
Removing a Field from a Data ViewIn the C1OlapPanel control or the C1OlapPanel area of the C1OlapPage control, you can filter out an entire field sothat it doesn't appear in your C1OlapGrid or C1OlapChart data view. This can be done at run time.
1. In the Drag fields between areas below section of the panel, select the field to filter out of the view.2. Drag it to the Filter area of the panel. The data in this field will be removed from the C1OlapGrid
or C1OlapChart data view.
Filtering Data in a FieldIn the C1OlapPanel control or the C1OlapPanel area of the C1OlapPage control, you can filter the data in a field fromthe Drag fields between areas below section of the panel at run time. Each field has two filters: the value filter, whichallows you to check specific values in a list, and the range filter, which allows you to specify one or two criteria. Thetwo filters are independent, and values must pass both filters in order to be included in the OLAP table.
Using the Value Filter
1. Right-click a field in the Filter, Column Fields, Row Fields, or Values area.2. Click Field Settings in the context menu. The Field Settings dialog box opens.3. Click the Filter tab. This is the value filter. You can clear the selection for any of the fields that you do not want
to appear in the OLAP table.
OLAP for WPF and Silverlight 60
Copyright © 2017 GrapeCity, Inc. All rights reserved.
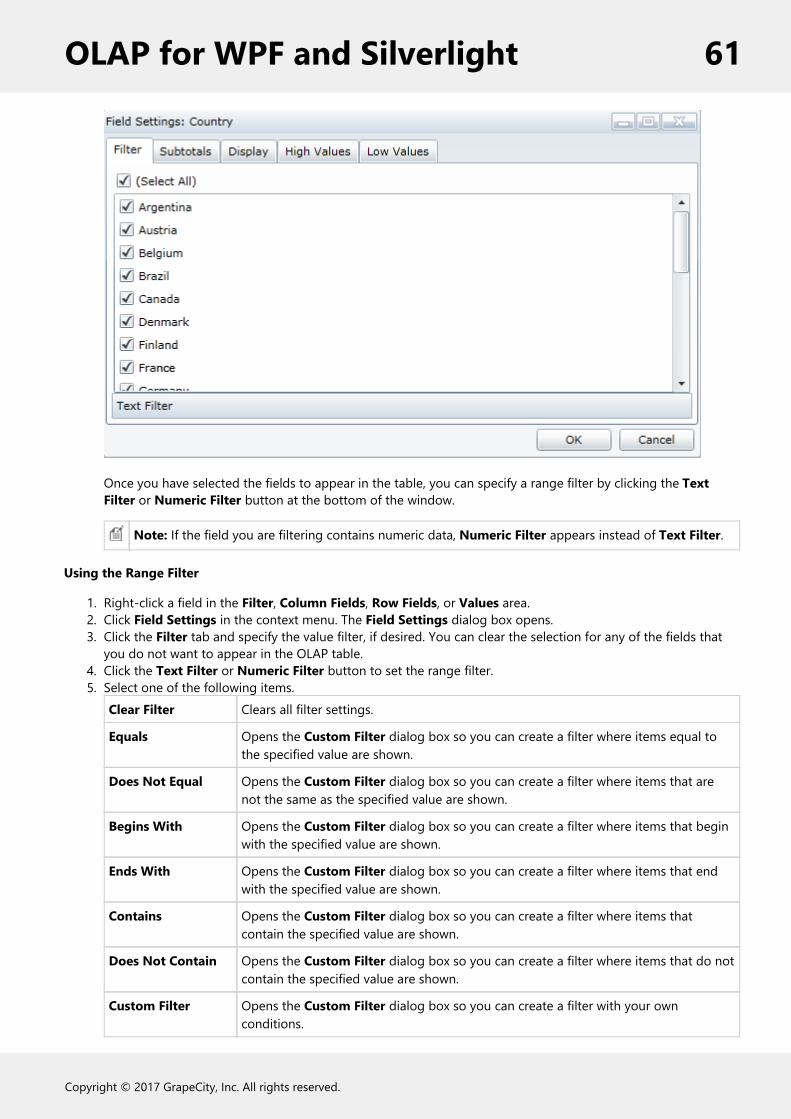
Once you have selected the fields to appear in the table, you can specify a range filter by clicking the TextFilter or Numeric Filter button at the bottom of the window.
Note: If the field you are filtering contains numeric data, Numeric Filter appears instead of Text Filter.
Using the Range Filter
1. Right-click a field in the Filter, Column Fields, Row Fields, or Values area.2. Click Field Settings in the context menu. The Field Settings dialog box opens.3. Click the Filter tab and specify the value filter, if desired. You can clear the selection for any of the fields that
you do not want to appear in the OLAP table.4. Click the Text Filter or Numeric Filter button to set the range filter.5. Select one of the following items.
Clear Filter Clears all filter settings.
Equals Opens the Custom Filter dialog box so you can create a filter where items equal tothe specified value are shown.
Does Not Equal Opens the Custom Filter dialog box so you can create a filter where items that arenot the same as the specified value are shown.
Begins With Opens the Custom Filter dialog box so you can create a filter where items that beginwith the specified value are shown.
Ends With Opens the Custom Filter dialog box so you can create a filter where items that endwith the specified value are shown.
Contains Opens the Custom Filter dialog box so you can create a filter where items thatcontain the specified value are shown.
Does Not Contain Opens the Custom Filter dialog box so you can create a filter where items that do notcontain the specified value are shown.
Custom Filter Opens the Custom Filter dialog box so you can create a filter with your ownconditions.
OLAP for WPF and Silverlight 61
Copyright © 2017 GrapeCity, Inc. All rights reserved.
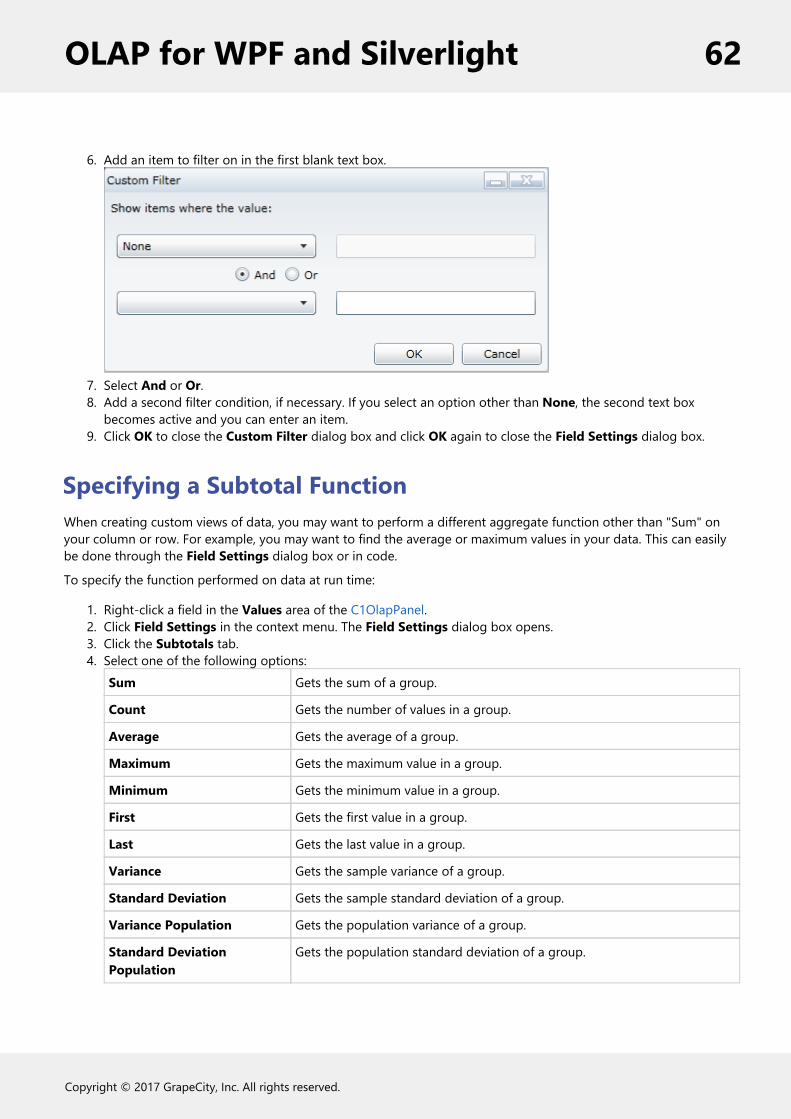
6. Add an item to filter on in the first blank text box.
7. Select And or Or.8. Add a second filter condition, if necessary. If you select an option other than None, the second text box
becomes active and you can enter an item.9. Click OK to close the Custom Filter dialog box and click OK again to close the Field Settings dialog box.
Specifying a Subtotal FunctionWhen creating custom views of data, you may want to perform a different aggregate function other than "Sum" onyour column or row. For example, you may want to find the average or maximum values in your data. This can easilybe done through the Field Settings dialog box or in code.
To specify the function performed on data at run time:
1. Right-click a field in the Values area of the C1OlapPanel.2. Click Field Settings in the context menu. The Field Settings dialog box opens.3. Click the Subtotals tab.4. Select one of the following options:
Sum Gets the sum of a group.
Count Gets the number of values in a group.
Average Gets the average of a group.
Maximum Gets the maximum value in a group.
Minimum Gets the minimum value in a group.
First Gets the first value in a group.
Last Gets the last value in a group.
Variance Gets the sample variance of a group.
Standard Deviation Gets the sample standard deviation of a group.
Variance Population Gets the population variance of a group.
Standard DeviationPopulation
Gets the population standard deviation of a group.
OLAP for WPF and Silverlight 62
Copyright © 2017 GrapeCity, Inc. All rights reserved.
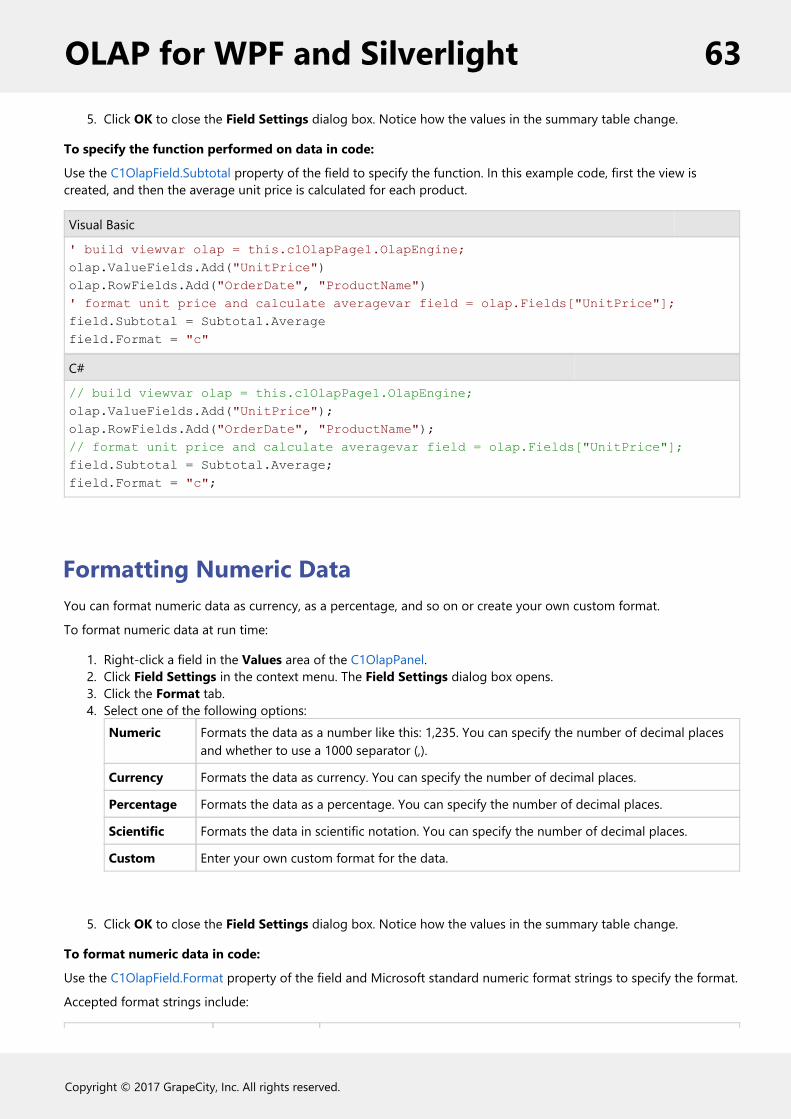
5. Click OK to close the Field Settings dialog box. Notice how the values in the summary table change.
To specify the function performed on data in code:
Use the C1OlapField.Subtotal property of the field to specify the function. In this example code, first the view iscreated, and then the average unit price is calculated for each product.
Visual Basic
' build viewvar olap = this.c1OlapPage1.OlapEngine;olap.ValueFields.Add("UnitPrice")olap.RowFields.Add("OrderDate", "ProductName")' format unit price and calculate averagevar field = olap.Fields["UnitPrice"];field.Subtotal = Subtotal.Averagefield.Format = "c"
C#
// build viewvar olap = this.c1OlapPage1.OlapEngine;olap.ValueFields.Add("UnitPrice");olap.RowFields.Add("OrderDate", "ProductName");// format unit price and calculate averagevar field = olap.Fields["UnitPrice"];field.Subtotal = Subtotal.Average;field.Format = "c";
Formatting Numeric DataYou can format numeric data as currency, as a percentage, and so on or create your own custom format.
To format numeric data at run time:
1. Right-click a field in the Values area of the C1OlapPanel.2. Click Field Settings in the context menu. The Field Settings dialog box opens.3. Click the Format tab.4. Select one of the following options:
Numeric Formats the data as a number like this: 1,235. You can specify the number of decimal placesand whether to use a 1000 separator (,).
Currency Formats the data as currency. You can specify the number of decimal places.
Percentage Formats the data as a percentage. You can specify the number of decimal places.
Scientific Formats the data in scientific notation. You can specify the number of decimal places.
Custom Enter your own custom format for the data.
5. Click OK to close the Field Settings dialog box. Notice how the values in the summary table change.
To format numeric data in code:
Use the C1OlapField.Format property of the field and Microsoft standard numeric format strings to specify the format.
Accepted format strings include:
OLAP for WPF and Silverlight 63
Copyright © 2017 GrapeCity, Inc. All rights reserved.
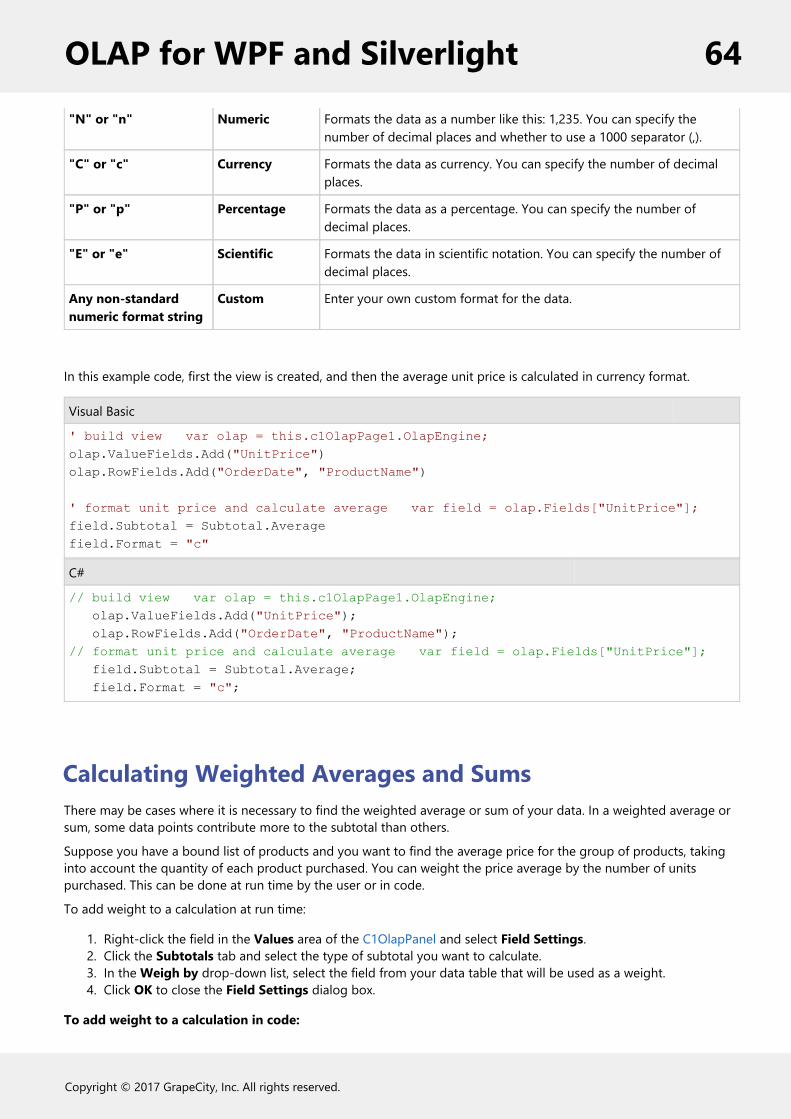
"N" or "n" Numeric Formats the data as a number like this: 1,235. You can specify thenumber of decimal places and whether to use a 1000 separator (,).
"C" or "c" Currency Formats the data as currency. You can specify the number of decimalplaces.
"P" or "p" Percentage Formats the data as a percentage. You can specify the number ofdecimal places.
"E" or "e" Scientific Formats the data in scientific notation. You can specify the number ofdecimal places.
Any non-standardnumeric format string
Custom Enter your own custom format for the data.
In this example code, first the view is created, and then the average unit price is calculated in currency format.
Visual Basic
' build view var olap = this.c1OlapPage1.OlapEngine;olap.ValueFields.Add("UnitPrice")olap.RowFields.Add("OrderDate", "ProductName")
' format unit price and calculate average var field = olap.Fields["UnitPrice"];field.Subtotal = Subtotal.Averagefield.Format = "c"
C#
// build view var olap = this.c1OlapPage1.OlapEngine; olap.ValueFields.Add("UnitPrice"); olap.RowFields.Add("OrderDate", "ProductName");// format unit price and calculate average var field = olap.Fields["UnitPrice"]; field.Subtotal = Subtotal.Average; field.Format = "c";
Calculating Weighted Averages and SumsThere may be cases where it is necessary to find the weighted average or sum of your data. In a weighted average orsum, some data points contribute more to the subtotal than others.
Suppose you have a bound list of products and you want to find the average price for the group of products, takinginto account the quantity of each product purchased. You can weight the price average by the number of unitspurchased. This can be done at run time by the user or in code.
To add weight to a calculation at run time:
1. Right-click the field in the Values area of the C1OlapPanel and select Field Settings.2. Click the Subtotals tab and select the type of subtotal you want to calculate.3. In the Weigh by drop-down list, select the field from your data table that will be used as a weight.4. Click OK to close the Field Settings dialog box.
To add weight to a calculation in code:
OLAP for WPF and Silverlight 64
Copyright © 2017 GrapeCity, Inc. All rights reserved.
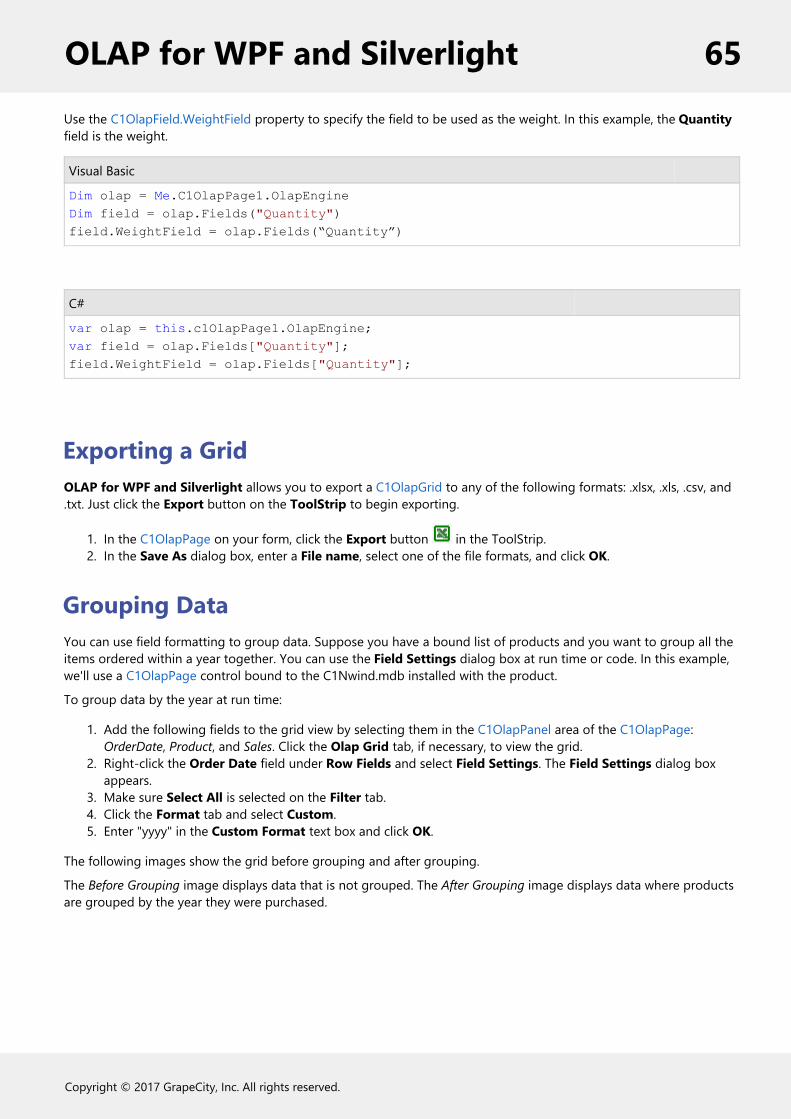
Use the C1OlapField.WeightField property to specify the field to be used as the weight. In this example, the Quantityfield is the weight.
Visual Basic
Dim olap = Me.C1OlapPage1.OlapEngineDim field = olap.Fields("Quantity")field.WeightField = olap.Fields(“Quantity”)
C#
var olap = this.c1OlapPage1.OlapEngine;var field = olap.Fields["Quantity"];field.WeightField = olap.Fields["Quantity"];
Exporting a GridOLAP for WPF and Silverlight allows you to export a C1OlapGrid to any of the following formats: .xlsx, .xls, .csv, and.txt. Just click the Export button on the ToolStrip to begin exporting.
1. In the C1OlapPage on your form, click the Export button in the ToolStrip.2. In the Save As dialog box, enter a File name, select one of the file formats, and click OK.
Grouping DataYou can use field formatting to group data. Suppose you have a bound list of products and you want to group all theitems ordered within a year together. You can use the Field Settings dialog box at run time or code. In this example,we'll use a C1OlapPage control bound to the C1Nwind.mdb installed with the product.
To group data by the year at run time:
1. Add the following fields to the grid view by selecting them in the C1OlapPanel area of the C1OlapPage:OrderDate, Product, and Sales. Click the Olap Grid tab, if necessary, to view the grid.
2. Right-click the Order Date field under Row Fields and select Field Settings. The Field Settings dialog boxappears.
3. Make sure Select All is selected on the Filter tab.4. Click the Format tab and select Custom.5. Enter "yyyy" in the Custom Format text box and click OK.
The following images show the grid before grouping and after grouping.
The Before Grouping image displays data that is not grouped. The After Grouping image displays data where productsare grouped by the year they were purchased.
OLAP for WPF and Silverlight 65
Copyright © 2017 GrapeCity, Inc. All rights reserved.
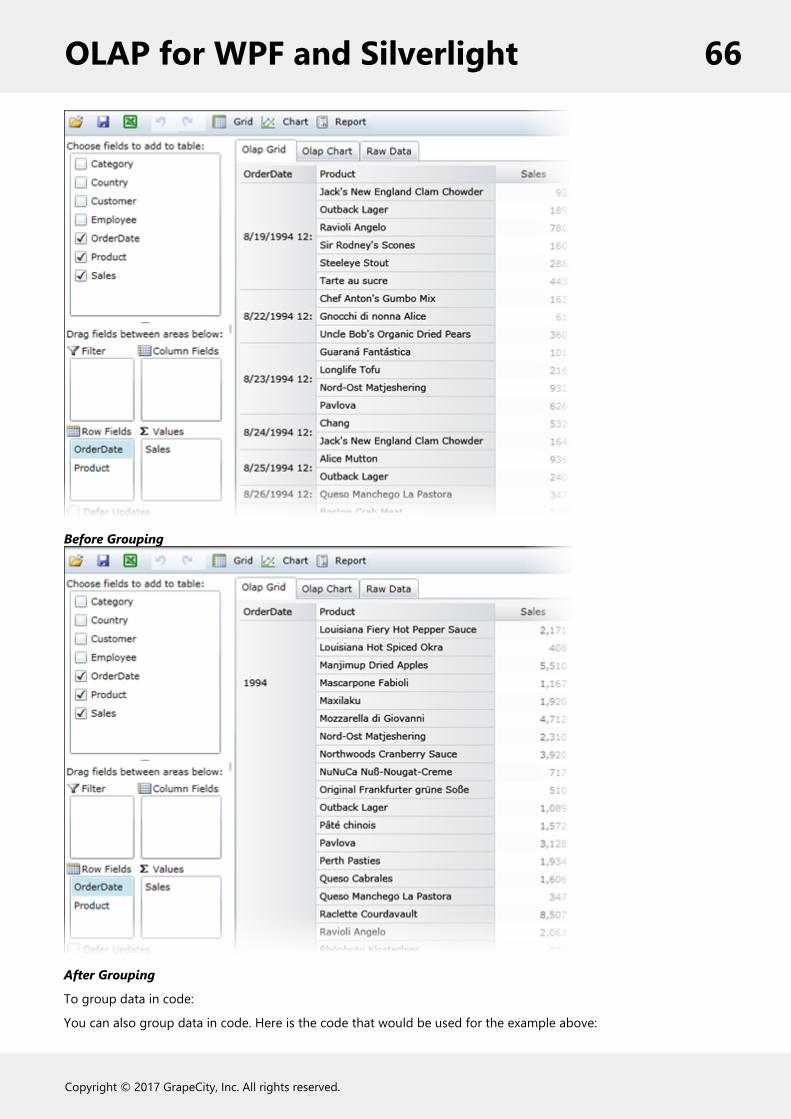
Before Grouping
After Grouping
To group data in code:
You can also group data in code. Here is the code that would be used for the example above:
OLAP for WPF and Silverlight 66
Copyright © 2017 GrapeCity, Inc. All rights reserved.
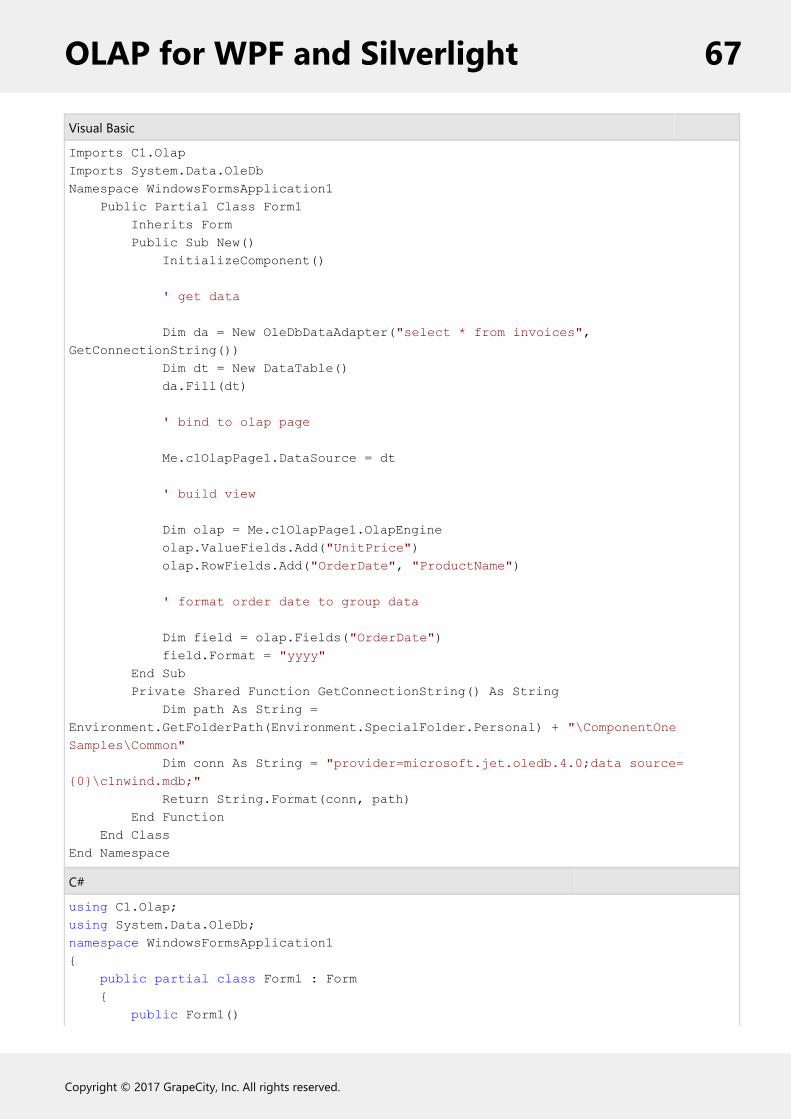
Visual Basic
Imports C1.OlapImports System.Data.OleDbNamespace WindowsFormsApplication1 Public Partial Class Form1 Inherits Form Public Sub New() InitializeComponent()
' get data
Dim da = New OleDbDataAdapter("select * from invoices", GetConnectionString()) Dim dt = New DataTable() da.Fill(dt)
' bind to olap page
Me.c1OlapPage1.DataSource = dt
' build view
Dim olap = Me.c1OlapPage1.OlapEngine olap.ValueFields.Add("UnitPrice") olap.RowFields.Add("OrderDate", "ProductName")
' format order date to group data
Dim field = olap.Fields("OrderDate") field.Format = "yyyy" End Sub Private Shared Function GetConnectionString() As String Dim path As String = Environment.GetFolderPath(Environment.SpecialFolder.Personal) + "\ComponentOne Samples\Common" Dim conn As String = "provider=microsoft.jet.oledb.4.0;data source={0}\c1nwind.mdb;" Return String.Format(conn, path) End Function End ClassEnd Namespace
C#
using C1.Olap;using System.Data.OleDb;namespace WindowsFormsApplication1{ public partial class Form1 : Form { public Form1()
OLAP for WPF and Silverlight 67
Copyright © 2017 GrapeCity, Inc. All rights reserved.
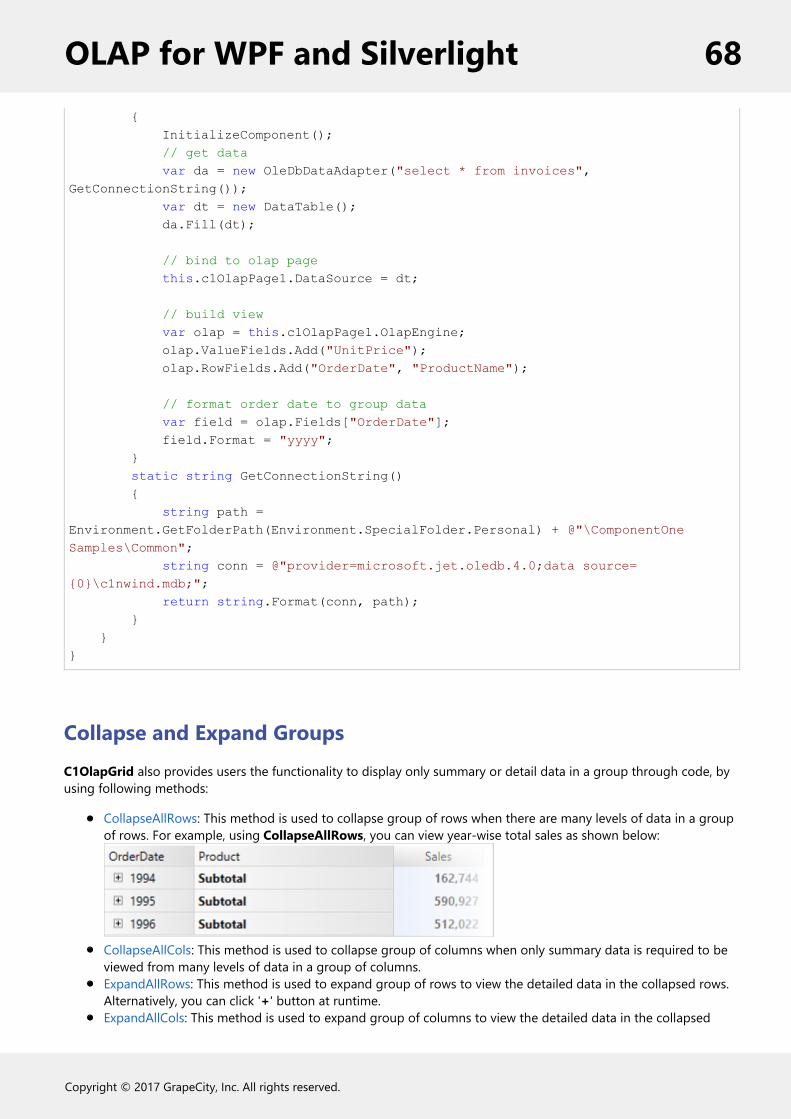
{ InitializeComponent(); // get data var da = new OleDbDataAdapter("select * from invoices", GetConnectionString()); var dt = new DataTable(); da.Fill(dt); // bind to olap page this.c1OlapPage1.DataSource = dt; // build view var olap = this.c1OlapPage1.OlapEngine; olap.ValueFields.Add("UnitPrice"); olap.RowFields.Add("OrderDate", "ProductName"); // format order date to group data var field = olap.Fields["OrderDate"]; field.Format = "yyyy"; } static string GetConnectionString() { string path = Environment.GetFolderPath(Environment.SpecialFolder.Personal) + @"\ComponentOne Samples\Common"; string conn = @"provider=microsoft.jet.oledb.4.0;data source={0}\c1nwind.mdb;"; return string.Format(conn, path); } }}
Collapse and Expand GroupsC1OlapGrid also provides users the functionality to display only summary or detail data in a group through code, byusing following methods:
CollapseAllRows: This method is used to collapse group of rows when there are many levels of data in a groupof rows. For example, using CollapseAllRows, you can view year-wise total sales as shown below:
CollapseAllCols: This method is used to collapse group of columns when only summary data is required to beviewed from many levels of data in a group of columns.ExpandAllRows: This method is used to expand group of rows to view the detailed data in the collapsed rows.Alternatively, you can click '+' button at runtime.ExpandAllCols: This method is used to expand group of columns to view the detailed data in the collapsed
OLAP for WPF and Silverlight 68
Copyright © 2017 GrapeCity, Inc. All rights reserved.

columns. Alternatively, you can click '+' button at runtime.
The following codes illustrates how to set these properties:
To collapse group of rows
VB
c1OlapPage1.OlapGrid.CollapseAllRows()
C#
c1OlapPage1.OlapGrid.CollapseAllRows();
To expand group of rows
VB
c1OlapPage1.OlapGrid.ExpandAllRows()
C#
c1OlapPage1.OlapGrid.ExpandAllRows();
Similarly, properties for collapsing and expanding of group of columns can be set.
Creating a ReportIn the C1OlapPage control, you can set up and print a report using the Report menu at run time.
To create the report, follow these steps:
1. Click the drop-down arrow next to Report on the C1OlapPage ToolStrip.2. Select Options. The Document Options dialog box appears.3. On the Page tab, select a page Orientation, Paper size, and set the Margins as desired.4. Click the Header/Footer tab.5. Place the cursor in the header or footer text box where you want to add text or a predefined header/footer
item.6. Click one of the buttons on the toolbar to insert the desired field.7. Click the Report Content tab.8. Check the check box next to the items you want included in the report. You can also select a radio button to
change the scaling of the grid or chart.9. Click OK to close the Document Options dialog box.
OLAP for WPF and Silverlight 69
Copyright © 2017 GrapeCity, Inc. All rights reserved.


