South Sudan NUTRITIONAL ANTHROPOMETRIC SURVEY CHILDREN UNDER FIVE YEARS OLD FINAL REPORT OLD FANGAK PAYAM, ZERAF COUNTY, CENTRAL UPPER NILE 3 rd –29 th November 2004 Julie Congo – Nutritionist John Pech – Programme Officer (ACF-USA) South Sudan
Transcript
S o u t h S u d a n
NUTRITIONAL ANTHROPOMETRIC SURVEY
CHILDREN UNDER FIVE YEARS OLD FINAL REPORT
OLD FANGAK PAYAM, ZERAF COUNTY,
CENTRAL UPPER NILE
3rd –29th November 2004
Julie Congo – Nutritionist John Pech – Programme Officer
Appendix 1. Nutritional Survey Cluster Selection Old Fangak November 2004................................... 26 Appendix 2. Anthropometric survey questionnaire................................................................................ 28 Appendix 3. Calendar of events in Old Fangak...................................................................................... 30 Appendix 4. Mortality survey questionnaire ........................................................................................ 301 Appendix 5. Map of the area ................................................................................................................ 312
3
ACKNOWLEDGEMENTS ACF-USA acknowledges the invaluable support and assistance of the following:
• Sudan Relief and Rehabilitation Commission (SRRC), in Old Fangak for facilitating the work. • The health surveyors for working with dedication in conducting the Nutritional/KAP survey.
• Local authorities, community members, leaders and mothers/caretakers for their co-operation. • The NGO on ground: COSV for their collaboration and support.
4
EXECUTIVE SUMMARY Old Fangak is situated in Zeraf County in the Central Upper Nile region. The area is currently comprised of five bomas: Old Fangak, Pulpam, Chotbora, Wanglel and Tuok (established as a new boma at the time of the survey). People are traditionally agro-pisca-pastoralists relying predominantly on sorghum, maize, milk and fish as the staple food and to some extent, common vegetables, legumes and fruits. ACF-USA has been implementing programs in the location since 2001 with the implementation of therapeutic and supplementary feeding programs in 2002 and 2003, nutritional surveillance activities (survey and screening), distribution of non food items, conduction of a gardening program linked to the feeding program, and an ongoing community based health education and nutrition surveillance program. 1. Justification of the survey Old Fangak payam has been a core area of intervention for ACF-USA. Several nutrition surveys have been conducted in the location, which have displayed GAM rates above the WHO benchmark of 15%1. A survey conducted in March 2004 for the first time in over 2 years of consistent nutritional surveillance intervention yielded GAM rate of 14%, below the internationally accepted cut off of WHO. These results were attributed to a wide range of factors such as the improved food security, health education and health services and better monitoring of the surveillance sessions. ACF-USA decided to implement a nutritional survey in Old Fangak in November 2004, in order to determine the nutritional situation after the wet season. 2. Objectives
To evaluate the nutritional status of children aged 6 to 59 months To identify groups at higher risk for malnutrition: age group and sex. To estimate the crude mortality rate through a retrospective survey To assess the extent of household movement To determine the coverage of the health education and nutritional surveillance program
3. Methodology A two-stage cluster sampling survey methodology including 514 children (30 clusters of 17 children each)2 was used. The sampling frame covered all villages falling within a radius of a three-hour walk from the center of each boma respectively. A total of 531 children were measured during the nutritional survey; but only the anthropometric data of 529 children were analyzed, two having been excluded from the analysis because of incorrect measurements in weight, age or height. A retrospective mortality survey (over the preceding three months) was also conducted alongside the anthropometric survey, including a total of 290 households.
1 WHO states malnutrition rates of 15% as the minimum standard for the declaration of an emergency crisis 2 Based on the previous prevalence rates of malnutrition – GAM 14% - determined by the ACF-USA March 2004 nutritional survey for the location.
5
In addition and alongside the nutritional survey, ACF-USA conducted a Knowledge, Attitude and Practice (KAP) survey when qualitative information was collected on hygiene practices, health, food security, nutrition, water and sanitation situation and HIV/AIDS. . 4. Results Table 1. Summary of results - Old Fangak, November 2004
AGE GROUP
INDICATOR RESULTS
Global Acute Malnutrition W/H< -2 z and/or oedema
15.5% (11.4%-20.7%)
Z-score
Severe Acute Malnutrition W/H < -3 z and/or oedema
1.7% (0.5%-4.4%)
Global Acute Malnutrition W/H < 80% and/or oedema
8.5% (5.5%-12.8%)
6-59 months (n = 529)
% Median
Severe Acute Malnutrition W/H < 70% and/or oedema
0.2% (0.0%-2.1%)
Global Acute Malnutrition W/H < -2 z and/or oedema
17.1% (10.9%-25.6%)
Z-score
Severe Acute Malnutrition W/H < -3 z and/or oedema
2.6% (0.6%-7.9%)
Global Acute Malnutrition W/H <80% and/or oedema
9.0% (4.6%-16.2%)
6-29 months (n = 234) % Median
Severe Acute Malnutrition W/H <70% and/or oedema
0.4% (0.0%-4.7%)
Crude retrospective mortality (preceding three months) Percentage of under five years deaths among the total deaths
1.1/10,000/day 77.3%
Table 2. Malnutrition trends in Old Fangak (acute malnutrition in Z-scores) - From October 2001 to March 2004 October 2001 March 2002 September 2002 March 2003 March 2004 November 2004 GAM 28.6%
(24.4-33.1%) 30.3%
(26-34.9%) 34.1%
(29.7-38.8%) 35.9%
(31.2-40.9%) 14%
(10.6-18.1%) 15.5%
(11.4-20%)
SAM 6% (4-8.8%)
5.7% (3.8-8.4%)
10.2% (7.6-13.6%)
10.2% (7.6-13.6%)
1.7% (0.7-3.8%)
1.7% (0.5-4.4%)
The results of the KAP survey are provided in a separate report.
5. Discussion The analysis of the anthropometric data of children aged 6 to 59 months shows the following rates of acute malnutrition, expressed in Z-scores:
Rate of Global Acute Malnutrition (GAM): 15.5 % (11.4%-20.7%) Rate of Severe Acute Malnutrition (SAM): 1.7% (0.5%-4.4%)
The rate of GAM is slightly above the emergency threshold of 15% but still in close comparison with result of 14% in the previous March 2004 survey. The SAM rate for both 6-59 months and 6-29 months was below the emergency level of 4% as defined by WHO. The analysis of the MUAC measurements for children aged one to five years’ reveals that 0.5 % of the children were severely malnourished, therefore at high risk of mortality, while 1.4% were moderately malnourished and 16.2% were at risk of malnutrition. 82.0% had a good nutritional status. The crude mortality rate that is 1.1/10,000/day is slightly above the alert level of 1/10,000/day3. 77.3% of the total deaths comprised of the under five population. The main presumed cause of death4 were: malaria (29.4%) and measles (23.5%) for the children under-five years, and bloody diarrhea (40%) and unknown5 causes (40%) for the population above-five years. The rate of malnutrition experienced is at the cut off mark and requires monitoring. The following factors can explain the nutrition status:
- Poor water and sanitation: The community at large experiences the need for increased clean water sources. Pulpam Boma has the highest need as it is completely cut off from the river source and exclusively relying on swamps and pools of stagnant water as the only source of water. Lack of clean water affects water consumption and hygiene practices. Open defecation is widely practiced contributing to the contamination of water sources.
- Limited health services: Health remains an issue to be tackled in the payam with the high mortality rates noted amongst the under five population. Distance and difficult access to the health centers is a prime concern, with the majority of the population having large distances to pass through to get treatment. There is a strong link between disease and malnutrition.
- Nutrition and Early Childhood Feeding: Poor feeding practices amongst the under five was eminent with some mothers introducing solid food to their children a year after birth with minimum diversification. It was however noted that majority of the mothers exclusively breastfed children less than six months however an evident need for training on improved weaning practices was observed.
- The food security situation: Some areas of Old Fangak, experienced destruction of crops by bird and pest attack. Rains begun late and was heavy last year, resulting in floods. This resulted in crop destruction and some gaps with insufficient food stocks. Poor condition and minimal availability of farming tools, resulting to sharing of tools among families has limited the acreage under cultivation. The livestock health status is characterized with disease resulting to low milk production, loss of weight and death.
Even though the SAM rates (1.7%) obtained were below the emergency threshold of 4 %, GAM rates (15.5%) were observed to be just above the emergency threshold of 15%6. Given the observed continued
3 Health and nutrition information systems among refugees and displaced persons, Workshop report on refugee’s Nutrition, ACC / SCN, Nov 95. 4 The relatives of the dead persons give presumed causes of death. 5 Unknown: The family members did not know the cause of death and no medical examination was done to determine the cause. 6 The emergency threshold for GAM is 15% and that of SAM is 4% as defined by WHO
7
poor access to water/sanitation facilities, health centers, poor early child feeding/weaning practices and existing pockets of food insecurity it is believed the nutritional status of the population though not at a crises, would still demand close monitoring to prevent the situation from slipping into that of an emergency7. Further justification for this deduction is based on the observed decline in the nutritional status of GAM 14% in the previous survey of March 2004, to 15.5% in the current survey. With the month of March being within the typical period of the hunger gap (February – July) and November being within the period of food abundance an improvement in the food situation would have been expected for the current survey. From the above results, it can be concluded that the malnutrition rates obtained, though just above the emergency cut of mark, require close monitoring in order to prevent a possible deterioration of the nutritional status of the population and a potential nutritional crisis. 6. Recommendations
• Increased health services coverage, especially in the newly created boma (Tuok), by COSV and/or another health agency.
• Integration of the treatment of severely malnourished individuals in the existing health facilities, by ACF-USA in collaboration with COSV
• Increased longer-term impact activities in order to improve food security and livelihoods (like improved agriculture, black smith training for production of tools), by ACF-USA and/or another agency
• Monitoring of the food security situation, by ACF-USA and WFP • Distribution of food aid in case of detected food insecurity, by WFP • Increased and coordinated health education activities at the PHCC/Us level and within the
community, by ACF-USA and COSV. • Maintained community based health education and nutrition surveillance in the location, by ACF-
USA • Increased nutritional education to mothers with an emphasis on weaning practices, by ACF-USA • Improved sanitation by increasing the access to latrines, by ACF-USA and/or another agency • Water and sanitation assessment and corresponding intervention in order to increase the access to
safe drinking water in the whole payam, by UN-WES and/or another water and sanitation agency.
7 Even though harvesting of the sorghum was still being conducted at the time of the survey, results of focus group discussions pointed to a reduction in the overall quantity of the harvest as compared to the previous year
INTRODUCTION Old Fangak Payam is situated in Zeraf County, Phou State, in Central Upper Nile. The district comprises of five bomas (Old Fangak, Pulpam, Chotbora, Wanglel and Tuok). Tuok is a new boma established from Chotbora. Old Fangak has a total population of approximately 11,120 based on results obtained form current surveys8. Even though over the past two years an increasing number of IDPs and returnees have set up homes in the location, reliable estimates of these numbers are yet to be compiled. The local population comprises of two clans, the Lak Nuer being the majority and the Thiang Nuer. The terrain is characteristically flat, swampy and crossed by Bahr-el-Zeraf River, locally known as Phou River. Flooding in the Zeraf Island is a normal occurrence during the rainy season. The populations of Zeraf County in general and Old Fangak in particular have been particularly vulnerable to the past continuous hostilities between the government of Sudan (GOS) and SPLM/SPLA, which decreased by the middle of 2002. As a result of this, the community was not able to form a farming base and agencies were unenthusiastic to implement long-term programs in the location. This situation has however, gradually changed over the past months, with agencies gradually expanding their on ground programs and activities and the populations implementing more long term activities, like construction and expansion of local markets and trading points. 1. Food security The communities of Old Fangak Payam are traditionally agro-pisca-pastoralists. The main food crops consumed by the population are sorghum (bel) and maize (manytap). Cow milk and fish are the main sources of proteins while pumpkin, okra, and cowpeas are the commonly consumed vegetables. Some wild food such as kieynom, kudra, wur, yiel (water lily), riek, keei, thial, nyardiel, tamarind and lalop (leaves, nuts and fruit) are consumed as food supplements in case of food shortage. Households supplement their diet with wild fruits, products of hunting and they also sell their livestock to purchase grain. At the time of the survey, the lalop and the tamarind were being consumed. According to the 2004 FEWSnet reports, Upper Nile as like most parts of south Sudan experienced a drier planting year than the previous year of 2003. As a result, crop yields for 2004 were lower than the previous year of 2003 for Old Fangak even though the overall yields were still better than the drought year of 2002. To assist with the general food security the ACF-USA EP&R team distributed diversified seeds, targeting 900 households in May 20049. Training of the sustainable farming base and farmers was also implemented simultaneously. The seeds distributed were observed to be consumed and grown by some households at the time of the survey, these comprised of okra, simsim, groundnuts and cowpeas. Minimal availability and quality of farming tools limits the area covered during cultivation. This was reported to have been due mainly to the poor condition of tools - with the majority being blunt or broken- while, the few that were available in the community were mentioned to have been shared amongst families. The last tools distribution was done in 2002 by ACF-USA, hence the probably deterioration. Community members expressed a deep need for farming tools to enable them increase the acreage cultivated for the next planting. Livestock for Old Fangak is mainly composed of cattle and goats. According to the discussions held with the community, the average number of cattle in a household was estimated to be 5-7. Earlier surveys had 8 See ACF-USA March 2004 nutritional survey report. 9 EP&R: Signifies Emergency Preparedness and Response
9
reported a good observed health condition of the livestock10. The reliance of the population on livestock as a source of income and general household food security compels the need for assessment of the health conditions of the livestock in addition to other factors such as decline in numbers as a result of sale or death. Although there was sufficient pasture for the cattle as a result of the rain in the recent months, at the time of the survey the health condition of the livestock was characterized with diseases such as foot and mouth disease, dat, yeth, disease causing sudden death along with other diseases. Diseased cattle were a common occurrence characterized by loss of weight, low milk production and sometimes death was observed. Fishing is an activity that occurs throughout the year for most parts of Old Fangak due to the presence of the Phou River. It was however strongly expressed in all discussions that the community was unable to exploit the tremendous potential of fish to the maximum due to the limitation of fishing nets, hooks and canoes. The need for organized workshops on fisheries is observed as essential to enhance the local capacity and help ensure sustainable means of increased food security. The establishment of a market in Old Fangak in April 2003 meant the beginning of trade in an area which had been extremely volatile. Populations were unable to establish centers for trade and public interaction. Over the ensuing months the market has rapidly grown to accommodate over 25 stalls with brisk trade in a variety of basic household food essentials ranging from food to clothing. At the time of the survey the local market had expanded to accommodate approximately 40 stalls providing foods that are not available in the home to supplement the diet. Food items available included: sorghum cane, dates, dried fish, meat, salt, tea, sugar, oil, onions etc. A wide range of other non-food items were also observed to be available. 2. Health Since 2000, COSV has been in responsible for the implementation of the health care programs in Old Fangak. Like in all parts of Sudan, health in Old Fangak has been an area of primary concern given the limited number of health centers and the vast areas to be traversed by the local population to access the health centers. In Old Fangak in particular the severity of the underlying impact of health on the nutritional status of the under five population has been a prime concern11. ACF-USA sought to curtail this problem via the direct advocacy to the responsible health sectors as well as the institution of other nutritional support structures such as gardening programs, and community based health and hygiene education programs. ACF-USA has aimed to help increase the attainment of adequate health in the location. COSV has currently one Primary Health Care Center (PHCC) in Old Fangak and a Primary Health Care Unit (PHCU) in three of the other five bomas namely, Pulpam, Wanglel and Chotbora. The PHCUs offer basic curative services and refer patients to the PHCC for more stringent medical problems whilst the PHCC provides both preventive and curative services alongside receiving referrals from other payams such as Paguir, Keew, Malakal, Ayod etc. The COSV staffing comprises of a doctor, nurses, a lab technician, an engineer, a nurse assistant, an orthopaedic technician, Community Health Workers (CHWs), assistant CHWs and Traditional Birth Attendants (TBAs). A clinical laboratory was introduced in the PHCC in 2003 and it currently offers the following services: detection of malaria, tuberculosis (TB), kalazar, stool and urine analysis and most recently HIV/AIDS voluntary testing and counseling services. The Maternal and Child health unit within the PHCC also offer antenatal and post-natal care, as well as measles vaccination. Recent developments within the health center at the time of the previous survey of March 2004 included the integration of a Kalazar and TB clinic within the PHCC. The PHCC is supposed to be upgraded it to the capacity of a hospital. 10 ACF-USA March 2004 Nutritional Survey Report 11 ACF-USA Old Fangak Nutritional survey reports 2001, 2002, 2003 and 2004
10
3. Water and sanitation Water and sanitation is a vital issue in Old Fangak and requires an intervention. Only one borehole exists in the whole payam, and this is located in Old Fangak boma. Four out of the five bomas namely: Chotbora, Old Fangak, Wanglel and Tuok are primarily dependant on rivers and swamps as the main water sources. The fifth boma, Pulpam, has no access to the river and relies primarily on swamps and stagnant pools as the main sources of water. The availability of water becomes even more desperate during the dry season when the seasonal streams for the more interior villages dry out and the community relies on concentrated contaminated pools of water. The severity of this is more marked in Pulpam as determined by the large scale movement on the toic for the general population as a whole12. Open ground defecation is also the standard practice in the whole community with only a handful of public sectors (~5) having constructed latrines. 4. Agencies intervening in the area ACF-USA has been implementing interventions in Old Fangak Payam since 2001. The annual anthropometric surveys implemented in Old Fangak had displayed high and increasing rates of acute malnutrition, which resulted to the implementation of therapeutic and supplementary feeding programmes in 2002 and 2003, a gardening programme running concurrently with the feeding programmes, food security activities (distribution of seeds and tools since 2001) and a community-based health education and nutrition surveillance (since 2003). ACF-USA is currently setting up a therapeutic feeding unit within the PHCC of Old Fangak, in close collaboration with COSV. Other organizations on ground are displayed in a table 3 below. Table 3: Agencies intervening in Old Fangak payam
Agency Activities ACF-USA
• Nutrition surveillance: regular nutrition surveys and community based nutrition
surveillance • Health education & hygiene promotion • Nutrition treatment: support to COSV to integrate the treatment of severe
malnutrition within the PHCC of Old Fangak • Food Security: improved agriculture project
WFP • Targeted Food Aid distribution and monitoring COSV • Health: 1 PHCC and 3 PHCUs
SCF-UK • Education: Material, financial and supports supervision of the primary school.
12 Toic = dry seasonal movement to the cattle or fishing camp.
11
METHODOLOGY The survey was conducted from the 3rd to the 29th of November 2004 in the five Bomas of Old Fangak Payam, in Zeraf County, Central Upper Nile. 1. Type of survey and sample size The target population of the survey was children between the ages of 6-59 months. The area covered was restricted to villages located at a maximum of three hours walking distance from the center of the bomas. The total population of villages three hours walking distance from the center of the bomas was estimated at 11,118 people. This gave a target population estimated at 2,224 children (calculated as 20% of the total population). A two-stage cluster sampling methodology with 30 clusters composed of 17 children each was chosen. This sample size has been taken to provide the estimates of prevalence of malnutrition with a 95% confidence interval. A KAP13 and retrospective mortality survey (over the preceding three months) was also conducted alongside the anthropometric cluster survey. 2. Sampling Methodology A two-stage cluster sampling was used:
• At the first stage, 30 clusters were randomly selected from the list of accessible villages (See appendix 1 for estimated population and cluster determination), the covered area being limited to a maximum of a three-hour walking distance from the center of each boma in Old Fangak payam. The probability of selection was proportional to the village population size.
• At the second stage, i.e. the selection of the households within each cluster, the standard ACF methodology was used: a pen was spun while being at the central point of the selected cluster, defining a random direction. All the children aged 6-59 months of the households encountered in that direction were measured. A household was defined as a group of people who shared a ‘cooking pot’.
3. Data Collection During the anthropometric survey, for each selected child aged between 6 and 59 months, the following information was recorded (See appendix 2 for the anthropometric questionnaire):
• Age: recorded with the help of a local calendar of events (See appendix 3 for the calendar of events) • Sex: male or female • Weight: children were weighed without clothes, with a SALTER balance of 25 kg (precision of
100g). • Height: children were measured on a measuring board (precision of 0.1 cm). Children less than
85 cm were measured lying down, while those greater than or equal to 85 cm were measured standing up.
• Mid-Upper Arm Circumference: MUAC was measured at the mid-point of the left upper arm for measured children (precision of 0.1 cm).
• Bilateral oedema: assessed by the application of normal thumb pressure for at least 3 seconds to both feet.
13 KAP: Knowledge attitude and practice survey
12
• Household status: for the surveyed children, households were asked if they were permanent residents and temporarily in the area.
• Tribe: the tribe of the households was determined For the retrospective mortality survey, all the households selected by the sampling methodology were interviewed, even when no eligible children for the anthropometric survey were present. The data collected were: the numbers of household members alive per specified age group, the numbers of people present within the recall period, the number of dead over the last 3 months, and if any, the presumed cause of death. (See appendix 4 for mortality questionnaire). 4. Indicators, Guidelines and Formulas Used 4.1 Acute malnutrition
• Weight-for-Height Index
For the children, acute malnutrition rates were estimated from the weight for height (WFH) index values combined with the presence of oedema. The WFH indices are compared with NCHS14 references. WFH indices were expressed both in Z-scores and percentage of the median. The expression in Z-scores has true statistical meaning and allows inter-study comparison. The percentage of the median on the other hand is commonly used to identify eligible children for feeding programs. Guidelines for the results expressed in Z-score:
Severe malnutrition is defined by WFH < -3 SD and/or existing bilateral oedema on the lower limbs of the child
Moderate malnutrition is defined by WFH < -2 SD and ≥ -3 SD and no oedema. Global acute malnutrition is defined by WFH < -2 SD and/or existing bilateral oedema
Guidelines for the results expressed in percentage according to the median of reference:
Severe malnutrition is defined by WFH < 70 % and/or existing bilateral oedema on the lower limbs Moderate malnutrition is defined by WFH < 80 % and ≥ 70 % and no oedema. Global acute malnutrition is defined by WFH <80% and/or existing bilateral oedema
• Children’s Mid-Upper Arm Circumference (MUAC)
The weight for height index is the most appropriate index to quantify wasting in a population in emergency situations where acute forms of malnutrition are the predominant pattern. However, the mid-upper arm circumference (MUAC) is a useful tool for the rapid screening of children at a higher risk for mortality. The MUAC is only taken for children with a height of 75 cm and more. The guidelines are as follows: MUAC measurement Classification of malnutrition MUAC < 110 mm Severe malnutrition and high risk of mortality MUAC ≥ 110 mm and <120 mm Moderate malnutrition and moderate risk of mortality MUAC ≥ 120 mm and <125 mm High risk of malnutrition MUAC ≥ 125 mm and <135 mm Moderate risk of malnutrition MUAC ≥ 135 mm ‘Adequate’ nutritional status
14 NCHS: National Center for Health Statistics (1977) NCHS growth curves for children birth-18 years. United States. Vital Health Statistics. 165, 11-74.
13
4.2 Mortality The crude mortality rate (CMR) is determined for the entire population surveyed for a given period. The CMR is calculated from the death rate for the entire population (DR). The formulae are as follows: Death Rate (DR) = n / [((n+M1) + M2) / 2] Where n = number of deaths within a given period M1 = number of persons alive over a given period M2 = number of persons alive at the time of the survey Crude Mortality Rate (CMR) = (DR x 10,000) / number of days in the period. The period corresponds to the 3 months (90 days) preceding the survey. Therefore, CMR = (DR x 10,000) /90. It is expressed per 10,000-people / day. The thresholds are defined as follows: Alert level: 1/10,000 people/day Emergency level: 2/10,000 people/day The percentage of deaths within the past 3 months among the under five years old age group is also calculated. 5. Fieldwork ACF-USA staff comprising of a nutritionist and a program officer who trained and monitored the survey teams in the villages. Two teams of three surveyors each executed the fieldwork. All the surveyors participating in the survey underwent a three to four day refresher training, which included a pilot survey. Health surveyors were merged in the training from two bomas. The survey (including training) lasted 27 days. Villages that were within three hours walking distance from the center of the boma were selected. The surveyors had an opportunity to interview a household and fill out: an anthropometric, KAP and mortality questionnaires. 6. Data Analysis Data processing and analysis were carried out using EPI-INFO 5.0 software and EPINUT 2.2 program. 7. Constraints Encountered During Implementation The survey took place during the harvest season and it was difficult to get mothers at home while at the same time some of the health surveyors were busy and could not participate. In addition to this, it was difficult to access the target groups required for discussions.
14
RESULTS
1. Distribution by Age and Sex Table 4. Distribution by age and sex for children involved in the survey.
TOTAL 286 53.9 243 46.1 529 100.0 1.17 The above distribution by sex does not show a significant imbalance: the overall sex ratio of 1.17 is similar to results obtained from previous surveys in the location and thus displays an unbiased selection of the sample within the limits of the 2 stage cluster sampling methodology15. This is displayed graphically in Figure 1 below. Figure 1. Graphical distribution by age and sex for children involved in the survey
-60% -40% -20% 0% 20 % 40 % 60 %
Pe rce nta ge
06 -1 7
18 -2 9
30 -4 1
42 -5 3
54 -5 9
Age
in M
onth
s
Distribution by Age and Sex
BoysG irl s
The more or less symmetrical alignment of girls versus boys from the central axis of 0% displays a balanced distribution by age and sex for the surveyed children of 6-59 months.
The distribution of acute malnutrition in Z-scores shows that the global acute malnutrition is equal to 15.5% with 1.7% of the children being severely malnourished and 13.8% moderately malnourished.
Table 6. Weight for Height vs. Oedema in Z-scores
Presence of Oedema < -2 SD ≥ -2 SD Marasmus/Kwashiorkor Kwashiorkor YES 0 0.0% 0 0.0% Marasmus Normal NO 82 15.5% 447 84.5%
There was no case of kwashiorkor found in the sample. All the malnutrition cases found were marasmic.
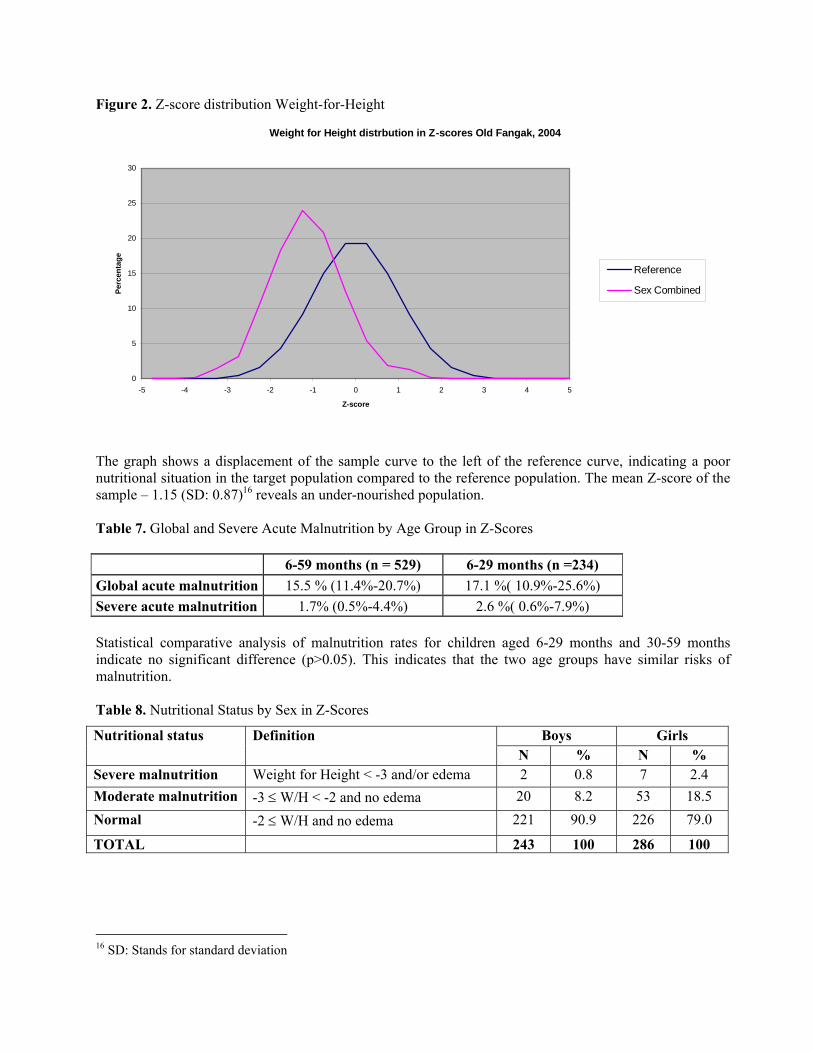
Figure 2. Z-score distribution Weight-for-Height
Weight for Height distrbution in Z-scores Old Fangak, 2004
0
5
10
15
20
25
30
-5 -4 -3 -2 -1 0 1 2 3 4 5
Z-score
Perc
enta
ge
Reference
Sex Combined
The graph shows a displacement of the sample curve to the left of the reference curve, indicating a poor nutritional situation in the target population compared to the reference population. The mean Z-score of the sample – 1.15 (SD: 0.87)16 reveals an under-nourished population. Table 7. Global and Severe Acute Malnutrition by Age Group in Z-Scores
6-59 months (n = 529) 6-29 months (n =234) Global acute malnutrition 15.5 % (11.4%-20.7%) 17.1 %( 10.9%-25.6%) Severe acute malnutrition 1.7% (0.5%-4.4%) 2.6 %( 0.6%-7.9%) Statistical comparative analysis of malnutrition rates for children aged 6-29 months and 30-59 months indicate no significant difference (p>0.05). This indicates that the two age groups have similar risks of malnutrition. Table 8. Nutritional Status by Sex in Z-Scores
Boys Girls Nutritional status Definition N % N %
Severe malnutrition Weight for Height < -3 and/or edema 2 0.8 7 2.4 Moderate malnutrition -3 ≤ W/H < -2 and no edema 20 8.2 53 18.5 Normal -2 ≤ W/H and no edema 221 90.9 226 79.0
TOTAL 243 100 286 100
16 SD: Stands for standard deviation
17
The statistical analysis revealed a significant (p<0.05) difference in the prevalence of malnutrition in Z-scores between boys and girls, with girls presenting a relative risk of 2.32 (95% Confidence interval: 1.47 < RR < 3.66) 17. In other words girls were found to be over two times more likely to be malnourished than boys. This risk comparison is extremely high and no explanations could be put forward to explain the obtained results. Further investigations to the possible causes are to be carried out in the location.
• Distribution of malnutrition in percentage of the median Table 9. Weight for Height distribution by age in percentage of the median
The distribution of acute malnutrition in percentage of the median reveals a global acute malnutrition rate of 8.5 %, comprising of 0.2% severely malnourished and 8.3 % moderately malnourished individuals.
Table 10. Weight for Height vs. oedema in percentage of median
Presence of Oedema < -2 SD ≥ -2 SD Marasmus/Kwashiorkor Kwashiorkor YES 0 0.0% 0 0.0% Marasmus Normal NO 45 8.5% 484 91.5%
Similar to results obtained for the weight for height vs. oedema in Z score (table 6), no case of kwashiorkor was found in the sample when analyzed using the percent of the median malnutrition index. Table 11. Global and Severe Acute Malnutrition by age group in percentage of the median
6-59 months (n = 529) 6-29 months (n = 234) Acute global malnutrition 8.5% (5.5%-12.8%) 9.0 %( 4.6%-16.2%) Severe acute malnutrition 0.2% (0.0%-2.1%) 0.4 %( 0.0%-4.7%) According to the weight for height in percentage of median there is no significant difference in the nutritional status between the age groups 6-29 months and 30-59 months old (p>0.05).
17 RR: Stands for relative risk
18
Table 12. Nutritional Status by sex in percentage of median
Boys Girls Nutritional status Definition N % N % Severe malnutrition Weight for Height < 70% or oedema 0 0.0 1 0.3 Moderate malnutrition 70% ≤ Weight for Height < 80% 12 4.9 32 11.2 Normal Weight for Height ≥80% 231 95.1 253 88.5 TOTAL 243 100 286 100 Similar to the statistical analysis for nutritional status by sex in Z scores (table 8) a significant (p<0.05) difference in the prevalence of malnutrition in percent of the median was observed between boys and girls, with girls being over twice more likely to be malnourished as compared to boys with girls presenting a relative risk of 2.34 (95% Confidence interval: 1.23 < RR < 4.42) 18. In other words girls were twice more likely to be malnourished than boys. This risk comparison is again extremely high and no explanations could be put forward to explain the obtained results. Further investigations to the possible causes are greatly encouraged to be carried out in the location. 2.2. Risk of mortality: children’s MUAC for children aged 6 to 59 months
As MUAC overestimates the level of malnutrition in children less than one year old, the analysis refers only to children having a height equal to or greater than 75 cm. A total of 444 children have therefore been included in the analysis. Table 13. MUAC distribution according to nutritional status
Total 75 - 90 cm height ≥ 90 cm heightCriteria Nutritional status N % N % N %
< 110 mm Severe malnutrition 2 0.5 2 1.1 0 0 110 mm ≥ MUAC<120mm Moderate malnutrition 6 1.4 5 2.8 1 0.4 120 mm ≥ MUAC<135 mm At risk of malnutrition 72 16.2 49 27.1 23 8.7
MUAC ≥ 135 mm Normal 364 82.0 125 69.1 239 90.9 TOTAL 444 100 181 100 263 100
According to the MUAC measurement, 0.5 % of the children were severely malnourished and therefore at a high risk of mortality, 1.4% were moderately malnourished and 16.2% were at risk of malnutrition. 3. Household Status and Composition The residential status information was collected from 290 mothers/caretakers interviewed during the nutritional and KAP survey. A large proportion of the surveyed families were residents (94.1%), and 5.9% temporarily reside in the location. Internally displaced populations were not included in the sample, due to the small sample size used in the survey (514). 18 RR: Stands for relative risk
19
Table 14. Household status
Residential status N % Residents 273 94.1 Temporary Residents (in transit) 17 5.9 Total 290 100.0
Table 15. Household composition
Age group N % 0 to 59 months 639 28.5 > 59 months 1,607 71.5 Total 2,246 100
290 households were visited during the retrospective mortality survey, of which 17 did not have children below five years old. The mean number of children under five per household is 1.62 (SD: 0.89) while the mean number of the children above five and adults per household is 5.04 (SD: 2.19). Table 16. Tribe of the children measured during the anthropometric survey
Status N % Nuer 253 87.2 Dinka 37 12.8 Total 290 100.0
As the Old Fangak county is sited in the middle of the Nuer tribal land, the observed tribal distribution of a high Nuer population was found to be acceptable. Additionally, as previous surveys have not indicated the tribal distribution of surveyed children the observation of 12.8% of the surveyed children being Dinka could not be accurately determined as normal or increased. No concern was however expressed survey participants on the presence of Dinka children/ families. 4. Mortality Survey 4.1 Crude mortality rate (CMR) The crude mortality was calculated from the figures collected from families with or without children under five. A total of 22 deaths were reported within the three months preceding the survey; 77.3 % were children under five years and 22.7 % were people above five years. The total number of people alive (both under five years and above five years) during the survey was estimated at 4,203 and the number of people living in the area during the recall period was 4,389. Death Rate (DR) = 22/ [((22+2246) +2246)/2] = 0.0097 Crude Mortality Rate (CMR) = [0.0097 x 10,000]/90 people/day = 1.1 According to the above formula, the crude mortality rate is 1.1/10,000/day. Under Five years
20
There were 639 children under age five alive and 17 children under five had died within the three preceding months, representing 77.3% of the total number of deaths over that period. Above Five years On the day of the survey there were 1,607 above age five alive and five above age five had died within the three preceding months representing 22.7% of the total number of deaths over that period. 4.2 Causes of Mortality
Table 17. Presumed causes of death
Under five Above five Presumed cause of death N % N %
The “other” causes included: 2 under five causes: Infant death (1), Swelling of the back (1) 2 above five causes: Death during child birth (1), Unknown disease (1)
21
DISCUSSION The results of the nutritional survey show that the nutritional situation in Old Fangak is slightly above the emergency thresholds. Analysis of the anthropometric data of children aged 6 to 59 months showed Global Acute Malnutrition Rate of 15.5 % (GAM) and Severe Acute Malnutrition rate of 1.7% (SAM) expressed in Z-scores. Malnutrition rates in Old Fangak have declined drastically in 2004, with 14% and 15.5% respectively as compared to GAM rates ranging from 28% to 36% between 2001 and 2003. This can be due to close nutritional monitoring, targeted programs by external agencies and the relatively stable security experienced in the location. The MUAC results are in correspondence with the GAM and SAM rates obtained from this survey. Mid Upper Arm Circumference measurements of children aged one to five years’ revealed that 0.5 % of the children were severely malnourished and therefore at high risk of mortality, while 1.4% were moderately malnourished and 16.2% were at risk for malnutrition. 82.0% had a good nutritional status. The calculated statistical analysis indicates that there is no significant difference in the nutritional status of the 6-29 months and the 30-59 months children. This implies that both age groups have the same risk of being malnourished. Statistical analysis of sex versus malnutrition however, showed a significant (p<0.05) prevalence in malnutrition rates for female children versus male children with the females in all cases (WHZ and WHM) being twice more likely to be malnourished than male children. Even though no possible reasons could be identified during the survey more investigations into this anomaly is strongly recommended. The crude mortality rate obtained within this survey was 1.1/10,000/day. This result is slightly above the alert level, with 77.3% of deaths comprising of the under five population. The main presumed causes of death were malaria and measles for the children under-five years. Results of this survey therefore showed despite the fairly stable food security situation and the improvements made within the local health organization, no improvement in the overall malnutrition rates for children 6- 59 months in Old Fangak had been observed within the past months. Possible reasons to explain this observation:
• Limited health services:
Although primary health care has markedly improved in the location mainly via the expansion of the health centers to include kalazar and TB cases as well as the conduction of more laboratory tests, health care still remains an issue in Old Fangak. Limited access to the health centers remains as one of the primary areas of concern with the majority of the population residing far from the centers and thus having to traverse large distances to get to the centers – a feat which is fairly feasible in the dry seasons but largely insurmountable for some areas in the wet season. As a result even though more residents may attend the center to bring in the very ill from distant villages other common disease e.g. malaria, diarrhea etc may still not be referred to the centre19. This was evidenced by the high mortality and morbidity rates noted amongst the under five population with malaria still reported by COSV as the highest cause of death (30%) in under fives, followed by respiratory infections (13.7%), watery diarrhea (10%) and bloody diarrhea (8%). 19 It is believed that even though residents living close by the health centre will attend the centre for medication for the common diseases e.g. malaria, diarrhea the more distant locations within Fangak may not attend the centers due to the large distances to be traversed for what is observed a common illness.
22
Additionally, as a result of the establishment of the kalazar and TB clinic, many cases are referred for treatment in Old Fangak from nearby payams, Ayod and Malakal. This may indeed mask the actual attendance rate of Fangak residents with perhaps more of the patients in the clinic being from the nearby villages town and other payams. Growing areas of concern lie in the current staff level and the increasing challenges in meeting the needs of the patients. Complaints of long waiting periods are common with many patients having to spend the whole day at the clinic to before being served. This could act as a deterrent for some potential patients who may only feel compelled to seek treatment at the advanced stages of their ailments.
• Poor water and sanitation
Water and sanitation remains as a primary area of concern for Old Fangak. Open ground defecation remains the standard practice in the whole community. The establishment of the kalazar and TB clinic and the related increase in the local population size – due to population movements to obtain health care - have negatively impacted the sanitary conditions in the central village of Old Fangak n particular with increased amounts of solid waste and human excreta per square metre of the location. Of great interest however is the increased interest in the ownership of latrines with more individuals advocating strongly for their construction. An increased acceptance and reduced embarrassment was also observed in the focus group discussions and individual interviews held with the caretakers and community leaders. The lack of safe water is also of great importance in Old Fangak payam and more particularly in the Pulpam boma were main source of drinking water are stagnant pools, swamps and seasonal rivers. The poor water situation has had an impact on the hygiene practices on the community as a whole with households more keen to observe basic hygiene practices the closer they were to water sources. Filtering of water with guinea worm filter cloth was also observed as the primary means of “cleaning” the drinking water with 93.9 % of the households mentioned filtering their drinking water as compared to 4.5% who claimed to boil it. As the majority of caretakers interviewed mentioned knowing the benefits of boiling water it was suggested that the caretakers either: a. Did not understand the true benefits of boiling of water over filtering of the water or b. The high workload faced by the caretakers prevented then from putting the message into practice20. Filter clothes when observed were seen to be worn out and community members requested additional supplies from the Carter Center.
• Nutrition and Early Childhood Feeding:
Feeding practices amongst the under five was observed to be poor. It was noted in the interviews and discussions that the majority of the mothers introduced solid food to the children a year after birth with the majority basing the weaning foods solely on milk and sorghum thus failing to attain “quality” (balanced) diets for the infants. These results on poor nutrition via food preparation techniques was confirmed in results of the anthropometric findings with the GAM and SAM rates of the 6-29 months and 30-59 months indicating a similar nutritional risk with. Additionally, breastfeeding practices were observed to be far from adequate with no mother practicing exclusive breastfeeding. Water was introduced at the age of approximately 2 weeks with cow’s milk being introduced either immediately or within the first few days of life if the mother felt she did not have enough breast milk. Breastfeeding when practiced was also for short periods of time with children not left to suckle on the breast for long periods primarily as a result of the need to conduct other household duties. 20 It is estimated that caretakers spend approximately 6 hours of their day solely on food preparation with typically long distances to be traversed in search of fuel and water.
23
• Food Security:
Food security situation in Old Fangak has in general become more stable over the past two years due primarily to reduced insecurity in the location resulting in increased cultivation of land and minimized displacement of populations. Despite the general stability however, the high dependence on climatic conditions for the performance of the crops has resulted in undulating crop yield over the “more-stable-security” years. A direct impact of this was observed in the current survey where responses from focus group discussions pointed to the experience of late and erratic rains followed by flooding as the primary cause of the lower than expected crop yields. Crop yields for the current year were also mentioned to have been better than the previous year of 2003. Responses from the focus group discussions and personal observation in some of the homes however, indicated that households in some locations experienced destruction of crops by bird attacks and it is therefore anticipated that some gaps with insufficient food stocks will exist for some specific areas of Old Fangak. This finding on a general increased production of food is in contrast to most other parts of Sudan were reduced yields of crops were sustained as reported by the southern Sudan Annual Needs Assessment 2004/200521. The health condition of the livestock was mentioned to be deteriorating as a result of disease and this was being manifest in reduced milk production, loss of weight of the cattle and eventual death. Although there was sufficient pasture for the cattle as a result of the rain in the recent months, at the time of the survey the health condition of the livestock was characterized with diseases.
21 A reduced crop production was generally experienced in southern as a whole with the ANA 2004/5 report pointing to a 28% reduction in national cereal production as compared to 2003 i.e. for 2004/2005 a total of 3.28 million metric tonnes of cereal were produced as compared 6.2 million metric tonnes in 2003/2004.
24
RECOMMENDATIONS Taking into account the results and analyses of the survey ACF-USA recommends the following:
• Increased health services coverage, especially in the newly created boma (Tuok), by COSV and/or another health agency.
• Integration of the treatment of severely malnourished individuals in the existing health facilities, by ACF-USA in collaboration with COSV
• Increased longer-term impact activities in order to improve food security and livelihoods (like improved agriculture, black smith training for production of tools), by ACF-USA and/or another agency
• Monitoring of the food security situation, by ACF-USA and WFP • Distribution of food aid in case of detected food insecurity, by WFP • Increased and coordinated health education activities at the PHCC/Us level and within the
community, by ACF-USA and COSV. • Maintained community based health education and nutrition surveillance in the location, by ACF-
USA • Increased nutritional education to mothers with an emphasis on weaning practices, by ACF-USA • Improved sanitation by increasing the access to latrines, by ACF-USA and/or another agency • Water and sanitation assessment and corresponding intervention in order to increase the access to
safe drinking water in the whole payam, by UN-WES and/or another water and sanitation agency.
APPENDIXES Appendix 1: Nutritional Survey Cluster selection Old Fangak November 2004 Appendix 2: Anthropometric survey questionnaire Appendix 3: Calendar of events in Old Fangak – November 2004 Appendix 4: Mortality survey questionnaire Appendix 5: Map of Old Fangak
26
Appendix 1. Nutritional Survey Cluster Selection Old Fangak November 2004
Name of Surveyor:____________________________________ Name of Female Head of Household (Man Cieng):___________________________________________ Name of Male Head of Household (Guan Cieng):_____________________________________________ 7 8 9 10 11 12 13 14 15 16 Ht Weight O Female Male Muac age
Muac age
Muac age
Muac age
Muac age
Muac age
Muac age
Appendix 3. Calendar of events in Old Fangak MONTH Seasons 1999 2000 2001 2002 2003 2004
58 46 34 22 10
JANUARY Beginning of 'Mai' Attack and burning of villages by GOS in Old Fangak
ACF exhaustive survey. Kalazar outbreak
57 45 33 21 9FEBRUARY
Movement to cattle camp water point or
fishing camp Tanginya kidnaps UN plane and leaves for old fangak
Meningitis outbreak in Zeraf. SCF teacher training
Distribution of NFI kits by ACF. Polio campaign Kalazar outbreak
continues
56 44 32 20 8MARCH End of 'Mai' and
threshing of sorghum Fighting btw Tanginya and
SPDF. WFP food drop Meningitis outbreak in Zeraf continues
Opening of TFC ACF survey. WFP food drop.
Nuer conference in Old Fangak
55 43 31 19 7
APRIL Beginning of 'ruel',
returning home clearing of land
Fighting btw Tanginya and SPDF. WFP food drop
Seed/tool distribution by ACF in Old Fangak, Nyadin, Toch
ACF distribution of buckets
Fighting between SPLA forces
54 42 30 18 6MAY
Start of rain season planting sorghum and
maize Reath-beginning of
drought. Fighting continues
SPDF joins SPLA. Reath (drought) SCF teacher
training ends
ACF distribution of seeds
Barge distribution of food in Zeraf.WFP food drop
53 41 29 17 5JUNE End of 'Ruel' and
cultivation of land Dry spell in Zeraf. Attack by GOS in Old Fangak Opening of SFP by ACF Food distribution by the
barge
52 40 28 16 4JULY
Tot' weeding activities, some maize harvested.
'Dar' short term sorghum Kuoni destruction of
crops by floods WFP food drop
51 39 27 15 3AUGUST
Dar' harvest continues - short term sorghum.'Tot'
weeding activities.
50 38 26 14 2
SEPTEMBER End of 'tot' beginning of harvest, short term
harvest
Bird attacks crops. Flooding of the Nile
SPLA fighting with Barge. Antanov bombing in the Zeraf
ACF-USA survey WFP food drop. Plane crush in Old Fangak. Officer went to Rumbek
49 37 25 13 1OCTOBER
Jom' rainy season. Berawic long-term
harvest. Antanov bombing
continues End of TFC Fighting between Ching bichok and Chinglongai
48 36 24 12 NOVEMBER Cattle move out of luak,
to camp closer home. Polio campaign Senior officer came back from Rumbek
59 47 35 23 11
DECEMBER Jom' ends. Christmas time Construction of
houses
Looting of ACF base by Albino. Took radio and boat
ACF exhaustive survey
Appendix 4. Mortality survey questionnaire
RETROSPECTIVE MORTALITY INFORMATION OF THE HOUSEHOLD Members of the household below five years
1. What tribe does the family belong to? Tribe: Nuer=1 Dinka =2 Shilluk.=3 Murle=4
2. How many children under 5 years are alive in your home today?
3. How many children under five years are dead in the last 3 months?
4. What was the cause of the death? Members of the household above five years
1. How many people above five years are alive in your home today? 2. How many people above five years have died in the last 3 months?
3. What was the cause of their death?
4. What is the total number of people alive in the last three months?
Cause of death: 1=Diarrhoea (watery diarrhoea), 2=Bloody diarrhoea (Dysentery), 3=Measles, 4=Malaria, 5= TB, 6=Pneumonia, 7=Malnutrition, 8= Kala-Azar, 9=Accident (gunshot, snakebite…), 10=Other (write presumed cause of death)