32
DISCLOSURE REPORT DECEMBER 2020 OLD MUTUAL WITH-PROFIT ANNUITIES CORPORATE DO GREAT THINGS EVERY DAY
DISCLOSURE REPORT DECEMBER 2020
OLD MUTUAL WITH-PROFIT ANNUITIES
CORPORATEDO GREAT THINGS EVERY DAY

2
1. Introduction 32. Underlying Investment Portfolios 52.1 With-Profit Annuity Portfolios 52.2 Local Equity Portfolio 72.3 Local Unmatched Interest-bearing Portfolio 102.4 Local Matched Interest-bearing Portfolio 122.5 Direct Property Portfolio 132.6 Local Alternative Assets Portfolio 152.7 Global Equity Portfolio 162.8 Global Interest-bearing Portfolio 192.9 Global Alternative Assets Portfolio 202.10 African Equity Portfolio 212.11 Other Asset Strategies 222.12 Responsible Investment 223. Increases 254. Fee Structure 275. Bonus Smoothing Reserve Levels 286. Product Portfolio Size 297. Ringfencing 308. Company Solvency 31
How to Contact Us 32
CONTENTS

3
1. INTRODUCTIONThis Disclosure Report contains details of the structure of the portfolio of assets underlying the Old Mutual Life Assurance Company (South Africa) Limited’s (OMLACSA’s) with-profit annuity products as at 31 December 2020, as well as the returns generated by the underlying assets until this date.
This report also includes information on the Bonus Smoothing Reserve (BSR) levels, the internal processes and philosophies of the with-profit annuity products pertaining to annuity increase declarations, as well as the level of capital OMLACSA holds to back portfolios with guaranteed benefits. Finally, notes on the fees and cost structures are provided.
An overview of aspects and practices relating to the management of our with-profit annuity products is also provided. The nature, frequency, timing and format of disclosure may be reviewed in the future. This report is not intended to provide a comprehensive explanation of contractual terms and conditions. Contractual policy conditions will always prevail.

4
In support of improved disclosure on the management of our with-profit annuity products, the Disclosure Report is available on Old Mutual’s website.
Also available on our website are details of the principles and practices of financial management (PPFM) that are applied in the management of its discretionary participation business.
The Disclosure Report and PPFM document are available at https://www.oldmutual.co.za/corporate/retirement-investments/annuity-portfolios or they can be obtained in hard copy on request, using the contact details at the end of this report.

5
2. UNDERLYING INVESTMENT PORTFOLIOSThis section of the Disclosure Report provides information about the structure and performance of the investment portfolios underlying our with-profit annuity products.
The underlying investment portfolios are managed predominantly by various investment boutiques within the Old Mutual Investment Group (OMIG).
All investment returns shown in this section are annualised, time-weighted rates of return and stated gross of underlying asset management fees, except for the local alternative assets portfolio where investment returns are stated net of asset management fees. The information provided in this section is in respect of funds for untaxed investors, such as retirement funds.
2.1 WITH-PROFIT ANNUITY PORTFOLIOSThe assets underlying OMLACSA’s with-profit annuity products include:• a portion allocated to matched assets, which are intended to provide cash flows expected to match a proportion
of future annuity payments; and• a separate portion allocated to unmatched assets, which are focused on delivering growth to enhance future
increases.
The asset allocation of each product varies as a result of differences in investment guarantees and demographic profiles.
ASSET ALLOCATIONS PER PRODUCTThe assets underlying the with-profit annuity products are managed in designated annuity portfolios. The with-profit annuity product portfolios are further split into separate asset pools, each with its own asset mix. The asset pools each accommodate product and Post-Retirement Interest rate (PRI) categories. The significance of this unique investment strategy is that it recognises the different levels of investment guarantees inherent in the various products and categories.
The matched assets (percentage allocation to matching assets) differ between the asset pools. Each portfolio’s matched asset holding is set equal to the matched liability. In other words, the holdings are set as a percentage of the future expected cash flows (including future increases) to annuitants in that product and PRI category, which in turn is dependent on market yields, the Locked-In Yield (LIY) and other elements in the valuation basis, e.g. mortality.
The remaining (unmatched) assets are invested in a portfolio primarily composed of a suitable combination of growth assets. The PRI categories of all of the products share the same unmatched asset strategy. Table 1 below shows the actual asset allocations of the with-profit annuity products as at 31 December 2020.
TABLE 1
Asset Class Pensions OptiPlus Platinum Pension Platinum Pension 2003
PRI Category All 3.5% & 4% 4.5% & 5% 5.5% & 6% 3.25% & Less 3.5% & 4% 4.5% & 5%
Local Matched Bonds 49% 55% 50% 45% 30% 45% 48%
LOCAL
Equity 17% 15% 17% 19% 23% 19% 17%
Bonds, Money Market & Cash 0% 0% 0% 0% 1% 0% 0%
Property 7% 6% 6% 7% 9% 7% 7%
Alternative Assets 6% 6% 6% 7% 9% 7% 6%
GLOBAL
Equity 17% 15% 16% 18% 23% 18% 17%
Bonds, Money Market & Cash 0% 0% 0% 0% 0% 0% 0%
Alternative Assets 3% 3% 3% 3% 4% 3% 3%
Africa 1% 1% 1% 1% 1% 1% 1%

6
UNMATCHED ASSETS: STRATEGIC ASSET ALLOCATIONSThe unmatched assets are managed in a single strategy that is accessed by all with-profit annuity products. Within the unmatched assets, Old Mutual Investment Group’s (OMIG) MacroSolutions investment boutique manages the tactical asset allocation of the underlying portfolios in accordance with the strategic (long-term) asset allocations described below. MacroSolutions also applies tactical asset allocation tilts around these strategic allocations based on its views of the prospects for the asset classes in which the portfolios invest.
Table 2 below shows the strategic asset allocations of the unmatched portfolios for the with-profit annuity products as at 31 December 2020. Although the strategic asset allocations are not expected to change frequently, OMLACSA may make adjustments if deemed necessary – for instance, when changes occur in the economic and investment environment or if there is a change in the assessed risks in the portfolio.
TABLE 2
Asset ClassStrategic Allocations
With-Profit Annuity Portfolios
Growth asset exposure in the long term 95% +
LOCAL
Equity 31%
Bonds & Money Market & Cash 1%
Property 13%
Alternative Assets 14%
GLOBAL
Equity 32%
Bonds & Money Market & Cash 0%
Alternative Assets 7%
Africa 2%
RISK MANAGEMENTThe investment mandates given to portfolio managers include specific restrictions and limitations designed to manage risk.
The most important of these risk management measures are as follows:
• The overweight or underweight positions (tilts) that can be taken towards, or away from, an asset class’s strategic weight are restricted within specified ranges. These ranges are consistent across all the with-profit annuity products. In general, the maximum tilts are less than 10% for larger asset classes (those with a strategic allocation above 10%) and less than 5% for smaller asset classes (those with a strategic allocation below 10%).
• The portfolio cannot include more than 30% offshore assets and 10% African (non-South African) assets, in line with South African Reserve Bank (SARB) requirements.
• Within the matched portfolios, asset types are limited to interest-bearing instruments. Interest rate risk control mechanisms are set for the portfolio as a whole.
• A significant portion of the listed equity portfolio is allocated to portfolio managers that are bound by tracking error limits relative to their benchmarks.
• The local equity portfolio cannot invest more than 10% of its assets in shares with a market capitalisation of R2 billion or less. For larger market capitalisation shares, the local equity portfolio cannot invest more than 15% of its assets in any one share. Investment in any single company may not exceed 20% of that company’s issued share capital or voting shares without prior approval from OMLACSA.
• Derivative instruments can only be used for the purposes of investment risk reduction, efficient portfolio allocation and yield enhancement. Derivatives may not be used to speculate. Asset class exposure is shown after taking derivatives into account, i.e. effective exposure is shown.

7
• Bond and money market assets are assigned an internal credit rating by the portfolio manager. There are exposure limits per counterparty and rating category, and minimum credit ratings at a portfolio level.
• The alternative assets portfolio has diversified exposure to various alternative investments – for example different types of infrastructure, such as renewable energy and toll roads. This allows for increased diversification across geographies, industries, markets and other risk factors.
• From time to time, Old Mutual may invest in newly established portfolios with the intention of including these in the mainstream investment strategy once they have developed a satisfactory track record. The amount that can be invested in these types of portfolios is restricted, both in aggregate and per portfolio.
PERFORMANCEOver the three-year period to the end of December 2020, returns ranged from 8.2% p.a. for the Pensions OptiPlus (5% PRI) to 8.3% p.a. for the Platinum Pension 2003 (3.5% - 4% PRI). Differences in returns between these portfolios are primarily due to the different allocations between matched and unmatched assets within each portfolio.
10%
8%
6%
4%
2%
0%
8.2% 7.7% 8.3%8.3% 8.1% 8.3%
3-YEAR ANNUALISED RETURN
OptiPlus(PRI: 5.0%)
Platinum (PRI: 4.5%-5.0%)
Platinum 2003 (PRI: 3.5%-4.0%)
Portfolio Benchmark
Over the three-year period to 31 December 2020, MacroSolutions’ tactical asset allocation calls resulted in a negative alpha of 0.8% p.a. The largest single detraction resulted from the short derivatives positions in global equity, which had a negative impact as global equity markets continued to rise in Q4. In addition, the physical global equity exposure also dragged the performance due to a strong rand offsetting rising US dollar prices. The biggest positive contribution was from currency derivative activity, as we bought into rand weakness. Lastly, being overweight in global cash added value.
The benchmarks for the with-profit annuity portfolios are composites of the underlying asset class benchmarks. Each of the with-profit annuity portfolios performed broadly in line with their respective benchmarks, with the exception of Platinum 2003, which underperformed by 0.4% p.a. Further details about the performance of all the asset classes (including the matched bond portfolio) against their respective benchmarks are provided in the relevant sections of this report.
2.2 LOCAL EQUITY PORTFOLIOPORTFOLIO MANAGEMENTThe local equity portfolio is designed to deliver long-term inflation-beating returns relative to the benchmark over time, by utilising the skills of specialist boutique equity portfolio managers within OMIG. The portfolio also invests in external managers via the Old Mutual Multi-Managers capability where appropriate.
The local equity portfolio is a multi-strategy portfolio that combines a passive (index tracking) portfolio with active management. The active part of the portfolio is further split between different investment styles in order to provide a smoother return profile, making the portfolio less dependent on specific market cycles for performance.

8
Table 3 below provides the portfolio line-up, including the strategic weights in each of the portfolios as at 31 December 2020:
TABLE 3
Strategy Portfolio Allocation %
PASSIVEIndex Tracking 32.5%
Double Alpha 2.5%
ACTIVE
Old Mutual Equities 32%
Managed Alpha 14%
Premium Equity 9%
Old Mutual Multi-Managers 10%
TOTAL 100%
The Old Mutual Equities (OME) team runs an actively managed portfolio that invests in undervalued shares, based on fundamentals that are expected to outperform the market over the medium to long term. The portfolio aims to achieve its performance objectives primarily through stock selection, combining this with a strong emphasis on ensuring that its portfolios are well diversified by employing a rigorous portfolio construction process.
OMIG’s Customised Solutions boutique manages the Index Tracking, Double Alpha, Managed Alpha and Premium Equity portfolios.
The Index Tracking portfolio is an important component of the overall solution, and provides stability during times when active managers underperform the benchmark.
The Double Alpha portfolio utilises derivatives to track an underlying index. The use of derivatives creates opportunities for the manager to deliver benchmark-beating returns.
The Managed Alpha portfolio is a quantitatively driven investment strategy that evaluates the relative attractiveness of shares through the systematic analysis of fundamentals, risk, economic and market data. The portfolio is designed to adapt to different market conditions by investing in themes that are currently driving the market. Managed Alpha aims to provide additional diversification relative to other more traditional, fundamentally based active strategies.
The Premium Equity portfolio employs a unique risk-controlled equity strategy that exploits opportunities within the equity derivative market. This strategy has successfully outperformed its benchmark and provided uncorrelated returns over the nearly eight years since it was included in the local equity portfolio.
Old Mutual Multi-Managers (OMMM) manages a portfolio of external managers for the local equity portfolio. This strategy provides further diversification within the portfolio by investing with a range of investment managers that are not part of the Old Mutual Group, with a specified allocation to black managers.
BENCHMARKThe performance benchmark for the local equity portfolio is the Capped SWIX Total Return Index.
9
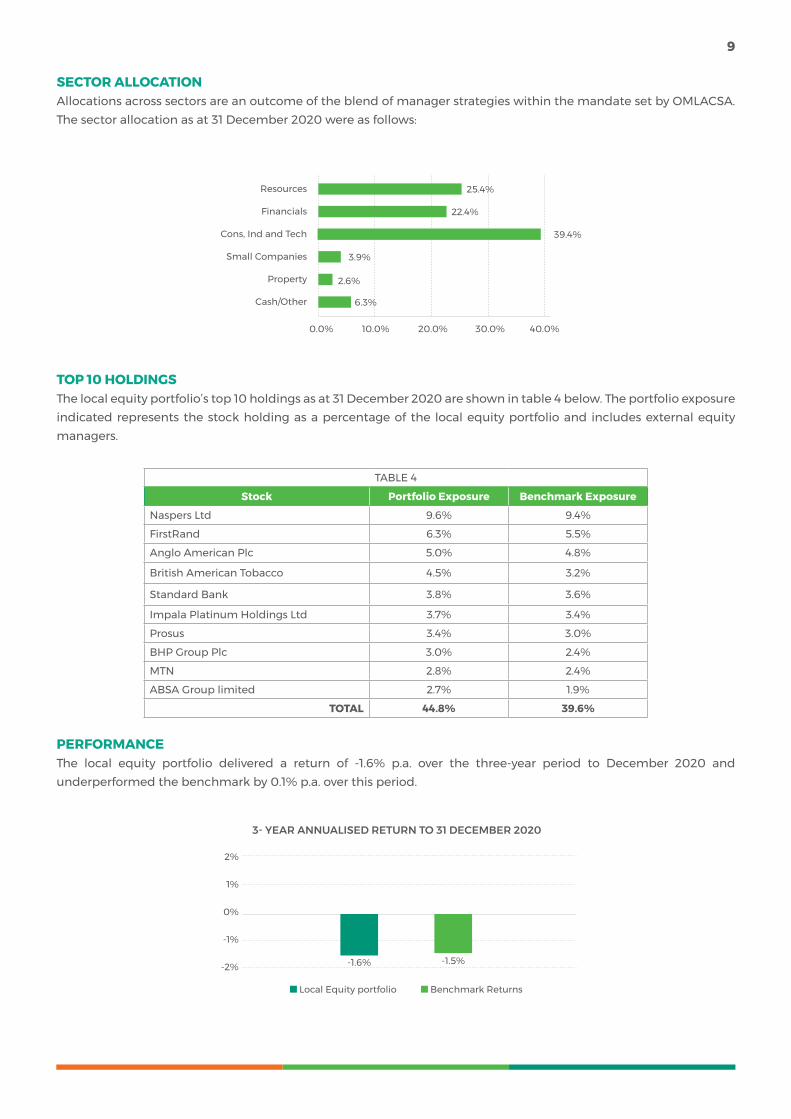
SECTOR ALLOCATIONAllocations across sectors are an outcome of the blend of manager strategies within the mandate set by OMLACSA. The sector allocation as at 31 December 2020 were as follows:
Resources
Financials
Cons, Ind and Tech
Small Companies
Property
Cash/Other
0.0% 10.0% 20.0% 30.0% 40.0%
25.4%
22.4%
39.4%
2.6%
3.9%
6.3%
TOP 10 HOLDINGSThe local equity portfolio’s top 10 holdings as at 31 December 2020 are shown in table 4 below. The portfolio exposure indicated represents the stock holding as a percentage of the local equity portfolio and includes external equity managers.
TABLE 4
Stock Portfolio Exposure Benchmark Exposure
Naspers Ltd 9.6% 9.4%
FirstRand 6.3% 5.5%
Anglo American Plc 5.0% 4.8%
British American Tobacco 4.5% 3.2%
Standard Bank 3.8% 3.6%
Impala Platinum Holdings Ltd 3.7% 3.4%
Prosus 3.4% 3.0%
BHP Group Plc 3.0% 2.4%
MTN 2.8% 2.4%
ABSA Group limited 2.7% 1.9%
TOTAL 44.8% 39.6%
PERFORMANCEThe local equity portfolio delivered a return of -1.6% p.a. over the three-year period to December 2020 and underperformed the benchmark by 0.1% p.a. over this period.
2%
1%
0%
-1%
-2% -1.6% -1.5%
3- YEAR ANNUALISED RETURN TO 31 DECEMBER 2020
Local Equity portfolio Benchmark Returns

10
The resources sector was the best performing local sector over the three-year period with a return of 26.9% p.a. relative to the financial and industrial sectors, which delivered -16.0% p.a. and -8.4% p.a. respectively over the same period.
The Old Mutual Equities portfolio underperformed its benchmark over the past three years by 1.7% p.a. This was derived from the portfolio overweight position to Nedbank (NED) and the underweight to Sibanye (SSW) and Anglo American (AGL). The portfolio’s overweight position to British American Tobacco (BTI), AngloGold Ashanti (ANG) and Transactional Capital (TCP) contributed positively to the portfolio’s performance.
The Managed Alpha portfolio outperformed the benchmark by 0.26% p.a. The major contributors were positive returns that were witnessed across most industries. It is noteworthy that the performance of the gold subsector stands out.
The Premium Equity portfolio delivered 1.3% p.a. over the three-year period, outperforming the benchmark by 2.8% p.a. Over this period, the local derivatives market offered up several diverse trading opportunities at attractive prices. Furthermore, the investment process, which entails putting together the underlying equity portfolio, remained the same which resulted in a diversified equity portfolio that added value to performance.
The Old Mutual Multi-Managers (OMMM) external manager portfolio has outperformed the benchmark by 1.1% p.a. over the last three years. The outperformance can largely be attributed to the performance of Prudential and Coronation, who both delivered outperformance. This offset the underperformance of Mazi, Sentio and Visio in the period before they were replaced with Ninety One.
The Capped SWIX Tracking portfolio delivered in line with its objective of tracking the Capped SWIX Index, and remains within 0.1% of its benchmark over all periods.
2.3 LOCAL UNMATCHED INTEREST-BEARING PORTFOLIOPORTFOLIO MANAGEMENTThe local interest-bearing portfolio consists of bond and money market assets. The bulk of the assets are managed by OMIG’s Futuregrowth boutique.
The money market portfolio aims to generate returns through the active management of short- to medium-term interest-bearing instruments.
The bond strategy comprises a combination of a core bond and a yield-enhanced bond portfolio. The core bond portfolio aims to generate returns primarily through the management of interest rate risk. In addition to asset allocation and active interest rate management, the yield-enhanced portfolio aims to generate additional returns through investing in other listed and unlisted credit instruments.
BENCHMARKThe performance benchmarks for the bond and money market portfolios are the All Bond Index (ALBI) and STeFI Composite Index respectively. The bond portfolio is at all times limited to an average modified duration within one year of the average modified duration of the benchmark.

11
PERFORMANCEPerformance across the interest-bearing portfolio has been strong with outperformance against the benchmark over three years.
15%
10%
5%
0%
7.5%
9.0%
4.8%
8.9%
3- YEAR ANNUALISED RETURN TO 31 DECEMBER 2020
Local money market (STeFI) Local bond (ALBI)
Local Interest-Bearing Assets Benchmark
The overall bond portfolio outperformed the ALBI benchmark by 0.1% p.a. over three years. The main drivers for outperformance included:• The credit spread accrual of 183 basis points; and• The use of derivatives – primarily futures have added value.
The money market portfolio outperformed the STeFI benchmark by 2.7% p.a. over three years. Much of the outperformance can be attributed to good duration management as well as the higher spread accruals earned on the funds’ longer-dated floating rate credit assets. In addition, the funds also benefited from the higher yield pickup on the Step Rate Note Securities.
LOCAL BOND PORTFOLIO EXPOSURE BY DURATIONAs at 31 December 2020, the bond portfolio had an overweight modified duration position relative to the ALBI. The bond portfolio was overweight in short- to medium-term bonds (1-7 years) and longer-dated bonds (7-12 years and 12+ years). The following graph shows the maturity profile of the local bond portfolio compared to the benchmark.
60%
40%
20%
0%
-20%
49.4%
30.6%
10.9%7.8%1.3% 3.2%6.4%
-9.9%
-0.9%1.3%
MATURITY PROFILE
3-7 years1-3 years0-1 year 7-12 years 12+ years
Local Interest-Bearing Assets Benchmark

12
LOCAL BOND PORTFOLIO CREDIT STRUCTUREThe bond portfolio largely consists of securities with credit ratings of AAA or higher, with a small portion in unlisted credit in order to increase the overall credit yield of the portfolio. The following graph shows the credit profile of the local bond portfolio and its benchmark as at 31 December 2020.
Local Interest-Bearing Portfolio Benchmark
100%
80%
60%
40%
20%
0%
CREDIT PROFILE
9.5%1.3%
AA
0.9% 0.0%
A-
10.8%4.7%
Unrated
72.9%
93.5%
AAA
0.0%
AA+
4.0% 1.5%0.5%
AA-
0.4% 0.0%
A+
2.4 LOCAL MATCHED INTEREST-BEARING PORTFOLIOPORTFOLIO MANAGEMENTOMIGS’s Liability Driven Investments (LDI) boutique manages the local matched interest-bearing asset portfolio.
BENCHMARKSThe investment objective for the portfolio is to match a fixed proportion of the guaranteed annuity and future increases. The asset manager also aims to earn additional yield spread above the South African government bond yield curve, subject to staying within defined risk control limits (such as interest rate risk and credit risk).
MATCHING STRATEGYThe fixed-interest assets backing with-profit annuities are invested to match the pattern of expected annuity payments. The assumed future increases are based on yields secured at the time of matching. The matching assets provide an overall rate of return per annum known as the Locked-In Yield (LIY). This provides valuable stability to the with-profit annuity portfolios. Interest rate volatility (and the resultant fluctuations in capital values) is thus largely controlled.
The asset manager is required to ensure that the value of the assets moves as closely as possible in line with movements in the value of the liabilities. The benchmark performance is the value of the liability, which is affected by factors such as mortality, and thus cannot easily be hedged by the asset manager. We therefore do not compare the performance of this portfolio against the benchmark in this report. The portfolio is rebalanced quarterly.

13
Table 5 below shows the exposure by asset duration of the with-profit annuity products as at 31 December 2020.
TABLE 5
Duration
Exposure by asset duration
OptiPlus Platinum Pension Platinum Pension 2003
All PRIs 3.5% & 4.0% PRI
4.5% & 5.0% PRI
5.5% & 6.0% PRI
3% PRI & Less
3.5% & 4.0% PRI
4.5% & 5.0% PRI
0-3 YEARS 27.73% 20.40% 23.65% 22.31% 27.74% 23.46% 21.34%
3-7 YEARS 20.56% 18.39% 19.98% 18.83% 21.42% 18.35% 16.56%
7-12 YEARS 17.26% 14.90% 16.37% 14.08% 19.93% 21.92% 23.50%
12+ YEARS 45.66% 66.41% 53.99% 54.53% 56.32% 56.14% 46.65%
INTERNAL UNIT 6.89% 6.21% 7.07% 7.26% 5.11% 5.82% 7.35%
REPO -17.98% -26.28% -20.84% -17.15% -30.89% -25.65% -15.72%
CASH -0.12% -0.04% -0.22% 0.13% 0.36% -0.03% 0.32%
2.5 DIRECT PROPERTY PORTFOLIOPORTFOLIO MANAGEMENTThe direct property portfolio invests in a diversified range of unlisted properties, with exposure across the retail, office and industrial property sectors. While the majority of the portfolio’s assets are located within South Africa, the portfolio has recently started to diversify its exposure into other countries where suitable opportunities exist. The portfolio is managed by Old Mutual Property Management Services (OMPMS).
BENCHMARKThe performance benchmarks for property investments are:
• Developed properties: SAPOA/IPD1 South African Property Total Return Index. This index is compiled annually and published up to six months in arrears. Actual performance of the portfolio is used to estimate the benchmark portfolio performance until the latest IPD figures are available. Benchmark performance is then updated retrospectively.
• Properties that are under development, and vacant land: South African Consumer Price Inflation (CPI).
EXPOSURE BY TYPE AND REGIONThe direct property portfolio is dominated by large retail shopping centres. Large industrial properties and selected office space also form part of the broader strategy, as well as pockets of land strategically held for development.
As at 31 December 2020, the exposure of the property portfolio to the various property sectors was as follows:
TABLE 6
Country Sector Exposure
South Africa
Retail 69.5%
Industrial 8.2%
Office 3.8%
Land 0.2%
Kenya Retail 0.0%
United Kingdom Office 4.3%
Eastern Europe Office 13.9%
1Investment Property Databank (IPD) is a leading global provider of real estate analysis

14
The largest properties in the portfolio include Gateway Shopping Centre (Durban), Cavendish Square (Cape Town), Bedford (Johannesburg), Riverside Mall (Nelspruit), The Zone (Johannesburg) and the Mutualpark office building (Cape Town).
The table below shows the portfolio exposure by country and province:
TABLE 7
Country Province Exposure
South Africa
KwaZulu-Natal 35.7%
Gauteng 21.5%
Western Cape 15.8%
Mpumalanga 5.3%
Eastern Cape 3.6%
Kenya 0.0%
United Kingdom 4.3%
Eastern Europe 13.9%
The high exposure to KwaZulu-Natal is primarily due to the investment in the Gateway Shopping Centre, which is the largest single property in the portfolio.
PERFORMANCE
3.0%
2.5%
2.0%
1.5%
1.0%
0.5%
0%
0.3%
1.6%
3-YEAR ANNUALISED RETURN TO 31 DECEMBER 2020
Property Portfolio Benchmark
For the year to December 2020, the fund’s net income was 40% below its net income budget. The forced lockdown of retail shopping centres due to the outbreak of COVID-19 has had a significant impact on the fund performance.
Rental concessions and provision for bad debts were the significant contributors to this variance. Further negative impacts on net income has been an increase in vacancies and rental losses from Edcon and Dion Wired who went into business rescue with no rental earned during this period.
Capital returns have been negatively impacted by reduced valuations because of reduced property income, rental reversions, lower rental escalations, high vacancies, unanticipated tenant failures, lower turnover rental income and third party income from parking and marketing.
Certain cost savings were possible during COVID-19 but the benefit of these were set-off due to higher COVID-19 related costs e.g. increased cleaning and security costs to adhere to COVID-19 regulations. Additionally, municipal expenses (rates, electricity, water) continue to increase more than CPI.

15
The fund undertakes an annual benchmarking comparison against listed REIT’s and unlisted funds greater than R10 billion in assets under management. This benchmark only measures property performance, and thus excludes debt, finance costs and non-property related income and expenses. For the year ended December 2020, the fund generated an annual return of 0.3% versus the benchmark of 1.6%. The main reason for the underperformance was due to the capital write down of one of the retail properties and write down of the Wanooka building where a material lease was cancelled (the cancellation fee was included in the income return). The property was re-let at current market rentals which was well below the lease rental. The 2020 benchmark will be published in May 2021.
2.6 LOCAL ALTERNATIVE ASSETS PORTFOLIOPORTFOLIO MANAGEMENTThe local alternative assets portfolio includes:
• Private equity investments (shares in unlisted companies).
• Infrastructure investments in commercially viable development projects, predominantly within South Africa, including renewable energy, toll roads, utilities and prisons.
• Impact funds, which mainly consist of assets that meet the definition of targeted investments in the Financial Sector Charter (FSC). This includes investments in affordable housing and schools, as well as in companies that provide end-user finance to low- to middle-income earners.
• Agricultural investments, which comprise South African agricultural land and associated infrastructure.
The FSC assets were included in our local alternative assets portfolio from June 2014 and performance for FSC is reflected from this date onwards.
The portfolio is managed by the Old Mutual Alternative Investments (OMAI) boutique, with the exception of the agricultural investments, which are managed by OMIG’s Futuregrowth boutique.
BENCHMARKThe overall performance benchmark for the local alternative assets portfolio is a composite which includes an inflation-linked component and is assessed over rolling three-year periods. Asset strategies within this asset class are also managed according to their own individual benchmarks.
Over the short to medium term, performance relative to the inflation-related benchmark may not reflect the skill of the asset manager. Therefore, consideration is given to the market and inflation environment when assessing relative performance over three-year periods. Given the long-term nature of this asset class and its non-investable benchmark, we show returns for periods of three and five years for alternative assets.
PERFORMANCEThe performance shown below for the local alternative assets portfolio is reflected net of investment management fees.
15%
10%
5%
0%
2.9% 3.7%
10.8%11.6%
3 Years 5 Years
Local Alternatives Portfolio Composite Benchmark
ANNUALISED RETURN TO 31 DECEMBER 2020

16
The local alternative assets portfolio has underperformed its benchmark over both three and five years. This is a result of the private equity and impact funds’ subclasses having underperformed their targets. Infrastructure is the only sub-class that either matched or exceeded its target for the above periods.
As a consequence of the COVID-19 crisis and the impact which the crisis has had on the real economy, the private equity sub-class returns have been adversely impacted. From a valuation perspective, the private equity asset class is more adversely impacted (relative to the listed universe) during a crisis, however outperforms in a recovery given the geared nature of the assets held.
The outperformance of the Infrastructure sub-class was driven by the strong operating performance of the underlying assets. Toll roads were the only underlying asset category that was a drag on performance, given the reduced traffic volumes during 2020 and the resultant reduction in long-term forecast revenue. The renewable energy asset category was the key contributor to the portfolio return with a sector performance of approximately 18%.
The underperformance of the local alternative assets was also largely driven by the impact fund sub-class. For the schools portfolio, the impact of COVID-19 had proven to be less severe than originally anticipated in the June 2020 valuations. From a valuation perspective, occupancy and collections are important factors and these have improved relative to June 2020. Housing assets still are the main contributor to underperformance due to regulatory delays in approvals and continued difficult trading conditions due to COVID-19. That said, sales within the Greenfields portfolio have been buoyed by the reduction in home loan rates over the second half of 2020. The Retirement Accommodation portfolio has also struggled with performance given the difficult trading conditions and impact of COVID-19, which resulted in slower sales rates and extended construction periods.
With regard to COVID-19, on the whole, the local alternative assets portfolio has “weathered the storm” better than expected at the outset of the crisis and during the height of the legislated lockdown.
2.7 GLOBAL EQUITY PORTFOLIOPORTFOLIO MANAGEMENTThe bulk of the global equity portfolio is invested in MacroSolutions’ Multi-Style Global Equity portfolio, which aims to generate returns above the benchmark by allocating funds to underlying offshore asset managers. This is an actively managed strategy that blends different managers and investment styles in order to target a relatively stable performance outcome. The majority of the underlying portfolios allow managers to invest in both developed and emerging markets.
Table 8 provides the latest Multi-Style portfolio line-up, including the strategic weights in each of the portfolios as at 31 December 2020.
TABLE 8
Manager Strategy Strategic Allocation
OMIG Customised Solutions MSCI World ESG Tracker 27%
OMIG GEM boutique Global Emerging Markets 3%
OMIG MacroSolutions Global Macro 10%
Acadian Global Quant
60%Barrow Hanley Global Value
Fiera CapitalGlobal Growth
Baillie Gifford

17
UNDERLYING PORTFOLIOSAcadian: Acadian Asset Management LLC specialises in global quantitative equity strategies. Acadian seeks to capture the fundamental drivers of stock return, exploiting market inefficiencies through a quantitative investment process.
Barrow, Hanley, Mewhinney & Strauss: The manager provides value-oriented investment strategies across various international markets. Their equity portfolios are designed from the bottom up with a strong value underpin, and tend to exhibit below-market price-to-earnings ratios, below-market price-to-book ratios, and above-market dividend yields, regardless of market conditions.
Baillie Gifford: The manager uses fundamental analysis and proprietary research in order to identify companies that it believes will deliver above-average profit growth over the long term. The manager constructs portfolios on a bottom-up basis with the objective of outperforming its benchmark over the long term.
Fiera Capital: This is a growth-oriented manager that seeks to exploit opportunities in long-term quality growth companies with high returns and supportive intrinsic valuations. Investments are made with a long-term horizon, which leads to low portfolio turnover.
MSCI World ESG Tracker: This portfolio tracks the performance of the MSCI World ESG Index. The index is designed to give effect to responsible investing by investing more heavily in companies that meet specific Economic, Social and Governance (ESG) criteria. The ESG Index targets the same sector and regional weights as the MSCI World Index in order to target performance that is similar to that of the MSCI World Index, whilst still achieving the broader objective of investing in companies with strong ESG ratings.
MSCI Global Emerging Market (GEM) ESG Tracker: This portfolio tracks the performance of the MSCI GEM ESG Index. The index is designed to give effect to responsible investing by investing more heavily in companies that meet specific Economic, Social and Governance (ESG) criteria. The ESG Index targets the same sector and regional weights as the MSCI Emerging Markets Index in order to target performance that is similar to that of the MSCI Emerging Markets Index, whilst still achieving the broader objective of investing in companies with strong ESG ratings.
Global Macro Portfolio: The Global Macro Equity portfolio is an active equity portfolio which applies top-down views in order to generate outperformance relative to the global equity benchmark. Active positions are taken predominantly in regions, countries, sectors and currencies. The portfolio is run by OMIG’s MacroSolutions boutique.
BENCHMARKThe performance benchmark for the global equity portfolio is the total return of the MSCI All Country World (net of dividend withholding tax) measured in South African rands.
The underlying portfolios, within the global equity portfolio, have the following benchmarks:
• Acadian – Morgan Stanley Composite Index (MSCI) All Country World
• Barrow Hanley Mewhinney & Strauss – MSCI All Country World Value
• Ballie Gifford & Fiera Capital – MSCI All Country World Growth
• MSCI ESG World Tracker – MSCI ESG World
• MSCI ESG GEM Tracker – MSCI GEM

18
STYLE ALLOCATION
Global Growth20%
MSCI Emerging Market ESG Tracker3%
Global Macro10%
Global Quant20%
Global Value20%
MSCI World ESG Tracker27%
REGIONAL ALLOCATION TILTS
-10% -5% 0% 5% 10%
EMEA = Europe, Middle East, Africa
4.7%
-7.7%
3.0%
Americas
EMEA
Asia Pacific
PERFORMANCE
20%
15%
10%
5%
0%
17.1% 16.5%
3-YEAR ANNUALISED RETURN TO 31 DECEMBER 2020
Global Equity Portfolio Benchmark

19
The global equity portfolio outperformed the benchmark by 0.6% p.a. over the three-year period. This was primarily a result of strong investment performance from Barrow Hanley (Global Value), Baillie Gifford and Fiera Capital (Global Growth), all of whom materially outperformed their respective benchmarks. Both growth and value benchmarks have outperformed the MSCI All Country World Index. In addition, with 2020 being a year of astonishing events, the final quarter of 2020 did not disappoint. Buoyed by news of vaccine development success and roll-out, global equity was up 14.7% in USD terms for the fourth quarter. This brought the total return for 2020 for the MSCI All Country World Index to 16.3% in USD terms.
2.8 GLOBAL INTEREST-BEARING PORTFOLIOPORTFOLIO MANAGEMENTThe global interest-bearing portfolio consists of global bond and global cash assets. The global bond and global cash assets are managed by Russel Investments.
BENCHMARKThe performance benchmark for the global bond fund is the Bloomberg Barclays Global Aggregate Index.
The performance benchmark for the global cash portfolio is comprised of the following:
• 40% G0B1 – Bloomberg Barclays US Treasury Bills 1-3 months
• 35% LEB2TREU – Bloomberg Barclays Euro Treasury Bills 0-3 months
• 15% G0YA – ICE Bank of America Japan 0-1 year Government
• 10% G3BB – ICE Bank of America Sterling 3-month Government Bill
REGIONAL ALLOCATIONDuring 2020, the portfolio remained overweight to American bonds while remaining underweight to Asian bonds. The full regional allocation is shown below.
-15% -10% -5% 0% 5% 10% -15%
EMEA = Europe, Middle East, Africa
15.0%
-7.9%
1.2%
Americas
EMEA
Asia Pacific
PERFORMANCEThe global interest-bearing portfolio underperformed the benchmark over three years.

20
12%
10%
8%
6%
4%
2%
0%
Global Bonds (Barclays Aggregate) Global Cash Benchmark
3- YEAR ANNUALISED RETURN TO 31 DECEMBER 2020
11.7%11.0%
7.8% 7.2%
The global bond portfolio marginally outperformed its benchmark by 0.7% p.a. over three years. The main drivers for returns alluded from overweights to corporate high yield and investment grade financials.
The global cash portfolio outperformed its benchmark by 0.6% p.a. over three years.
2.9 GLOBAL ALTERNATIVE ASSETS PORTFOLIOPORTFOLIO MANAGEMENTThe global alternative assets portfolio is managed by the Old Mutual Alternative Investments (OMAI) boutique and OMIG’s Customised Solutions boutique. A portion is also invested in direct property, which is co-managed by Old Mutual Property Management Services.
The portfolio primarily consists of:
• Private equity investments, held via a Fund of Funds (FoF) structure managed by OMAI.
• Infrastructure investments, which are also managed by OMAI.
• Direct property investments in India, which are co-managed by Old Mutual Property Management Services.
• African (non-South African) private equity and infrastructure investments. These investments were transferred to the global alternative assets portfolio during 2016.
BENCHMARKThe performance benchmark for the global alternative assets portfolio is US CPI + 5% p.a. in US dollars (before charges and tax), assessed over rolling five-year periods. Asset strategies within this portfolio are managed according to their own individual benchmarks.
Over the short to medium term, performance relative to the inflation-related benchmark may not accurately reflect the skill of the asset manager, and therefore the market and inflation environment should also be considered when assessing relative performance over these periods.
PERFORMANCEThe chart below reflects the performance of the underlying investments over 3 and 5 years.

21
20%
15%
10%
5%
0%Annualised 3-year Return Annualised 5-year Return
Global Alternative Assets Benchmark
ANNUALISED RETURN TO 31 DECEMBER 2020
6.9%4.0%
15.1%
5.6%
The global alternative assets portfolio has underperformed its benchmark over three and five years. This was primarily as a result of the negative performance generated by The Triangle India Property fund managed by Old Mutual Properties, and (albeit positive) returns generated by the international infrastructure sub-class, which underperformed its benchmark over these periods.
Renewable energy assets in the international infrastructure sub-class have seen strong operational performance, whereas toll road assets have negatively impacted performance due to reduced traffic volumes, with revised GDP assumptions impacting future traffic volumes and revenue. The international infrastructure sub-class also has a fund in deployment phase (AIIF3), and this would also be a lag on performance as the fund moves through its J-curve.
Overall, the global private equity sub-class outperformed its benchmark except the African (non-South African) FoFs portfolio within the global private equity FoFs sub-class. In addition, over a five-year period, the rand strengthened against the US dollar and this would have a negative impact on ZAR performance, which is reflected above. Conversely, over a three-year period, the rand depreciated and this had a positive impact on ZAR performance for the International Alternative assets portfolio.
2.10 AFRICAN LISTED EQUITY PORTFOLIOPORTFOLIO MANAGEMENTExchange control regulations and Regulation 28 of the Pension Funds Act allow retirement funds to invest up to 10% in African (i.e. non-South African) assets. This is in addition to the allowance for foreign investments of 30%.
The African equity portfolio is currently managed by the Old Mutual Equities (OME) boutique within OMIG. The portfolio is an actively managed fundamental equity portfolio which aims to outperform its benchmark over the long term.
BENCHMARKThe African equity portfolio benchmark is the MSCI Emerging Frontier Markets Africa Index (with a component excluding South Africa).

22
PERFORMANCE
10%
8%
6%
4%
2%
0%
8.0%
4.7%
ANNUALISED 3-YEAR RETURN TO 31 DECEMBER 2020
Fund Return Benchmark Return
The African equity portfolio returned 8.0% p.a. over the three-year period to 31 December 2020. The fund has maintained its positive alpha over three years despite some underperformance in 2020. The performance was very mixed across the markets. The Moroccan food retailer continues to grow with the trend that has resulted in 2.6% returns recorded over a 3-year period. Avoiding Nigerian Breweries has positively contributed 2.3% towards returns. Also, EK Holdings, the Egyptian industrial that is involved with gas, has contributed positively by generating a 1.2% return.
2.11 OTHER ASSET STRATEGIESDERIVATIVE STRATEGIESDerivative instruments are used to enhance the portfolio and not to speculate. Portfolio managers are not allowed to use derivatives to speculate and may not borrow money to fund derivative positions. The investment mandates limit the use of derivatives to:
• enhancing the efficiency of asset allocation, including the equitisation of cash;
• adjusting the duration of interest-bearing portfolios, provided it is within mandated risk limits;
• reducing investment risk via hedging, which provides insurance against specific events or reduces the tracking error; and
• enhancing yield through derivative price anomalies.
2.12 RESPONSIBLE INVESTMENTINTRODUCTIONResponsible Investment (RI) is a key part of Old Mutual’s broader approach to Responsible Business, characterised by five pillars:
1. Responsible to our Customers
2. Responsible Investment
3. Responsible to our Employees
4. Responsible to our Communities
5. Responsible Environmental Management

23
At Old Mutual we believe that RI is essential to our goal of pursuing long-term returns for our customers, while aligning with the broader interests of society. In 2012, Old Mutual became a signatory to the United Nations Principles for Responsible Investment (UNPRI), the overarching global framework on Economic, Social and Governance (ESG) issues in investment and ownership decision-making practices.
Old Mutual’s approach to RI is founded on an understanding of the growing sustainability trend and its potential to impact the competitive landscape across sectors. Old Mutual therefore believes that incorporating ESG factors into its investment process and asset ownership practices is important to assist in delivering in line with our obligations to beneficiaries. We also recognise that doing so will align with the broader objectives of society. This aligns to the ideals of the UNPRI.
The practical endorsement of these beliefs in RI is channelled through three key themes:
1. ESG incorporation into the investment process
2. Active ownership, through proxy voting and company engagement
3. Disclosure of policies and implementation
ACTIVE OWNERSHIPOMIG’s active ownership practices are guided by its proxy voting and active ownership policies, which are available online. Active ownership is also informed by a proprietary governance model that evaluates companies on a range of ESG criteria.
The graph below summarises the proxy voting activity by OMIG, in respect of the local listed equity investments of the portfolios.
Engagement Category
Remuneration policy
ESG integration
Environment (climate change)
Corporate governance
ESG risk management
Board (Succession)
Environment
Social (health & safety)
Board compensation/structure
Board independence
Cybersecurity
Capital structure/share capital
Environment (carbon emissions)
ESG reporting
Human capital development
Remuneration (chair/CEO)
Remuneration (metrics/measurement)
Social
23%
13%
8%
11%7%
5%
5%
5%
3%
3%
3%
2%
2%2%
2%2% 2% 2%

24
OMIG’s policy is to vote on 100% of resolutions. OMIG has adopted a proactive engagement process where, if the decision is to vote against a resolution, the company is contacted to discuss the concerns regarding the resolution. When electing directors, votes are guided by the aim of achieving appropriate composition of boards with respect to experience, balance, independence, diversity etc. When voting on remuneration policies, the aim is to achieve alignment between the company’s business strategy and the long-term interests of shareholders. During 2019, OMIG successfully engaged with companies on a broad range of ESG issues. OMIG further participated in various industry initiatives on key sectoral or thematic matters such as the Mining Charter and Integrated Reporting.
INVESTMENTS IN SUSTAINABILITYOld Mutual has also made significant investments in sustainability, which offer attractive investment returns for customers while achieving desirable outcomes for society and the natural environment. These investments are accessed through the Alternative asset allocations (equity) and through the Interest-bearing asset allocations (debt). Examples of sustainable investments include:
Infrastructure: The local alternative portfolio has exposure to infrastructure investments (including renewable energy projects) of over R5 billion.
Agriculture: Investment in agriculture ensures environmentally sustainable methods of agriculture, and provides education, healthcare and training for staff, while upholding high ethical and business standards. The local alternative assets portfolio currently has over R600 million invested in agriculture in South Africa and on the broader African continent.
Development Finance: The local alternative assets portfolio currently has exposure of over R5 billion to development finance initiatives. These include investments that are aligned with the requirements of the Financial Sector Charter, for example housing and schools, where exposure is gained via the Housing Impact Fund and the Schools Fund.
RI DISCLOSUREAs a signatory to UNPRI, the Old Mutual Group prepares an annual report of its RI activities, the results of which are available on the UNPRI website.
Old Mutual’s RI Policy and other documents listed below are available publicly on Old Mutual’s website by following the RI link at Responsible Investing and browsing the Responsible Investment pages for Old Mutual and OMIG.
Alternatively, click directly on the links below:
· Responsible Investment Policy 1
· OMIG RI Resources 2 – for example the RI Policy, the Proxy Voting Policy and the CRISA Report - Proxy guidelines - Crisa reporting· UNPRI Transparency Report3
· Responsible Investment Policy1 https://protect-za.mimecast.com/s/1qd0C98jmAhkm62g5Coo3aA?domain=eu-assets.contentstack.com https://eu-assets.contentstack.com/v3/assets/bltf97ab615862b2667/bltd203391f0bfd6768/6089dd46f236160d7ef233e6/omigsaresponsibleinvestmentguidelines.pdf· OMIG RI Resources2 – for example the RI Policy, the Proxy Voting Policy and the CRISA Report - Proxy guidelines https://protect-za.mimecast.com/s/lfxaC0gMBosG29mDRCDnHeb?domain=eu-assets.contentstack.com https://eu-assets.contentstack.com/v3/assets/bltf97ab615862b2667/bltd220c8e81cece466/5f2836c0f96bdf34c9845517/Listed_Equity_Stewardship_Guidelines_-_2020.pdf - Crisa reporting https://protect-za.mimecast.com/s/-NzHCg5yPDSAljGxLC2fRwQ?domain=oldmutualinvest.com https://www.oldmutualinvest.com/institutional/responsible-investing · UNPRI Transparency Report3
https://protect-za.mimecast.com/s/zhp5CxGymzI1Jgx42HXCEwp?domain=stpublic.blob.core.windows.net https://stpublic.blob.core.windows.net/pri-ra/2020/Investor/Public-TR/(Merged)_Public_Transparency_Report_Old%20Mutual_2020.pdf

25
3. INCREASES
ANNUITY INCREASE PHILOSOPHYThe surplus attributable to with-profit annuity policies (generally, the net investment return earned on these assets) is credited to a Bonus Smoothing Reserve (BSR), from which annuity increases are declared.
The BSR is the excess of the market value of the assets over the value of the liabilities. It is split into a long-term BSR (LT-BSR) and a short-term BSR (ST-BSR).
The LT-BSR is the difference between the value of the cash flows that are matched, and the market value of said matching assets. This difference is released gradually over the full lifetime of the annuitants.
The ST-BSR is the difference between the value of the remaining liabilities and the market value of the remaining assets. The level of the ST-BSR is significantly impacted by the net investment returns earned on the unmatched portfolio and the LIY referred to earlier. It is the level of this ST-BSR that is the most relevant for determining the increase that can be declared.
These annuity increases usually differ from the actual net (of charges and PRI) investment return earned in a year, so as to reduce the impact of short-term volatility of returns on policyholders. The post-retirement interest rate (PRI) is deducted from the investment return earned in determining the surplus available for annuity increases, as this has already been taken into account in determining the annuity amounts, or the premium for known annuity amounts.
In years when above-average investment returns are earned, the increases tend to be lower than the net investment return earned. And in years when below-average investment returns are earned, the increases tend to exceed the net investment return earned.
A positive BSR balance represents a surplus attributable to with-profit annuity policyholders that has not yet been declared as increases, and that will be used to support subsequent increases. A negative BSR balance means that more has been declared as increases to policyholders than has been earned to that date (as a consequence of the smoothing process). This deficit will be recovered by declaring future annuity increases that are lower than the future net investment returns earned.
The BSR is increased by a surplus in years of favourable experience, and decreased in years of unfavourable experience. The BSR is reduced further by the cost of the declared increases, the charge for investment guarantees (i.e. the capital charge), the cost of the PRI on benefit payments, and investment management charges.
It is important to note that the BSR is used to declare increases for the benefit of with-profit annuity policyholders only, and cannot be accessed by Old Mutual shareholders.
SOURCES OF PROFITAnnuitants participate in the investment and mortality profits/losses generated by the assets underlying the with-profit annuity products, through the increases.
Investment profits are attributed to each PRI category only if the net returns earned on the underlying assets are in excess of the PRI. Mortality profits will arise if annuitants do not live as long as expected. Mortality losses will arise if annuitants live longer than expected. The main source of profits is likely to be investment profits.
Annuity increases, once granted, are guaranteed and can never be removed. The level of future increases is, however, not guaranteed.
26
ANNUITY INCREASE DECLARATION PROCESSAnnuity increases are declared annually in arrears, based on the financial position of each product at its year-end. The increases are declared at the discretion of the Board of OMLACSA and are based on the recommendation by its chief actuary. In assessing the amounts to declare, the Board will look primarily at the size of the relevant BSR. The long-term average level for the ST-BSRs is expected to be in the 0% to 5% range. The level of the ST-BSRs can vary outside this range, depending on market conditions.
In determining a minimum BSR level, the criterion applied is that any negative BSR should be capable of being recouped within, at most, three years. If recoupment is not possible within three years, shareholder funds are used to rectify the situation. In determining the maximum level, consideration is given to the maintenance of equity between different generations of annuitants.
Some of the additional factors considered by the Board when determining the increases to be declared include the following:
• The reasonable expectations of annuity policyholders as to the size of the increase.
• The impact of an extremely negative market environment on increases. In such an environment, increases will be affected by the need to ensure that the BSR does not become too negative, as this would adversely affect subsequent increase declarations.
• OMLACSA’s competitive position against the bonus/increase declarations of with-profit annuity products offered by other providers.
ALLOWANCE FOR MANAGEMENT ACTION IN ADVERSE CIRCUMSTANCESAs previously mentioned, the long-term target level for the BSR is within the range of 0% to 5% of the liabilities. Tolerance for BSR levels outside this range reduces as the absolute levels move further away from it. The tolerance for a particular level of smoothing reserve also depends on the prevailing investment and economic conditions, and the outlook for such conditions.
The focus is particularly on a three-year time horizon, in line with the guidelines of the Actuarial Society of South Africa as described in this section. While OMLACSA has some internal guidelines, there are no absolute levels set at which particular management actions are automatically taken. Such an approach could be imprudent, as it may not consider all the factors involved at the time. However, if the BSR trends away from the long-term average, the extent of management action will become more pronounced, taking due cognisance of the economic and investment environment at all times.
BSR CHARGESThe following costs are deducted from the BSRs:
• INVESTMENT MANAGEMENT CHARGEThe investment management charge is currently approximately 0.75% to 0.85% of assets per annum. In any given year, this percentage can change as the asset allocation varies, and as asset manager performance varies relative to benchmark. Fees can be above this level from time to time, due to short-term tactical allocations away from the benchmark or outperformance by asset managers. Annuity increases are declared net of this charge.
• THE COST OF PROVIDING GUARANTEESOMLACSA guarantees that existing annuities will be paid for the life of each annuitant, and that any increase, once granted, will also be guaranteed for the annuitant’s life. The price that OMLACSA levies for these guarantees is the capital charge.
Capital charges are levied monthly in arrears on the assets of each product’s underlying portfolio. Thus, any increases declared are net of these charges. The current capital charges in respect of the various with-profit annuity products are set out in the document Capital Charges applying to Discretionary Participation Business on Old Mutual’s website. It is also available in hard copy on request.

27
4. FEE STRUCTURE
As at 31 December 2020, the administration fees for new business were as follows:
INITIAL ONCE-OFF ADMINISTRATION FEES• R800 for the first annuitant in the family unit; plus• R400 for each additional annuitant
These initial administration fees are included in the premium and will not be deducted from future pension increases
RENEWAL ADMINISTRATION FEESAs at December 2020, the renewal fee was R95 per annuitant per month, capitalised and included in the premium.
For other charges relating to the management of these products, please refer to the Annuity Increases section of this report.

28
5. BONUS SMOOTHING RESERVE LEVELS
The BSRs for OMLACSA’s with-profit annuities were within the following bands:
TABLE 9
DATEPlatinum Pension Platinum Pension 2003 Pensions OptiPlus
ST-BSR LT-BSR ST-BSR LT-BSR ST-BSR LT-BSR
31 December 2019 0% to 5% 0% to 5% 0% to 5% -10% to -5% 0% to 5% 0% to 5%
31 December 2020 0% to 5% 0% to 5% 0% to 5% -10% to -5% 0% to 5% 0% to 5%
OMLACSA is required to disclose Short-term Bonus Smoothing Reserve (ST-BSR) levels below -7.5% for with-profit annuity products.
As at 31 December 2020, the ST-BSR levels for all the with-profit annuity products issued by OMLACSA were greater than the stated level of -7.5% of the value of the liabilities of that product.

29
6. PRODUCT PORTFOLIO SIZE
As at 31 December 2020, the sizes of the with-profit annuity portfolios were approximately as follows:
TABLE 10
Assets Under Management 31 December 2020
Pensions OptiPlus R13.2 billion
Platinum Pension R10.5 billion
Platinum Pension 2003 R13.2 billion
Please note that these amounts include the BSR values.

30
7. RINGFENCING
OMLACSA’s with-profit annuities are managed in accordance with a specific mandate as described earlier in this document.
The portfolios of underlying assets that support the various with-profit annuity products are all managed separately from each other, as well as from the assets of other products (both policyholder and shareholder portfolios). This separation extends to the individual BSRs that form an integral part of the portfolios of underlying assets that support each product. Although the assets are managed separately, they are not housed in a separate legal entity. They remain the registered property of OMLACSA.
All fees and charges are transferred from these portfolios to shareholder fund portfolios.
Transfers of assets between different portfolios occur in the normal course of events. Such transfers could reflect normal trading between two portfolio managers with different investment mandates and investment views, or the transfer of a pool of assets where Old Mutual permits a client to move an investment from one portfolio to another.
The principle that applies to any such transfer is that any assets accepted into the portfolio must not alter the portfolio in such a way that compliance with the investment mandate is compromised.
The transfer of BSRs between different with-profit annuity product portfolios is not precluded, but will only happen in specific circumstances. For instance, when a mature product portfolio diminishes in size over time, a stage may be reached where the size of such portfolio is less than optimal for the smoothing of returns to be effective. At such a point, the mature portfolio could be combined with a larger portfolio, with a corresponding BSR transfer taking place. The aim is to ensure, as far as possible, that the BSR percentages of both portfolios after such a transfer are similar to what they were before the transfer.

31
8. COMPANY SOLVENCY
The guarantees on benefit payments offered in with-profit annuity products are backed by the capital of OMLACSA. OMLACSA’s past capital levels using the SAM reporting standard are shown in table 11 below.
TABLE 11
December 2019 December 2020
Eligible Own Funds* (R’bn) 79.2 60.7
Solvency Capital Requirement (SCR)(R’bn) 36.7 29.4
Solvency Ratio 216% 206%
*Net of inadmissible assets and other regulatory adjustments
By law, South African insurers must hold funds of sufficient quality and quantity to absorb significant unforeseen losses arising from the risks associated with their activities. The level of capital required for regulatory purposes should address the risk areas to which insurers are exposed and should be proportionate to the nature, scale and complexity of the business involved. As at the end of December 2020, OMLACSA had 2.06 times as much capital as was required.
Due to the fact that risks inherent in the different products that OMLACSA offers are correlated (whether negatively or positively), the amount of capital set aside to back all guarantees cannot be separated out for each individual product; hence the figures shown above apply to the whole of OMLACSA.

FOR MORE INFORMATION
CONTACT
Loreta Dienst 011 217 1246
Jan Howell 021 509 2510
Angus Campbell 021 504 7813
Email: [email protected]
Visit the Corporate website: www.oldmutual.co.za/corporate
You can ask for a copy of this report by calling the Pencare Service Centre at 0860 40 60 90, or emailing [email protected].
OM
BD
S 07.
2021
C3964
Old Mutual Corporate is a division of Old Mutual Life Assurance Company (South Africa) Limited, a licensed Financial Services Provider and Life Insurer situated at Mutualpark, Jan Smuts Drive, Pinelands 7405, South Africa. The company registration number is 1999/004643/06. The information contained in this document is provided as general information and does not constitute advice or an offer by Old Mutual. Every effort has been made to ensure that the information provided meets the statutory and regulatory requirements. However, should you become aware of any breach of such statutory and regulatory requirements, please address the matter in writing to: The Compliance Officer, Old Mutual Corporate, PO Box 66, Cape Town 8000, South Africa.
No part of this publication may be reproduced or distributed in any form or by any means, or stored in a database or retrieval system, without the prior written permission of the publisher.
Reliance on the information contained in the report by any third party is entirely at the risk of the third party. Old Mutual will not be liable for any damage, loss or liability of any nature whatsoever incurred by any third party relying on this report.


