On behalf of Oldham Council Project Ref: 47212/4501 | Date: September 2020 Registered Office: Buckingham Court Kingsmead Business Park, London Road, High Wycombe, Buckinghamshire, HP11 1JU Office Address: Oxford Place, 61 Oxford Street, Manchester, M1 6EQ T: 0161 245 8900 E: [email protected]Oldham Retail & Leisure Study Main Report
Transcript
On behalf of Oldham Council
Project Ref: 47212/4501 | Date: September 2020
Registered Office: Buckingham Court Kingsmead Business Park, London Road, High Wycombe, Buckinghamshire, HP11 1JU Office Address: Oxford Place, 61 Oxford Street, Manchester, M1 6EQ T: 0161 245 8900 E: [email protected]
Oldham Retail & Leisure Study Main Report
Main Report Oldham Retail & Leisure Study
J:\47000 to 47999\47212 Oldham Retail & Leisure Study\4501 Planning\Reps-Tech Notes\Final Report\47212 Oldham RLS Final Report 28-09-
ii
Document Control Sheet Project Name: Oldham Retail & Leisure Study Project Ref: 47212 Report Title: Main Report Date: September 2020
Name Position Signature Date
Prepared by: Tom Smith Principal Planner TS September 2020
Reviewed by: Bernard Greep Planning Director BG September 2020
Approved by: Bernard Greep Planning Director BG September 2020
For and on behalf of Stantec UK Limited
This report has been prepared by Stantec UK Limited (‘Stantec’) on behalf of its client to whom this report is addressed (‘Client’) in connection with the project described in this report and takes into account the Client's particular instructions and requirements. This report was prepared in accordance with the professional services appointment under which Stantec was appointed by its Client. This report is not intended for and should not be relied on by any third party (i.e. parties other than the Client). Stantec accepts no duty or responsibility (including in negligence) to any party other than the Client and disclaims all liability of any nature whatsoever to any such party in respect of this report.
3.1 National Planning Policy Framework ..........................................................................2 3.2 Local Planning Policy .................................................................................................4 3.3 Policy Response ........................................................................................................5 3.4 Implications for Oldham Borough ............................................................................. 10
4 Market and Economic Trends ............................................................................................... 11 4.1 Market Trends.......................................................................................................... 11 4.2 Convenience Retail Sector ....................................................................................... 13 4.3 Comparison Retail Sector ........................................................................................ 15 4.4 Commercial Leisure ................................................................................................. 15 4.5 Potential Impacts of COVID-19 ................................................................................ 16 4.6 Potential Economic Scenarios .................................................................................. 17 4.7 Centres in Oldham Borough and the Surrounding Area ............................................ 18
5 Health Check Assessments .................................................................................................. 21 5.1 Introduction .............................................................................................................. 21 5.2 Oldham Town Centre ............................................................................................... 21 5.3 On-Street Survey Results ......................................................................................... 27 5.4 District Centres ........................................................................................................ 28 5.5 Shaw District Centre ................................................................................................ 30 5.6 Royton District Centre .............................................................................................. 34 5.7 Uppermill District Centre .......................................................................................... 38 5.8 Lees District Centre ................................................................................................. 42 5.9 Hill Stores District Centre ......................................................................................... 45 5.10 Chadderton District Centre ....................................................................................... 49 5.11 Failsworth District Centre ......................................................................................... 52 5.12 Stakeholder Engagement ......................................................................................... 55
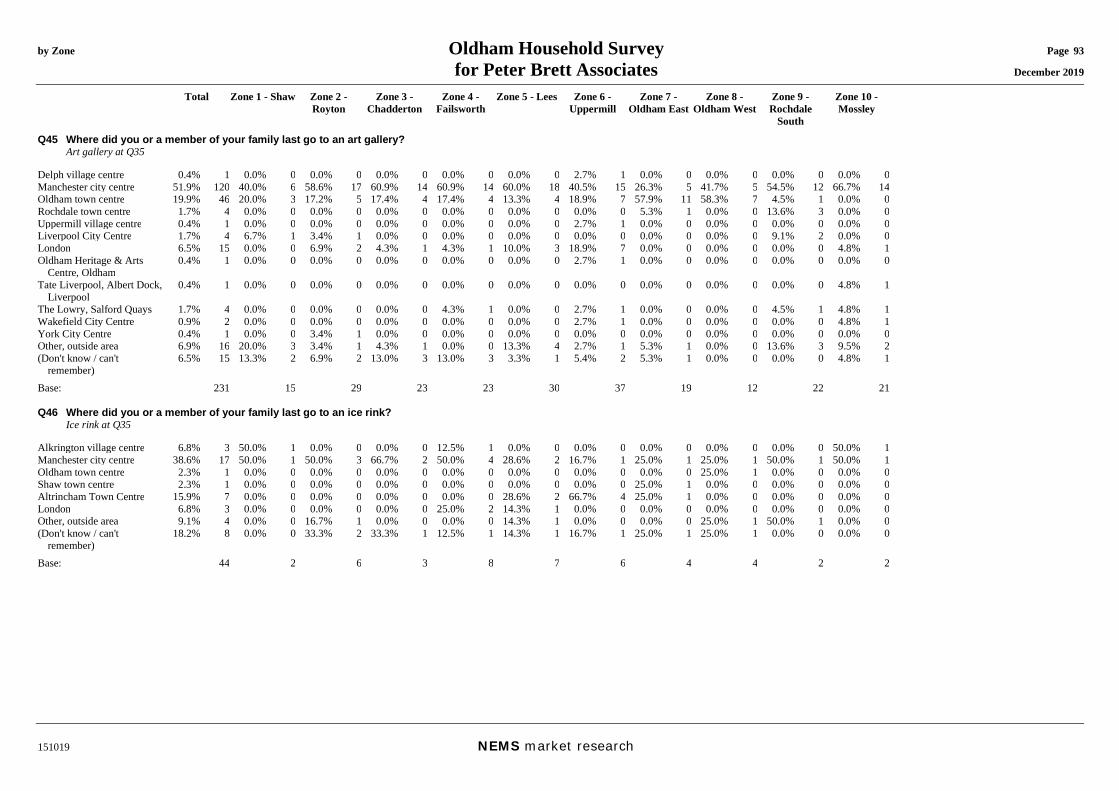
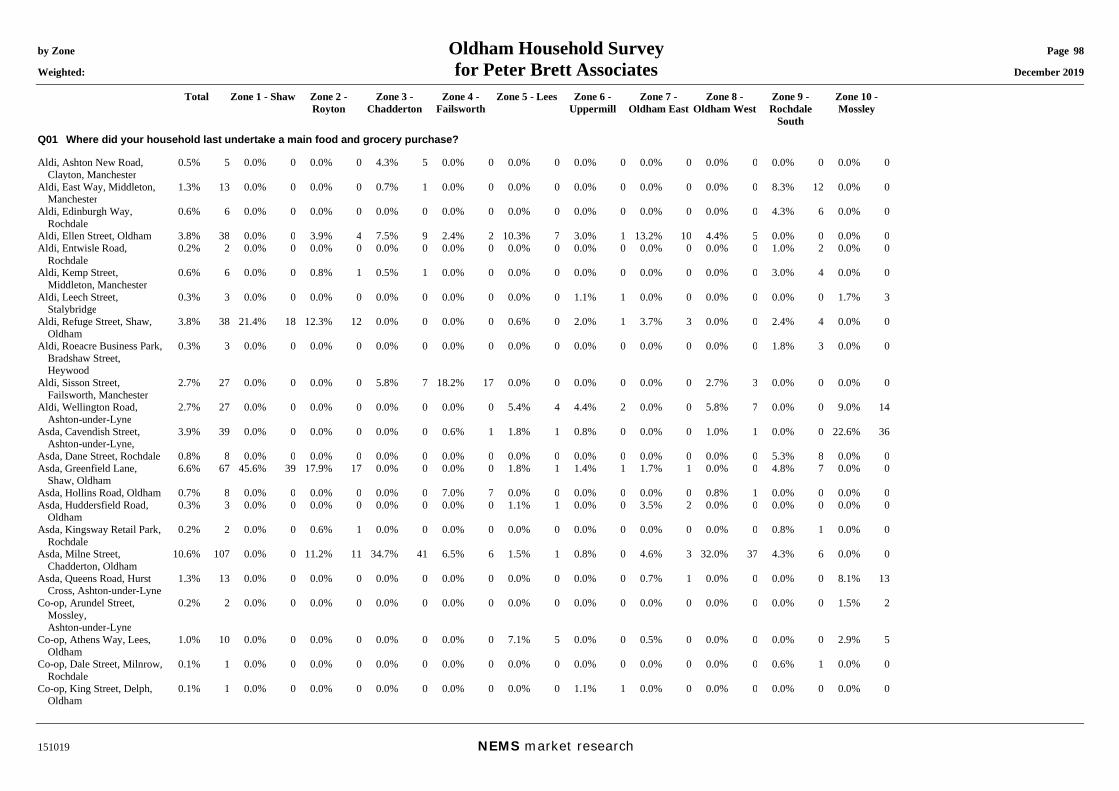
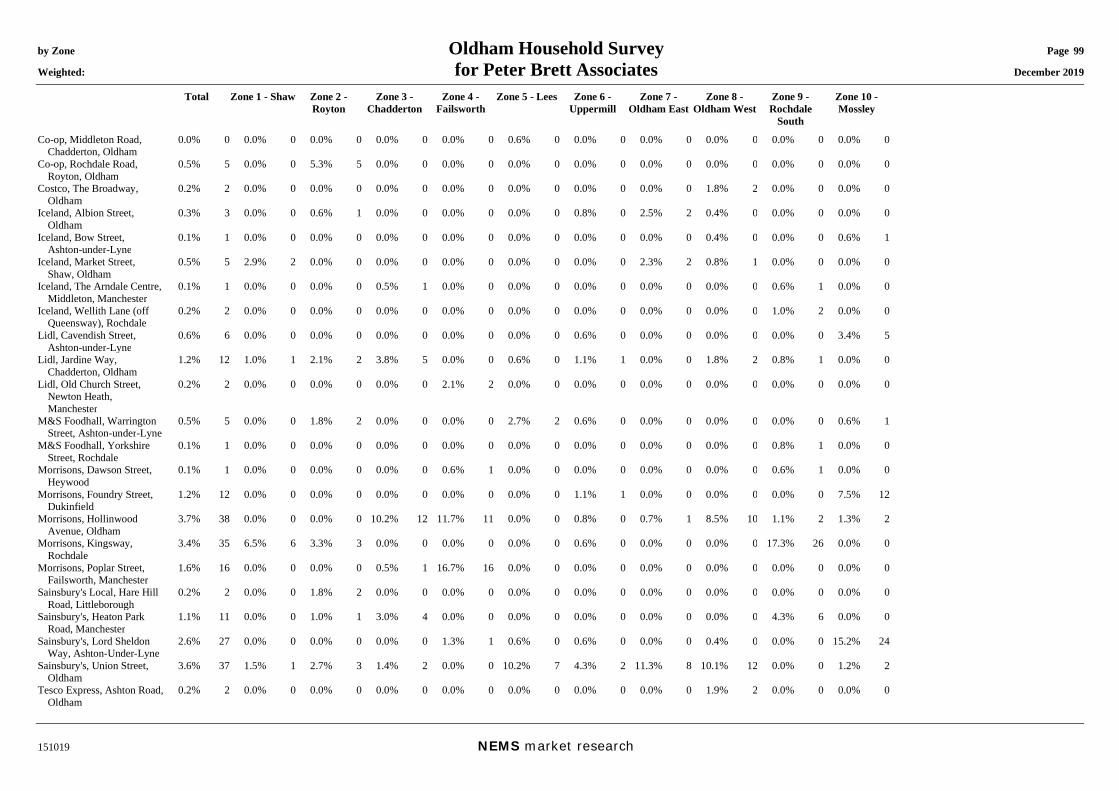
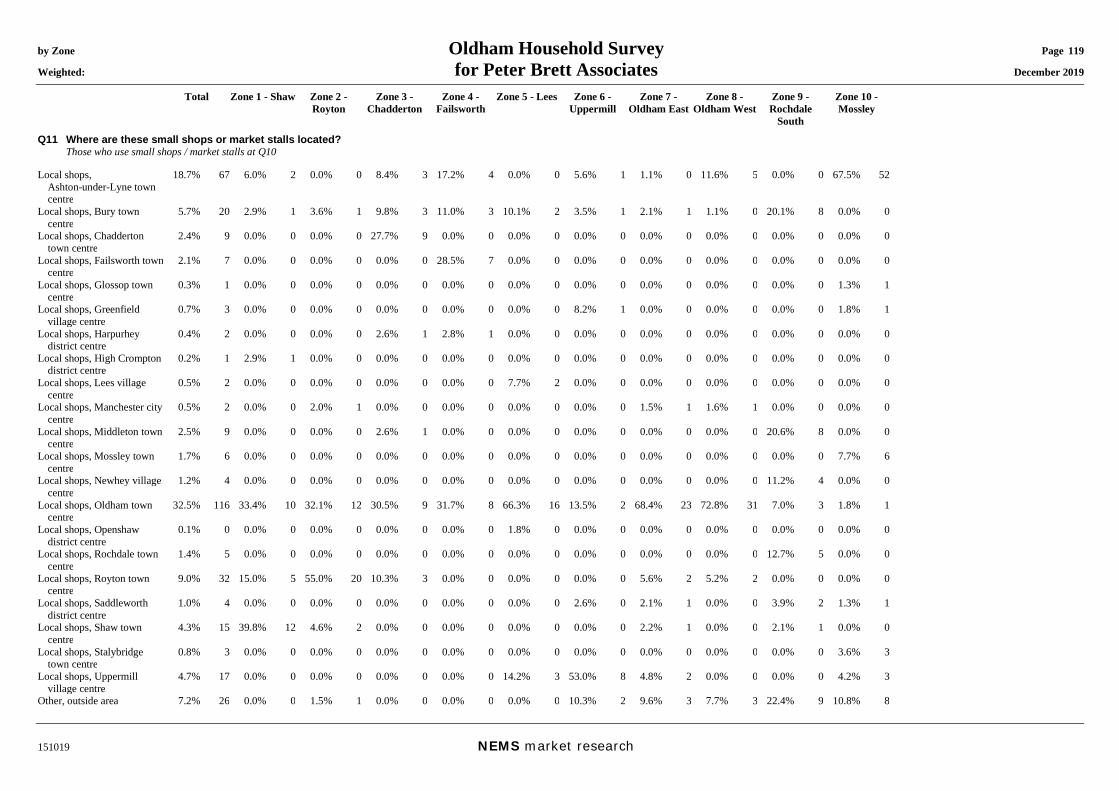
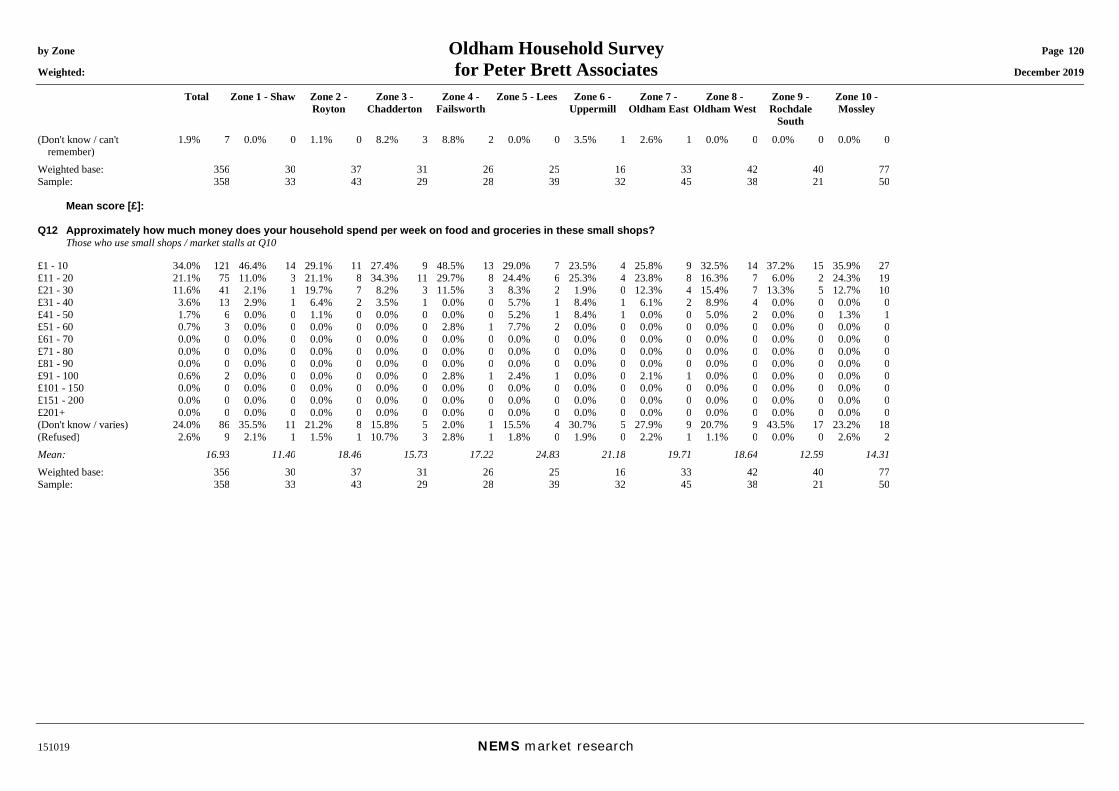
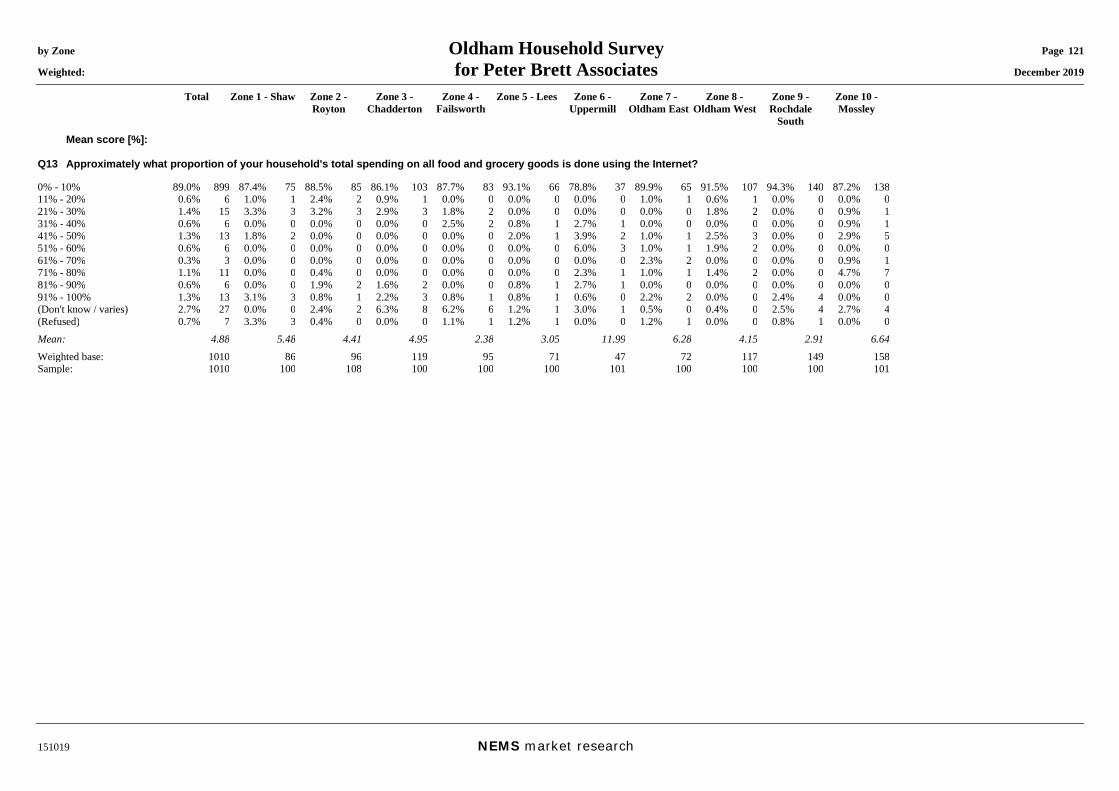
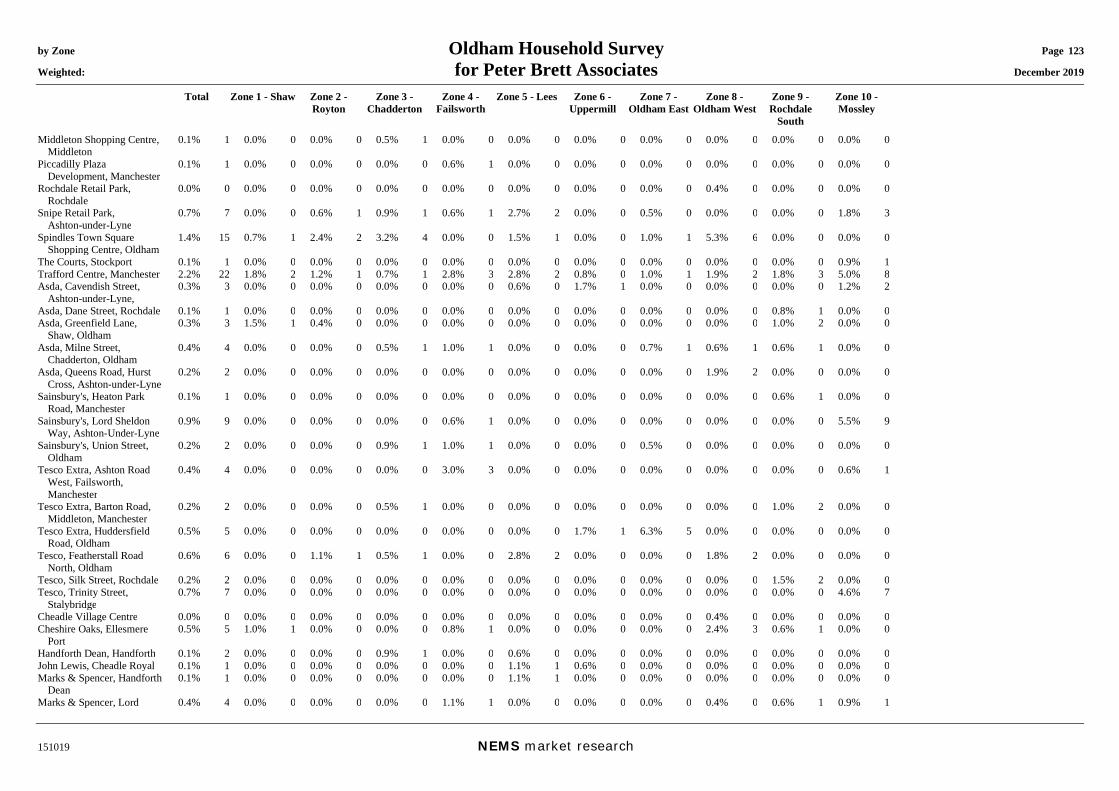
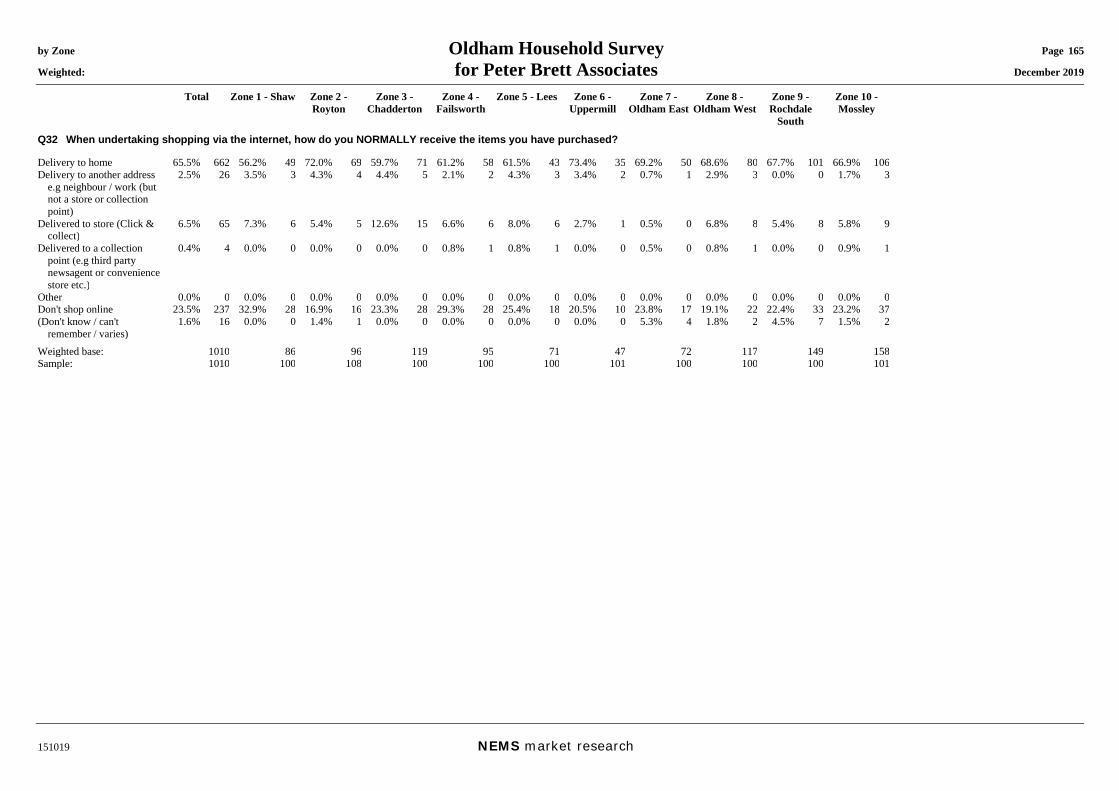
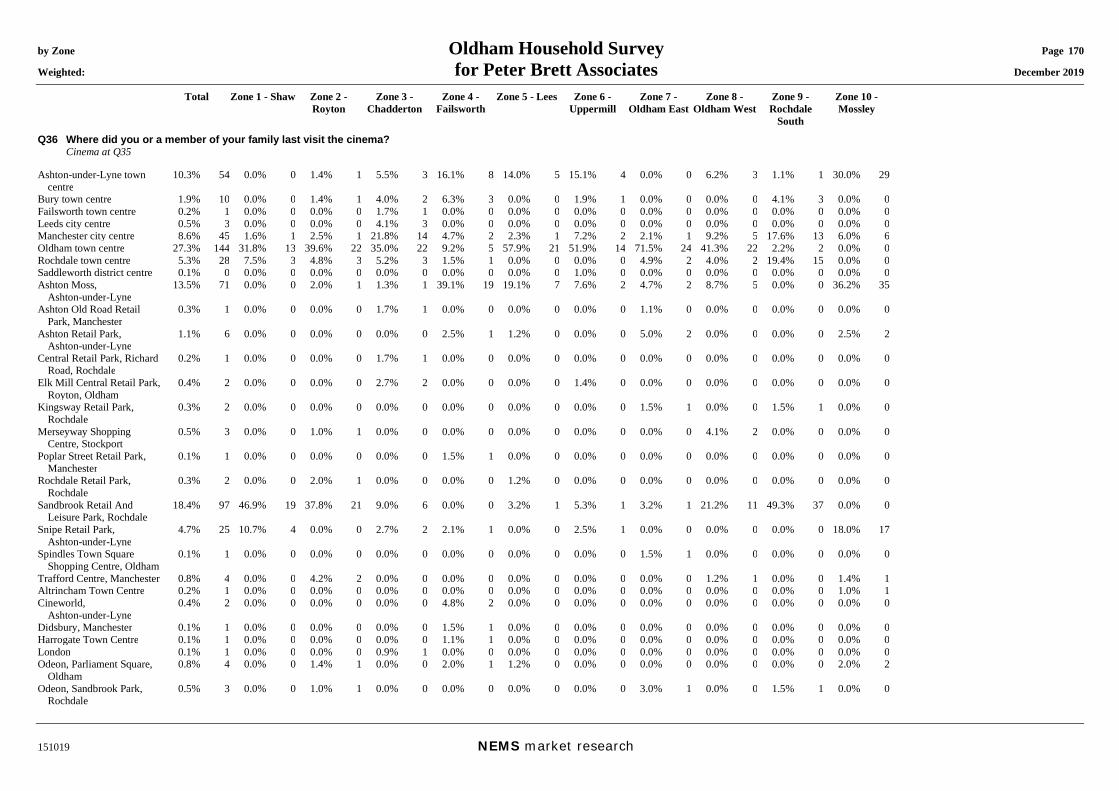
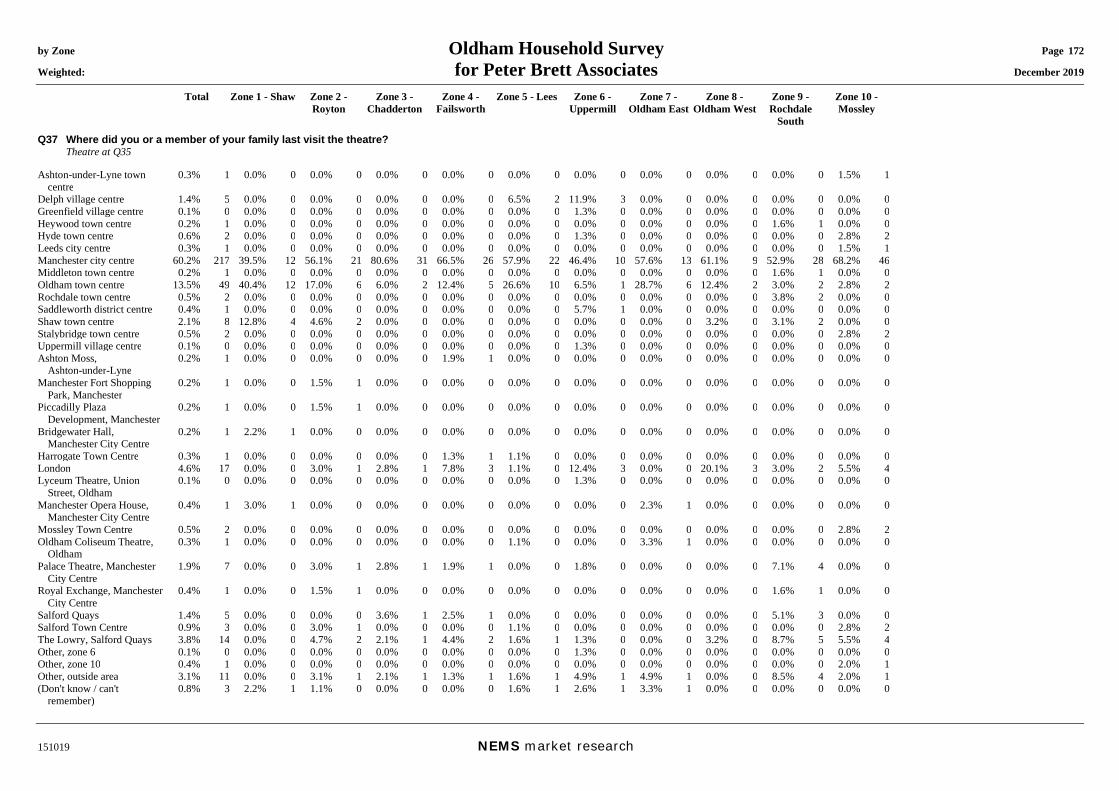
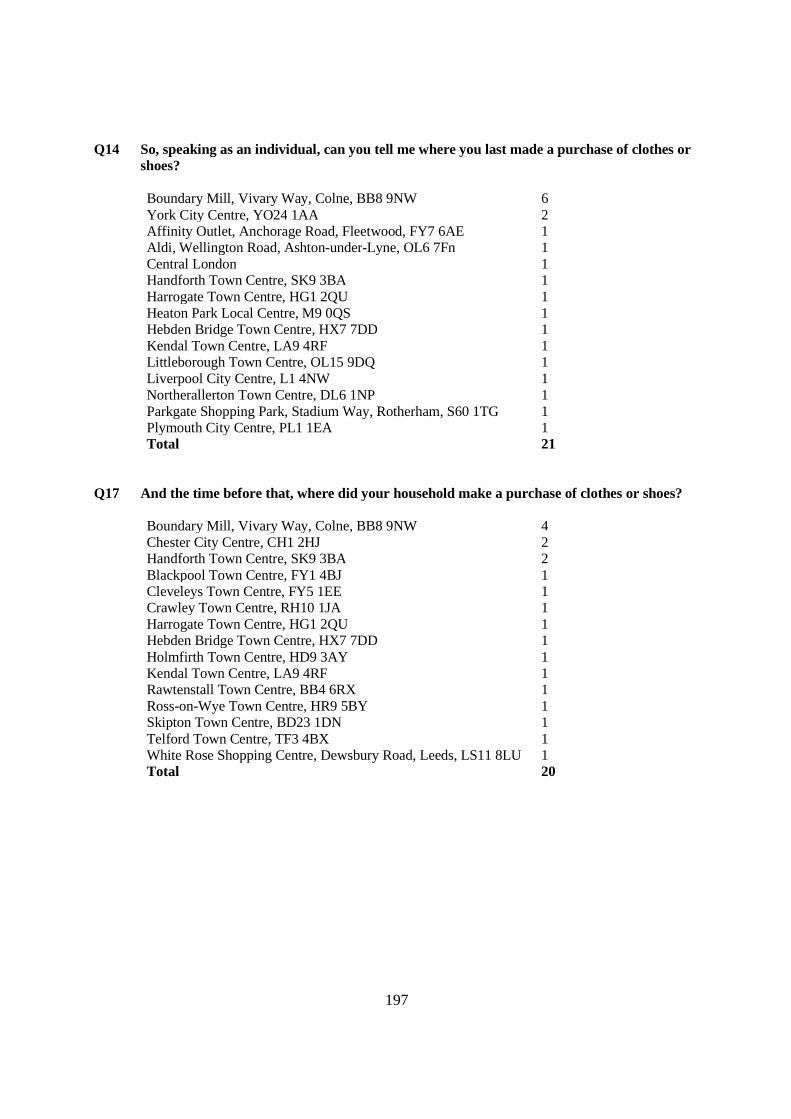
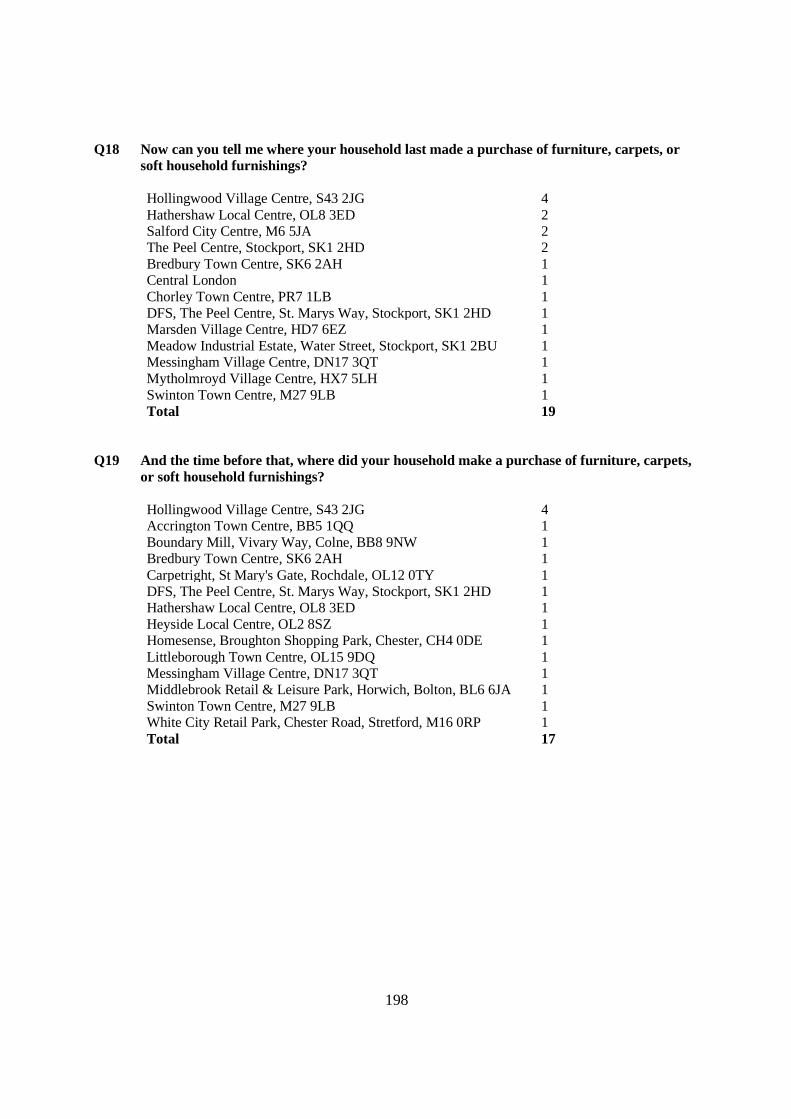
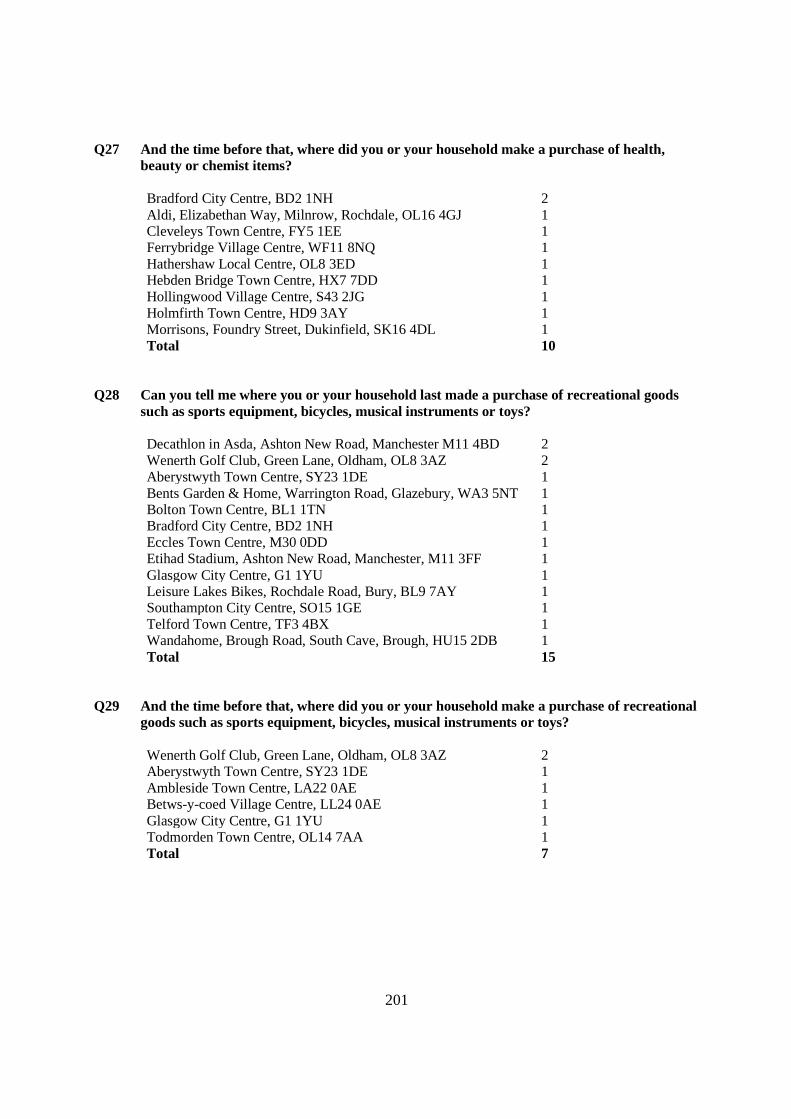
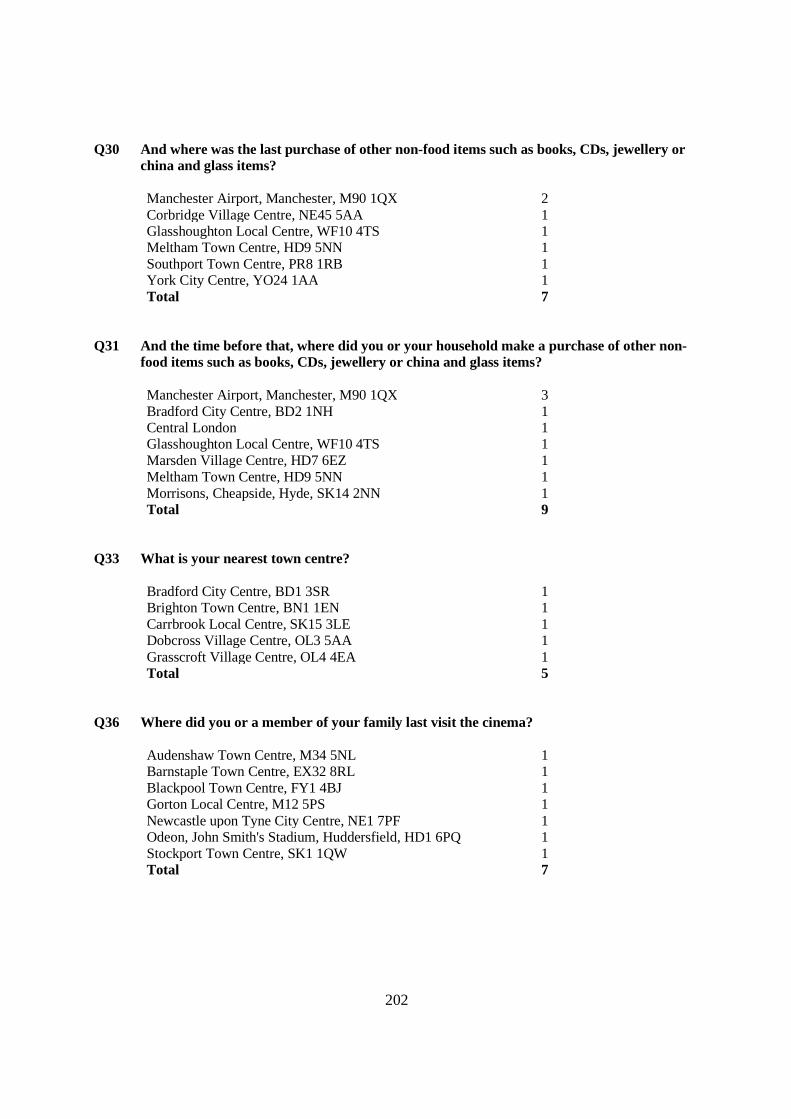
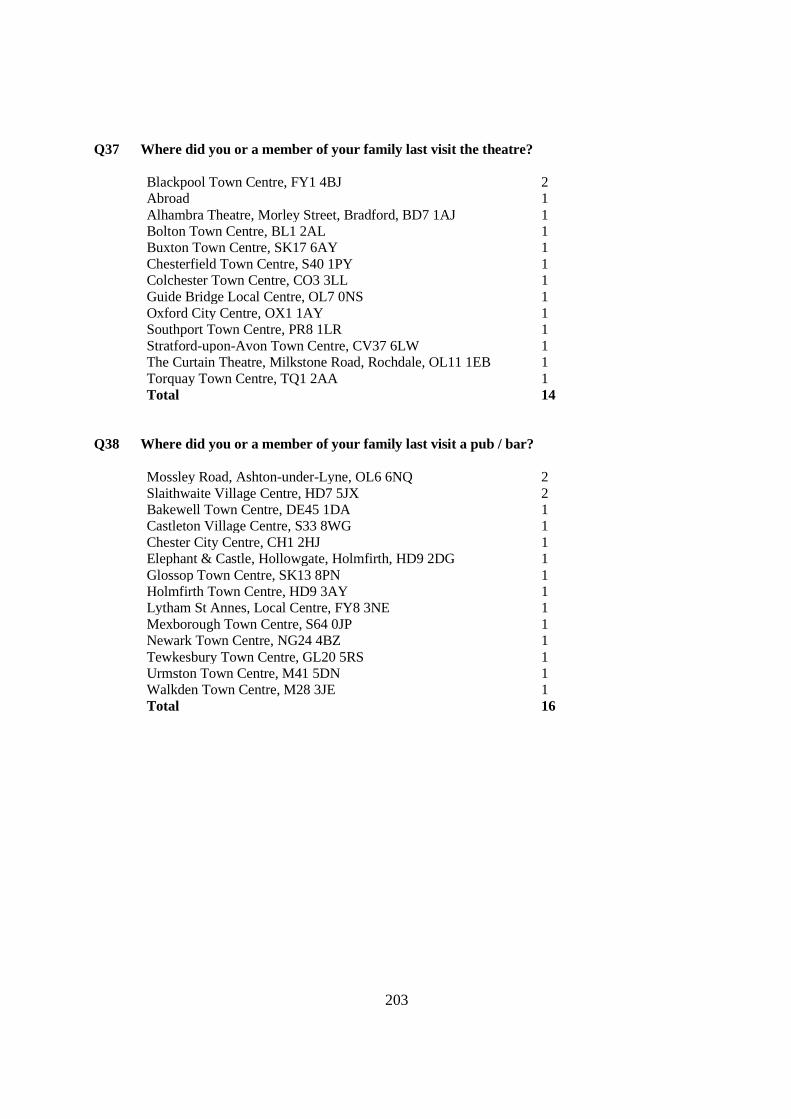
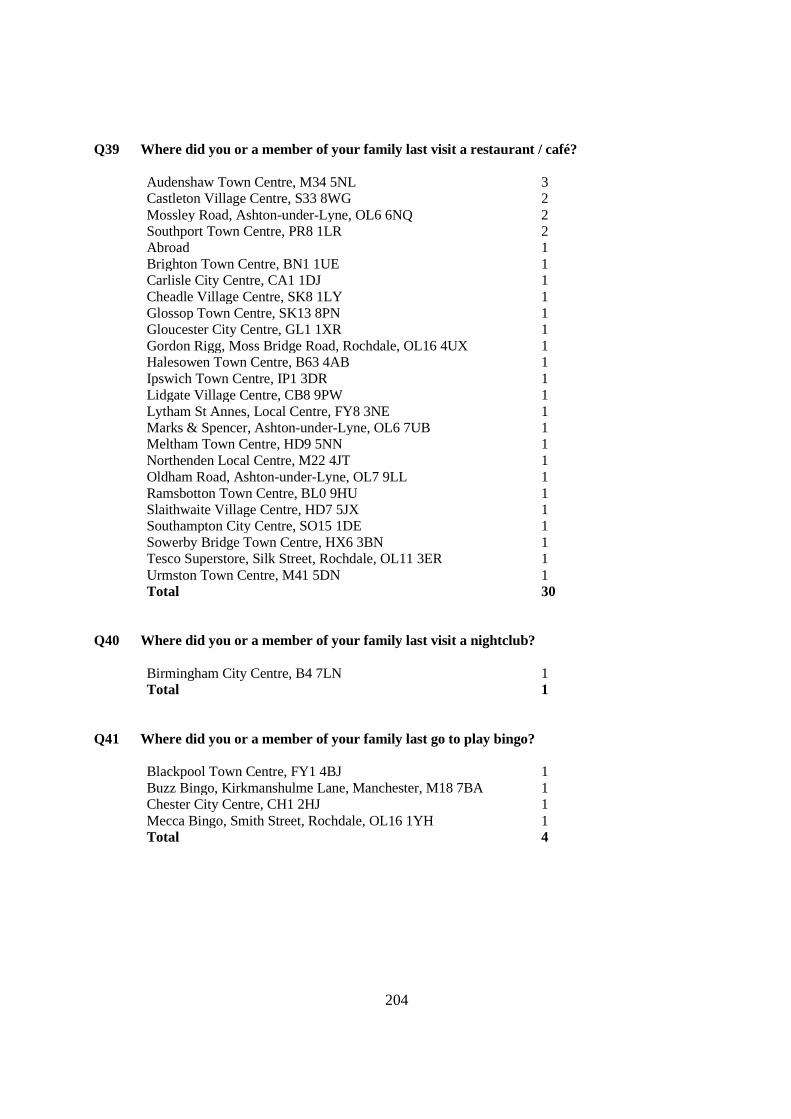
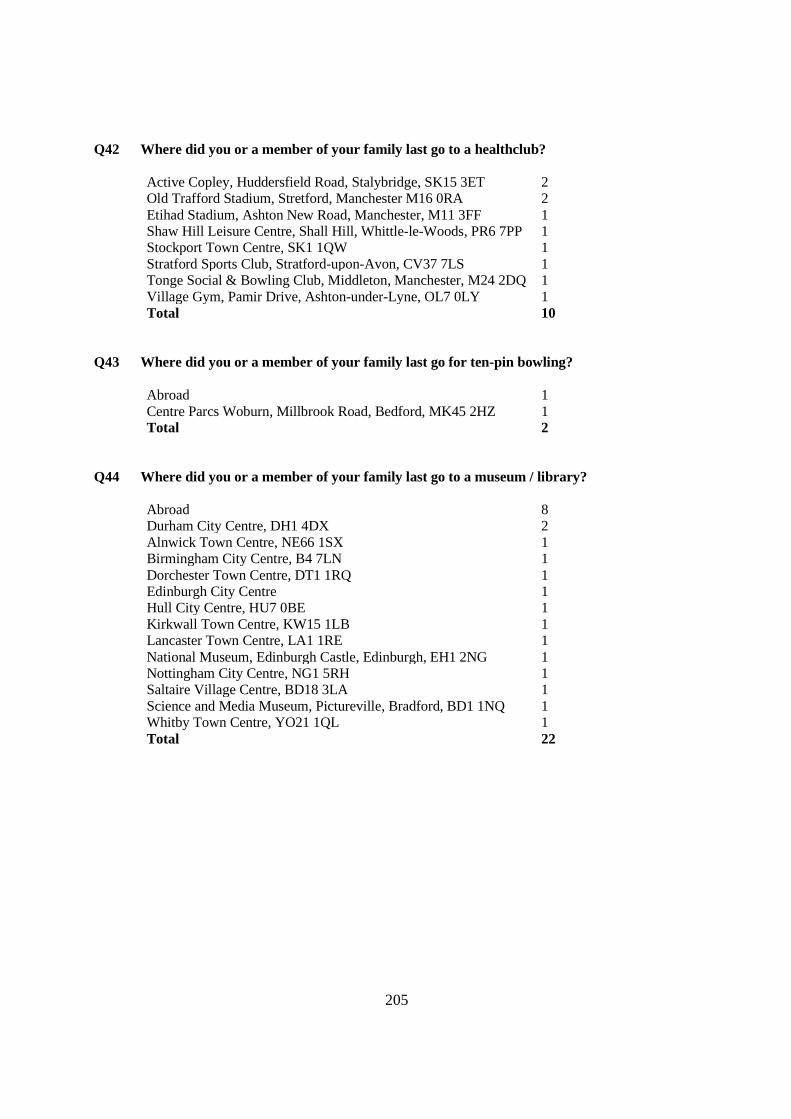
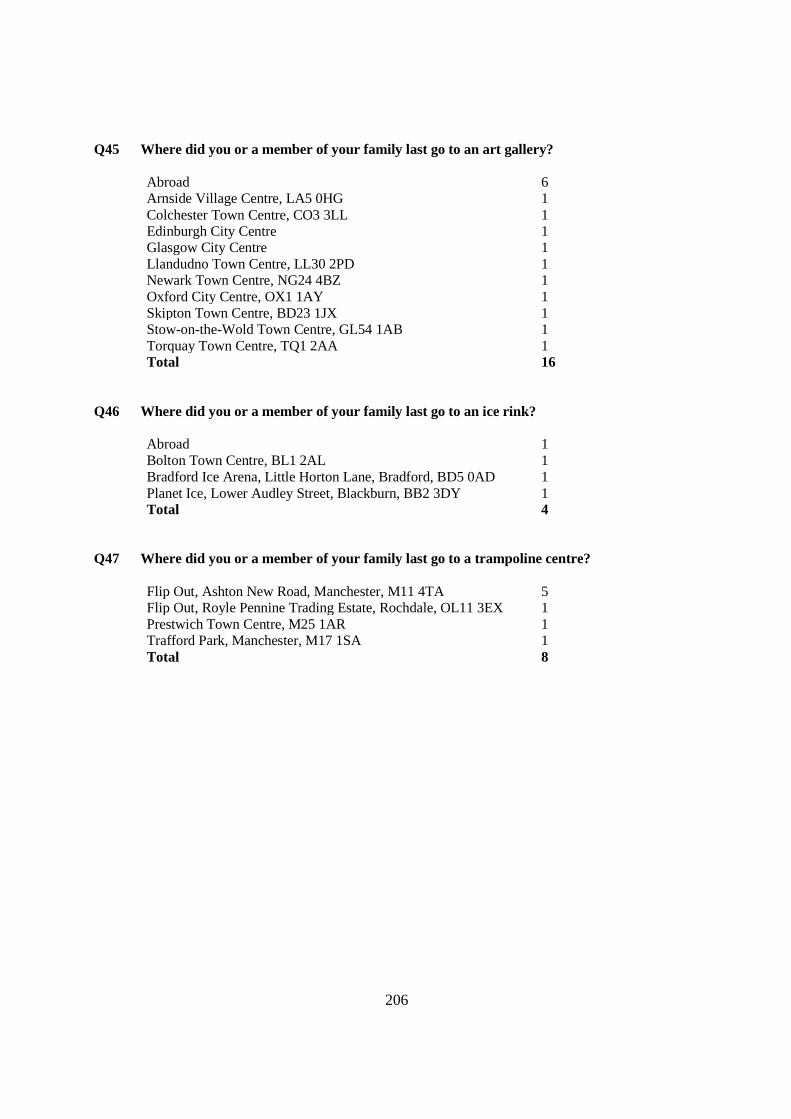
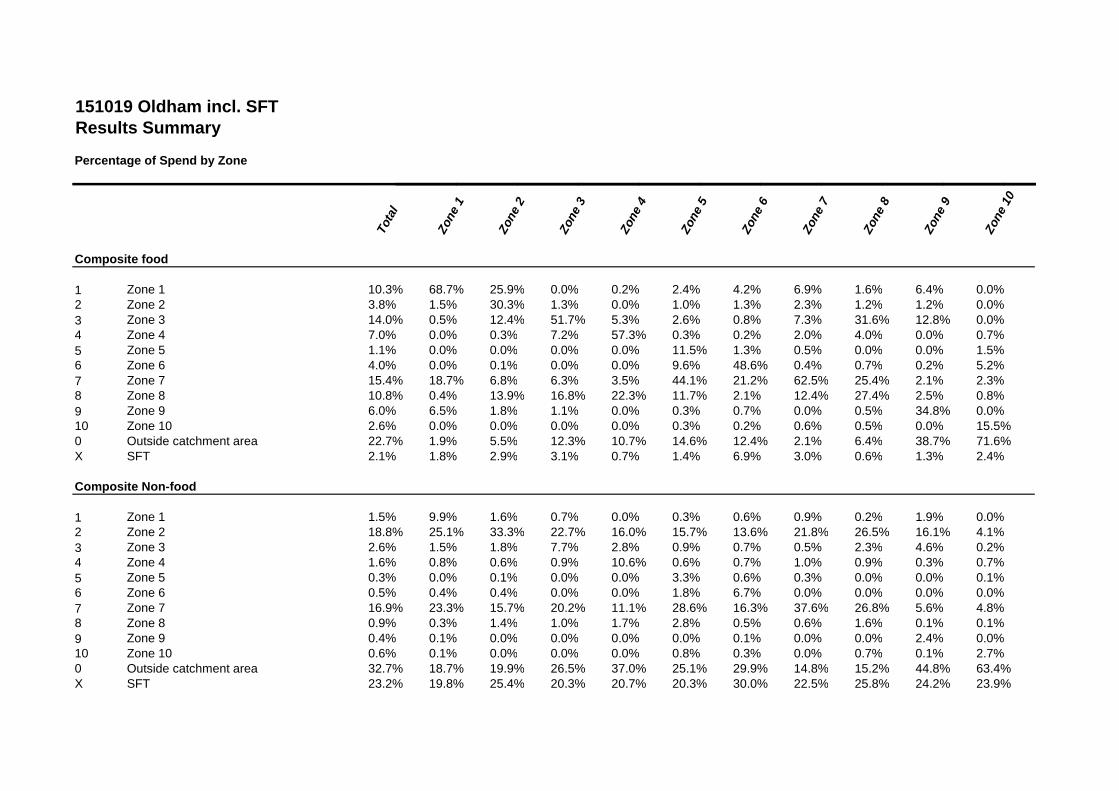
6 Retail & Commercial Leisure Spending Patterns ................................................................ 58 6.1 Introduction .............................................................................................................. 58 6.2 Household Survey Methodology ............................................................................... 58 6.3 Survey Questionnaire............................................................................................... 58 6.4 Composite Patterns of Spend on Comparison Goods ............................................... 59 6.5 Current Patterns of Spending on Convenience Goods .............................................. 66 6.6 Current Patterns of Spending on Leisure Services and Cultural Activities ................. 70
7 Assessment of Retail Needs ................................................................................................. 75
8 Commercial Leisure Needs................................................................................................... 82 8.1 Introduction .............................................................................................................. 82 8.2 Leisure Uses ............................................................................................................ 82 8.3 Other Main Town Centre Uses ................................................................................. 85 8.4 Conclusions ............................................................................................................. 85
9 Summary of Findings, and Recommendations.................................................................... 87 9.1 Introduction .............................................................................................................. 87 9.2 The Performance of Oldham Borough’s Town and District Centres ........................... 87 9.3 Retail Needs over the Study Period .......................................................................... 88 9.4 Need for Leisure and Other Main Town Centre Uses over the Study Period ............. 89 9.5 Meeting Needs and Other Recommendations .......................................................... 90 9.6 Town and District Centre Boundaries ....................................................................... 91 9.7 Local Impact Floorspace Threshold .......................................................................... 91 9.8 Monitoring and Review ............................................................................................. 92
Figures
Figure 4.1 Actual and projected market share of non-store retail sales/Special Forms of Trading (Adjusted for SFT Sales from Stores) ............................................................................... 13
Figure 4.2 UK Grocery Market Share (22 March 2020) ...................................................................... 14 Figure 4.3 Forecasted UK Gross Domestic Product Post COVID-19 .................................................. 17 Figure 4.4 Study Area Zones............................................................................................................. 18 Figure 5.1 View of Yorkshire Street and Odeon Old Town Hall Development ..................................... 22 Figure 5.2 View of Market Place from Spindles Town Square Shopping Centre ................................. 22 Figure 5.3 view to the north from Market Street ................................................................................. 30 Figure 5.4 View to the south from Milnrow Road ................................................................................ 31 Figure 5.5 View to the south from Rochdale Road ............................................................................. 35 Figure 5.6 View of Market Square ..................................................................................................... 36 Figure 5.7 View to the north along High Street................................................................................... 39 Figure 5.8 View to the south along High Street .................................................................................. 40 Figure 5.9 View to the east along High Street .................................................................................... 43 Figure 5.10 View to the west along High Street ................................................................................. 43 Figure 5.11 View to the south west along Huddersfield Road ............................................................ 46 Figure 5.12 View of Tesco Extra on Huddersfield Road ..................................................................... 47 Figure 5.13 View of Chadderton Precinct .......................................................................................... 50 Figure 5.14 View of Chadderton Town Hall........................................................................................ 50 Figure 5.15 View of Quayside Medical Centre ................................................................................... 53 Figure 5.16 View of KFC ................................................................................................................... 53 Figure 6.1: Percentage Share of Spending on Comparison Retail Goods in Oldham Town Centre
across Study Area ........................................................................................................... 63
Tables
Table 4.1 Net change in UK retail units by year 2012-2019................................................................ 12 Table 4.2 Average Weekly Household Spending Data 2009-2019 ..................................................... 16 Table 4.3 Venuescore UK Shopping Index and UK Rank .................................................................. 19 Table 5.1 Diversity of Uses Table for Oldham Town Centre ............................................................... 23 Table 5.2 Comparison of average achieved commercial rent across district centres .......................... 29 Table 5.3 Comparison of reported crimes across district centres, June 2017 – June 2019 ................. 29
v
Table 5.4 Diversity of Uses Table for Shaw District Centre ................................................................ 32 Table 5.5 Diversity of Uses Table for Royton District Centre .............................................................. 36 Table 5.6 Diversity of Uses Table for Uppermill District Centre .......................................................... 40 Table 5.7 Diversity of Uses Table for Lees District Centre ................................................................. 44 Table 5.8 Diversity of Uses Table for Hill Stores ................................................................................ 47 Table 5.9 Diversity of Uses Table for Chadderton District Centre ....................................................... 51 Table 5.10 Diversity of Uses Table for Failsworth District Centre ....................................................... 54 Table 6.1 Oldham Study Area ........................................................................................................... 58 Table 6.2 Broad Destinations for Comparison Goods Expenditure ..................................................... 60 Table 6.3 Comparison Goods Expenditure retained within the Study Area ......................................... 60 Table 6.4 Main Destinations for Comparison Goods Expenditure Leakage ........................................ 61 Table 6.5 Comparison Goods Centres / Retail Parks of Dominant and Subsidiary Influence .............. 65 Table 6.6 Broad Destinations for Convenience Goods Expenditure ................................................... 66 Table 6.7 Main Destinations for Convenience Goods Expenditure Retained within the Study Area .... 67 Table 6.8 Main Destinations for Convenience Goods Expenditure Leakage ....................................... 67 Table 6.9 Localised Convenience Goods Retention Rates................................................................. 68 Table 6.10 Dominant Convenience Goods Stores and Stores with Subsidiary Influence .................... 68 Table 6.11 Most Popular Destinations for Expenditure on Leisure Services and Culture (1) ............... 70 Table 6.12 Most Popular Destinations for Expenditure on Leisure Services and Culture (2) ............... 70 Table 7.1 Summary of ONS-Based Population Growth ...................................................................... 75 Table 7.2 Convenience Expenditure Growth Summary ...................................................................... 76 Table 7.3 Comparison Expenditure Growth Summary ....................................................................... 76 Table 7.4 Summary of Expenditure Retention in Oldham Borough at 2019 ........................................ 77 Table 7.5 Retail Commitments .......................................................................................................... 78 Table 7.6 Methodology for Convenience Retail Assessment .............................................................. 78 Table 7.7 Summary Convenience Retail Floorspace Requirements ................................................... 79 Table 7.8 Methodology for Comparison Retail Assessment ............................................................... 79 Table 7.9 Summary Comparison Retail Floorspace Requirements .................................................... 80 Table 8.1 Leisure Spending Growth (£m) .......................................................................................... 82 Table 8.2 Food and Beverage Expenditure Capacity ......................................................................... 84 Table 8.3 Food and Beverage Floorspace Capacity .......................................................................... 84 Table 9.1 Summary of Retail Sales Floorspace Requirements (2019-2037) ....................................... 89
Appendices
Appendix A Study Area Map Appendix B NEMS Household Survey Data Appendix C Convenience Retail Capacity Tables Appendix D Comparison Retail Capacity Tables Appendix E Leisure Capacity Tables Appendix F NEMS On-street Survey Data Appendix G Proposed Centre Boundaries Appendix H Potential Development Sites
1
1 Executive Summary 1.1.1 This Retail & Leisure Study has been prepared by Stantec on behalf of Oldham Council. It is
intended to form a key evidence base document to inform the review of the Local Plan, which will cover the period to 2037. The study provides a qualitative analysis of the existing retail and leisure facilities within Oldham Borough, and a quantitative and qualitative assessment of the need for new retail and leisure facilities. The key findings of the study are set out below.
1.2 Health Check Assessments
Oldham Town Centre
1.2.1 The health of Oldham Town Centre is mixed. In terms of positives, the town centre contains many national multiple retailers, including Boots, Debenhams, H&M, Next and Primark and there is strong representation across the various retail categories. The proportion of food and drink units is similar to the national average and there are 19 cafés and 10 restaurants within the town centre. The town centre is easily accessible by car and tram and there is good parking provision within Oldham Town Centre.
1.2.2 However, the health of the town centre has deteriorated since the 2009 Study. The proportion of vacant units in the town centre is almost double the current national average. The number of vacant units has increased by 39 units since 2009, which points to a lack of demand for floorspace within Oldham Town Centre. Most of the vacant units are located within Spindles Town Square Shopping Centre. The town centre environment could be improved, particularly around the Spindles Town Square Shopping Centre and Tommyfield Market.
1.2.3 Whilst the town centre has managed to hold onto some national multiple retailers during the restructuring of the retail industry, it is clear that there is too much retail floorspace in the town centre. To prevent further decline in the health of the town centre, interventions will be required, such as those that can be achieved via initiatives such as the Future High Streets Fund, to enable parts of the town centre to move away from retail.
Shaw District Centre
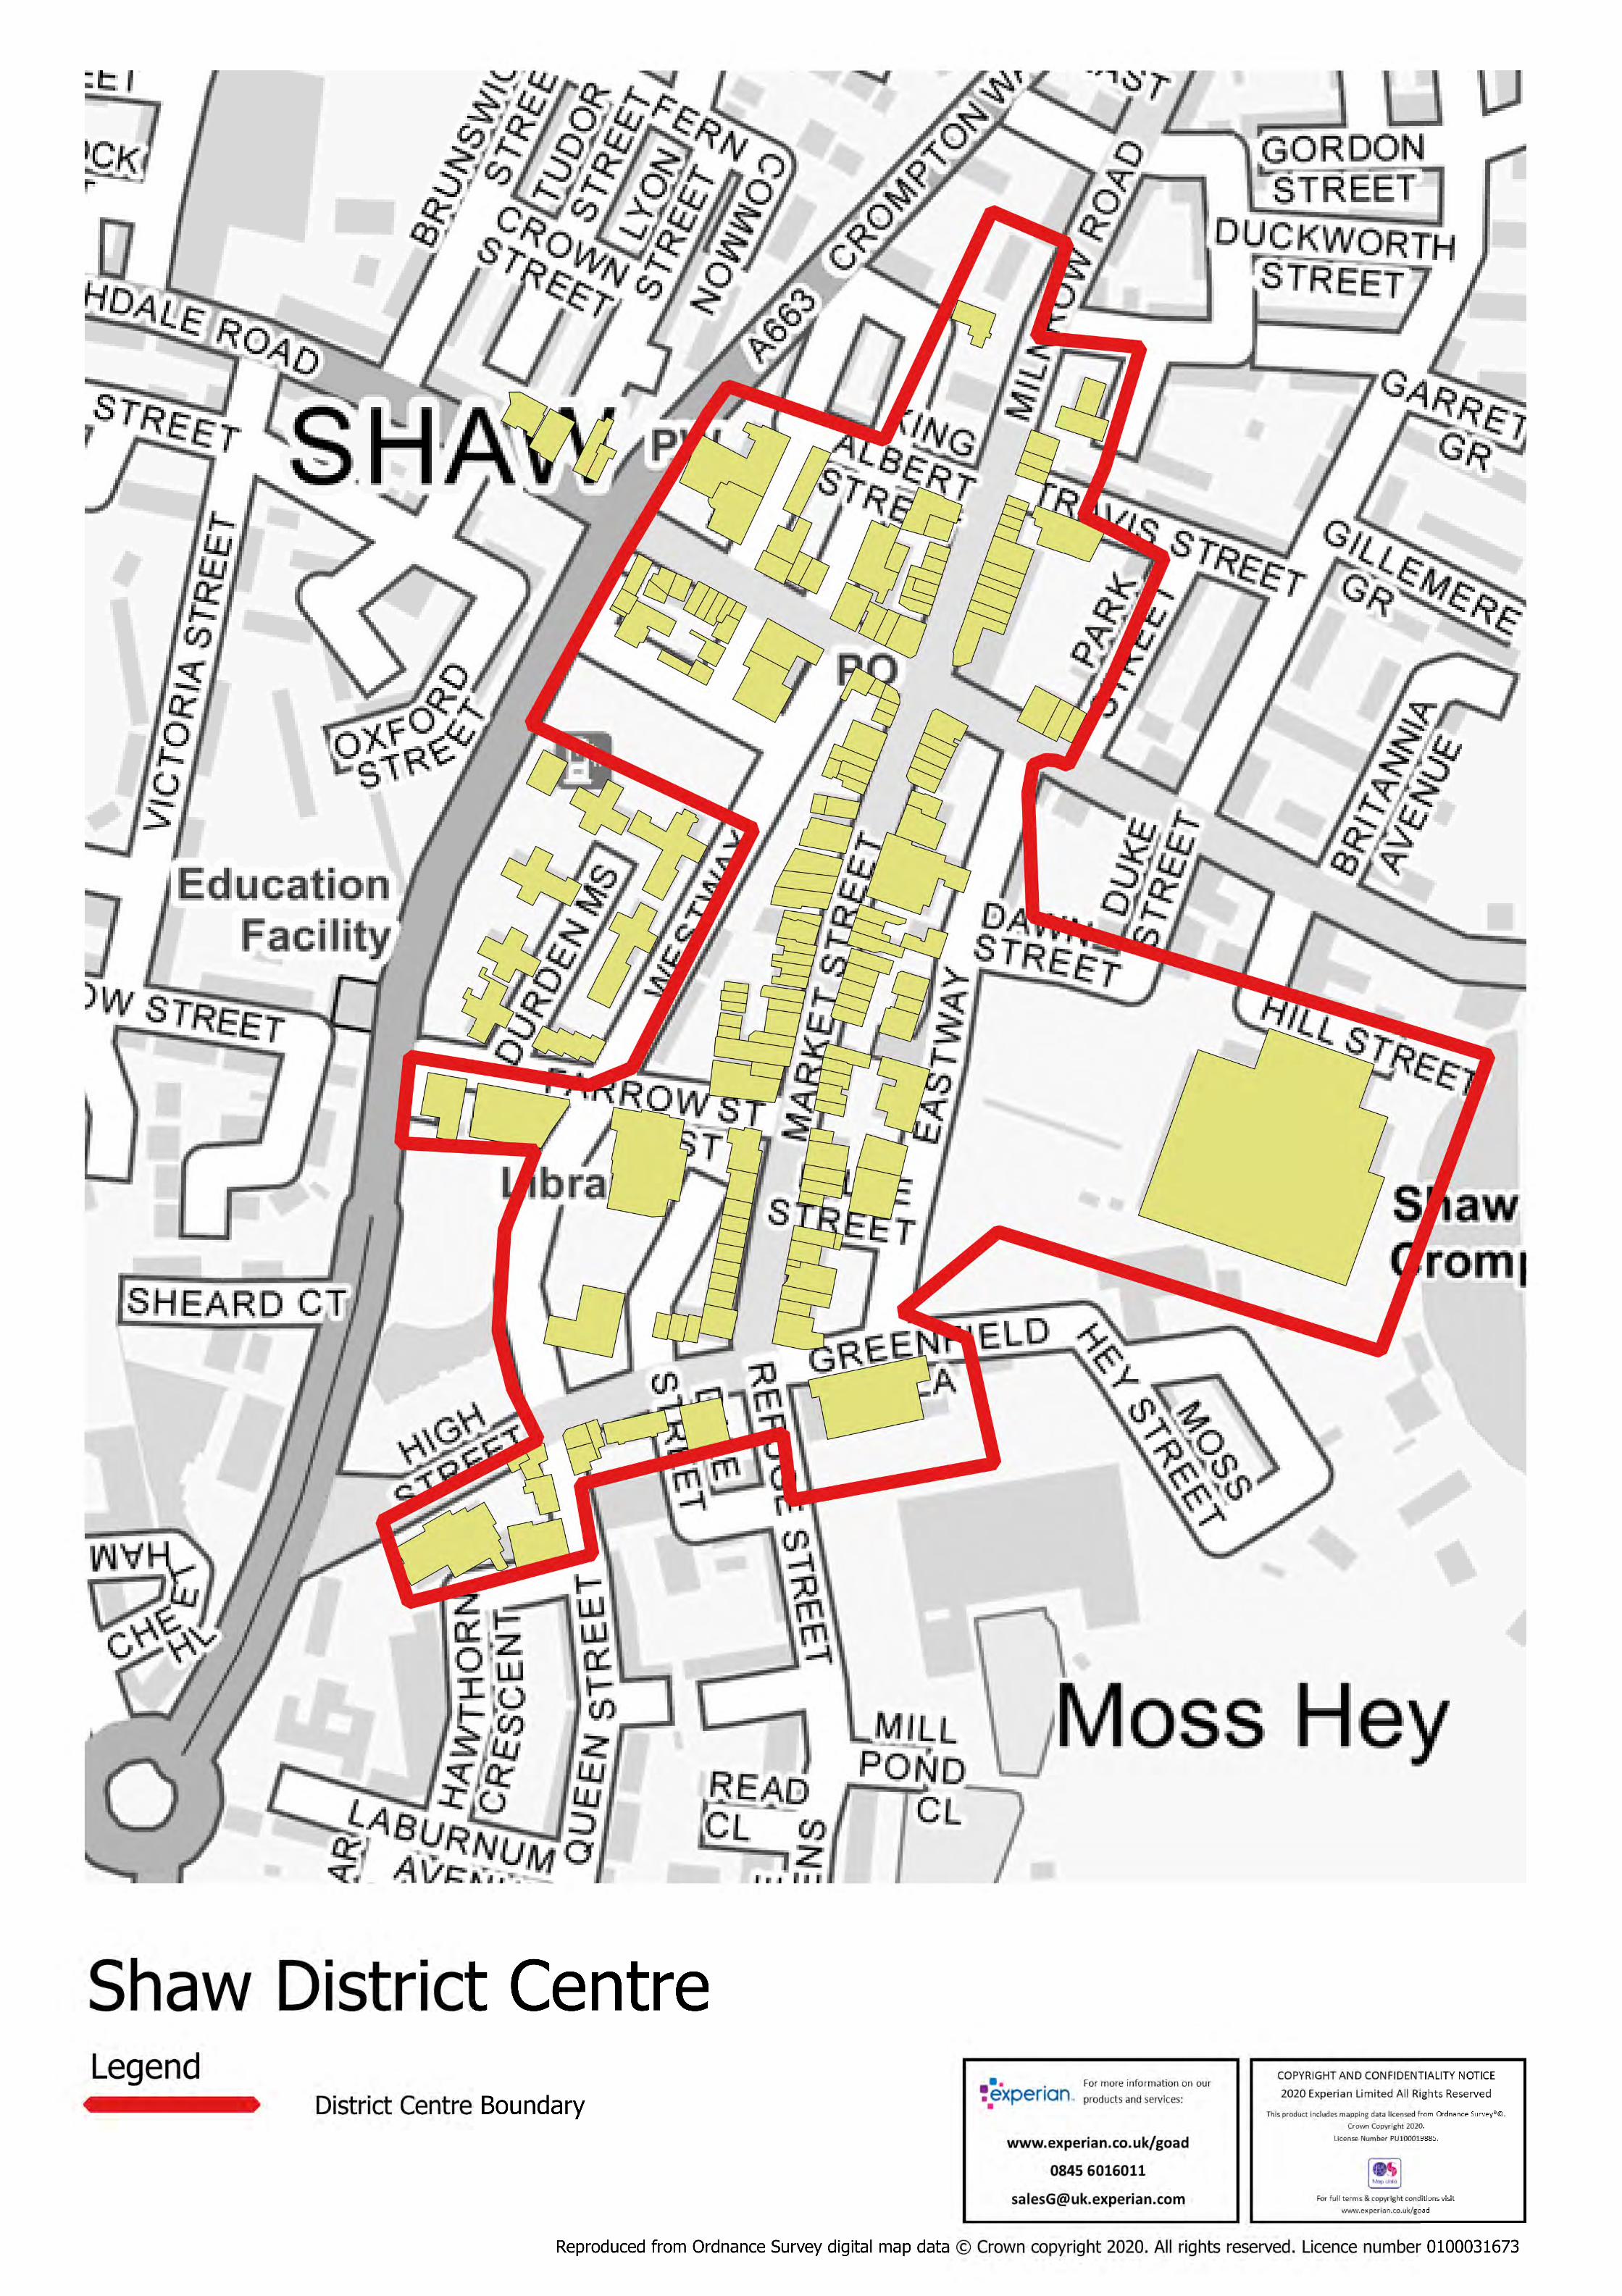
1.2.4 On the whole, Shaw District Centre is not performing well and has declined in health since the 2009 Study. The proportion of vacant units has increased significantly and is well above the national average. The physical environment has experienced a gradual decline and no longer offers an attractive environment to shop in.
1.2.5 Notwithstanding the overall conclusion outlined above, the proportion of convenience goods and comparison goods retailers is similar to what would be expected for a centre of this size. The retail rents typically commanded by units within Shaw are above other similar-sized centres. Furthermore, Shaw is easily accessible by car, bus and tram.
Royton District Centre
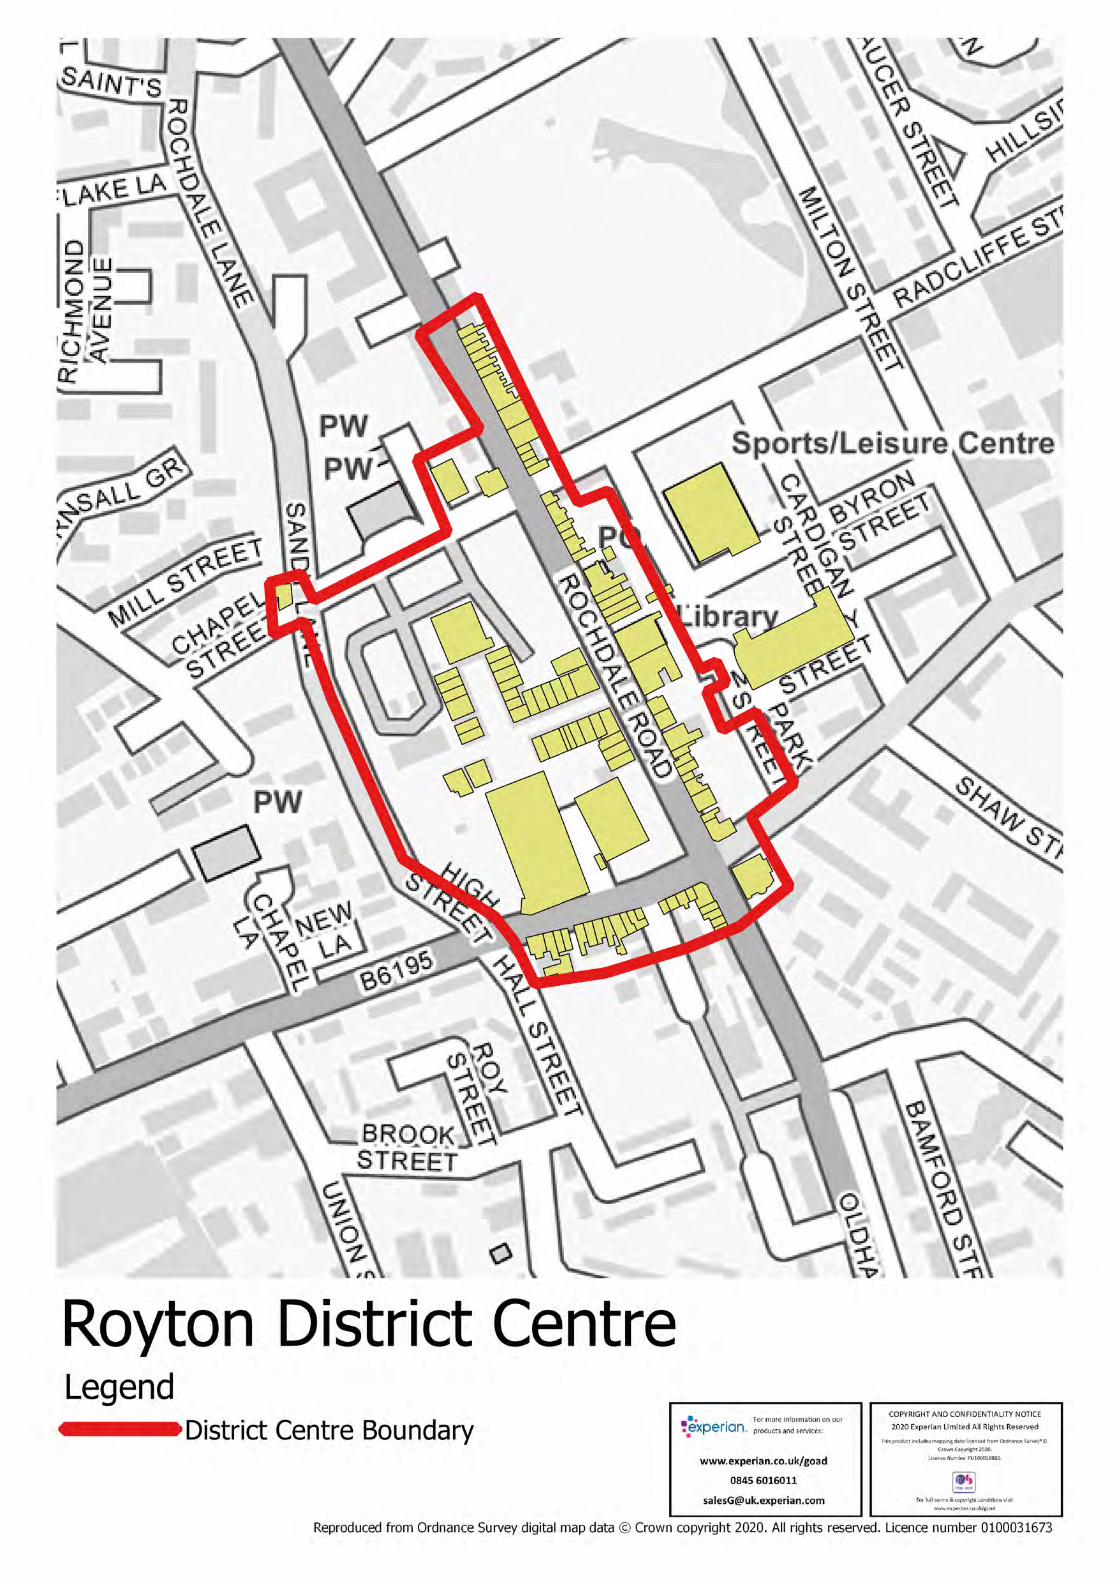
1.2.6 The physical environment could be improved through the renovation of Market Square. Notwithstanding this, Royton District Centre is relatively healthy and performing well. The centre is anchored by two medium-sized foodstores. The vacancy rate is low and has remained below the national average since the 2009 Study. The centre has a good representation of retailers, a reasonable level of evening economy uses and a thriving market. Commercial retail rents are comparable to other district centres in Oldham Borough and the centre is easily accessible by car.
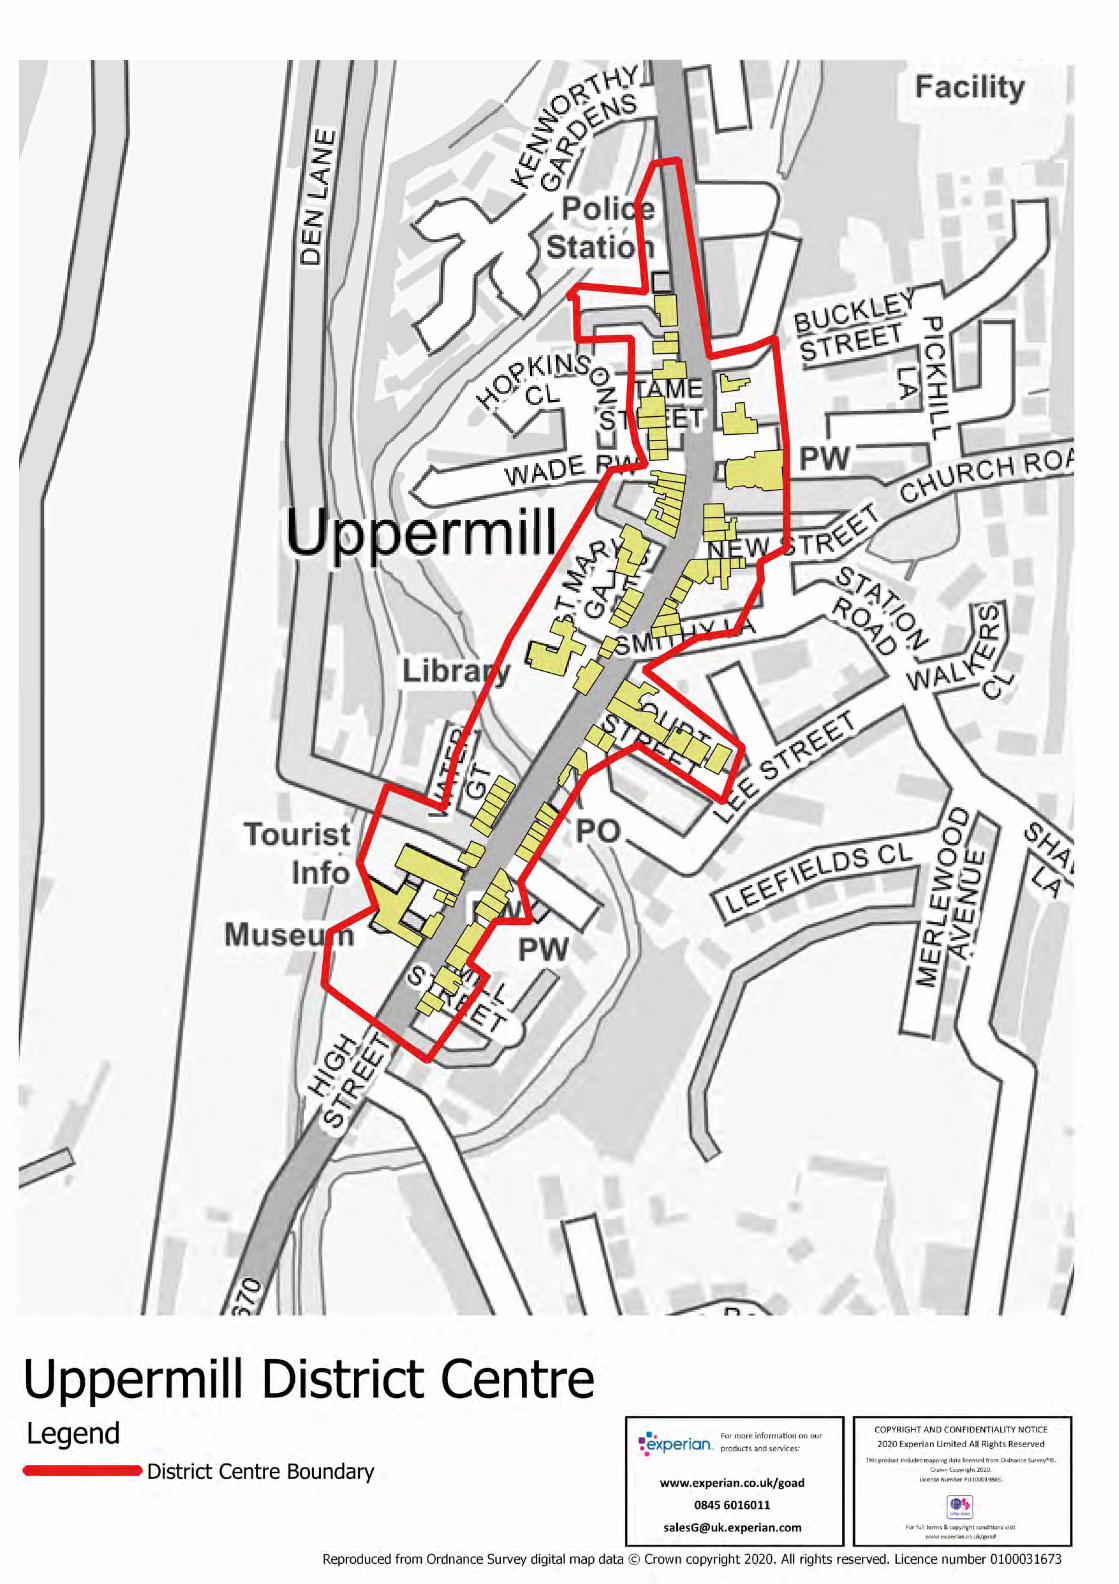
Uppermill District Centre
1.2.7 Uppermill is performing very well and is a healthy centre. The centre is almost fully occupied, with there being just two vacant units present. Uppermill is attractive with a relatively high proportion of comparison goods retailers. The centre is covered by a conservation area and
2
contains a high number of independent retailers. Uppermill also has a reasonable evening economy and a low crime rate.
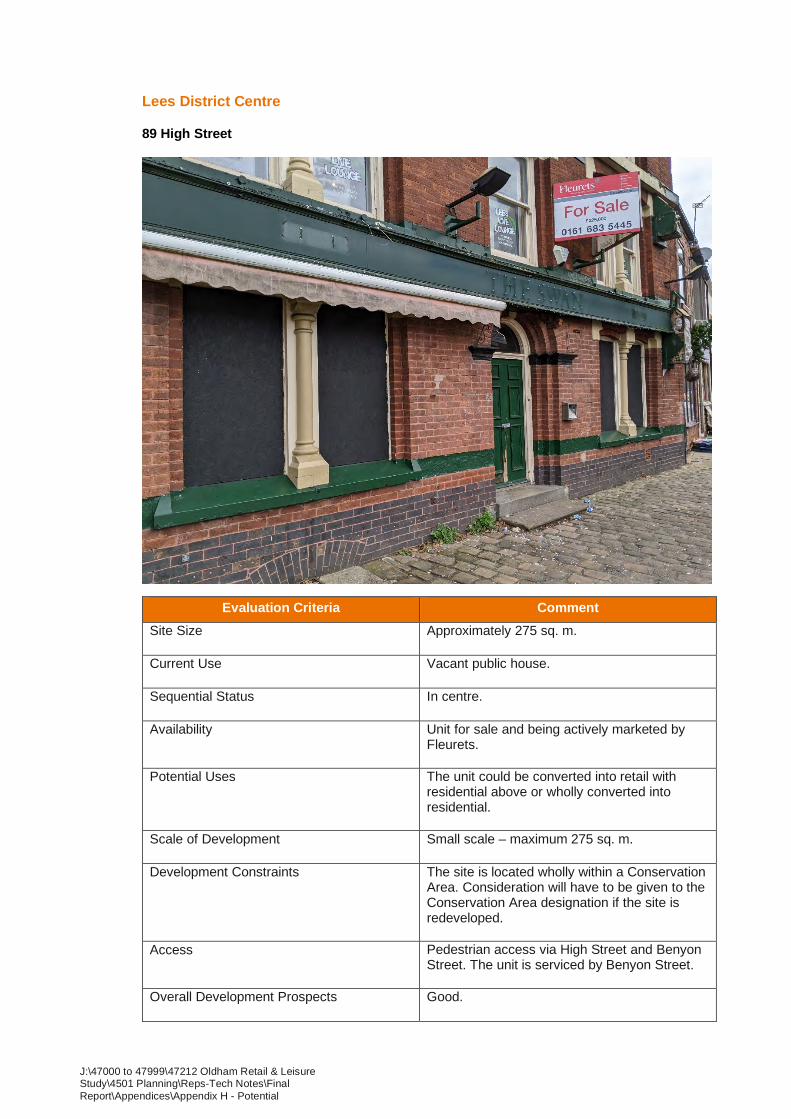
Lees District Centre
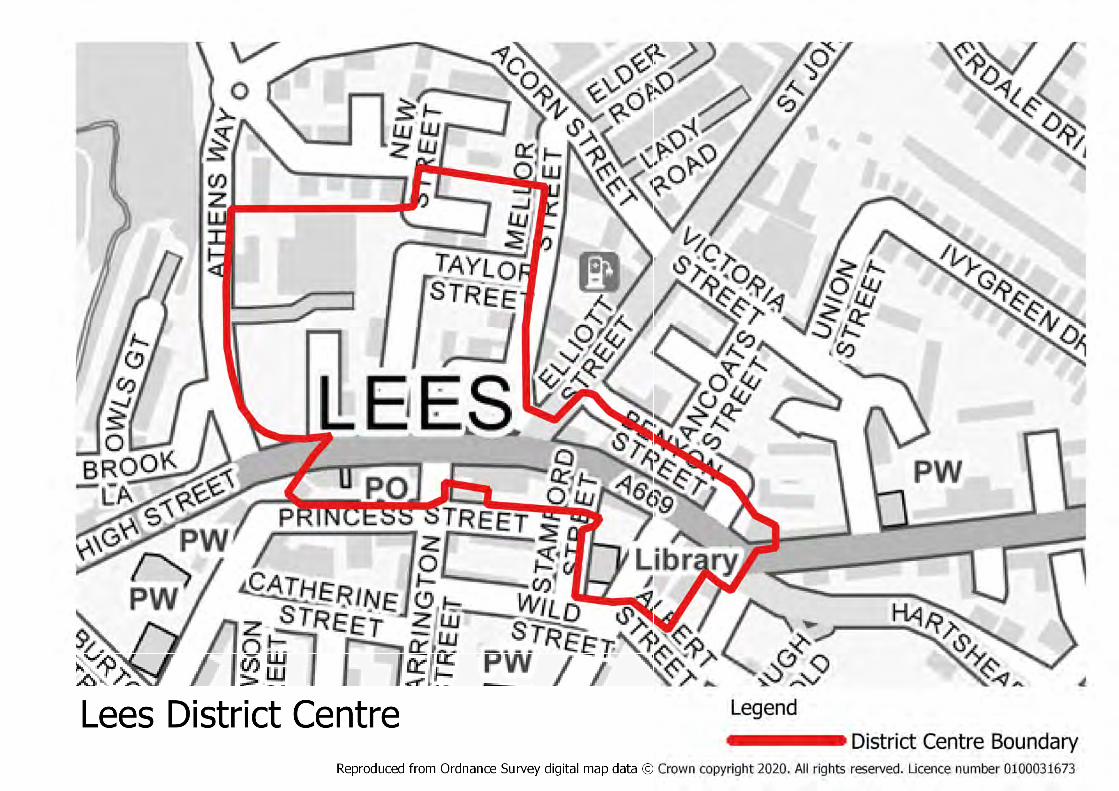
1.2.8 Lees is also currently performing well. There are only five vacant units within the centre, and it is easily accessible by car whilst pedestrian footfall was high when surveyed. Lees is an attractive centre with low reported crimes. There are no national multiple retailers within the centre, and parking provision is limited, but that is not unusual for this size of centre.
Hill Stores District Centre
1.2.9 Hill Stores is reasonably healthy and is performing as expected for a small district centre. The centre is dominated by a Tesco Extra superstore, which draws trade from residents across a wide area. Hill Stores is accessible by car and tram and crime rates in and around the centre are low.
1.2.10 Hill Stores would be vulnerable if Tesco was to leave the centre. The centre has a high number of takeaways, which draws visitors to the centre but does not necessarily lead to linked trips to retail facilities with other businesses in Hill Stores. The physical environment could be improved by providing more pedestrian crossing points along the A62.
Chadderton District Centre
1.2.11 Chadderton is a small centre anchored by Asda, which is centred around Chadderton Precinct and is reasonably healthy. There are just three vacant units within the centre and Chadderton contains a high proportion of national multiple operators relative to its size. Parking is plentiful in the centre.
Failsworth District Centre
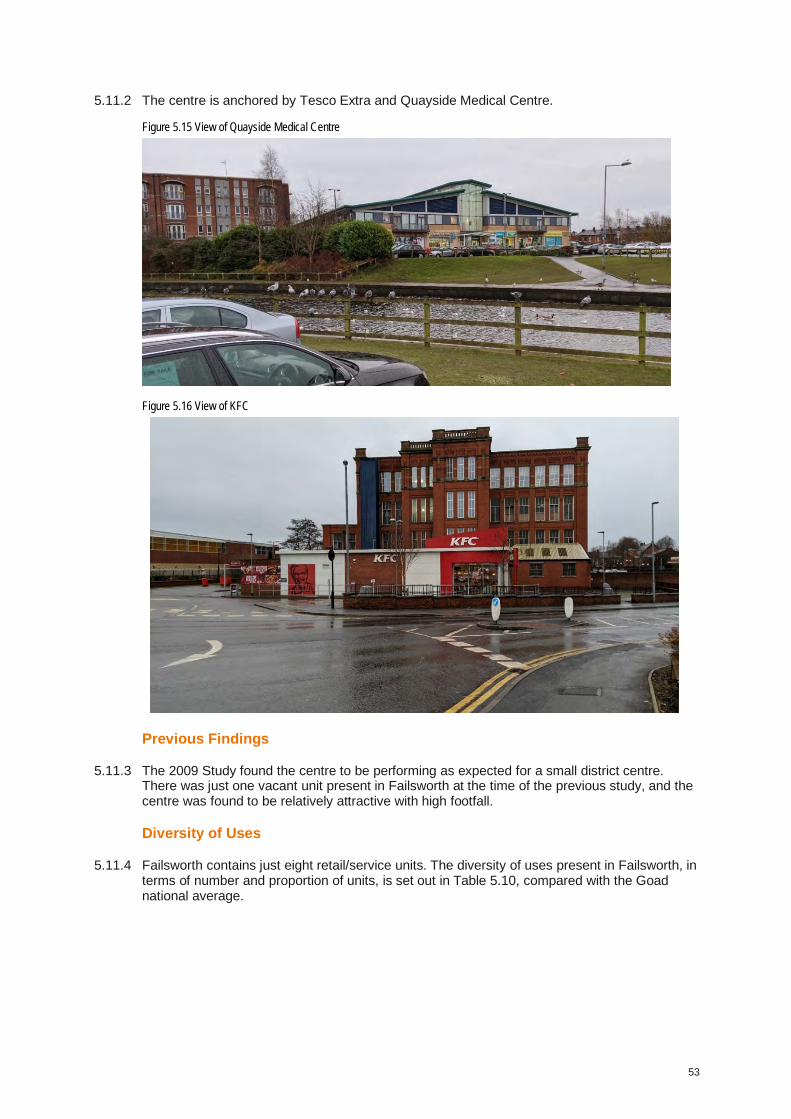
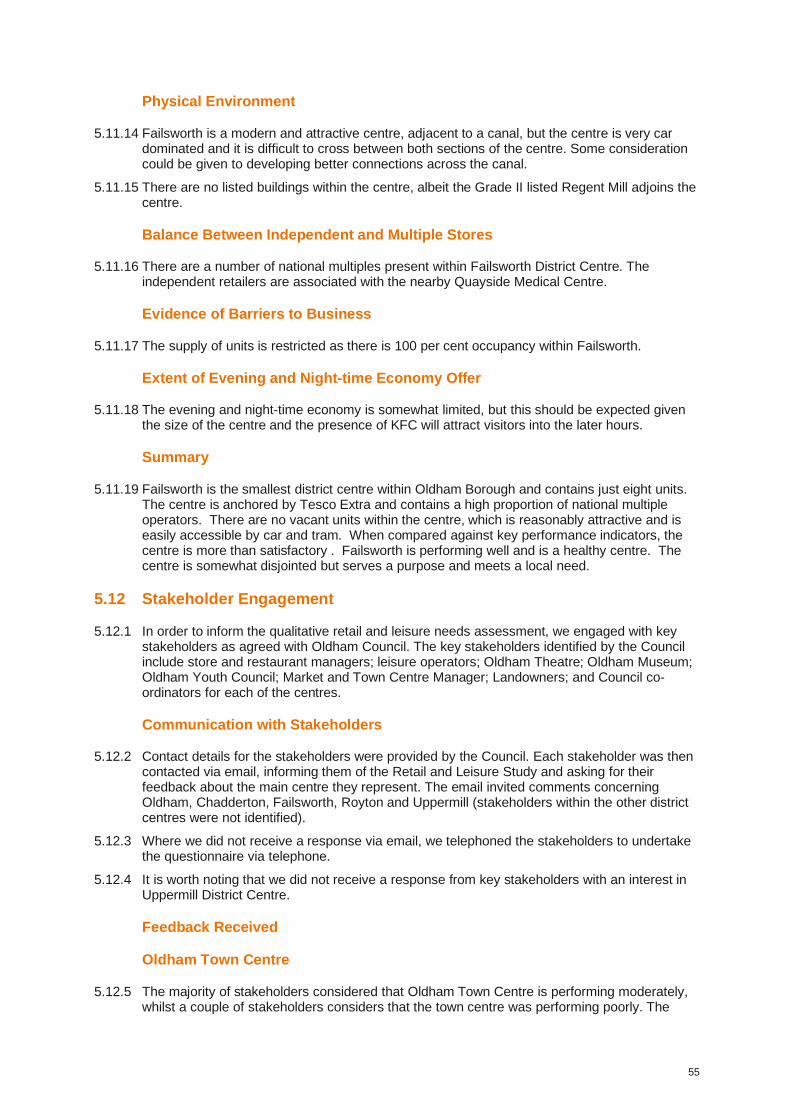
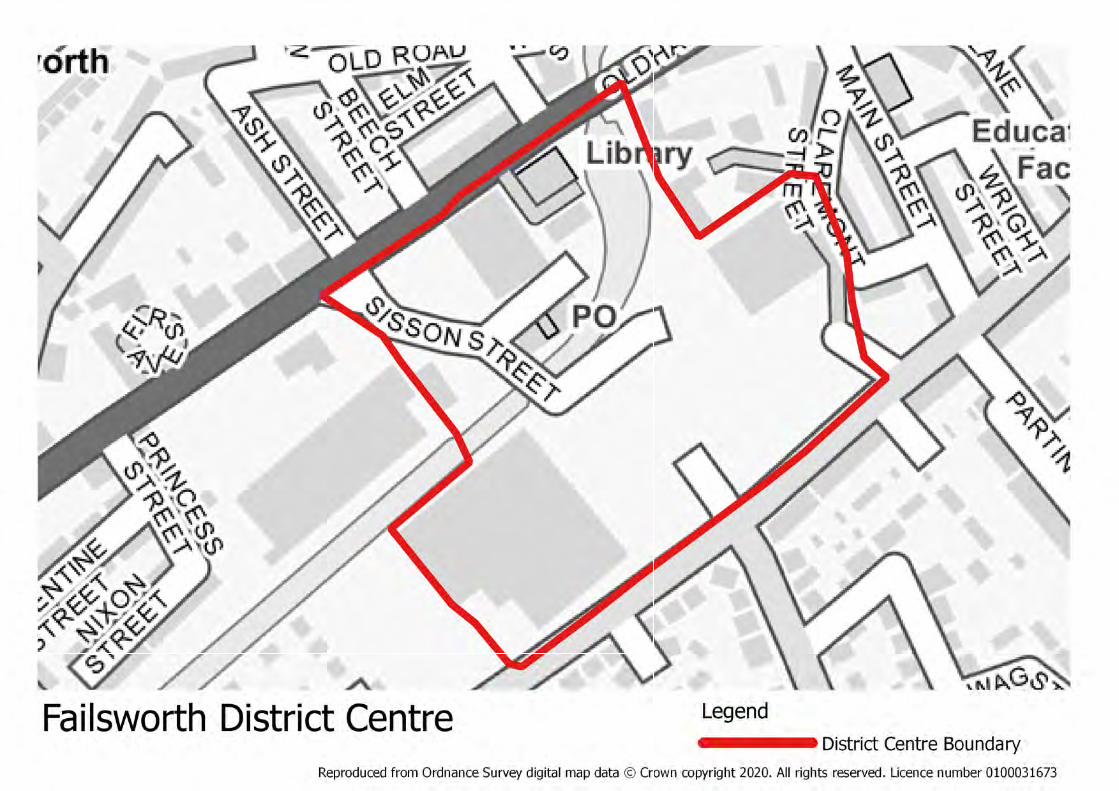
1.2.12 Failsworth is the smallest district centre within Oldham Borough and contains just eight units. The centre is anchored by Tesco Extra and contains a high proportion of national multiple operators. There are no vacant units within the centre. The centre is reasonably attractive and is easily accessible by car and tram. Failsworth is performing well and is a healthy centre.
1.3 Assessment of Retail Needs
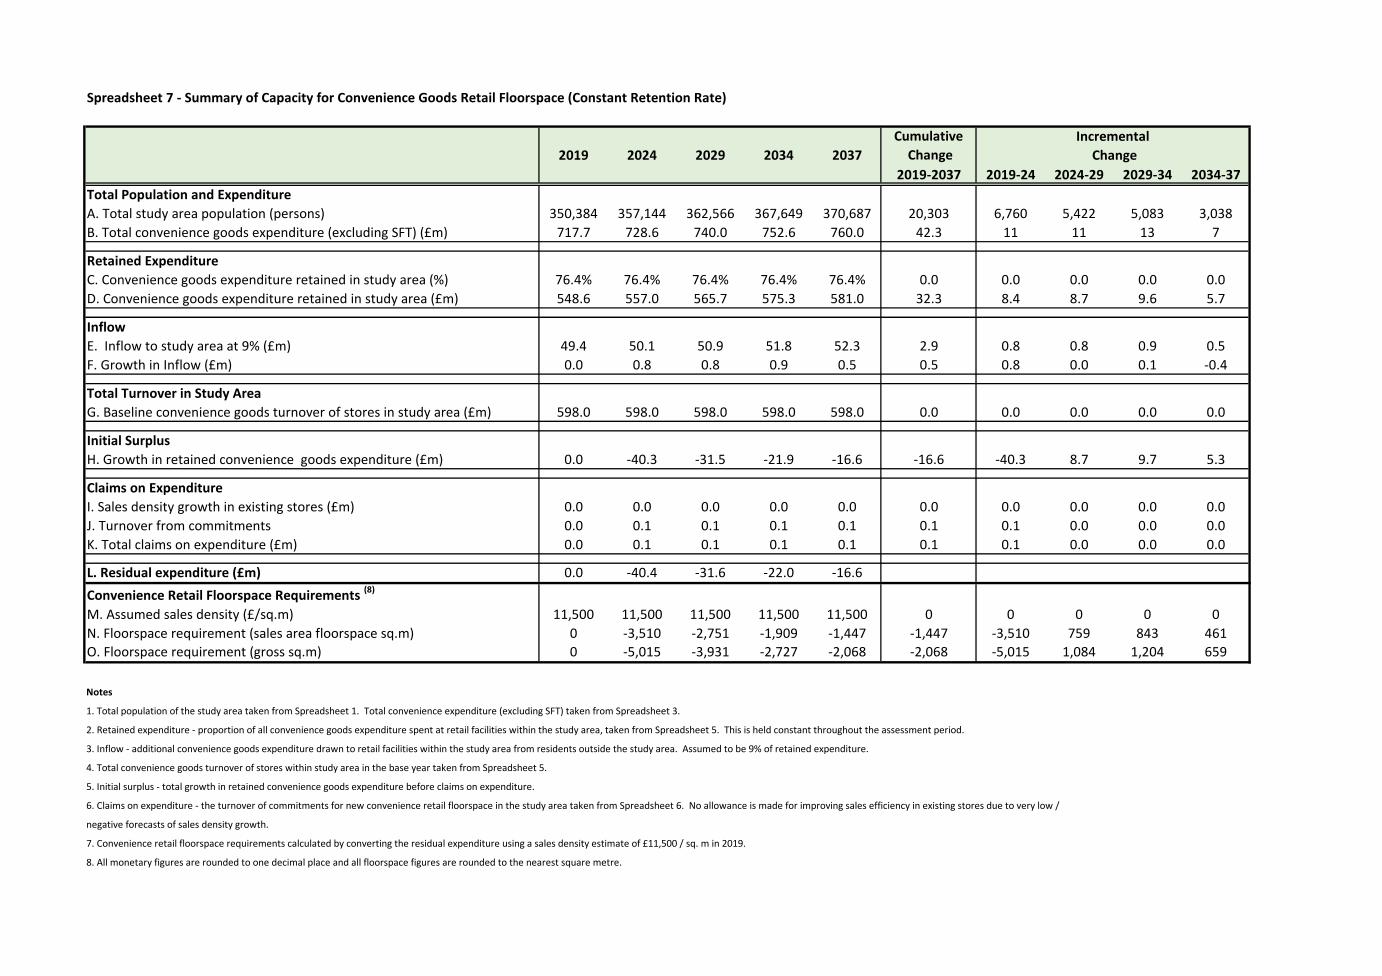
1.3.1 There is no need for additional convenience (food) retail floorspace over the study period. However, this does not mean that the Council will not receive applications for new foodstores – such proposals may seek to divert trade from existing foodstores.
1.3.2 There is a maximum requirement for an additional 2,381 sq.m of comparison (non-food) retail sales area floorspace over the study period, which is a relatively modest requirement. We consider that the majority of this floorspace should be located within Oldham Town Centre, to retain its current market share and to diversify its comparison retail offer. Should any comparison retail commitments also fail to come forward over the period, any additional floorspace requirement arising should also be concentrated in Oldham Town Centre, rather than the district centres, which perform more localised functions.
1.4 Commercial Leisure Needs
1.4.1 We have considered the growth in expenditure available to residents of the study area in all main sub-sectors of the leisure market. We have found that some additional expenditure is likely to be available to support leisure development within the Borough’s main centres in the period to 2037. In monetary terms, growth in expenditure would be greatest in the food and beverage sub-sector and the cultural services sub-sector.
1.4.2 Given the dominance of the former in terms of overall spending on leisure services, we have undertaken a more detailed assessment of expenditure capacity taking account of existing
3
market shares. Our assessment has shown that additional expenditure of up to approximately £8.1 million would be available to support new food and beverage facilities in the period to 2037, on the basis of a constant retention rate. We therefore consider there to be potential (on a quantitative need basis) to further strengthen the existing food and beverage provision in Oldham Town Centre.
1.5 Recommendations
Oldham Town Centre
1.5.1 Oldham currently has a mixed performance, and the health of the town centre has deteriorated, affected by the global financial crisis and restructuring in the retail industry. The centre would benefit from more uses other than retail and the commercial leisure offer could be improved. The proportion of vacant units and floorspace in the town centre is far too high and close to double the national average. We therefore make the following recommendations in terms of Oldham Town Centre:
Whilst the capacity for comparison retail floorspace is relatively insignificant and long-term only, the town centre should be expected to accommodate the majority of the comparison retail floorspace requirements over the study period. Some of this can be taken up by recycling or redeveloping vacant units.
The foodstore market within the town centre is under-provided for on a qualitative need basis. Whilst Iceland and Heron Foods are present, there is lack of competition for the Sainsbury’s foodstore within the town centre. The nearest discount foodstore is the Lidl foodstore in Royton, located 2.5km north of Oldham Town Centre. The town centre could benefit from more convenience stores, potentially as part of residential-led mixed-use development.
Spindles Town Square Shopping Centre appears to be performing well (although does contain some vacancies) and contains many familiar national multiple retailers. As a key part of retailing within the town centre, we recommend that the Council should monitor the health of the shopping centre in the medium to long term.
Opportunities should be sought to improve the leisure offer within Oldham Town Centre, particularly in terms of food and beverage uses, which would help improve its evening economy.
Investment in cultural and entertainment facilities should also be encouraged to diversify the town centre offer and strengthen the evening economy.
The Prince’s Gateway mixed-use development will deliver a foodstore, hotel, parking and smaller retail units within a key town centre site opposite the Metrolink tramline. We understand that there are also plans for office and residential development at other nearby sites. Further development opportunities should be identified in this area and on the edges of the town centre to accommodate higher density mixed use development, including residential and employment uses.
It is important that the Council focuses on integrating the developments at Prince’s Gateway with the traditional town centre. This could be achieved by providing active frontages along linking streets.
To be successful, areas of the Oldham Town Centre that are struggling should be considered for uses other than large retail units occupied by national multiples, which are unlikely to return to the town centre. Successful high streets need to have a mix of independent shops, markets, well-known retail chains, leisure & entertainment, community facilities and key services.
We recommend that a tightly drawn primary shopping area should be defined for the town centre. This should help focus retail development in the primary shopping area and other new development within the town centre boundary, whilst assisting with re-developing vacant units, the proportion of which, is far too high currently.
4
District Centres
1.5.2 The Council should seek to ensure that the district centres continue to provide day-to-day retail and service facilities to its residents, whilst supporting independent operators through a difficult period in the town centre and retail sector (where possible). If retailers leave the district centres, particularly national multiples, they are unlikely to be replaced with other retailers (particularly in terms of national multiples), meaning the offer in the district centres will likely need to be diversified.
1
2 Introduction 2.1.1 Stantec was instructed by Oldham Council (‘the Council’) in October 2019 to undertake a
Borough-wide retail and leisure study (R&LS).
2.1.2 The previous Oldham Retail and Leisure Study was published in June 2009 and no updates have been carried out in the intervening period. Since the last study was published, national policy for retail and town centres has been amended following the publication of the National Planning Policy Framework (‘the NPPF’) in March 2012, and subsequent updates to the NPPF.
2.1.3 The Borough-wide R&LS has been commissioned as a key evidence base document to inform the review of the Local Plan. The report provides an assessment of retail and leisure needs in order to inform new retail and town centre policies for the Borough. The study’s specific terms of reference are set out below:
review of the existing retail and leisure offer in the Borough;
undertake a retail capacity assessment and health checks of Oldham Town Centre and the Borough’s seven district centres;
define a hierarchy and network of centres;
review and amend as appropriate the boundaries of the town centres and the extent of their primary shopping areas and other areas; and
provide recommendations and advice on future town centre planning policy in the Borough.
2.1.4 Responding to these terms of reference, the report is structured as follows:
Section 3 sets out the planning policy context;
Section 4 describes key trends in the retail and leisure sector;
Section 5 sets out the strategic context and existing role and function of the various study centres;
Section 6 describes the shopping patterns of the Borough’s residents, based on evidence from a telephone survey of households;
Section 7 assesses the quantitative need for additional retail floorspace in the convenience (food) and comparison (non-food) sectors;
Section 8 assesses the quantitative need for additional floorspace for commercial leisure uses; and
Section 9 sets out our recommendations and conclusions.
2
3 Planning Policy Context 3.1 National Planning Policy Framework
3.1.1 The National Planning Policy Framework (‘NPPF’) sets out the Government’s planning policies for England and how they should be applied. It provides a framework within which locally prepared plans for housing and other development can be produced.
3.1.2 Planning law requires that applications for planning permission be determined in accordance with the development plan, unless material considerations indicate otherwise. The NPPF must be taken into account in preparing the development plan and is a material consideration in planning decisions. Planning policies and decisions must also reflect relevant international obligations and statutory requirements.
3.1.3 The original Framework was published by the (then-named) Department for Communities and Local Government on 27 March 2012. The NPPF has been revised on multiple occasions and the latest updated Framework was published in February 2019.
Plan Making
3.1.4 Paragraphs 15-16 of the NPPF state that the planning system should be genuinely plan-led. Succinct and up-to-date plans should provide a positive vision for the future of each area; a framework for addressing housing needs and other economic, social and environmental priorities; and a platform for local people to shape their surroundings. Plans should:
a. be prepared with the objective of contributing to the achievement of sustainable development;
b. be prepared positively, in a way that is aspirational but deliverable;
c. be shaped by early, proportionate and effective engagement between plan-makers and communities, local organisations, businesses, infrastructure providers and operators and statutory consultees;
d. contain policies that are clearly written and unambiguous, so it is evident how a decision maker should react to development proposals;
e. be accessible through the use of digital tools to assist public involvement and policy presentation; and
f. serve a clear purpose, avoiding unnecessary duplication of policies that apply to a particular area (including policies in the NPPF, where relevant).
3.1.5 Paragraph 31 of the NPPF states that the preparation and review of all policies should be underpinned by relevant and up-to-date evidence. This should be adequate and proportionate, focused tightly on supporting and justifying the policies concerned and take into account relevant market signals.
3.1.6 Paragraph 33 of the NPPF states that policies in local plans and spatial development strategies should be reviewed to assess whether they need updating at least once every five years and should then be updated as necessary. Reviews should be completed no later than five years from the adoption date of a plan and should take into account changing circumstances affecting the area, or any relevant changes in national policy.
Building a Strong, Competitive Economy
3.1.7 Paragraphs 80-81 of the NPPF state that planning policies and decisions should help create the conditions in which businesses can invest, expand and adapt. Significant weight should be placed on the need to support economic growth and productivity, taking into account both local business needs and wider opportunities for development. The approach taken should allow each area to build on its strengths, counter any weaknesses and address the challenges of the future. This is particularly important where Britain can be a global leader in driving
3
innovation and in areas with high levels of productivity, which should be able to capitalise on their performance and potential.
3.1.8 Planning policies should:
a. set out a clear economic vision and strategy which positively and proactively encourages sustainable economic growth, having regard to local policies for economic development and regeneration;
b. set criteria, or identify strategic sites, for local and inward investment to match the strategy and to meet anticipated needs over the plan period;
c. seek to address potential barriers to investment; and
d. be flexible enough to accommodate needs not anticipated in the plan, allow for new and flexible working practices and to enable a rapid response to changes in economic circumstances.
Ensuring the Vitality of Town Centres
3.1.9 Paragraph 85 of the NPPF sets out that planning policies and decisions should support the role that town centres play at the heart of local communities, by taking a positive approach to their growth, management and adaptation. Planning policies should:
a. define a network and hierarchy of town centres and promote their long-term vitality and viability – by allowing them to grow and diversify in a way that can respond to rapid changes in the retail and leisure industries, allows a suitable mix of uses (including housing) and reflects their distinctive characters;
b. define the extent of town centres and primary shopping areas, and make clear the range of uses permitted in such locations, as part of a positive strategy for the future of each centre;
c. retain and enhance existing markets and, where appropriate, re-introduce or create new ones;
d. allocate a range of suitable sites in town centres to meet the scale and type of development likely to be needed, looking at least ten years ahead. Meeting anticipated needs for retail, leisure, office and other main town centre uses over this period should not be compromised by limited site availability, so town centre boundaries should be kept under review where necessary;
e. where suitable and viable town centre sites are not available for main town centre uses, allocate appropriate edge of centre sites that are well connected to the town centre. If sufficient edge of centre sites cannot be identified, policies should explain how identified needs can be met in other accessible locations that are well connected to the town centre; and
f. recognise that residential development often plays an important role in ensuring the vitality of centres and encourage residential development on appropriate sites.
3.1.10 Paragraph 86 of the NPPF states that local planning authorities should apply a sequential test to planning applications for main town centre uses which are neither in an existing centre nor in accordance with an up-to-date plan. Main town centre uses should be located in town centres, then in edge of centre locations, and only if suitable sites are not available (or expected to become available within a reasonable period) should out of centre sites be considered.
3.1.11 Paragraph 87 of the NPPF states that when considering edge-of-centre and out-of-centre proposals, preference should be given to accessible sites which are well connected to the town centre. Applicants and local planning authorities should demonstrate flexibility on issues such as format and scale, so that opportunities to utilise suitable town centre or edge-of-centre sites are fully explored.
3.1.12 Paragraph 89 of the NPPF states that when assessing applications for retail and leisure development outside town centres, which are not in accordance with an up-to-date plan, local planning authorities should require an impact assessment if the development is over a
4
proportionate, locally set floorspace threshold (if there is no locally set threshold, the default threshold is 2,500 sq.m of gross floorspace). This should include assessment of:
a. the impact of the proposal on existing, committed and planned public and private investment in a centre or centres in the catchment area of the proposal; and
b. the impact of the proposal on town centre vitality and viability, including local consumer choice and trade in the town centre and the wider retail catchment (as applicable to the scale and nature of the scheme).
3.1.13 Paragraph 90 of the NPPF states that where an application fails to satisfy the sequential test or is likely to have significant adverse impact on one or more of the considerations in paragraph 89, it should be refused.
Planning Practice Guidance
3.1.14 The Planning Practice Guidance (‘PPG’) provides guidance on planning for retail and other town centre uses.
3.1.15 The original PPG was published by the (then-named) Department for Communities and Local Government on 3 March 2014. The PPG on ‘Town Centres and Retail’, which was last updated in July 2019, provides guidance on:
a. planning for town centre vitality and viability;
b. permitted development and change of use in town centres; and
c. assessing proposals for out-of-centre development.
3.2 Local Planning Policy
3.2.1 Work is now underway on a review of the Local Plan and, as part of this, the Council’s retail evidence base needs to be updated. New retail capacity forecasts are required, accounting for the latest trends in home / online shopping and recent changes in the composition of uses within town centres.
3.2.2 The current statutory development plan comprises the Joint Core Strategy and Development Management Policies Document, adopted in November 2011, and Saved Policies in the Unitary Development Plan, adopted in July 2006.
Joint Core Strategy and Development Management Policies Document
3.2.3 Policy 15 Centres states that Oldham Town Centre and the centres of Chadderton, Failsworth, Hill Stores, Lees, Royton, Shaw and Uppermill make significant contributions to the Borough and act as focal points for its commercial, shopping, social, civic, community and cultural activities. Policy 15 states that the Oldham Retail and Leisure Study 2009 (‘2009 Study’) concluded that Oldham Town Centre should be the main location for major retail and leisure development, with the focus being on the ‘Central Shopping Core’ (the town centre’s primary shopping area). Oldham Town Centre should at least maintain, and if possible enhance, its existing role by improving the quality as well as the quantity of its retail offer. There is a need to improve the commercial leisure offer of the town centre. The Borough’s retail hierarchy is defined as:
Oldham Town Centre.
The centres of Chadderton, Failsworth, Hill Stores, Lees, Royton, Shaw and Uppermill.
Local shopping parades.
3.2.4 Policy 15 states that forecasting indicates that the Borough may require additional retail floorspace during the plan period and that the selection of development sites will have regard to a sequential approach.
3.2.5 Policy 16 Local Services and Facilities states that locally available services contribute towards vibrant communities by providing convenient facilities and that the Council will ensure the need for local shops, leisure facilities and offices are met by protecting existing premises
5
and permitting new local services and facilities where appropriate. Policy 16 states that the following uses will be permitted outside the defined town and district centres provided they satisfy the requirements of national and local policies:
1. Local shops with a gross floorspace of 500 sq.m or less. 2. Leisure facilities with a gross floorspace of 1,000 sq.m or less.
Saved Policies in the Unitary Development Plan
3.2.6 Policy B1.3 M1 Frenches Wharf / Wellington Road, Greenfield, Saddleworth states that the mix of uses permitted at the site is business and industry (B1 and / or B2), tourism, residential (C3) and retail uses only in accordance with relevant policies in the Retail and Leisure Development Chapter.
3.2.7 Policy B1.3 M4 Huddersfield Road / Dunkerley Street, Oldham states that this is a comprehensive redevelopment site with opportunities for new build and the refurbishment of the Grade II listed Hill Stores. The mix of uses permitted are office, retail, residential and other uses that accord with Policy S1.6 on the Retail and Leisure Development Chapter.
3.2.8 Policy TC1.1 Allocated Sites states that a site at Clegg Street, comprising the former bus station and the listed former Town Hall building, is allocated on the Proposals Map for retail and / or a range of other appropriate town centre uses.
3.2.9 Policy TC1.2 Allocated Sites states that a site at Union Street is allocated on the Proposals Map for a new cultural quarter to comprise a new life-long learning centre, art gallery, museum and theatre together with appropriate complementary uses which may include retail, food and drink, offices, workshops, residential and car parking.
3.3 Policy Response
3.3.1 In recent years, a considerable number of studies have been published assessing the future role and function of town centres in order to respond to the market trends discussed above, including:
The Portas Review, Mary Portas (2011)
The Grimsey Review, Bill Grimsey (2013)
Beyond Retail: Redefining the Shape and Purpose of Town Centres, British Council of Shopping Centres (2013)
21st Century High Streets, British Retail Consortium (2013)
The Future High Street, Future Spaces Foundation (2013)
Accommodating Growth in Town Centres (2014), Greater London Authority
Digital High Street 2020 Report, Digital High Street Advisory Board (2015)
Grimsey Review 2: “It’s time to reshape our town centres” (2018)
The Future High Streets Fund (2019)
Towns Fund (2019)
High Streets Heritage Action Zones (2019)
3.3.2 There have also been a number of local interventions by Oldham Council and Greater Manchester Combined Authority to address the future role of the town centre, including:
Creating a Better Place Agenda (Oldham) (2020)
Oldham Town Centre Framework (2019)
Greater Manchester Combined Authority Town Centre Challenge (2018)
6
The Portas Review
3.3.3 In May 2011, retail expert Mary Portas was appointed by the former Coalition Government to lead an independent review into the future of the high street in response to the decline of town centres nationally, seen as a consequence of reduced spending on the high street. The report supported the call to strengthen planning policy in favour of ‘town centre first’ and included 27 separate recommendations to tackle the further decline of the high street.
3.3.4 The core recommendations included measures to strengthen the management of high streets, improvements to the business rates system, reducing car parking charges, placing greater onus on landlords to proactively manage their assets or face the use of compulsory purchase powers by local authorities, and to increase community involvement in town centres.
3.3.5 As well as 24 ‘Portas Pilot’ towns to trial the recommendations, the Coalition Government established the future High Street Forum to implement Portas’ recommendations and provided funding to establish business improvement districts (BIDs) and a ‘Future High Street X Fund’ (renamed the High Street Renewal Fund) to reward towns delivering innovative plans to promote their town centres.
The Grimsey Review and The Grimsey Review 2
3.3.6 Bill Grimsey, the former managing director of DIY chain Wickes and food retailer Iceland, published his report as an ‘alternative response’ to the recommendations of the Portas Review. The report made a total of 31 wide-ranging recommendations, including encouraging more people to live in town centres, appointing a High Streets Minister, and freezing car parking charges for a year.
3.3.7 Grimsey followed up his original report with a review that was published in July 2018, which is particularly influenced by the recent high-profile collapse of retailers and some food and drink operators. Grimsey asserts that town centres are facing their greatest challenge in history. Towns must stop trying to compete with out-of-town shopping parks that are convenient and benefit from free parking. Instead, Grimsey argues that town centres must create their own unique reason for communities to gather there – being interesting and engaging and altogether a compelling and great experience.
3.3.8 Whilst it is not appropriate to have a one-size-fits-all approach, Grimsey sets out 25 recommendations to tackle the problems identified. Key recommendations include:
Replacement of business rates with a fairer and less complex system;
Creation of a digital commission to develop a 20-year strategy for local high streets;
Accelerating the digital transformation of smaller towns;
Appointment of high-quality designers to celebrate the local identify of town centres;
Free short-term parking; and
Improved public realm and free wifi.
Beyond Retail
3.3.9 Following the Portas Review, the Government supported the establishment of an industry task force to analyse retail property issues relating to town centres. The findings of the task force’s report were presented in the ‘Beyond Retail’ report of 2013.
3.3.10 One of the report’s key observations was that the trend towards market polarisation (discussed further below) has resulted in three broad types of town centre offer: strong centres with a wide retail and leisure offer; convenience food and service-based centres with an element of fashion and comparison goods; and localised convenience and everyday needs-focused centres. The report made a number of recommendations, including:
Strong and dynamic leadership, led at the local authority level also including business and community involvement, to bring about long-term change in town centre function.
7
Undertake bold, strategic land assembly, to assemble redevelopment opportunities of scale and worth.
Provide greater flexibility in the planning system to enable vacant retail premises to be converted to ‘more economically productive uses’.
Consider the mechanisms to address funding gaps to encourage local authorities to commit to long-term planning for town centres.
Town centres must take advantage of technology to assist in marketing, driving footfall, and assisting independents and SMEs.
A review of the business rate system and publishing of new retail valuation guidance.
21st Century High Streets
3.3.11 In 2013, the British Retail Consortium published the second ‘21st Century High Streets’ report as an update to the original report published in 2009. The 2013 report set out various policy recommendations to help secure ‘flourishing 21st Century high streets’ under six key topics:
A unique sense of place: local partnerships, authorities and retailers must create a brand for the town centre to engender consumer loyalty through differentiation.
An attractive public realm: local partnerships and authorities must actively manage the public realm creating attractive public space.
Planning for success: local authorities should develop a clear strategic vision focused on the role of the town centre and cooperate with neighbouring authorities to maintain viable and complimentary retail destinations.
Accessibility: local authorities should manage accessibility holistically and responsively and should provide adequate parking to assist in driving footfall.
Safety and security: local police should work with retailers to better understand the impacts of retail crime to promote town centres as safe, secure and effectively managed.
Supportive regulatory and fiscal regimes: central government should reform the Business Rate Multiplier to reduce the cost of operating and investing in town centres.
The Future High Street
3.3.12 The Future Spaces Foundation was established in 2013, made up of a diverse independent panel of experts to generate new ideas about how to create social and economic opportunity through the transformation of the built environment.
3.3.13 The Future High Street report (2013) sought to examine the high street debate from a holistic stance; it assesses the full range of socio-economic, demographic and technological factors which affect how we interact with high streets and seeks to challenge the traditional role of retail in town centre regeneration. The report made 14 specific recommendations under four key policy areas relating to public services and community cohesion, commercial drivers, transport and accessibility and health and well-being. The recommendations included:
re-concentrating public services in and around the high street to harness agglomeration benefits;
diversifying community spaces beyond their traditional functions;
supporting a mobile-enabled high street;
flexible use of space to mix retail, leisure and work dynamically to suit modern lifestyles;
de-stigmatising bus travel, so that it provides a superior alternative to the car;
transport infrastructure design with multiple uses to give it a fluid role in the town centre;
providing housing, particularly assisted living, within easy access of high streets; and
providing health services in close proximity to the high street and plan high streets to promote good.
8
Digital High Street
3.3.14 The Digital High Street Advisory Board was established following the work of the Future High Streets Forum to consider the revolutionary impact of digital technologies on future success of high streets. The Advisory Board’s report of 2015 made four principal inter-related recommendations, which sought to revitalise high streets in a digitally dominated world. These include raising connectivity standards and increasing the deployment of digital technology, improving digital skills, and adopting a digital health index to assess the competitiveness of high streets, to measure the economic value of digital developments and set goals for digital integration.
The Future High Streets Fund
3.3.15 In July 2019, the Secretary of State for Housing, Communities and Local Government asked Sir John Timpson to consider structural changes on high streets and make recommendations how to support local areas to respond to these changes. In the run-up to the Budget, he made two main recommendations to the Chancellor and the Secretary of State: to set up a High Streets Taskforce to support local leadership and to establish a new fund to support the renewal and reshaping of high streets and town centres.
3.3.16 The Chancellor and the Secretary of State agreed with Sir John’s diagnosis and recommendations. Therefore, to respond, a new £1 billion Future High Streets Fund (‘FHSF’) was set up to help local areas to respond to and adapt to these changes. The FHSF will support local authorities to prepare long-term strategies for their high streets and town centres, including funding a new High Streets Taskforce to provide expertise and hands-on support to local areas.
3.3.17 The Government has asked local authorities to provide proposals setting out the overall vision that they wish to achieve for their high street and town or city centre and specific, transformational interventions that would contribute to that overall vision.
Towns Fund
3.3.18 In September 2019, the government invited 100 places to develop proposals for a Town Deal, as part of the £3.6 billion Towns Fund, including the £1 billion fund designated as part of the FHSF.
3.3.19 Stage 1 is providing capacity support to places to put the structures and vision in place in order to move to the next stage of agreeing a deal.
3.3.20 Stage 2 is for places to use their locally-owned Town Investment Plan to put together a business case to apply for funding for interventions.
3.3.21 The Towns Fund will provide the core public investment in Town Deals – additional funding may come from other sources or parts of government. The objective of the Fund is to drive the economic regeneration of towns to deliver long term economic and productivity growth through urban regeneration, planning and land use; skills and enterprise infrastructure; and connectivity.
High Streets Heritage Action Zones
3.3.22 In May 2019, Historic England launched a multi-million pound fund which allows Historic England to work with partners to find new ways to champion and revive historic high streets through the High Streets Heritage Action Zones scheme. 68 high streets across England have currently been selected to receive a share of the £95m fund. These projects are currently being progressed to the next stage of development and will help to revive their high streets. 14 high streets have been selected in the north west region including Bacup, Barrow-in-Furness, Blackpool, Burnley, Chester, Fleetwood, Kirkham, Lancaster, Maryport, Ormskirk, Prescot, Stalybridge, Tyldesley and Wigan.
9
Creating a Better Place Agenda
3.3.23 Through the Creating a Better Place Agenda, Oldham Council aims to provide a diverse housing offer that meets the needs of different sections of the population, with a specific focus on quality of housing and the impacts this has on quality of life.
3.3.24 The Creating a Better Place Agenda builds on several strategic documents produced over the previous 18 months, namely the revised Town Centre Framework, the Housing Strategy and a review of the Medium Term Property Strategy. The Creating a Better Place Agenda concentrates on three areas, Housing, Regeneration and Corporate Estate.
3.3.25 Oldham Council have recognised that the purpose of town centres is changing at scale and pace, this is reflected within the new vision for Oldham town centre. The Council’s vision is to strengthen the town centre as a cultural destination while bringing new homes, jobs and business opportunities.
3.3.26 Oldham Council is also committed to holistically reviewing land and property assets owned by the Council and within the ownership of One Public Estate partners, to ensure the Council:
delivers against ambitions for energy efficiency;
delivers against ambitions for public buildings to be carbon neutral by 2025;
ensures scrutiny of its own accommodation to ensure value for money and best utilisation for staff and services; and,
considers the views of Ward Members/Portfolio holders are considered as part of any proposal to declare an asset within the Council’s Land and Property Portfolio as being surplus to the Council’s operational requirement.
3.3.27 The Creating a Better Place Agenda aims to deliver social, economic and environmental benefits, including the potential to deliver around 2,000 new homes in the town centre, 1,000 new jobs and 100 new opportunities for apprenticeships. The agenda also supports the Council’s Green New Deal and would enable the public sector to be zero carbon by 2025.
Oldham Town Centre Framework
The Oldham Town Centre Framework is defined as ‘Our Town Centre: a place that thrives’ by:
building quality homes;
providing opportunities to learn, develop new skills and gain employment;
having a diverse culture, leisure and night time economy;
attracting, retaining and growing businesses;
ensuring a safer, healthier and friendly environment; and
ensuring it is green, clean and sustainable.
The vision for the town centre is that it will play an active part in delivering a around 2,000 new homes that will support Oldham in meeting its local housing need. It will also support the ability to bring forward brownfield sites, to enhance the critical mass of people living and working in the town centre and in turn promoting its vitality.
Greater Manchester Combined Authority Town Centre Challenge
3.3.28 In 2018, Greater Manchester Combined Authority launched the Town Centre Challenge and welcomed each of the 10 local authorities within Greater Manchester to nominate a town centre to take part in the initiative.
3.3.29 The Mayor aims to work with each of the councils to bring together housing providers, public and private landowners, developers, community groups and other key stakeholders. The initiative is supported by Mayoral powers to establish Mayoral Development Corporations, the use of Compulsory Purchase Orders and Mayoral grants to kick-start development.
10
3.3.30 Oldham Council has nominated Royton district centre. The Council has outlined their ambition for Royton, including new quality homes; a renovated town hall and library; new and improved footpath and cycling routes; better street lighting; and, investment in Market Square.
3.4 Implications for Oldham Borough
3.4.1 The research and initiatives summarised above contain a number of recurring themes which will be important to consider in the context of future development for main town centre uses within Oldham Borough, including:
The need for flexibility – town centre accommodation needs to be adaptable to a number of uses to address future needs. This presents both opportunities and challenges for Oldham Borough’s defined centres. The previous orthodoxy of protecting A1 retail uses within Primary Shopping Areas may unwittingly be restricting the ability of town centres to diversify and develop distinctive identities and associated offer to consumers.
Vital and viable centres need a varied mix of uses – town centres are increasingly diverse with the emergence of a greater proportion of leisure, food and drink uses. There is also an identified need to concentrate multi-functional public services in town centre locations to realise agglomeration benefits (as per ‘The Future High Street’ report). However, town centres face rapidly increasing competition from retail parks and higher order centres as well as online shopping.
The integration of commercial and residential uses within town centres is important to their overall vibrancy, to encourage footfall within centres throughout the day. This includes access to high quality public transport, with the ‘Future High Street’ report specifically referring to improved bus and rail services.
The ‘Future High Streets Fund’ provides an opportunity for the Council to secure funding to improve the high streets within Oldham and the seven lower order centres and for the high streets to respond to, and adapt to, restructuring in the retail sector. Whilst the FHSF provides an opportunity for the Council to secure funding to improve the high streets of Oldham and the seven lower order centres, the Council has chosen to focus upon Oldham town centre exclusively to ensure maximum benefit is achieved.
The role of each defined centre needs to be clearly articulated to provide it with a distinct and recognisable identity appropriate to its role, as emphasised by the ‘21st Century High Streets’ report as well as the Portas Review and, more recently, the FHSF and the Towns Fund Prospectus. It will be important to identify the unique attributes of each defined centre during the production of the new Local Plan.
11
4 Market and Economic Trends 4.1 Market Trends
Introduction
4.1.1 There has been ongoing restructuring in the retail and commercial leisure market since the global financial crisis in 2009. Online sales have continued to rise, most retailers are building less retail floorspace, operators have found that less existing floorspace is required and existing floorspace is being converted into alternative uses. The COVID-19 global pandemic has accelerated and will accelerate these trends. High streets in the UK were forced to close in March 2020 and when they re-open, many retailers will not return, or will rationalise their store portfolio.
4.1.2 The need to maintain social distancing, at least in the short-term, means that custom will be reduced. Returning to pre-COVID-19 levels of vitality and viability will therefore be enormously challenging for town centres. Below, we grapple with the key trends of the last few years; we set out the main economic recovery scenarios; and we predict the likely implications of the COVID-19 pandemic.
Brexit
4.1.3 In 2019, the UK economy grew at its lowest rate in seven years, which was largely attributed to the uncertainty surrounding Brexit negotiations and a weaker global economy. The small growth in the UK economy was reflected in consumer spending which only increased by 1.2 per cent, the smallest increase in eight years1. Low consumer confidence and lacklustre income growth was blamed for the disappointing growth in consumer spending.
Retail Sales
4.1.4 The volume of retail sales only grew by three per cent in 2019, which was the lowest growth in retail sales since 2014. There was a marked slowdown in growth over the course of the year and this trend was particularly visible within the non-food retail sales market. Non-food retail sales saw growth of approximately four per cent at the beginning of the year but ended up in decline in year-on-year sales, by the end of the year. The non-food retail sector had not experienced a decline in sales volume since early 2012.
Store Closures
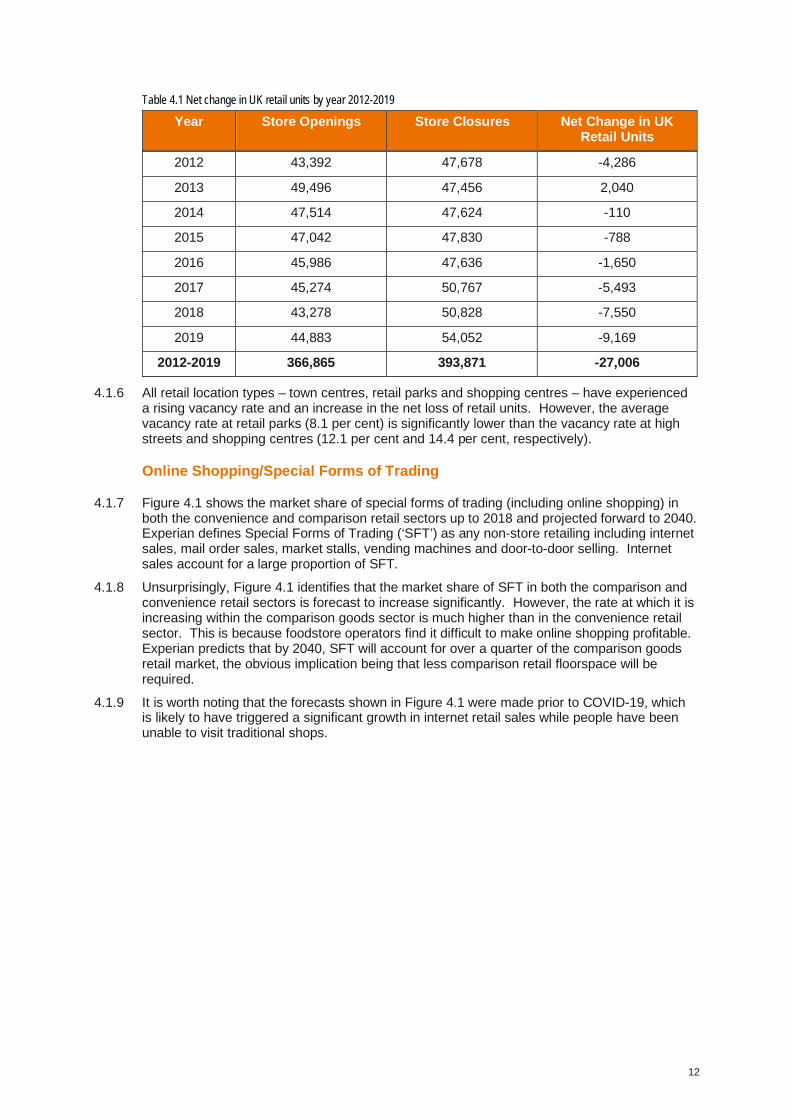
4.1.5 Table 4.1 below shows the net changes in the UK’s stock of retail units per year from 2012 to 2019. The net loss of retail units has been increasing each year since 2014, and by 2019 there was an annual net loss of 9,169 retail units across the UK2. Whilst 2019 was the first year since 2013 when the number of store openings was greater than the previous year, that was outweighed by the much larger increase in store closures. The 54,052 store closures in 2019 is some 13.4 per cent higher the corresponding number in 2012, and the net change in the UK’s stock of retail units over that seven-year period was minus 27,006.
1 Experian, Retail Planner Briefing Note 17, February 2020 2 Local Data Company, GB Retail and Leisure Market Analysis Full Year 2019
12
Table 4.1 Net change in UK retail units by year 2012-2019
Year Store Openings Store Closures Net Change in UK Retail Units
2012 43,392 47,678 -4,286
2013 49,496 47,456 2,040
2014 47,514 47,624 -110
2015 47,042 47,830 -788
2016 45,986 47,636 -1,650
2017 45,274 50,767 -5,493
2018 43,278 50,828 -7,550
2019 44,883 54,052 -9,169
2012-2019 366,865 393,871 -27,006
4.1.6 All retail location types – town centres, retail parks and shopping centres – have experienced a rising vacancy rate and an increase in the net loss of retail units. However, the average vacancy rate at retail parks (8.1 per cent) is significantly lower than the vacancy rate at high streets and shopping centres (12.1 per cent and 14.4 per cent, respectively).
Online Shopping/Special Forms of Trading
4.1.7 Figure 4.1 shows the market share of special forms of trading (including online shopping) in both the convenience and comparison retail sectors up to 2018 and projected forward to 2040. Experian defines Special Forms of Trading (‘SFT’) as any non-store retailing including internet sales, mail order sales, market stalls, vending machines and door-to-door selling. Internet sales account for a large proportion of SFT.
4.1.8 Unsurprisingly, Figure 4.1 identifies that the market share of SFT in both the comparison and convenience retail sectors is forecast to increase significantly. However, the rate at which it is increasing within the comparison goods sector is much higher than in the convenience retail sector. This is because foodstore operators find it difficult to make online shopping profitable. Experian predicts that by 2040, SFT will account for over a quarter of the comparison goods retail market, the obvious implication being that less comparison retail floorspace will be required.
4.1.9 It is worth noting that the forecasts shown in Figure 4.1 were made prior to COVID-19, which is likely to have triggered a significant growth in internet retail sales while people have been unable to visit traditional shops.
13
Figure 4.1 Actual and projected market share of non-store retail sales/Special Forms of Trading (Adjusted for SFT Sales from Stores)
4.1.10 Generally speaking, the performance of the high street retail sector has been weakening, and that was the case before the COVID-19 ‘lockdown’ was imposed. Where necessary, some consideration should be given to condensing and concentrating the retail offering in Oldham’s town centres. Consideration should also be given to introducing and expanding alternative uses, including small- to medium-scale residential and office uses, in appropriate parts of each town centre.
Retail Rents
4.1.11 In 2019, average prime retail rents for new deals has fallen by 7 per cent. The reduction in prime retail rents achieved differs across regions with Central London experiencing a decrease of just over 5 per cent and Wales experiencing a decrease of just under 13 per cent. This is the largest reduction in average achieved prime retail rents since 2008/2009, when UK-wide prime retail rents fell by 11 per cent3.
4.1.12 Only 6.1 per cent of prime retail floorspace is vacant whereas 15.1 per cent of secondary floorspace is vacant, as one would expect. A more worrying trend is that approximately a third of all vacant floorspace has been vacant for over two years.
4.2 Convenience Retail Sector
4.2.1 Prior to the 2009 global financial crisis several years ago, the convenience goods retail sector was a key driver of growth in the retail sector. The ‘big four’ foodstore operators (Asda, Morrisons, Tesco and Sainsbury’s), which have traditionally dominated the market, were building and operating increasingly larger stores and expanding the range of services that they provide (particularly in terms of comparison retail goods). Whilst many of these larger stores were built outside of town centres, new large foodstores also often served to anchor re-development schemes within smaller town centres.
4.2.2 However, since the global financial crisis, the market dominance of the ‘big four’ has been increasingly challenged, both by higher-end operators, such as Waitrose and Marks & Spencer (Simply Food and Foodhall formats), and value/discount retailers, primarily Aldi and Lidl. In particular, the value retailers have posted significant year-on-year growth over recent
years and they have emerged as important forces in the convenience goods retail sector. Expenditure on convenience retail goods had been falling in recent years due to increasing competition between operators (leading to a reduction in prices and low inflation).
4.2.3 Figure 4.2 below shows that whilst the ‘big four’ operators still account for two-thirds of the convenience retail market, their dominance is being challenged by Aldi, Co-op and Lidl in particular.
Figure 4.2 UK Grocery Market Share (22 March 2020)
Source: KANTAR
4.2.4 There has been an increasing move by the major convenience goods operators away from opening larger-format stores towards smaller supermarkets and establishing a network of ‘top up’ convenience goods shopping facilities. These smaller-format stores are often located in town centres, or district/neighbourhood shopping parades. The shift has been driven by changing consumer behaviour; shoppers are undertaking an increasing number of smaller ‘top-up shopping’ or ‘basket shopping’ trips instead of a weekly food shop to a large out of centre foodstore. Such proposals are not always successful, though. For instance, Waitrose recently opened two convenience stores in prime locations within Manchester City Centre, which have both now closed.
4.2.5 One of the reasons which explains why retailers such as Aldi and Lidl have increased their market share over recent years is because they have successfully diversified their offers to include more premium products, thereby appealing to new categories of customer. Those retailers are no longer really ‘discount operators’ in the way they were previously, and they have effectively become mainstream foodstore operators.
4.2.6 Both Sainsbury’s and Tesco now have more convenience stores than large supermarkets and superstores and, along with Morrisons, these operators have withdrawn proposals for the development of new superstores and they have also pulled out from town centre redevelopment projects in recent years. In the last 2-3 years, both Tesco and Morrisons have closed dozens of ‘unprofitable’ foodstores (with Morrisons also disposing of its portfolio of convenience stores to concentrate on its core business, demonstrating the complexity of changes within the market).
4.2.7 By way of comparison, Aldi and Lidl have investment plans to open more than 110 stores each on an annual basis. Store formats are also evolving with new Aldi and Lidl foodstores
Tesco, 26.8%
Sainsbury's, 15.3%
Asda, 15.0%
Morrisons, 10.0%
Aldi, 8.2%
Co-op, 6.2%
Lidl, 6.1%
Waitrose, 5.0%
Other, 7.9%
15
now providing more floorspace than previous formats, and new facilities such as in-store bakeries have been introduced quite recently. In contrast, the likes of Tesco and Sainsbury’s are incorporating concessions into their portfolio of superstores. Tesco has a deal with the Arcadia group to introduce names such as Burton and Dorothy Perkins into some of its stores, whilst Sainsbury’s takeover of Argos has introduced Argos concessions into many of its larger stores.
4.3 Comparison Retail Sector
4.3.1 Over the last five years or so there has been a succession of high-profile failures and company restructurings within the comparison goods retail sector, including: Toys R Us, Maplin, Debenhams, House of Fraser, Dixons Carphone Warehouse, BHS, Beales and Laura Ashley. Furthermore, the impacts of COVID-19 have led to some major operators announcing that not all of its existing stores will re-open, once the pandemic is under control.
4.3.2 Whilst the circumstances impacting each of the retailers are specific to them, there are a couple of common themes which have led to companies failing or needing to restructure. These include:
Relevance – the format of certain retailers is becoming less relevant, a good example of this being Toys R Us. Due to the size of the stores Toys R Us found itself competing against larger retailers such as foodstores and the likes of Argos. As Toys R Us was a specialist retailer, it was unable to change the type of goods being sold within its floorspace (like supermarkets and catalogue retailers can) and so Toys R Us could not react to the market change as freely. Toys R Us also had to compete against large online retailers, such as Amazon, which can offer goods at cheaper prices due to lower overheads.
Over-expansion – some retailers over-expanded in the early 2000s and have not been able to respond to the growth in online retailing and decline in high street retailing. A good example of this is Maplin, which experienced rapid growth but found that its specialist product was better suited to an online audience.
4.3.3 Identifying the success of online retailing as the main reason for the decline in high street retailing may be premature. Whilst it is a common view that the prevalence of online retailing will increase, it would be naïve to dismiss the role of the high street and multi-channel retailing because of the ‘try-it-on’ and ‘feel it’ factor. The most successful online brands are often built from their reputation on the high street, a good for example John Lewis.
4.4 Commercial Leisure
4.4.1 The restaurant sector has been feeling the effects of the ‘casual dining crunch’ in recent years. The number of insolvencies in the year up to June 2019 was up 25 per cent to 1,412, compared to the equivalent data for 2018. This was the highest number of insolvencies in the restaurant industry since 2014.
4.4.2 The reduction in consumer spending and rising costs due to the devaluation of the pound and the uncertainty of Brexit negotiations is blamed for the increase in insolvencies. There was also a rapid growth of the casual dining sector following the global financial crisis which has led to an over saturation of the market. We envisage further restaurant closures, particularly amongst large chains.
4.4.3 Many consider spending on leisure to be discretionary and therefore it is likely to be in line with the performance of the UK economy. Table 4.2 shows average weekly household spending on leisure over the last 10 years. It is worth noting that the 2009 data coincided with the start of the global financial crisis, 2014 was prior to the Brexit vote and data from 2019 are the latest available figures, prior to the impact of COVID-19 when many of these leisure activities have been shut down.
16
Table 4.2 Average Weekly Household Spending Data 2009-2019
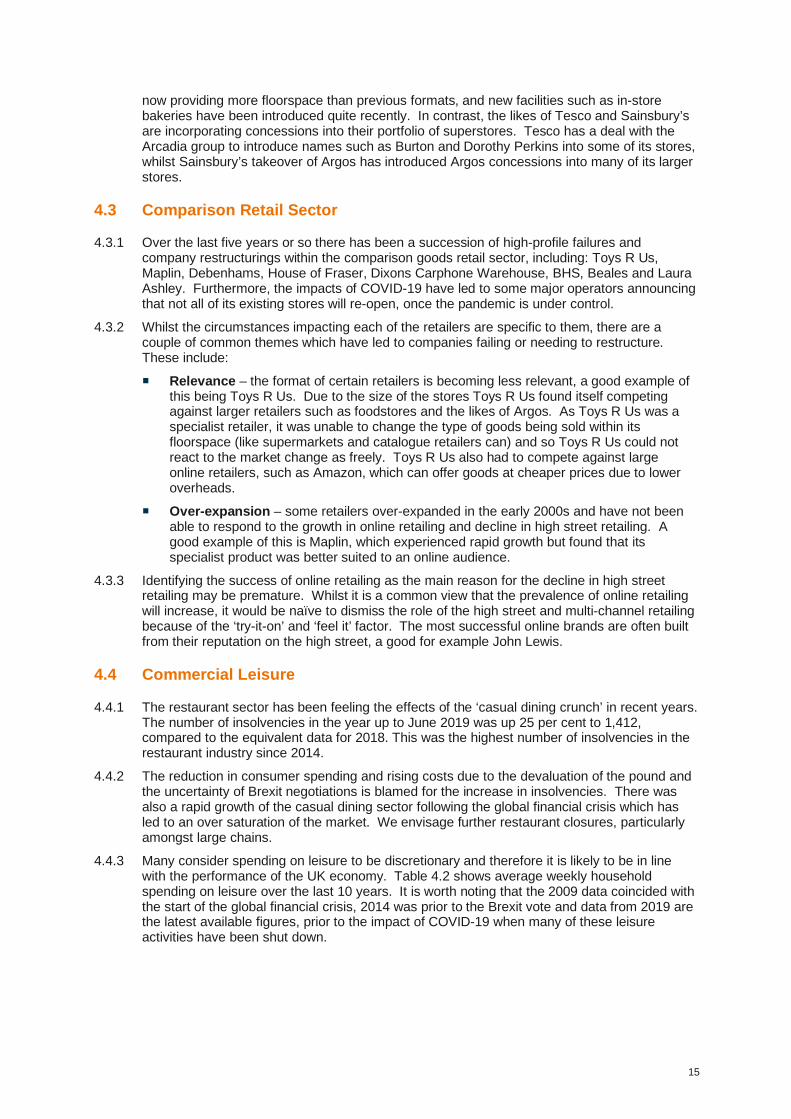
Spending Category
2009 (£) 2014 (£) 2019 (£) Percentage change
(2009-2019)
Cinema, theatre and museums etc. 2.30 2.80 3.40 47.8
Admissions to clubs, dances,
disco and bingo 0.50 0.50 0.90 80
Restaurant and café meals 13.30 16.60 19.40 45.9
Takeaway meals and other snack
food 8.00 8.80 11.00 37.5
Gambling payments 4.10 2.90 2.60 -36.6
Sports admission, subscriptions,
leisure class fees and equipment hire
5.00 6.90 7.50 50
Source: ONS, Family Workbook Spending, March 2020
4.4.4 The average weekly household spend has increased across all of the sub-categories with the exception of gambling payments. There has been a significant growth in spending on sports admission subscriptions and leisure class fees, which has been largely led by a doubling of spending on subscriptions to sports and social clubs, reflecting the growth in the discount gym market.
4.4.5 There has also been a significant increase (45.9 per cent) in spending on restaurant and café meals since the start of the global financial crisis several years ago. The decrease in gambling payments (-36.6 per cent) is largely led by a significant fall in spending at bookmakers.
4.5 Potential Impacts of COVID-19
4.5.1 ‘Non-essential’ retailers were able to re-open from 15 June 2020, subject to compliance with various criteria. On 24 May 2020, the High Streets Minister Simon Clarke announced the creation of a £50 million fund for councils to support their local high streets to re-open safely. The fund is to be used to support a range of practical safety measures including new signs, street markings and temporary barriers. The fund can also be used to develop local marketing campaigns to explain the changes and reassure the public that the high streets are safe.
4.5.2 The initial impacts of the global pandemic on retail and the forced closure of non-essential retail are stark, with the British Retail Consortium (‘BRC’) predicting that the current lockdown is costing non-essential retailers £1.8bn a week in lost sales. The BRC has also observed subdued discretionary spending in countries which have lifted lockdown measures following a short initial increase in spending.
4.5.3 Concerns about the future of retail following the global pandemic have also been expressed by Andrew Goodacre, Chief Executive of The British Independent Retailers’ Association. Mr Goodacre has said people may become weary of queuing and that social distancing takes away the fun and positive experience of shopping, and he predicts that this may affect retail sales for many months.
4.5.4 The short-term impacts of the global pandemic are already being felt with a number of national multiple retailers restructuring or entering administration, including Clarks, Debenhams, Oasis, Warehouse, Cath Kidston and Brighthouse.
17
4.5.5 The long-term impacts of the global pandemic on consumer spending and behaviour is far more difficult to predict. However, some patterns are beginning to emerge which may impact the future of retail and leisure in the UK. Understandably there has been a significant increase in online retailing, especially in the convenience goods sector. Tesco alone has doubled its online capacity to one million orders a week. It is predicted that the online grocery market will increase by around one quarter. The amount being spent by over-65s on food deliveries doubled in April 2020.
4.5.6 Interestingly, Marks & Spencer has announced that 365,000 existing customers have used the company’s website for the first time and a further 315,000 have either tried it out or returned as shoppers. Steve Rowe, Chief Executive of Marks & Spencer, considers that the global pandemic will speed up the switch from the high street to the internet and trigger big shifts in how people shop, dress and eat. Marks & Spencer has experienced a significant decrease in sales of formalwear and a significant increase in casualwear, which reflects the shift to working from home.
4.5.7 Another trend we are seeing emerge during the pandemic is the return of the ‘big shop’ in the convenience goods sector. The average spend per trip in supermarkets and superstores has increased by £7 to £26.02. This change may only be temporary during the ‘lockdown’ as people look to minimise the number of trips outside of their homes.
4.5.8 There is concern that the global pandemic may increase the rate at which pubs and restaurants are closing across the UK, with some estimating that up to 30,000 will remain permanently closed following lockdown. The British Beer and Pub Association has said the two-metre social distancing rule means that only one in five pubs will be able to re-open under these restrictions.
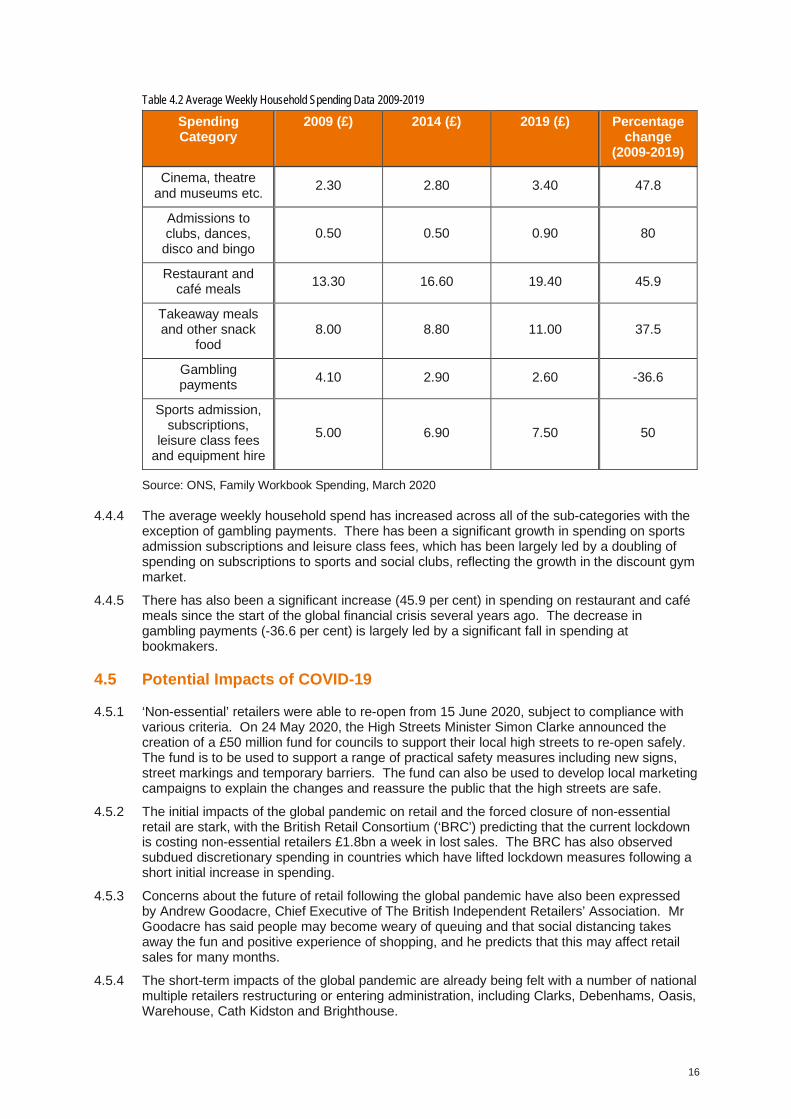
4.6 Potential Economic Scenarios
4.6.1 Experian has outlined four potential scenarios for the UK macro-economic performance following the global pandemic, namely: V-shaped; Delayed V-shaped; U-shaped; and L-shaped recoveries. Experian identifies both V-shaped scenarios as being most likely based on the response from the UK and other governments worldwide.
4.6.2 In both ‘V-shaped’ scenarios, Experian predicts that the outbreak will be contained relatively swiftly, which will allow Gross Domestic Product (‘GDP’) to rebound strongly in a ‘V-Shape’ following a sharp decline in Q2 of 2020. In the ‘U-shaped’ scenario the virus is contained in the same timeframe; however, the economic impacts are more severe due to a tightening of credit and further declines in Sterling. The ‘L-shaped’ scenario is similar to the ‘U-shaped’; however, the economic impacts are even deeper than under the ‘U-shaped’ scenario and the economy enters an extended period of stagnation/subdued growth.
4.6.3 Figure 4.3 below shows that under both V-shaped scenarios, the UK’s GDP will either return to the levels forecast prior to the coronavirus pandemic or get close to that level. However, under both the U-shaped and L-shaped scenarios, the UK’s GDP will lag significantly behind previous forecasts.
Figure 4.3 Forecasted UK Gross Domestic Product Post COVID-19
4.6.4 The significance of UK’s GDP lagging behind previous forecasts is that investment will be stifled, which will impact retail businesses’ ability to obtain credit and consumer spending may be further supressed as a consequence.
4.6.5 It is important to state that these are only initial forecasts of the possible impact of the global pandemic and it will be important to continue monitoring the UK’s economic performance to gain a good understanding of how town centres across the UK are affected.
4.7 Centres in Oldham Borough and the Surrounding Area
4.7.1 Oldham Borough is bordered by Rochdale and Calderdale to the north, Kirklees to the east, High Peak and Tameside to the south and Manchester to the west.
4.7.2 The quantitative analysis in this report is based on a defined study area (see Figure 4.4 below and Appendix A), which covers the primary catchment area of shopping destinations within Oldham Borough. The study area is sub-divided into 10 zones for more detailed analysis. The zones broadly reflect the catchment areas of the main centres within the Borough, aside from Oldham, which has a borough-wide catchment area.
Figure 4.4 Study Area Zones
Venuescore
4.7.3 The Javelin Group’s Venuescore ranks over 3,500 retail destinations across the UK including town centres, malls, retail warehouse parks and factory outlet centres (individual ‘out-of-centre’ stores are not included). Each destination is given a weighted score based on the number of multiple retailers present, including anchor stores, fashion operators and non-fashion multiples. The score attached to each retailer is weighted depending on their overall impact on shopping patterns, for example a department store will achieve a high score. The scores relate to each shopping destination.
4.7.4 The Javelin information is widely used in the retail industry to assess the relative strength of shopping destinations. The results for Oldham Borough and other relevant centres outside of but close to the Borough are shown in Table 4.3.
19
Table 4.3 Venuescore UK Shopping Index and UK Rank
Shopping Destination*
Location Grade
Venuescore UK Ranking Market Position
Manchester Major City 766 2 Upper Middle
The Trafford Centre
Major Regional 310 32 Upper Middle
Bury Regional 194 93 Middle
Stockport Regional 180 115 Middle
Oldham Regional 142 171 Middle
Ashton-under-Lyne
Sub-Regional 119 210 Lower Middle
Rochdale Sub-Regional 106 245 Lower Middle
Hyde Sub-Regional 78 360 Lower Middle
Middleton Major District 57 530 Lower Middle
Wythenshawe Major District 53 574 Lower Middle
Chorlton District 44 702 Lower Middle
Heald Green District 41 757 Middle
Cheadle District 38 831 Middle
Hazel Grove District 38 831 Middle
Prestwich District 38 831 Lower Middle
Didsbury District 33 974 Middle
Heywood District 32 1,003 Middle
Shaw District 30 1,081 Lower Middle
Denton Minor District 29 1,120 Lower Middle
Stalybridge Minor District 28 1,151 Middle
Droylsden Minor District 26 1,232 Lower Middle
Fallowfield Minor District 26 1,232 Middle
Failsworth Minor District 25 1,281 Middle
Marple Minor District 23 1,372 Middle
Cheadle Hulme Minor District 22 1,429 Middle
Gorton Minor District 22 1,429 Lower Middle
Ramsbottom Minor District 22 1,429 Middle
Longsight Minor District 20 1,548 Lower Middle
Chadderton Local 16 1,908 Lower Middle
Hill Stores Local 14 2,193 Middle Source: Venuescore, Javelin Group 2015/16 *Lees, Royton and Uppermill do not feature in Venuescore’s list of retail destinations
20
4.7.5 The location of centres included in Venuescore’s database indicates that residents in Oldham Borough have good access to several large centres, as well as having a choice of smaller centres to meet their day-to-day shopping needs.
4.7.6 Manchester city centre is at the top of the hierarchy in the sub-region with a Venuescore of 766 and is ranked 2nd in the UK. Oldham is classed as a ‘Regional’ centre with a Venuescore of 142 and is ranked 171st in the UK. However, Oldham is ranked below other ‘Regional’ centres in the area, such as Bury (ranked 93rd) and Stockport (ranked 115th).
4.7.7 Shaw is classed as a ‘District’ centre with a Venuescore of 30 and is ranked 1,081st in the UK. Failsworth is classed as a ‘Minor District’ centre with a Venuescore of 25 and is ranked 1,281st in the UK. Chadderton and Hill Stores are both classed as ‘Local’ centres with a Venuescore of 16 and 14 respectively and are ranked 1,908th and 2,193rd.
4.7.8 Hill Stores, Royton and Uppermill have few national multiples and are not included within the Venuescore analysis. It should also be noted that the Venuescore data is weighted towards clothing and fashion retailing. Within the sub-region, clothing / fashion shopping facilities are primarily focused in the city centre and larger town centres.
4.7.9 Each ‘venue’ has an estimated average market position score based on the retailers present, with the ‘market position index’ for each centre then calculated by comparing the venue’s market position score against the average for all venues. The average market position index is 100 and Manchester city centre has a market position index of 118, and an ‘upper middle’ market rating. A further example is Ashton-under-Lyne town centre which has a market position index of 85, and a ‘lower middle’ rating.
4.7.10 The market position relates specifically to the fashion offer together with other easily classified operators, because the range and choice of clothing and fashion shopping is the key driver in the relative attraction of large comparison shopping destinations. Javelin also provides other measures of the strength of centres as outlined below.
4.7.11 Oldham, Shaw, Failsworth, Chadderton and Hill Stores are all classed as having a ‘Middle’ market position. This suggests they do not offer the same level of luxury / high quality retailing as larger centres or centres within areas with higher levels of affluence. However, out of all the shopping destinations in Table 4.1, only Manchester and The Trafford Centre have an ‘upper middle’ market position.
4.7.12 In addition to its market position and Venuescore, each destination is also assessed in terms of a range of other attributes, as follows:
age focus (is the offer targeting younger or older consumers?); and
fashionability of its offer (is the clothing offer traditional or progressive?).
4.7.13 The Javelin Group classifies retailers in terms of their ‘fashionability’, ranging from ‘traditional’ at one end, then ‘updated classic’, ‘fashion moderate’, ‘fashion forward’ through to ‘progressive’ at the other, i.e. least fashionable to the most fashionable. This classification is only reliable for larger centres because it focuses on national multiples rather than independent outlets.
4.7.14 The age position of the fashion offer is also classified ranging from ‘young’, ‘middle’ to ‘old’, with retailers such as Hollister, H&M, Miss Selfridge and Superdry appealing more to the young and brands such as Wallis and Edinburgh Woollen Mill appealing more to an older age bracket.
4.7.15 Oldham caters for both younger and older customers, being described as ‘fashion moderate’, which reflects the mixed age profile of residents within the Borough. Shaw, Failsworth, Chadderton and Hill Stores are also described as ‘fashion moderate’.
4.7.16 The Javelin information outlined above indicates that, unsurprisingly, Oldham is the most significant shopping destination in the Borough and has the best prospects for attracting future growth and investment.
21
5 Health Check Assessments 5.1 Introduction
5.1.1 This section provides health check assessments of Oldham, Chadderton, Failsworth, Hill Stores, Lees, Royton, Shaw and Uppermill, based on the key measures of vitality and viability.
5.1.2 The audit of facilities in the centres is based on an Experian Goad plan for each centre, updated by Stantec in December 2019. The Goad definition of these defined centres broadly reflects the defined centre boundaries. It is preferable to utilise the Experian Goad plans as they contain a lot of background data useful for the analysis of town centre health. Experian Goad plans are not available for Chadderton, Failsworth, Hill Stores and Lees. The audit of facilities of Chadderton, Failsworth, Hill Stores and Lees is therefore based on Stantec’s proposed definition of the town centre boundaries for these centres.
5.1.3 Stantec visited the town and district centres on 4 and 5 December 2019.
5.2 Oldham Town Centre
5.2.1 Oldham Town Centre is identified as the main centre within the Council’s Joint Core Strategy and Development Management Policies Development Plan Document 2011 (Policy 15) [Joint Core Strategy]. It is the largest centre within Oldham Borough, supporting a range of retail, service and community facilities. The centre services shoppers from across the borough and beyond. Its key roles include:
Convenience retail shopping – there is one large food superstore in Oldham, this being Sainsbury’s on Union Street (6,450 sq.m), which is within the town centre boundary. Other national multiple convenience retail provision within the town centre includes Iceland on Curzon Street (590 sq.m) and Heron Foods on High Street (290 sq.m). These facilities are supported by small convenience retail outlets which serve both main food and grocery shopping trips and basket/top-up food shopping trips. Oldham Town Centre also accommodates Tommyfield Market, an indoor market which operates Monday to Saturday and sells a variety of convenience and comparison retail goods. Other markets are held in the outdoor section of Tommyfield Market including a car boot sale, a materials market and a second-hand market. Curzon Street Market also sells both convenience and comparison retail goods.
Comparison retail shopping – the town centre contains a large selection of national multiples including B&M, The Body Shop, Boots, Card Factory, Clintons, Clarks, Debenhams, Halfords, H&M, JD Sports, Next, Primark, River Island, Sports Direct, The Works, T K Maxx, Topman, Waterstones and WHSmith. There is also a good range of independent shops selling a range of comparison retail goods.
Services – including six banks, three building societies, 73 restaurants/cafés (including Caffè Nero, Costa, McDonald’s, Nando’s and Subway) and 35 hairdressers/beauty parlours.
Entertainment – including theatres (Coliseum, Lyceum, Grange Arts, Peshkar and Library Performance Space), a cinema, a bingo hall, a gymnasium and 19 bars/public houses.
Community facilities – including Gallery Oldham, four dental surgeries, a church, a library, a museum and three community centres.
5.2.2 Oldham Town Centre is a large town centre. The traditional town centre is focussed around Yorkshire Street, Market Place and Tommyfield Market. The Spindles Town Square Shopping Centre is located to the south of Market Place and Yorkshire Street.
22
Figure 5.1 View of Yorkshire Street and Odeon Old Town Hall Development
Figure 5.2 View of Market Place from Spindles Town Square Shopping Centre
Previous Findings
5.2.3 The 2009 Oldham Retail and Leisure Study (‘2009 Study’) found that, overall, Oldham Town Centre was performing adequately at the time, although there were a number of areas that were identified as being poor, including the wider commercial leisure offer and evening economy, Tommyfield Market and the image of the town centre. Specifically, the 2009 Study found that the number of retailers seeking representation in Oldham had declined in recent years but, perhaps counter-intuitively, commercial yields and rental levels had been improving.
23
Diversity of Uses
5.2.4 Oldham Town Centre has a total of 424 retail/service units, with an aggregate floorspace of 82,970 sq.m gross. The diversity of uses present in Oldham Town Centre in terms of the number and proportion of units and floorspace is set out in Table 5.1, compared with the Goad national average.
Table 5.1 Diversity of Uses Table for Oldham Town Centre
Source: Stantec Survey and Goad Experian (for current National averages)
5.2.5 Currently, the proportion of comparison retail units is below the national average; however, the proportion of comparison retail floorspace is close to the national average. This was also found to be the case in the 2009 Study, which indicates that there are a small number of large units occupied by comparison retailers. As set out above, there is a high number of comparison retail national multiple operators in the town centre and they tend to be located at the Spindles Town Square Shopping Centre and along Market Place and Yorkshire Street. In addition, the Sainsbury’s store – recorded as a convenience goods retailer by Goad, which is its predominant use – also sells a proportion of comparison retail goods, including clothes, electric items and homewares. It is also worth noting that the Sainsbury’s store accommodates an Argos concession, which provides further comparison retail goods provision.
5.2.6 Oldham Town Centre is under-represented in the convenience goods sector, in terms of the proportion of units and also the proportion of floorspace. The proportion of convenience retail units is 2.0 percentage points below the national average and the proportion of convenience retail floorspace is 1.7 percentage points below the national average. The provision of convenience goods retailers within Oldham Town Centre is largely dominated by Sainsbury’s (6,450 sq.m), located on Union Street. The town centre contains nine bakers, three greengrocers & fishmongers, four butchers (including at Tommyfield Market), four grocery & frozen food stores, one off-licence and seventeen confectionery, tobacco & news / convenience stores.
5.2.7 The proportion of retail service units and floorspace in the town centre is below the national average. There is an under-provision of hairdressers, beauty parlours and health centres when compared with the national average.
5.2.8 The proportion of professional service units and floorspace is slightly below the national average. This sector is dominated by a higher than average provision of banks and building societies.
5.2.9 The proportion of food and drink units is broadly comparable to the national average, whereas the proportion of food and drink floorspace is significantly below the national average. There are 42 fast-food & take-away units, 19 cafés and 10 restaurants within the town centre.
24
Proportion of Vacant Property
5.2.10 According to our survey, based on the Goad definition of the town centre, the proportion of vacant units and floorspace are both significantly above the national average (by 11.0 and 7.5 percentage points respectively). The proportion of vacant units is 23.8 per cent and the proportion of vacant floorspace is 19.3 per cent. The 2009 Study also found the proportion of vacant units and floorspace to be above the national average, albeit to a lesser extent.
5.2.11 Of the 101 vacant units, 20 are located on Union Street and 19 on Yorkshire Street, 8 are located at The Spindles Town Square Shopping Centre, 7 are located at the Town Square Shopping Centre and 6 are located at King Street. In comparison, the 2009 Study found there to be 62 vacant units with a floorspace of 15,510 sq.m gross. This means that the number of vacant units has increased by 39 units and the amount of vacant floorspace has increased by 460 sq.m gross between 2009 and 2019.
5.2.12 Goad plan data indicates that vacant floorspace currently totals 15,970 sq.m gross. The largest vacant units are located at 2 King Square (1,510 sq.m), 2 King Street (1,160 sq.m), 80 Union Street (1,140 sq.m), 79 Union Street (830 sq.m) and 29-30 Town Square Shopping Centre (510 sq.m). These five largest vacant units take up 5,510 sq.m gross floorspace in total. If all of these units were re-occupied, the vacant floorspace would fall to 10,820 sq.m or 13.9 per cent of all town centre units and would be closer to the national average. The remaining units are small, with an average floorspace of 134 sq.m. It is worth noting that the average floorspace of vacant units in Oldham has significantly decreased from 242 sq.m to 158 sq.m. This demonstrates that since the last study a number of larger units, which were previously vacant, have been occupied or demolished.
Retailer Representation
5.2.13 As set out above, Oldham Town Centre contains a high proportion of national multiple retailers including stationers (The Works and WHSmith); fashion and footwear operators (Clarks, H&M, Next, River Island and Topman); mobile phone shops (EE, O2, Three and Vodafone); jewellers (H Samuel and Pandora, amongst others); opticians (Specsavers, Boots and Vision Express); and discount operators (B&M). It is positive that Oldham Town Centre contains a broad range of retailers.
5.2.14 Since the 2009 Study, however, there have been notable closures of multiple comparison goods retailers in the town centre including BHS, New Look and HMV. This demonstrates the vulnerability of the town centre to national market trends, including within the key clothing and fashion retail sector.
5.2.15 Tommyfield Market is located within the north-western part of the defined town centre and operates between 09:00 and 17:15 Monday to Saturday. The market hosts a mixture of both convenience and comparison goods retailers, alongside hot food takeaways. At the time of our survey, there was a high pedestrian footfall within Tommyfield Market. Council records show that approximately 28 per cent of stalls within the Market are either vacant or used as storage.
5.2.16 The town centre’s food and drink offer mainly comprises public houses (Bank Top Tavern, The Tommyfield, Town Hall Tavern and Wetherspoons); bars (Bees Knees and The Squire Knot); restaurants (including Achilles, Grill at no. 20, Molino Lounge, Nando’s, Old Bill, Stoccos and Valentinos); cafés (Costa and Naked Bean); and hot food takeaways (KFC and McDonald’s).
Commercial Rents
5.2.17 Commercial retail rents4 within the primary shopping area of the town centre range from £150 per sq.m to £500 per sq.m and on average commercial retail rents are approximately £240 per sq.m.
5.2.18 Commercial retail rents in Oldham are comparable to those achieved in nearby town centres. For example, commercial retail rents within the primary shopping area of Ashton-under-Lyne are approximately £260 per sq.m, compared with Bury (£200 per sq.m) and Rochdale
(£175 per sq.m). Commercial retail rents in Stalybridge are lower than those achieved in Oldham, at approximately £160 per sq.m.
Accessibility and Pedestrian Flows
5.2.19 Oldham Town Centre is highly accessible by a range of transport modes. There are three tram stops within the town centre (Oldham King Street, Oldham Central, Oldham Mumps), which provide services to Manchester and Rochdale; services run every 12 minutes between Monday and Saturday and every 20 minutes on Sunday, services start at 5.00am and finish at 10.00pm. There are two bus stations, Oldham Central and Oldham West Street, both of which are located within the north-western part of the town centre and provide services to Rochdale, Manchester, Ashton-under-Lyne (as well as other parts of Tameside) and Huddersfield. Services are very regular, running approximately every five minutes, at peak times, starting at 4.00am and finishing at 11.30pm.
5.2.20 Vehicular access to Oldham Town Centre is very good, with the town centre being located off the A62, A627, A669 and A671. There are 11 Council-owned car parks within the town centre, all of which offer free car parking for up to three hours on Saturday and Sunday.
5.2.21 There is no train station located within, or on the edge of, Oldham Town Centre. The nearest train stations to Oldham are located at Mills Hill and Moston, both of which are approximately 2.5 miles from the centre.
5.2.22 The majority of the primary shopping area within Oldham Town Centre is pedestrianised including Market Place, Yorkshire Street, Albion Street and Curzon Street. These areas are largely paved which means that they are highly accessible for pedestrians. However, it is worth noting that Oldham Town Centre has an undulating topography and therefore it may be difficult for people with mobility issues to navigate parts of the town centre.
5.2.23 During our visit, pedestrian activity was found to be largely concentrated around Tommyfield Market, Market Place and the western end of Yorkshire Street. The ground floor of Spindles Town Square Shopping Centre was also found to be relatively busy whereas the first floor was quiet in comparison. The secondary areas of the town centre, namely Union Street and the eastern end of Yorkshire Street, were found to be relatively quiet. However, the town centre was surveyed during the day and these areas host a number of evening/night-time uses and so footfall is likely to be higher at night.
5.2.24 The town centre would benefit from safe cycle storage. Potential locations for safe cycle storage include Central Bus Station, Lord Street and Tommyfield Market.
Perception of Safety and Occurrence of Crime
5.2.25 According to Greater Manchester Police data, there were 252 reported crimes in Oldham Town Centre neighbourhood area in June 2019. This is more than the 196 report crimes in June 2018 but broadly similar to the 250 reported crimes in June 2017. As such, reported crimes Oldham Town Centre have remained at a similar level over a three year period.
5.2.26 During our visit, most areas of the town centre felt safe and secure, thanks to active frontages and wide, open walkways. We also noted a good provision of streetlights, and there was a large visible security team present in the Spindles Town Square Shopping Centre and the surrounding area.
5.2.27 There are a number of uses (for examples restaurants and bars) present in Oldham Town Centre which extend the period of pedestrian activity into the evening.
Town Centre Environment
5.2.28 The town centre environment in Oldham is largely positive. There are examples of high-quality public realm in the recently renovated Old Town Hall between Clegg Street and Yorkshire Street. In secondary areas of the town centre there has been obvious investment in street furniture and planting, which has helped to improve the town centre environment.
5.2.29 Within the town centre, there are 26 listed buildings and monuments including Manchester Chambers, Oldham Parish Church of St Mary and St Peter, the War Memorial and the
26
Independent Methodist Chapel, all of which are Grade II* listed. The eastern edge of the defined town centre is also included within the Town Centre Conservation Area.
5.2.30 Oldham Council adopted the Oldham Town Centre Conservation Area Appraisal and Management Plan SPD in August 2019. The Appraisal proposes to extend the Conservation Area in four locations, largely to the north west along Market Place and Henshaw Street and the east along Yorkshire Street. The extension has been designated under section 69 of the Planning (Listed Building and Conservations Areas) Act 1990 and is treated as a material planning concern until formally adopted as part of the Local Plan review.
5.2.31 The external façades of both the Spindles Town Square Shopping Centre and Tommyfield Market are, however, dated and detract from the environmental quality of the town centre. Furthermore, some of the vacant units located on Union Street and the eastern edge of Yorkshire Street are not well-maintained and would benefit from renovation.
Balance between Independent and Multiple Stores
5.2.32 As set out above, there is significant representation from national multiple retailers in Oldham Town Centre, as well as a large number of independent retailers from boutique to discount stores, with independent stores concentrated around George Street. We consider that there is a good balance between independent and national multiple stores in the town centre. Outside of the major towns and cities there are now fewer national multiple retailers, meaning the role of independent operators is becoming more important.
Evidence of Barriers to Business
5.2.33 In relation to the supply of units there are no apparent significant local barriers to new businesses. There is a large number of vacant units of varying sizes and commercial retail rents are comparable with other town centres in the sub-region.
5.2.34 Perceived demand for space in the town centre is relatively low, evidenced by the number of empty units and low pedestrian footfall identified around the periphery of the town centre. Oldham Town Centre is not immune to restructuring in the retail industry generally and has suffered by losing some national multiple retailers which would have previously acted as town centre anchors/attractors.
Extent of Evening and Night-time Economy Offer
5.2.35 The evening economy is largely focused around Yorkshire Street and specifically the stretch between Hunters Lane and Horsedge Street. Restaurants located in Oldham Town Centre are all located to the east of the Spindles Town Square Shopping Centre, which helps to attract a wider customer base including families to this part of the town centre. There is a high concentration of hot-food takeaways located on Union Street which will extend activity in this area of the town into the early hours of the morning. Liquid nightclub is located on Retiro Street.
5.2.36 Oldham Town Centre also accommodates Oldham Coliseum Theatre, Lyceum Theatre and the Odeon Cinema in the Old Town Hall. All of these venues host evening/late night viewings and contribute to the evening and night-time economy.
Summary
5.2.37 The health of Oldham Town Centre is mixed. In terms of positives, the town centre contains many national multiple retailers, including Boots, Debenhams, H&M, Next and Primark and there is strong representation across the various retail categories. The proportion of food and drink units is similar to the national average and there are 19 cafés and 10 restaurants within the town centre. The town centre is easily accessible by car and tram and there is good parking provision within Oldham Town Centre.
5.2.38 However, the health of the town centre has deteriorated since the 2009 Study. The proportion of vacant units in the town centre is almost double the current national average. The number of vacant units has increased by 39 units since 2009, which points to a lack of demand for
27
floorspace within Oldham Town Centre. The town centre environment could be improved, particularly around the Spindles Town Square Shopping Centre and Tommyfield Market.
5.2.39 Whilst the town centre has managed to hold onto some national multiple retailers during the restructuring of the retail industry, it is clear that there is too much retail floorspace in the town centre. To prevent further decline in the health of the town centre, interventions will be required, such as those that can be achieved via initiatives such as the Future High Streets Fund, to enable parts of the town centre to move away from retail. The town centre would benefit from safe cycle storage. Potential locations for safe cycle storage include Central Bus Station, Lord Street and Tommyfield Market.
5.3 On-Street Survey Results
5.3.1 NEMS Market Research was instructed to carry out an independent face-to-face survey amongst a sample of visitors to Oldham Town Centre. The main aims and objectives of the survey were to establish:
respondents’ main purpose for visiting the town centre;
how respondents think Oldham compares to other centres; and
what type of shops, services and leisure facilities people would like to see more of in Oldham Town Centre.
5.3.2 A total of 150 face-to-face interviews were conducted, between Saturday 16 November and Monday 25 November 2019. The survey findings are summarised below and set out in full in Appendix F.
Accessibility
5.3.3 In respect of accessibility, the on-street survey identified the following:
Almost two-thirds (60 per cent) of visitors to Oldham Town Centre had no access to a car for personal use during the day-time. During the evening / night-time, the proportion of visitors who did not have access to a car for personal use was almost identical at 59 per cent.
Almost half (45 per cent) of visitors travelled to the centre by bus, minibus or coach, with a further 31 per cent arriving by car or van (either as driver or passenger). A minority (11 per cent) of visitors walked to the centre. A small proportion (8 per cent) of visitors arrived by Tram. No visitors surveyed arrived in the centre by bicycle.
Of those who drove, the most popular place to leave their vehicle was Spindles Town Centre Car Park, some 33 per cent of drivers parking here, with the Civic Centre, Rock Street and Sainsbury’s car parks each accounting for 13 per cent of responses.
The vast majority (91 per cent) of visitors did not encounter any difficulty when obtaining a car parking space on the day of the survey.
Just over one-third (35 per cent) of visitors travelled for 10 minutes or less to reach the centre. An additional 28 per cent travelled for between 11 and 15 minutes, with 23 per cent travelling for between 16 and 20 minutes and 9 per cent travelling for between 21 and 30 minutes. Only 5 per cent of visitors travelled for between 31 and 60 minutes to reach the centre.
Visitors were asked to consider car parking provision in Oldham. Of those that answered this question, 37 per cent deemed this to be ‘about the same’ as that in other centres, with 19 per cent considering parking provision in Oldham Town Centre to be ‘better’ or ‘much better’ as that in other centres.
In terms of car parking prices, 33 per cent considered prices to be ‘about the same’ as in other centres, with 21 per cent considering prices to be ‘better’ or ‘much better’ than other centres.
28
Accessibility by public transport was described by 45 per cent of visitors as ‘about the same’ as in other centres and 35 per cent felt that public transport was ‘better’ or ‘much better’ in Oldham than in other centres.
Perception of Safety and Occurrence of Crime
5.3.4 The on-street visitors survey questioned visitors about their perceptions of crime in Oldham. During the day-time, some 51 per cent of visitors indicated that safety in Oldham was ‘about the same’ as that in other centres, with 22 per cent considering day-time safety to be ‘better or ‘much better’. However, with respect to safety during the evening / night-time, the proportion of visitors who deemed safety to be ‘about the same’ as in other centres fell to 24 per cent, with some 33 per cent considering safety to be either ‘worse’ or ‘much worse’ than in other centres. Just 6 per cent of visitors felt that evening / night-time safety in the centre was ‘better’ or ‘much better’ than other centres.
Customer Views and Behaviour
5.3.5 Other key findings of the on-street visitors survey were as follows:
The vast majority (93 per cent) of visitors to the town centre had travelled directly from home.
Some 86 per cent of respondents were visiting the centre, with 8 per cent working in the centre and 7 per cent living in the centre.
The main reasons for visiting the centre were: food and grocery shopping (25 per cent); clothes / shoes shopping (22 per cent); to visit a bank / building society / post office (17 per cent); and due to work / school / college (9 per cent).
12 per cent of visitors planned to stay in the centre for up to half an hour, with 66 per cent planning to stay in the centre for up to two hours and 15 per cent planning to stay in the centre for half the day. Only 7 per cent of visitors planned to stay in the centre all day.
The majority of visitors (81 per cent) did not plan to undertake their main food shop on the day of the survey.
When asked whether they were planning to buy anything other than food goods on the day of the survey, 30 per cent of respondents stated that they plan to purchase clothing, footwear or household goods.
Just over half (52 per cent) of visitors stated that they visited Oldham ‘about as frequently’ today as compared to five years ago. Approximately one-third (35 per cent) of visitors stated that they visited the centre ‘less’ or ‘much less frequently’ than five years ago, and 12 per cent of visitors stated that they visited Oldham ‘more’ or ‘much more frequently’ than five years ago.
The majority (83 per cent) of respondents indicated that they do not visit the centre during the evening.
5.3.6 Areas of weakness were regarded as the choice/range of non-food shops (27 per cent), the range of specialist independent retailers (20 per cent), foodstore provision (10 per cent), town centre environment (10 per cent) and the range and choice of pubs / restaurants (7 per cent).
5.3.7 Visitors were asked about the types of shops and services they would like to see more of in Oldham. The most popular responses were clothing shops (27 per cent) and department stores (21 per cent). Visitors were asked about the types of leisure facilities they would like to see more of in Oldham. The most popular responses were a bowling alley (17 per cent), museums (11 per cent) and an ice rink (10 per cent).
5.4 District Centres
5.4.1 The seven remaining centres identified within Policy 15 of the Council’s Joint Core Strategy and Development Management Policies DPD (2011) are district centres. We consider the performance of these centres in turn below.
29
5.4.2 Whilst we assess the performance of each centre individually, there are certain indicators highlighted within the PPG that lack context unless compared across similar centres. Within this section we reflect on the average commercial rents achieved in the primary shopping area of each of the district centres and the number of reported crimes in each district centre over the last three years. We then discuss the health of each district centre in terms of other town centre indicators.
Commercial Rents
5.4.3 There are a number of factors affecting the average commercial rents achieved in each of the district centres. They include the quality of the units; the demand for units; and, the supply of units, amongst other factors. Table 5.2 shows the average commercial rents achieved in the primary shopping area of each of the district centres. Average commercial rents in the district centres range from £173 per sq.m (Failsworth) to £245 per sq.m (Shaw).
Table 5.2 Comparison of average achieved commercial rent across district centres
District Centre Average Commercial Rent (£ per sq.m)5
Shaw 245 Royton 194
Uppermill 238 Lees 183
Hill Stores 200 Chadderton 199 Failsworth 173
Droylsden 246 Middleton 220
Hyde 211 Moston 208 Milnrow 172
Perception of Crime and Safety
5.4.4 Table 5.3 shows the number of reported crimes in June, over the last three years, across each of the district centres and the average number of reported crimes. The district centres are ordered by the size of the centre, based on the number of units, in descending order. We would therefore expect to see the number of reported crimes decreasing.
Table 5.3 Comparison of reported crimes across district centres, June 2017 – June 2019
5.4.5 Table 5.3 largely demonstrates the relationship we would expect to observe, with the exception of Chadderton and Failsworth. Chadderton in particular has a high number of reported crimes for a centre of its size. There are a number of reasons why this could be, including a low-quality physical environment and poor street lighting. We consider the physical environment in each of the district centres, below.
5.5 Shaw District Centre
5.5.1 Shaw District Centre is the second largest centre within Oldham Borough, in terms of number of units, behind Oldham Town Centre. Shaw District Centre is a large centre concentrated on the junction of Market Street, Rochdale Road and Beal Lane. No areas of the district centre are pedestrianised; however, vehicle access to Market Street is restricted on Thursday to accommodate the market. In terms of comparison goods shopping, Shaw draws the majority of trade from residents of Zone 1 (Shaw), Zone 9 (Rochdale South) and Zone 2 (Royton). The centre’s key roles include:
Convenience retail shopping – there is one large foodstore in Shaw District Centre, the Asda superstore on Eastway (6,580 sq.m), as well as one medium sized foodstore, Aldi on Greenfield Lane (1,030 sq.m). These facilities are supported by small convenience retail outlets which serve both main food and grocery shopping trips and basket/top-up food shopping trips. The centre also accommodates a market located on Market Street, which operates every Thursday. The market sells a variety of convenience and comparison retail goods, alongside hot food.
Comparison retail shopping – Boots is the only national multiple comparison retailer present within Shaw. There is, however, a good selection of independent shops selling a range of comparison retail goods.
Services – including one bank, five restaurants/cafés and 18 hairdressers/beauty parlours.
Entertainment – including four bars/public houses, amusements and a playhouse.
Community Facilities – including one dental surgery, two churches, a health centre, an educational institution and a library.
Figure 5.3 view to the north from Market Street
31
Figure 5.4 View to the south from Milnrow Road
Previous Findings
5.5.2 The 2009 Study found that the performance of Shaw was good. The proportion of convenience goods units was above the national average, whereas the proportion of comparison goods units was below the national average. Neither of those findings is unusual for a centre of this size. The proportion of vacant units was also broadly similar to the national average, and the 2009 Study found the centre to be fairly attractive and busy.
Diversity of Uses
5.5.3 Shaw District Centre has a total of 117 retail/service units, with a floorspace of 20,520 sq.m gross. The diversity of uses present in Shaw in terms of the number and proportion of units and floorspace is set out in Table 5.4, compared with the Goad national average.
32
Table 5.4 Diversity of Uses Table for Shaw District Centre
Source: Stantec Survey and Goad Experian (for current national averages)
5.5.4 The proportion of comparison goods retailers (29.9 per cent) is below the national average (37.1 per cent). The proportion of comparison goods floorspace (14.7 per cent) is approximately a third of the national average (42.7 per cent). It should be noted that those comparisons are in relation to the national average for all centres, and many district centres have representation that is below the overall average. Furthermore, for the purpose of Goad data, Asda is considered a convenience goods retailer, whereas in reality a significant proportion of the floorspace within Asda will be used for the sale of comparison goods. It is also worth noting that Asda occupies just under a third of the retail floorspace in Shaw District Centre and therefore the categorisation of this unit has a significant impact on the overall proportions identified.
5.5.5 The proportion of convenience goods retailers in Shaw (9.4 per cent) is close to the national average (10.0 per cent). The proportion of floorspace occupied by convenience goods retailers (45.9 per cent) is significantly above the national average (18.6 per cent). The provision of convenience goods floorspace within Shaw is dominated by Asda (6,580 sq.m) and Aldi (1,030 sq.m). The district centre also contains two bakers, two butchers and two other national foodstores (Tesco Express and Iceland).
5.5.6 The proportion of retail service units and floorspace in Shaw is above the national average. This is driven by a higher than average provision of hairdressers, beauty parlours and health centres.
5.5.7 The proportion of professional service units and floorspace in Shaw is below the national average, with RBS being the only bank present.
5.5.8 The proportion of food and drink units is similar to the national average. There are 14 fast-food & take-away units, four cafés and a restaurant within Shaw.
Proportion of Vacant Property
5.5.9 According to our survey, the vacancy rate in Shaw is above the national average both in terms of the proportion of vacant units and the proportion of overall floorspace. The proportion of vacant units is 15.4 per cent and the proportion of vacant floorspace is 19.9 per cent. Since the 2009 Study, the percentage of vacant units and the percentage of vacant floorspace has significantly increased, which is a sign of declining health and reflects national trends.
5.5.10 In total there are 18 vacant units, five of which are located on Market Street and three are located on Rochdale Road. Goad plan data indicates that vacant floorspace currently totals
33
4,090 sq.m. The largest vacant unit is located at 5 Farrow Street and comprises 1,090 sq.m of vacant floorspace, i.e. a quarter of the vacant floorspace within Shaw. There are five other vacant units which are over 200 sq.m, including: 1 Collinge Street (380 sq.m), 8 Queen Street (380 sq.m), 20 Rochdale Road (340 sq.m), 1 Milne Street (310 sq.m) and 7-19 Rochdale Road (300 sq.m). The remaining vacant units are all relatively small and under 200 sq.m each.
5.5.11 In comparison, the 2009 Study found there to be 16 vacant units with a combined floorspace of 1,430 sq.m. This shows that the number of vacant units has increased by 2 units and the amount of vacant floorspace has increased by 2,660 sq.m gross between 2009 and 2019.
Retailer Representation
5.5.12 Shaw District Centre contains the following national multiple retailers and service operators: Aldi, Asda, Boots, Coral, Greggs, Iceland, Pound Bakery, RBS, Tesco Express, William Hill and Scrivners Pharmacy. Since the 2009 Study, both Woolworths and Yorkshire Bank have closed/left the centre.
5.5.13 As set out above, Shaw Market is located on Market Street and operates on Thursdays. A section of Market Street is closed to motorised vehicles on market days. The market hosts stalls selling both convenience and comparison goods. When surveyed there were no vacant stalls; however, footfall was very low. Based on our observations, we would recommend changing the day of the market as it coincides with Royton Market, which appears to be more popular. Royton is located approximately two miles to the south east of Shaw.
5.5.14 Shaw’s food and drink offer mainly comprises public houses (Blue Bell, The Pineapple, The Shay Wake and The Coach and Horses); a restaurant (Bengal Brasserie); and cafés (Coffee and Sandwich Bar, Donnelley’s, Le Café and Naughty but Nice).
Accessibility and Pedestrian Flows
5.5.15 Shaw is relatively accessible by car, being located off the A663. There are four Council car parks within the district centre which are all reasonably well priced. Shaw is served by tram with the Shaw and Crompton Metrolink stop being located approximately 200 metres from the centre. The tram stop provides services to Rochdale, Trafford and Manchester, services run every 12 minutes between Monday and Saturday, and every 20 minutes on Sunday, services start at 5.00am and finish at 10.00pm. There are also multiple bus stops within Shaw, including on Market Street. Bus services within Shaw run fairly regularly, approximately every 15 minutes, at peak time, starting at 5.00am through to 11.30pm.
5.5.16 Shaw is not pedestrianised. The width of the pavement varies throughout the centre but is widest at Market Street.
5.5.17 During our survey we noted that pedestrian activity was concentrated along Market Street and specifically the market. However, it is worth noting that pedestrian activity was very low throughout the district centre as a whole.
5.5.18 It should be noted that online retailer, Shop Direct is due to vacate Shaw in the latter part of 2020. The business employs approximately 2,000 people, many of which are located in Shaw. The health of Shaw could be detrimentally affected by the loss of this business as it is likely that some of the people currently employed at Shop Direct in Shaw use Shaw’s shopping facilities.
Perception of Safety and Occurrence of Crime
5.5.19 When surveyed we perceived all areas of Shaw District Centre to be safe and secure. There was significant pedestrian and vehicle activity throughout the centre and a number of uses which will encourage activity into the evening and night-time.
5.5.20 Most of the centre benefits from natural surveillance; however, some areas including the car parks to the west of the centre would benefit from greater activity and a better provision of street lighting.
34
Physical Environment
5.5.21 In our opinion, the physical environment in Shaw District Centre is poor. The pavement along Market Street is uneven. Some of the vacant units in Shaw are dated and in need of renovation, and there is also a prevalence of cleared sites surrounding the centre, which give the impression of a lack of activity.
5.5.22 Whilst the market stalls are only present one day a week they are of low quality. The location and orientation of the market stalls serves to narrow the street as people can only access the stalls from one side of Market Street.
5.5.23 Shaw also suffers from a lack of pedestrianisation. One side of Market Street is a bus and cycle lane which means that vehicular traffic is relatively high in this area.
5.5.24 More positively, we noted that the cleanliness of the centre was good and there were very few examples of litter or graffiti at the time of our visit.
5.5.25 There are two listed buildings within Shaw, including the Grade II* listed Crompton War memorial. Shaw is not covered by any conservation areas.
Balance between Independent and Multiple Stores
5.5.26 There is a good balance between national multiple retailers and independent operators within Shaw District Centre.
Evidence of Barriers to Business
5.5.27 In relation to the supply of units there are no significant local barriers as there is a high number of vacant units. However, commercial retail rents in Shaw are higher than other district centres in the Borough.
5.5.28 Perceived demand in Shaw is low as evidenced by a large number of vacant units and low pedestrian footfall during our visit to the centre.
Extent of Evening and Night-time Economy Offer
5.5.29 The evening economy is largely focused around Market Street and Rochdale Road. However, the number of restaurants is low and an increased provision of restaurants within Shaw would attract a wider audience including families.
Summary
5.5.30 On the whole, Shaw District Centre is not performing well and has declined in health since the 2009 Study. The proportion of vacant units has increased significantly and is well above the national average. The physical environment has experienced a gradual decline and is no longer attractive.
5.5.31 Notwithstanding the overall conclusion outlined above, the proportion of convenience goods and comparison goods retailers is similar to what would be expected for a centre of this size. The retail rents typically commanded by units within Shaw are above other similar-sized centres. Furthermore, Shaw is easily accessible by car, bus and tram.
5.6 Royton District Centre
5.6.1 Royton District Centre is concentrated around Market Square, a pedestrianised square within the middle of the centre which is bordered by more recent development, including the units accommodating Co-op Food and Lidl. The centre also extends along Rochdale Road and Middleton Road. The state-of-the-art Royton Leisure Centre, opened in 2015, is located on the edge of the town centre. In terms of comparison goods shopping, Royton draws the majority of trade from residents of Zone 2 (Royton), Zone 9 (Rochdale South) and Zone 1 (Shaw). The centre’s key roles include:
35
Convenience retail shopping – there are two medium-sized foodstores in Royton, Lidl on Croft Head (2,640 sq.m) and Co-op Food on Rochdale Road (1,090 sq.m). These facilities are supported by a few small convenience retail outlets including bakers, butchers, off-licences and convenience stores. Royton also accommodates a market which operates every Thursday and is located at Market Square. The market contains over 20 stalls and sells a variety of fresh food such as meat, cheese, bread and fruit.
Comparison retail shopping – the provision of national multiple comparison retailers is limited to Card Factory, Lloyds Pharmacy, Scrivens Pharmacy, Specsavers and Thomas Cook6. There is also a good spread of independent shops selling a range of comparison retail goods.
Services – including one financial service, 14 restaurants/cafés and 13 hairdressers/beauty parlours.
Entertainment – including eight bars/public houses.
Community Facilities – including three dental surgeries, a church, Royton Leisure Centre, and a library.
Figure 5.5 View to the south from Rochdale Road
6 Since our visit to Royton District Centre, Thomas Cook has entered liquidation. Subsequently, Thomas Cook has been acquired by Hays Travel. The Thomas Cook in Royton has now been rebranded as Hays Travel.
36
Figure 5.6 View of Market Square
Previous Findings
5.6.2 The 2009 Study found that the performance of Royton was improving and there was a lower than average vacancy rate. There was above-average convenience retail provision and below average provision of comparison retailers, which would be expected for a centre of this size. However, the 2009 Study found that the centre was dated and in need of regeneration.
Diversity of Uses
5.6.3 Royton has a total of 81 retail/service units, with an aggregate floorspace of 11,040 sq.m gross. The diversity of uses present in Royton in terms of the number and proportion of units and floorspace is set out in Table 5.5, compared with the Goad national average.
Table 5.5 Diversity of Uses Table for Royton District Centre
Source: Stantec Survey and Goad Experian (for current National averages)
37
5.6.4 The proportion of comparison goods retail units is 5.0 percentage points below the national average and the proportion of comparison goods floorspace is 26.6 percentage points below the national average. The relatively low representation by comparison goods retailers is somewhat expected in a centre of this size which mainly serves the local population. It is also worth noting that, for the purpose of Goad data, both Lidl and Co-op Food are categorised as convenience goods retailers only. However, in reality these retailers also sell some comparison retail goods.
5.6.5 The proportion of convenience retail units in Royton is 6.1 percentage points above the national average and the proportion of convenience retail floorspace is 25.2 percentage points above the national average. The proportion of convenience retail provision has increased since the 2009 Study, which is due to Lidl opening in Royton.
5.6.6 The provision of convenience goods retailers within Royton is dominated by Lidl and Co-op Food, which together account for 77 per cent of convenience retail floorspace within the centre. Royton also contains four bakers, a butcher and a delicatessen.
5.6.7 The proportion of retail service units and floorspace in the centre is above the national average. This is driven by a higher than average provision of hairdressers.
5.6.8 The proportion of professional service units and floorspace are below the national average.
5.6.9 The proportion of food and drink outlets is similar to the national average. There are six fast-food and take-away units, four restaurants and three cafés within Royton.
Proportion of Vacant Property
5.6.10 According to our survey, the proportion of vacant units and floorspace are both below the national average (by 4.2 and 4.1 percentage points respectively), which is a sign of positive health and is in contrast with the vacancy position in Shaw. Since the 2009 Study, the percentage of vacant units has decreased slightly whereas the percentage of vacant floorspace has increased.
5.6.11 Of the seven vacant units, four are located on Rochdale Road and three are located in Market Square. Goad plan data indicates that vacant floorspace currently totals 850 sq.m gross. The largest vacant units are located at 90-94 Rochdale Road (200 sq.m), 2-4 Market Square (190 sq.m) and 2 Rochdale Road (150 sq.m). The remaining vacant units are small; all are less than 110 sq.m, with an average floorspace of 78 sq.m.
5.6.12 The vacancy rate has remained fairly static since the 2009 Study, which found there to be eight vacant units with a floorspace of 530 sq.m. This means that the number of vacant units decreased by only 1 unit and the amount of vacant floorspace has increased by 320 sq.m gross between 2009 and 2019.
Retailer Representation
5.6.13 Royton contains the following national multiple operators: Betfred, Card Factory, Coral, Lloyds Pharmacy, Scrivens Pharmacy, Specsavers, Hays Travel and William Hill.
5.6.14 Royton Market is located within Market Square and operates every Thursday. The market has a strong fresh food offer. When surveyed there were no vacant stalls and there was very high pedestrian footfall, which is another indicator of positive health.
5.6.15 The centre’s food and drink offer mainly comprises public houses (Duke of Edinburgh, Railway Hotel and Hope & Anchor Inn); bars (Gin & Juice, Rumours and Scoobys); restaurants (Simla Inn, Jing, Fusion and Istanblue); and cafés (Shelly B’s Bites, Park and the Latte Lounge).
Accessibility & Pedestrian Flows
5.6.16 Royton is highly accessible by car. The centre is located off the A671 and there are three Council car parks within Royton which are either free or reasonably priced.
5.6.17 Market Square is the focal point of Royton and is the only pedestrianised area of the centre. Royton is located across the crossroads between Oldham Road and Middleton Road. In most parts of the centre, pavements are sufficiently wide to allow for pedestrian access.
38
5.6.18 During our survey, we found that pedestrian activity was largely concentrated around Market Square. It is worth noting that we surveyed the centre on a Thursday when the market was in operation and we would expect footfall to be lower on non-market days. There was also concentrations of pedestrian activity outside and close to Co-op and Lidl.
5.6.19 In terms of public transport, Royton District Centre is accessible by bus services which provide services to Oldham, Ashton-under-Lyne, Middleton and elsewhere. Bus services in Royton are fairly regular running every 20 minutes, at peak times, and operating between 7.00am and midnight.
Perception of Safety and Occurrence of Crime
5.6.20 Royton benefits from high pedestrian activity and a number of uses which will encourage activity into the evening and night-time. The centre is well designed and accommodates active frontages and wide-open footpaths. The majority of areas within the centre benefit from natural surveillance. The centre also benefits from a good provision of street lighting.
Physical Environment
5.6.21 The physical environment in Royton could be improved. The units located within Market Square are dated and would benefit from renovation. Most of the market stalls appear to be poor quality and significantly restrict movement within Market Square.
5.6.22 There are no listed buildings within Royton, which is not covered by a conservation area.
Balance Between Independent and Multiple Stores
5.6.23 As mentioned above, there are some national multiple retailers present in Royton, as well as a large number of independent retailers selling a variety of goods to service the local population.
Evidence of Barriers to Business
5.6.24 In relation to supply of units, there do not appear to be any significant local barriers, given the presence of a few vacant units and the commercial retail rents are largely comparable to other nearby district centres in Oldham Borough.
Extent of Evening & Night-time Economy Offer
5.6.25 The evening economy is largely focused around Middleton Street and Market Square. There is a good proportion of restaurants present within Royton which will help attract a wider audience including families.
Summary
5.6.26 The physical environment could be improved through the renovation of Market Square. Notwithstanding this, Royton District Centre is relatively healthy and performing well. The centre is anchored by two medium-sized foodstores. The vacancy rate is low and has remained below the national average since the 2009 Study. The centre has a good representation of retailers, a reasonable level of evening economy uses and a thriving market. Commercial retail rents are comparable to other district centres in Oldham Borough and the centre is easily accessible by car.
5.7 Uppermill District Centre
5.7.1 Uppermill District Centre is the most eastern of the centres within the Borough and is located on the edge of the Peak District National Park. Uppermill is a linear centre located along High Street (A670). No part of the centre is pedestrianised. Uppermill Civic Hall and Leisure Centre are also located on the edge of Uppermill District Centre. Uppermill draws two-thirds of its non-food trade from residents of Zone 6 (Uppermill) along with a smaller proportion of trade
39
drawn from residents of Zone 5 (Lees), Zone 1 (Shaw) and Zone 2 (Royton). The centre’s key roles include:
Convenience retail shopping – there is a Co-op convenience store on High Street (310 sq.m). Uppermill also accommodates a Farmers Market on the second Sunday of every month, which is held within the car park of the Museum and sells local produce and fresh meat.
Comparison retail shopping – there are no national multiple comparison goods retailers in Uppermill. There are, however, independent shops selling a range of comparison retail goods.
Services – including one bank, 14 restaurants/cafes and eight hairdressers/beauty parlours
Entertainment – including six bars/public houses.
Community Facilities – including a library and a museum.
Figure 5.7 View to the north along High Street
40
Figure 5.8 View to the south along High Street
Previous Findings
5.7.2 The 2009 Study found that Uppermill was performing well. The proportions of comparison and convenience goods retail in the centre were found to be broadly comparable to the national average, and the proportion of vacant units and floorspace was significantly below the national average. The 2009 Study found that Uppermill was a very attractive centre.
Diversity of Uses
5.7.3 Uppermill has a total of 68 retail/service units, with an aggregate floorspace of 5,500 sq.m gross. The diversity of uses present in Uppermill in terms of the number and proportion of units and floorspace is set out in Table 5.6, compared with the Goad national average.
Table 5.6 Diversity of Uses Table for Uppermill District Centre
Uppermill District Centre – Diversity of uses
Category No. of units
Per cent of units
UK per cent
Floorspace sq.m
Floorspace per cent
UK per cent
Comparison (A1)
30 44.1 37.1 2,330 42.4 42.7
Convenience (A1)
8 11.8 10.0 690 12.6 18.6
Retail Services (A1)
10 14.7 13.4 670 12.1 6.7
Professional (A2)
4 5.9 7.6 310 5.6 6.2
Food and Drink (A3-A5)
14 20.6 17.9 1,240 22.6 13.2
Miscellaneous 0 0 1.2 0 0 0.9 Vacant 2 2.9 12.8 260 4.7 11.8 Total 68 100 100 5,500 100 100 Source: Stantec Survey and Goad Experian (for current national averages)
5.7.4 The proportion of comparison goods retailers (44.1 per cent) is above the national average (37.1 per cent) and proportion of comparison goods floorspace (42.4 per cent), is almost identical to the national average (42.7 per cent).
41
5.7.5 The proportion of convenience goods retailers in Uppermill District Centre (11.8 per cent) is slightly higher than the national average (10.0 per cent). However, the proportion of floorspace occupied by convenience goods retailers (12.6 per cent) is below the national average (18.6 per cent).
5.7.6 The proportion of retail service units in Uppermill is broadly comparable to the national average, whereas the proportion of retail service floorspace in Uppermill is above the national average. Retail service units are dominated by hairdressers and beauty salons.
5.7.7 The proportion of professional service units and floorspace is similar to the national average.
5.7.8 The proportion of food and drink outlets, and the proportion of the centre’s overall floorspace that is accounted for by food and drink outlets, are well above the national average. Both Shalimar and Dinnerstone occupy relatively large restaurant units in Uppermill.
Proportion of Vacant Property
5.7.9 According to our survey, the proportion of vacant units in Uppermill is extremely low at 2.9 per cent, when compared with the national average of 12.8 per cent. The proportion of vacant floorspace, at 4.7 per cent, is less than half the national average of 11.8 per cent.
5.7.10 There are just two vacant units in Uppermill – 113 High Street (180 sq.m) and 2 New Street (80 sq.m). Both of these units were being actively marketed at the time of our survey and are small but appeared to be of high quality and are unlikely to be vacant for long.
5.7.11 In comparison, the 2009 Study found there to be 4 vacant units with a floorspace of 300 sq.m. This shows that the number of vacant units has decreased by two units and the amount of vacant floorspace has decreased by 40 sq.m gross between 2009 and 2019. Accordingly, the vacancy rate in Uppermill was low in 2009 and has reduced even further in the past decade, indicating that Uppermill has remained a healthy centre.
Retailer Representation
5.7.12 The only national multiple retailer within Uppermill is Co-op Food.
5.7.13 The centre’s food and drink offer mainly comprises public houses (Commercial Hotel, Waggon Inn, Granby Arms and Hare and Hounds); restaurants (Dinner Stone, Muse and Shalimar); and cafés (Cellar Pot, Fika, The Vintage Cupcake Kitchen, Wildberries, Caffee Grande Abaco and Weaver Wilde).
Accessibility and Pedestrian Flows
5.7.14 Uppermill is highly accessible by car. The centre is located along the A670 and there are six Council owned car parks within the centre. The only public transport serving Uppermill is buses. There are a series of bus stops located along High Street as well as a bus turning area. Bus services are regular within Uppermill, with a bus approximately every 15 minutes, at peak times, with services operating between 5.30am and 11.30pm.
5.7.15 During our survey, we noted that pedestrian activity was very high.
Perception of Safety and Occurrence of Crime
5.7.16 Uppermill benefits from both high pedestrian and vehicle activity. The centre also benefits from a good provision of streetlights and a number of evening and night-time uses. Given the above context, we perceive the centre to be safe and secure.
Physical Environment
5.7.17 The physical environment within Uppermill District Centre is attractive. There are some examples of high quality architecture including Uppermill Methodist Church and Saddleworth Museum and Gallery at either end of the centre.
42
5.7.18 However, High Street is somewhat constrained by its historical context and the pavement along High Street is very narrow in places. The A670 is a major road and is very congested during rush hour, which negatively impacts the environment.
5.7.19 The centre is wholly within the bounds of the Uppermill Conservation Area. There are also 15 listed buildings within the centre all of which are Grade II listed.
Balance Between Independent and Multiple Stores
5.7.20 There are no national multiple retailers present within Uppermill, with the exception of Co-op Food. There is a wide range of independent retailers offering a good range of high-quality goods.
Evidence of Barriers to Business
5.7.21 There is currently only two units vacant within the centre which is somewhat restrictive but also a sign of strong health and high demand.
5.7.22 Perceived demand in the centre is very high as evidenced by the number of occupied units and the good levels of pedestrian footfall.
Extent of Evening and Night-time Economy Offer
5.7.23 For a centre of this size, Uppermill has a good offering of evening and night-time uses. There is a wide range of restaurants, public house and bars which extend the offering into the night-time.
Summary
5.7.24 Uppermill is performing very well and is a healthy centre. The centre is almost fully occupied, with there being just two vacant units present. Uppermill is attractive with a relatively high proportion of comparison goods retailers. The centre is covered by a conservation area and contains a high number of independent retailers. Uppermill also has a reasonable evening economy and a low crime rate.
5.8 Lees District Centre
5.8.1 Lees District Centre is a linear centre located along High Street (A669). The centre extends from the Post Office in the West to the Red Lion public house in the East. The secondary shopping area is located along Thomas Street, leading south from the High Street. In terms of comparison goods shopping, Lees draws 77 per cent of trade from residents of Zone 5 (Lees), with a small amount of trade drawn from residents of Zone 6 (Uppermill), Zone 2 (Royton) and Zone 7 (Oldham East). The centre’s key roles include:
Convenience retail shopping – the convenience retail provision in Lees comprises a newsagent, a butcher and a baker. There is also a Co-op foodstore located on the edge of the centre.
Comparison retail shopping – there are no national multiple comparison goods retailers present within Lees. There is a range of independent retailers selling comparison goods.
Services – 11 hairdressers/barbers/beauty parlours, a dental surgery and a tattoo parlour.
Entertainment – including two public houses, a library, a bar and a gym.
43
Figure 5.9 View to the east along High Street
Figure 5.10 View to the west along High Street
Previous Findings
5.8.2 The 2009 Study found that there was a below average provision of comparison and convenience goods retailers within Lees District Centre, and an above average provision of services. The vacancy rate in terms of units and floorspace was below the national average. The 2009 Study found the centre to be attractive with little to no evidence of graffiti or litter.
Diversity of Uses
5.8.3 Lees District Centre contains a total of 58 retail/service units. The diversity of uses present in Lees, in terms of number and proportion of units, is set out in Table 5.7, compared with the Goad national average. There is no floorspace data available for Lees as no Goad plan is available for the centre.
44
Table 5.7 Diversity of Uses Table for Lees District Centre
Source: Stantec Survey and Goad Experian (for current national averages)
5.8.4 It is worth noting that due to the size of the centre the diversity of uses results are less meaningful than for larger centres and the change in categorisation from one use to another can create a large swing in proportion. As such, limited weight can be given to the comparison with national averages.
5.8.5 There are 14 comparison goods retailers within Lees. There are just three convenience goods units, but a Co-op foodstore is located on the edge of the centre. There are 16 retail service units present in the centre including a high provision of hairdressers, barbers and beauty parlours. There are 7 professional services units including a good provision of financial services and estate agents. There are 12 food and drink units which are mainly made up of cafés and takeaways.
Proportion of Vacant Property
5.8.6 There are just five vacant units within Lees District Centre, the majority of which are located on High Street. The former Swan public house is the largest vacant unit.
Retailer Representation
5.8.7 There are no national multiple retailers present in Lees District Centre. However, as noted above, there is a Co-op store on the edge of the centre.
5.8.8 The centre’s food and drink offer comprises takeaways (Lucky Fortune, Selwyn’s Fish and Chips, Village Pizza and Lees Tandoori), cafés (Madhatter’s Tearoom and Village Tea Room) and restaurants (Massala Indian and La Bella).
Accessibility and Pedestrian Flows
5.8.9 Lees is easily accessible by car, being located on the A669. However, car parking is limited with most people utilising the car park adjoining the Co-op store. There are three bus stops located within the centre which provide services to Manchester, Oldham and Huddersfield. Bus services are fairly regular within Lees, approximately every half hour, at peak times, and they operate between 6.45am and midnight. There are no other public transport alternatives, such as tram or train, available in Lees.
5.8.10 A small section of the centre is pedestrianised at Thomas Street precinct. The rest of the high street is separated by the A669 which is a major road and was very busy during our visit. However, there are two light-controlled pedestrian crossings on the high street and a series of pedestrian refuges which encourage movement throughout the centre. Pavement width varies throughout the centre, but in most areas is sufficiently wide to allow people to pass each other.
45
5.8.11 During our survey, we noted that pedestrian footfall was high. The cafés around St Thomas Street were particularly busy.
Perception of Safety and Occurrence of Crime
5.8.12 The majority of areas within Lees benefit from natural surveillance. The centre is also dissected by A669 which is a major road and benefits from significant vehicle activity and when surveyed, we observed high pedestrian footfall. The centre benefits from a number of evening and night-time uses which will encourage activity to be extended into the evening. During our survey we perceived the centre to be safe and secure.
Physical Environment
5.8.13 Lees is an attractive centre. The high street benefits from high-quality architectural form and utilises old buildings well. However, the retail units at St Thomas precinct are more modern and are out of place in the context of the wider centre.
5.8.14 There was very little evidence of graffiti or litter within the district centre, which has well maintained street furniture.
5.8.15 Lees has the distinct disadvantage of being dissected by a major road, which has negatively impacted the environment. However, this is somewhat overcome by the number of pedestrian crossings.
5.8.16 There are no listed buildings within Lees and the centre is not covered by a conservation area.
Balance Between Independent and Multiple Stores
5.8.17 There are no national multiple retailers within Lees District Centre. The independent retailers present within Lees serve the needs of the local population.
Evidence of Barriers to Business
5.8.18 In relation to supply of units there are no significant local barriers. There are five vacant units within the centre, and average commercial retail rents are lower than other nearby centres in the area.
5.8.19 Perceived demand in Lees is high, for a centre of this size, with a high pedestrian footfall at the time of our survey.
Extent of Evening and Night-time Economy Offer
5.8.20 There is a high number of evening and night-time uses present within Lees, including several takeaways and restaurants. There are also a couple of public houses and a bar. We consider the provision of evening and night-time uses in Lees to be good for a centre of this size.
Summary
5.8.21 Lees is currently performing well. There are only five vacant units within the centre, and it is easily accessible by car whilst pedestrian footfall was high when surveyed. Lees is an attractive centre with low reported crimes. There are no national multiple retailers within the centre, and parking provision is limited, but that is to be expected for a centre of its size.
5.9 Hill Stores District Centre
5.9.1 Hill Stores District Centre is located approximately 800 metres from the Oldham Town Centre boundary, and is a linear centre located along Huddersfield Road which is anchored by a large Tesco Extra store. In terms of comparison goods shopping, Hill Stores draws the majority of trade from residents of Zone 7 (Oldham East), Zone 6 (Uppermill) and Zone 5 (Lees). The centre’s key roles include:
46
Convenience retail shopping – there is one large foodstore within Hill Stores, Tesco Extra on Bleasby Street, which is clearly a big draw for residents in the local area. There is also a newsagent within Hill Stores.
Comparison retail shopping – there are no national multiple comparison goods retailers present within Hill Stores.
Services – three hairdressers/beauty parlours.
Entertainment – a public house.
5.9.2 The main shopping area is focussed at Hill Stores precinct. There are also secondary shopping areas along Plane Street and Dunkerley Street.
Figure 5.11 View to the south west along Huddersfield Road
47
Figure 5.12 View of Tesco Extra on Huddersfield Road
Previous Findings
5.9.3 The 2009 Study found that Hill Stores was reasonably healthy. The centre was deemed to be fairly accessible by car; however, problematic for people to travel around the centre by foot. The centre was perceived to be safe. There was a below average provision of comparison goods retailers, which was expected for a centre of this size. The vacancy rate was slightly higher than the national average.
Diversity of Uses
5.9.4 Hill Stores has a total of 31 retail/service units. The diversity of uses present in Hill Stores District Centre, in terms of number and proportion of units, is set out in Table 5.8 below.
Source: Stantec Survey and Goad Experian (for current national averages)
48
5.9.5 Given that Hill Stores and each of the other remaining centres accommodates fewer than 50 units we do not believe there is merit in comparing the proportion of existing uses with the national average. Instead, we concentrate on the composition of each of the categories of uses.
5.9.6 The comparison goods retail provision in Hill Stores comprises a number of independent retailers and a national charity shop. The convenience goods retail provision within the centre is dominated by the Tesco Extra, which is complemented by an e-cigarette shop and a newsagent.
5.9.7 The provision of retail services within Hill Stores comprises hairdressers and barbers. The majority of food and drink outlets with the centre are takeaways, including Domino’s, Subway and Pizza Hut, as well as one restaurant.
5.9.8 There are no professional services present within Hill Stores District Centre.
Proportion of Vacant Property
5.9.9 A total of six units are vacant within Hill Stores, which is the same level of unit vacancy that was identified in the 2009 Study.
Retailer Representation
5.9.10 For a centre of this size, Hill Stores contains a large number of national multiples, including Tesco Extra, Subway, Domino’s, Pizza Hut, William Hill and Ladbrokes.
5.9.11 The District Centre’s food and drink offer mainly comprises takeaways (Taj Mahal, Jackie Chans, Ha’jeera, Kassys, Domino’s, Subway and Pizza Hut), cafés (Roy’s Rolls, The Café) and a restaurant (Sizzling Steakhouse).
Accessibility and Pedestrian Flows
5.9.12 Hill Stores is easily accessible by car, being located on the A62 and A672. There are two large free car parks located within the centre, as well as bus stops which provide services between Oldham and Ashton-under-Lyne. Bus services within Hill Stores are regular with services approximately every 15 minutes, at peak times, operating between 5.30am and midnight.
5.9.13 Oldham Mumps tram stop is located approximately 800 metres south west of Hill Stores, which provides services between Didsbury, Trafford Bar, Manchester Victoria and Rochdale.
5.9.14 The centre is divided by the A62. Due to the busy nature of the road there are a series of pedestrian barriers to restrict informal crossing of the road. There is one light-controlled crossing of the A62 within the centre and, on the whole, pedestrian movement through the centre is restricted.
5.9.15 During our survey we noted that pedestrian footfall was very low, apart from outside of the Tesco Extra superstore, which has its own car park. The layout of the car park and pavement orientation does not encourage linked trips with the rest of the centre.
Perception of Safety and Occurrence of Crime
5.9.16 During our survey, most of the centre felt safe and secure. However, there were some areas, particularly to the rear of the Tesco Extra superstore, which could be improved as there is no natural surveillance of this area.
Physical Environment
5.9.17 The physical environment within Hill Stores District Centre is largely positive. However, some of the vacant units within the centre are of poor quality and are in need of renovation. Some of the buildings and land to the south of the centre, to the rear of the Tesco Extra superstore, are of particularly poor quality.
49
5.9.18 The Grade II listed Oldham Equitable Co-operative Society Buildings is located within Hill Stores. No part of the district centre is covered by a conservation area.
Balance between Independent and Multiple Stores
5.9.19 There is a high number of national multiple operators present in Hill Stores, alongside a few independent stores, which cater for the needs of the local population.
Evidence of Barriers to Business
5.9.20 There are no significant local barriers, with there being six vacant units within the centre, but commercial retail rents are higher in Hill Stores than Failsworth, for example.
Extent of Evening and Night-time Economy Offer
5.9.21 The evening economy largely comprises takeaways. Whilst this will help generate some activity, takeaways will not encourage people to stay in Hill Stores for a significant amount of time. There is also one public house and one restaurant in the centre but, overall, the evening/night-time economy is weak.
Summary
5.9.22 Hill Stores is reasonably healthy and is performing as expected for a small district centre. The centre is dominated by a Tesco Extra superstore, which draws trade from residents across a wide area. Hill Stores is accessible by car and tram and crime rates in and around the centre are low.
5.9.23 Hill Stores would be vulnerable if Tesco was to leave the centre. The centre has a high number of takeaways, which draws visitors to the centre but does not necessarily lead to linked trips to retail facilities with other businesses in Hill Stores. The physical environment could be improved by providing more pedestrian crossing points along the A62.
5.10 Chadderton District Centre
5.10.1 Chadderton District Centre is anchored by an Asda foodstore. Chadderton Sports Centre and Chadderton Library and Wellbeing Centre are located to the west of the district centre. In terms of comparison goods shopping, Chadderton draws half of its non-food trade from residents of Zone 3 (Chadderton), with further trade being drawn from residents of Zone 8 (Oldham West) and Zone 9 (Rochdale South). The centre’s key roles include:
Convenience retail shopping – the convenience provision in Chadderton is dominated by the Asda foodstore on Milne Street. Heron Foods, Home Bargains, Farmfoods and Quality Frozen Food are also present within Chadderton.
Comparison retail shopping – Boots is the only national multiple comparison goods retailer within Chadderton. There are some smaller independent comparison goods retailers present in the centre.
Services – a beauty parlour, an optician and a post office.
Entertainment – a public house and a play centre.
50
Figure 5.13 View of Chadderton Precinct
Figure 5.14 View of Chadderton Town Hall
Previous Findings
5.10.2 The 2009 Study found there to be an above average provision of convenience goods retailers and a below average provision of comparison goods retailers. The 2009 Study also found there to be an above average provision of services and the vacancy rate was lower than the national average. The centre was considered to be reasonably well-looked after in 2009.
Diversity of Uses
5.10.3 Chadderton has a total of 23 retail/service units. The diversity of uses present in Chadderton, in terms of number and proportion of units, is set out in Table 5.9 below.
51
Table 5.9 Diversity of Uses Table for Chadderton District Centre
Source: Stantec Survey and Goad Experian (for current national averages)
5.10.4 Comparison good retailers in Chadderton District Centre comprise Boots and a number of independent retailers. The provision of convenience good retailers is largely dominated by Asda but also comprises Home Bargains, Farmfoods and Heron Foods.
5.10.5 Retail services provision in the centre comprises a beautician and an optician. The professional services present within Chadderton is made up of two estate agents. Food and drink outlets are limited to Greggs, Chadderton Fish and Chips and Chadderton Bar and Restaurant.
Proportion of Vacant Property
5.10.6 There are just three vacant units within Chadderton.
Retailer Representation
5.10.7 There is a high number of national multiples located in Chadderton relative to the size of the centre, including Asda, Farmfoods, Home Bargains, Heron Foods, Boots, Greggs, Co-op Funeral Care, Ladbrokes and Betfred.
5.10.8 The centre’s food and drink offer comprises two takeaways (Greggs and Chadderton Fish and Chips) and a restaurant (Chadderton Bar and Grill).
Accessibility Pedestrian Flows
5.10.9 Chadderton District Centre is easily accessible by car given its location on Middleton Road (A669) between the A627(M) and the M60. The centre has very good car parking facilities with large car parks at Asda and Farmfoods. Bus stops within the centre provide services between Oldham, Manchester and Rochdale. Bus services are fairly regular, approximately every 30 minutes, at peak times, operating between 6.00am and 11.00pm. There are no tram or train facilities within or close to Chadderton.
5.10.10 Chadderton Precinct is pedestrianised, which provides a safe environment for people to manoeuvre through this part of the centre. However, the southern part of the centre is split from Chadderton Precinct and Asda by the busy A669. When surveyed the road was particularly busy which made it difficult to move around the centre.
5.10.11 During our survey, pedestrian footfall was high around Asda, but was very low in the rest of the centre.
52
Perception of Safety and Occurrence of Crime
5.10.12 There were active frontages in all areas of the centre and activity was greatest around Asda, as mentioned above. The centre accommodates a fish and chip shop, a pub (Sun Mill Inn) and a restaurant (Chadderton Bar and Grill), which will encourage pedestrian activity into the evening and therefore assist with the perception of safety.
5.10.13 Notwithstanding the above, we noted that the quality of street lighting was poor. This meant the perception of safety may worsen during evening and night-time hours.
Physical Environment
5.10.14 Chadderton Precinct is dated and could be improved with modernisation. Middleton Road accommodates some high-quality architecture including the Grade II listed Chadderton Town Hall.
5.10.15 Chadderton is dissected by Middleton Road (A669), which is a busy road. There is a significant amount of surface level car parking, which is positive for shoppers and visitors to Chadderton. However, this encourages Chadderton to be car-orientated, which makes the environment a less pleasant experience for people shopping in the centre.
5.10.16 There are four Grade II listed buildings/monuments within Chadderton, but the centre is not within a conservation area.
Balance Between Independent and Multiple Stores
5.10.17 There is a good provision of both national multiple retailers and independent retail outlets present in Chadderton District Centre.
Evidence of Barriers to Business
5.10.18 In relation to supply of units there are no significant local barriers and there are currently three vacant units within the centre.
Extent of Evening and Night-time Economy Offer
5.10.19 Chadderton accommodates a fish and chip shop, a public house (The Sun Mill Inn) and a restaurant (Chadderton Bar and Grill).
Summary
5.10.20 Chadderton is a small centre anchored by Asda, centred around Chadderton Precinct, and it is reasonably healthy. There are just three vacant units within the centre. Chadderton contains a high proportion of national multiple operators relative to its size. Parking is plentiful in the centre.
5.11 Failsworth District Centre
5.11.1 Failsworth District Centre, which is anchored by Tesco Extra and the Quayside Medical Practice, is the smallest centre within the Borough and is located either side of Rochdale Canal. Failsworth draws more than two-thirds of its non-food trade from residents of Zone 4 (Failsworth). A further nine per cent of the centre’s trade is drawn from residents of Zone 3 (Chadderton). The centre’s key roles include:
Convenience retail shopping – convenience retail provision in Chadderton comprises Tesco Extra and Aldi foodstores.
Comparison retail shopping – is limited to an Age UK charity shop, pharmacies and an optician.
Services – the Quayside Health Centre and library.
53
5.11.2 The centre is anchored by Tesco Extra and Quayside Medical Centre.
Figure 5.15 View of Quayside Medical Centre
Figure 5.16 View of KFC
Previous Findings
5.11.3 The 2009 Study found the centre to be performing as expected for a small district centre. There was just one vacant unit present in Failsworth at the time of the previous study, and the centre was found to be relatively attractive with high footfall.
Diversity of Uses
5.11.4 Failsworth contains just eight retail/service units. The diversity of uses present in Failsworth, in terms of number and proportion of units, is set out in Table 5.10, compared with the Goad national average.
54
Table 5.10 Diversity of Uses Table for Failsworth District Centre
Source: Stantec Survey and Goad Experian (for current National averages)
5.11.5 Failsworth contains two pharmacies, an optician, an Age UK charity shop, Aldi and Tesco Extra foodstores, Hays Travel and a KFC.
Proportion of Vacant Property
5.11.6 There are no vacant units within Failsworth District Centre.
Retailer Representation
5.11.7 As mentioned above, there are a few national multiples located in Failsworth including Aldi, Tesco Extra, Hays Travel and KFC.
Accessibility and Pedestrian Flows
5.11.8 Failsworth is easily accessible by car, being located on Oldham Road (the A62). The centre contains a few large surface-level car parks, all of which are free to use for customers. Failsworth tram station is located approximately 0.5km north west of the centre and provides services between Didsbury and Rochdale.
5.11.9 There is a very good bus service operating from the bus stop at Failsworth Liberal Club to the north east of the centre. Bus services operate between Manchester and Oldham. There is a bus approximately every 15 minutes, at peak times, starting at 4.30am and finishing at midnight.
5.11.10 There is a precinct of shops within the middle of the centre which is pedestrianised. Elsewhere, all of the units have their own dedicated car parks. The centre is split into two sections by a canal.
5.11.11 During our survey, pedestrian footfall was particularly high around Tesco Extra (as would be expected), but there was also high footfall throughout the rest of the centre.
Perception of Safety and Occurrence of Crime
5.11.12 During our survey, all areas of the centre felt safe and secure due to a high level of pedestrian and vehicle activity and active frontages overlooking the centre.
5.11.13 Tesco and Aldi each has extended opening hours, which will encourage activity within the centre into the evening and night-time hours.
55
Physical Environment
5.11.14 Failsworth is a modern and attractive centre, adjacent to a canal, but the centre is very car dominated and it is difficult to cross between both sections of the centre. Some consideration could be given to developing better connections across the canal.
5.11.15 There are no listed buildings within the centre, albeit the Grade II listed Regent Mill adjoins the centre.
Balance Between Independent and Multiple Stores
5.11.16 There are a number of national multiples present within Failsworth District Centre. The independent retailers are associated with the nearby Quayside Medical Centre.
Evidence of Barriers to Business
5.11.17 The supply of units is restricted as there is 100 per cent occupancy within Failsworth.
Extent of Evening and Night-time Economy Offer
5.11.18 The evening and night-time economy is somewhat limited, but this should be expected given the size of the centre and the presence of KFC will attract visitors into the later hours.
Summary
5.11.19 Failsworth is the smallest district centre within Oldham Borough and contains just eight units. The centre is anchored by Tesco Extra and contains a high proportion of national multiple operators. There are no vacant units within the centre, which is reasonably attractive and is easily accessible by car and tram. When compared against key performance indicators, the centre is more than satisfactory . Failsworth is performing well and is a healthy centre. The centre is somewhat disjointed but serves a purpose and meets a local need.
5.12 Stakeholder Engagement
5.12.1 In order to inform the qualitative retail and leisure needs assessment, we engaged with key stakeholders as agreed with Oldham Council. The key stakeholders identified by the Council include store and restaurant managers; leisure operators; Oldham Theatre; Oldham Museum; Oldham Youth Council; Market and Town Centre Manager; Landowners; and Council co-ordinators for each of the centres.
Communication with Stakeholders
5.12.2 Contact details for the stakeholders were provided by the Council. Each stakeholder was then contacted via email, informing them of the Retail and Leisure Study and asking for their feedback about the main centre they represent. The email invited comments concerning Oldham, Chadderton, Failsworth, Royton and Uppermill (stakeholders within the other district centres were not identified).
5.12.3 Where we did not receive a response via email, we telephoned the stakeholders to undertake the questionnaire via telephone.
5.12.4 It is worth noting that we did not receive a response from key stakeholders with an interest in Uppermill District Centre.
Feedback Received
Oldham Town Centre
5.12.5 The majority of stakeholders considered that Oldham Town Centre is performing moderately, whilst a couple of stakeholders considers that the town centre was performing poorly. The
56
feedback received suggested that Oldham has a good retail offer for a centre of its size and is “holding its own” in a difficult retail climate. Stakeholders also responded positively about the amount of leisure facilities available within the town centre and noted there has been a recent improvement in these facilities.
5.12.6 However, stakeholders were concerned about the amount of crime and anti-social behaviour within the town centre. Stakeholders suggested anti-social behaviour was discouraging people from visiting the town centre. A minority of stakeholders noted there was a concentration of vacant units in certain areas of the town, most notably to the east of the town centre.
5.12.7 The stakeholders’ response to the question regarding accessibility by different forms of transport were varied but largely positive. There were a few specific comments, i.e. some of the signage is confusing; and that it is not possible to pay for parking by mobile phone.
5.12.8 Once again, the responses to the questions regarding the business offer within the town centre were varied but largely positive. One thing to note is that the majority of stakeholders said the number of independent retailers was poor, but the quality of existing independent retailers was good. The majority of stakeholders also found the number of fast-food takeaways to be good; however, their quality was poor.
5.12.9 The majority of stakeholders found the quality, cleanliness and safety of the public realm to be average or good. Similarly, the amount and range of events taking place in the town centre was also found to be good.
5.12.10 All stakeholders said more independent/specialist retailers would improve the town centre. Other popular answers for improving the town centre included an increased choice/range of shops; more national multiples; foodstores in the town centre; more quality restaurants/pavement cafés; and more public toilets.
5.12.11 Most stakeholders said internet sales were the main barrier to trading performance within the town centre. A large proportion of stakeholders also said a poor town centre environment was the main barrier to trading performance.
5.12.12 The stakeholders identified Manchester, the Trafford Centre and Bury as the main competitors to Oldham Town Centre.
5.12.13 Finally, when asked if they could change one thing/see one thing happening in the town centre and what it would be, the stakeholders identified two key themes. The first is to attract more non-retail uses to the centre and utilise vacant buildings. Some suggested more leisure uses and others suggested restaurants or street cafés. The second theme identified is a greater police presence and clamping down on anti-social and/or criminal behaviour.
Chadderton District Centre
5.12.14 Stakeholders considered that Chadderton District Centre is performing moderately, however, they considered that there were too many betting and charity shops and not enough independent retailers e.g. butchers, greengrocers etc.
5.12.15 Stakeholders generally found that accessibility to the centre was ok but identified the need for an additional pedestrian crossing and the need for better transport links to south Chadderton.
5.12.16 The number and quality of services such as hairdressers and banks was found to be poor, as well as the number of independent retailers. The stakeholders found the cleanliness and attractiveness of the public realm to be poor and the number of events held to be poor.
5.12.17 A number of improvement measures were identified largely around improving/maintaining the public realm and providing a greater range of shops including independent retailers. Accessibility by public transport was also identified as a key improvement stakeholders would like to see. It was suggested a masterplanning exercise was required for the centre.
5.12.18 Finally, Oldham, Royton and Manchester were all identified as the biggest competitors to the centre.
Failsworth District Centre
5.12.19 Stakeholders considered that Failsworth District Centre is performing very well.
57
5.12.20 Stakeholders largely found the accessibility of the centre to be very good, as well as the range of business on offer. They also concluded that the public realm was average in terms of attractiveness, cleanliness and safety.
5.12.21 Stakeholders considered that street paving and signposting could be improved, as well as offering more quality restaurants/street cafés. They also raised the need to clean the streets more often.
5.12.22 Anti-social behaviour was identified as the main barrier to trading performance within Failsworth. In terms of improvement they concluded the district centre could be made more welcoming by improving signage, way finding and making improvements to the public realm.
5.12.23 Finally, the centre was deemed to be modern and providing a good range of services and facilities. Oldham was identified as the main competitor for Failsworth.
Royton District Centre
5.12.24 Stakeholders in Royton concluded that the town centre was performing well. Stakeholders identified an issue with anti-social behaviour linked to the drinking establishments.
5.12.25 In terms of accessibility stakeholders considered that on paper the centre was well-served by public transport; however, the bus service was deemed to be unreliable. They also said the amount of car parking was good but perceived to be poor by those using the centre. They also concluded the amount and quality of business on offer was good.
5.12.26 In terms of the public realm, they concluded it was safe but needed substantial investment. Similarly, in terms of improvements higher quality built environment and street paving were noted as a priority. Improved public transport was also identified as a required improvement.
5.12.27 People’s shopping habits were identified as the main barrier to trading performance. Stakeholders said that people like high street retail but do not change their spending patterns to reflect this. They concluded people were more likely to use and out-of-town retail parks or shop online.
5.12.28 Oldham Town Centre was identified as the biggest competitor to Royton, albeit stakeholders acknowledged both centres provide a different offering.
6.1.1 In this section, we utilise the results from the household telephone survey to identify the current patterns of comparison and convenience retail and leisure spending by study area residents. The findings can also be compared to the results from the previous household survey to indicate how shopping patterns have changed over time.
6.2 Household Survey Methodology
6.2.1 The telephone survey of households which informed the Council’s previous retail capacity study was undertaken in August 2008. Our assessment of current shopping patterns is therefore based on a new telephone survey of 1,000 households undertaken in November / December 2019 by NEMS Market Research.
Study Area
6.2.2 The study area – as shown on the plan in Appendix A – is based on postcode sector boundaries and is the same as the study area used for the 2009 Study. The constituent postcode sectors are detailed in Table 6.1 below.
Table 6.1 Oldham Study Area
Zone Geography Postcode sectors
Zone 1 Shaw OL1 4, OL2 7, OL2 8
Zone 2 Royton OL1 2, OL2 5, OL2 6
Zone 3 Chadderton M24 1, OL9 0, OL9 8, OL9 9
Zone 4 Failsworth M35 0, M35 9, OL8 3
Zone 5 Lees OL4 3, OL4 4, OL4 5
Zone 6 Uppermill OL3 5, OL3 6, OL3 7
Zone 7 Oldham East OL1 1, OL1 3, OL4 1, OL4 2
Zone 8 Oldham West OL8 1, OL8 2, OL8 4, OL9 6, OL9 7
Zone 9 Rochdale South OL11 2, OL16 3, OL16 4, M24 2, M24 6
6.3.1 The survey questionnaire sought to establish:
patterns of convenience goods spending, based on the location of:
- the store where the household last undertook a main food and grocery shop, the store visited the time before that, the form of transport used, linked trips, the amount spent per week and the frequency of visits to convenience stores (questions 1 to 6);
- the shop where the household last undertook a ‘top-up’ food and grocery shop, the shop visited the time before that, the amount spent per week and linked trips (questions 7 to 9A); and
59
- visiting markets / small shops, their location, the amount spent per week and money spent on food and grocery goods via the internet (questions 10 to 13).
patterns of comparison goods spending, based on the locations of the last purchase of:
- clothes and shoes (questions 14 to 17);
- furniture, carpets or soft household furnishings (questions 18 and 19);
- DIY and decorating goods (questions 20 and 21);
- electrical items, such as TVs, DVD players, digital cameras, MP3 players, mobile phones, computers (questions 22 and 23);
- domestic appliances, washing machines, fridges or cookers (questions 24 and 25);
- health, beauty and chemist items (questions 26 and 27);
- recreational goods, such as sports equipment, bicycles, musical instruments and toys (questions 28 and 29); and
- other non-food items, such as books, CDs, jewellery, china and glass products (questions 30 and 31).
internet shopping patterns, nearest town centre and town centre improvements (questions 32 to 34).
6.3.2 In addition to spending on retail goods, the household survey also sought to identify patterns of spending on leisure services and cultural activities (questions 35 to 47), based on the locations where households spend the most money on:
cinema;
theatre;
pubs / bars;
restaurants / cafés;
nightclubs;
bingo;
health and fitness;
ten pin bowling;
museum / library;
art gallery;
ice rink; and
trampoline centre.
6.3.3 Appendix B reproduces the household survey results and also shows the questions that were asked during the survey.
6.4 Composite Patterns of Spend on Comparison Goods
6.4.1 The population of the study area in 2019 (which covers a wider area than Oldham Borough), disaggregated by zone, is shown in the first row of figures in Spreadsheet 1, Appendix D. The overall population in the 2019 base year amounts to 350,384 persons, which is ONS based. Future population projections to 2037 are based on ONS Sub-National Population Projections.
6.4.2 The per capita spend on comparison goods in 2019 (Spreadsheet 2, Appendix D) varies from a low of £2,583 in Zone 8 to a high of £4,764 in Zone 6. The total amount of comparison
60
goods spending for residents of the whole study area in 2019 is approximately £886.0m (Spreadsheet 3, Appendix D), excluding special forms of trading (internet, catalogue and TV shopping, which we subsequently abbreviate as SFT).
6.4.3 Spreadsheet 4, Appendix D shows the market shares that each zone of the study area achieves in terms of the total spend on comparison retail goods by residents of each zone within the study area, and Spreadsheet 5, Appendix D sets out the pattern of expenditure flows for the comparison goods sector as a whole, as revealed by the household survey.
6.4.4 Table 6.2 below, which is derived from the final two columns of Spreadsheet 5, Appendix D, summarises the main destinations for comparison retail goods expenditure within and outside of the study area. Oldham Town Centre is, by some considerable margin, the main destination for comparison shopping within the study area, attracting £179.5m (20.3 per cent) of comparison retail expenditure available to study area residents. Of the defined centres within Oldham Borough, Chadderton District Centre achieves the second-highest market share within the study area (2.1 per cent, equivalent to £18.4m), followed by Shaw District Centre (1.8 per cent, equivalent to £16.3m).
6.4.5 Overall, some 56.8 per cent of expenditure on comparison goods available to the study area’s residents is spent in town and local centres, or in retail parks and freestanding stores, which are located within the study area. This is known as the aggregate retention rate.
Table 6.2 Broad Destinations for Comparison Goods Expenditure
Destination Expenditure (£m) Expenditure (%)
Oldham Town Centre 179.5 20.3 Chadderton District Centre 18.4 2.1 Shaw District Centre 16.3 1.8 Hill Stores District Centre 14.9 1.7 Failsworth District Centre 12.6 1.4 Royton District Centre 5.3 0.6 Uppermill District Centre 3.8 0.4 Lees District Centre 2.6 0.3 Other destinations within the Study Area 249.4 28.2 Total retained expenditure 502.8 56.8 Total leakage outside of the Study Area 383.2 43.2 Total 886.0 100.0
Source: Spreadsheet 5, Appendix D
6.4.6 Table 6.2 confirms that £383.2m of the comparison retail expenditure available within the study area in 2019, leaks to destinations beyond the study area. The market shares and estimated comparison goods turnovers of the main centres and retail parks / freestanding stores within the study area (that is, all destinations with a market share of 0.4 per cent or more) are set out in the last two columns of Spreadsheet 5, Appendix D and are summarised in Table 6.3 below for ease of reference.
Table 6.3 Comparison Goods Expenditure retained within the Study Area
Expenditure (£m) Expenditure (%)
Defined Centres within the Study Area
Oldham Town Centre 179.5 20.3
Chadderton District Centre 18.4 2.1
Shaw District Centre 16.3 1.8
Hill Stores District Centre 14.9 1.7
61
Expenditure (£m) Expenditure (%)
Failsworth District Centre 12.6 1.4
Mossley Town Centre 5.7 0.6
Royton District Centre 5.3 0.6
Uppermill District Centre 3.8 0.4
Retail Parks and Freestanding Stores within the Study Area
Elk Mill Shopping Park, Royton 176.9 20.0
B&Q, Westhulme Way, Oldham 21.4 2.4
Tesco Extra, Barton Road, Middleton 5.7 0.6
Costco, Broadway 5.2 0.6
Centre Retail Park, Royton 4.4 0.5
Tesco, Featherstall Road North, Oldham 4.3 0.5
Alexandra Retail Park, Oldham 4.2 0.5 Source: Spreadsheet 5, Appendix D
6.4.7 Table 6.3 confirms that Oldham Town Centre is the main comparison shopping destination within the study area, achieving a market share of 20.3 per cent. Oldham is followed by Elk Mill Shopping Park with a market share of 20.0 per cent. The other centres within the study area that achieve a market share of 1 per cent or greater are B&Q at Westhulme Way (2.4 per cent), Chadderton District Centre (2.1 per cent), Shaw District Centre (1.8 per cent), Hill Stores District Centre (1.7 per cent) and Failsworth District Centre (1.4 per cent).
6.4.8 As noted above, less than half (43.2 per cent) of comparison retail expenditure generated by residents of the study area ‘leaks’ to destinations outside of the study area. The main destinations for comparison goods expenditure leakage, again as shown in the last two columns of Spreadsheet 5, Appendix D, are summarised below in Table 6.4. Manchester City Centre attracts £101.9m of the study area’s comparison goods expenditure, equating to a market share of 11.5 per cent.
6.4.9 Ashton-under-Lyne achieves the second highest market share of any defined centre outside of the study area, accounting for £48.2m or 5.4 per cent of all comparison retail expenditure. Other individual destinations outside of the study area that achieve a market share of greater than 1 per cent include Rochdale Town Centre (2.9 per cent), Bury Town Centre (1.8 per cent) and Middleton Town Centre (also 1.8 per cent).
Table 6.4 Main Destinations for Comparison Goods Expenditure Leakage
Defined centres outside of the Study Area Expenditure (£m) Expenditure (%)
Manchester City Centre 101.9 11.5
Ashton-under-Lyne Town Centre 48.2 5.4
Rochdale Town Centre 25.5 2.9
Bury Town Centre 16.4 1.8
Middleton Town Centre 15.9 1.8
Other destinations 175.3 19.8 Source: Spreadsheet 5, Appendix D
6.4.10 The study area’s retention level by zone (see Spreadsheet 4, Appendix D, ‘Total Inside Study Area’ row) varies from a low of 16.7 per cent in Zone 10, which is south of Oldham Borough, to a high of 80.5 per cent in Zone 7, which contains Oldham Town Centre.
62
6.4.11 The localised retention rate is the proportion of expenditure on comparison goods available to residents in a specific zone that is spent in town centres and stores located within that zone. The highest localised retention rate is achieved by Zone 7 (49.6 per cent), which contains Oldham Town Centre (see Spreadsheet D, ‘Zone 7’ column and ‘Total Zone 7’ row), followed by Zone 2 (42.6 per cent), which contains Royton District Centre. The next highest localised retention rate for comparison goods is achieved by Zone 4 (13.4 per cent), which contains Failsworth District Centre, followed by Zone 1 (12.2 per cent), which contains Shaw District Centre and Zone 3 (9.9 per cent), which contains Chadderton District Centre. The localised retention rates for Zones 5, 6, 8, 9 and 10 are equal to, or below, 9 per cent, indicating that there is a relatively broad dispersal of comparison shopping patterns around the study area.
Comparison Goods Market Shares by Centre
6.4.12 Below, we provide a more detailed analysis of the comparison goods market shares achieved by each of the defined centres within the study area, as well as Elk Mill Shopping Park, which, as shown above, is an important destination for comparison goods spending in Oldham Borough.
Oldham Town Centre
6.4.13 Oldham Town Centre achieves a comparison goods market share of 38.2 per cent in its own zone (Zone 7) and market shares of 36.8 per cent and 31.4 per cent in neighbouring Zones 8 and 5, respectively. Oldham Town Centre also achieves a high market share in Zone 1 (27.2 per cent), Zone 3 (25.1 per cent) and Zone 2 (21.5 per cent). Oldham Town Centre achieves a market share below 20 per cent in Zone 6 (19.4 per cent), Zone 4 (12.6 per cent), Zone 9 (7.3 per cent) and Zone 10 (5.4 per cent).
6.4.14 Figure 6.1 shows the percentage share of spending on comparison retail goods in Oldham Town Centre across study area.
63
Figure 6.1: Percentage Share of Spending on Comparison Retail Goods in Oldham Town Centre across Study Area
64
Shaw District Centre
6.4.15 As would be expected, Shaw District Centre achieves its highest comparison goods market share in its own zone (Zone 1), of 12.2 per cent. Shaw District Centre achieves a market share of less than 3 per cent in Zones 2, 3, 5, 6, 7, 8 and 9 and no market share in Zones 4 and 10.
Royton District Centre
6.4.16 Royton District Centre achieves a maximum comparison goods market share in its own zone (Zone 2), of just 4.2 per cent. Royton District Centre achieves a market share of less than 1 per cent in Zones 1, 3, 5, 6, 8 and 9. Royton District Centre does not achieve any market share in Zones 4, 7 and 10.
Uppermill District Centre
6.4.17 Similarly, the maximum comparison goods market share achieved by Uppermill District Centre, of 4.4 per cent, is in its own zone (Zone 6). Uppermill District Centre achieves a market share in just three other zones (Zone 1: 0.5 per cent, Zone 2: 0.4 per cent and Zone 5: 0.8 per cent). Uppermill District Centre does not achieve any market share in Zone 3, 4, 7, 8, 9 and 10.
Lees District Centre
6.4.18 Unsurprisingly, Lees District Centre achieves a maximum comparison goods market share in its own zone (Zone 5) of just 3.1 per cent. This aside, Lees District Centre achieves a market share of 0.6 per cent in Zone 6, 0.2 per cent in Zone 7 and 0.1 per cent in Zone 2. Lees District Centre does not achieve any market share in Zones 1, 3, 4, 8, 9 and 10.
Hill Stores District Centre
6.4.19 Hill Stores District Centre achieves a relatively high comparison goods market share in its own zone (Zone 7) of 10.8 per cent and market shares of 5.9 per cent and 3.9 per cent in Zone 6 (Uppermill) and Zone 5 (Lees) respectively. Hill Stores District Centre achieves a market share of less than 1.5 per cent in Zones 1, 2, 3, 4, 8 and 9 and does not achieve any market share in Zone 10.
Chadderton District Centre
6.4.20 As with Hill Stores, Chadderton District Centre achieves a relatively high comparison goods market share in its own zone (Zone 3) of 8.4 per cent. Positively, Chadderton achieves some market share in all zones, the highest being in Zone 8 (Oldham West): 2.9 per cent, Zone 9 (Rochdale South): 1.9 per cent and Zone 2 (Royton): 1.8 per cent.
Failsworth District Centre
6.4.21 Failsworth District Centre achieves a maximum comparison goods market share in its own zone (Zone 4) of 11.6 per cent, but it achieves a market share of 1.0 per cent or less in all other zones, except Zone 7 (Oldham East), where it achieves no comparison goods market share.
Elm Mill Shopping Park
6.4.22 Elk Mill Shopping Park achieves a maximum comparison goods market share of 34.7 per cent in Zone 2, which is its own zone. Elk Mill Shopping Park also achieves a market share of above 20 per cent in Zones 1, 3, 7 and 8. Unsurprisingly, Elk Mill Shopping Park achieves its lowest comparison goods market share in Zone 10 (5.3 per cent), which is furthest away from Elk Mill Shopping Park, south of Oldham Borough.
65
Centres / Retail Parks – Analysis of Dominance by Zone
6.4.23 We set out below an analysis of dominant centres and out-of-centre retail parks – defined as instances where the comparison goods market share exceeds 20 per cent – and centres of subsidiary influence, which are defined as having comparison goods market shares of between 10 and 20 per cent. Our findings are set out in Table 6.5 below, which reveal that:
i. There is no destination within the study area which performs a dominant or subsidiary comparison shopping function in all ten zones.
1. Oldham Town Centre is a dominant comparison shopping destination in six survey zones, whilst Elk Mill Shopping Park is a dominant comparison shopping destination in five survey zones.
2. Oldham Town Centre is the dominant centre in Zone 7 (Oldham’s own zone), along with Elk Mill Shopping Park. Hill Stores is also located within Zone 7 and has a significant influence on comparison goods retail shopping within the zone.
3. None of the seven district centres within Oldham Borough are dominant centres within any of the zones. Failsworth, Hill Stores and Shaw are the only district centres that exert a significant influence.
4. Zones 4, 6 and 9 have no dominant centres or retail parks but contain many centres / retail parks that have a significant influence on these zones.
5. Zone 10 is located south of Oldham Borough and as expected, is dominated by Snipe Retail Park, Ashton-under-Lyne Town Centre and Manchester City Centre.
Table 6.5 Comparison Goods Centres / Retail Parks of Dominant and Subsidiary Influence
Zone Dominant Centres / Retail Parks (Market Share 20%+)
Other Centres / Retail Parks Significant Influence (Market Share 10% to 20%)
1 Oldham Town Centre
Elk Mill Shopping Park Shaw District Centre
2 Elk Mill Shopping Park Oldham Town Centre
Manchester City Centre
3 Oldham Town Centre Elk Mill Shopping Park
Manchester City Centre
4 N/A Manchester City Centre Elk Mill Shopping Park Oldham Town Centre Failsworth District Centre
5 Oldham Town Centre Elk Mill Shopping Park Manchester City Centre
6 N/A Oldham Town Centre Elk Mill Shopping Park Manchester City Centre
7 Oldham Town Centre Elk Mill Shopping Park
Hill Stores District Centre
8 Oldham Town Centre Elk Mill Shopping Park
N/A
9 N/A Elk Mill Shopping Park Rochdale Town Centre Middleton Town Centre
10 Snipe Retail Park Ashton-under-Lyne Town Centre Manchester City Centre
N/A
Source: Spreadsheet 5, Appendix D
66
6.5 Current Patterns of Spending on Convenience Goods
6.5.1 The per capita spending on convenience retail goods in 2019 (Spreadsheet 2 in Appendix C) varies from a low of £1,704 in Zone 8 to a high of £2,570 in Zone 6. The total amount of convenience goods spending for residents of the whole study area in 2019 is £717.7m (Spreadsheet 3, Appendix C), of which £15.4m, or 2.1 per cent, is spent on SFT. The pattern of expenditure flows for the convenience goods sector as a whole, as revealed by the survey of households, is set out in Spreadsheets 4 (percentages) and 5 (monetary values) in Appendix C.
6.5.2 Table 6.6 – which is derived from the final column of Spreadsheet 5, Appendix C – reveals that, overall, some £548.6m (or 76.4 per cent) of the expenditure on convenience goods available to residents of the study area is spent at retail facilities that are located within the study area; this is known as the aggregate retention rate (see Spreadsheet 5, Appendix C, final column, ‘Total Inside Study Area’ row).
6.5.3 A further 13.7 per cent of convenience retail expenditure (equating to £98.4m) currently flows to stores in and around Tameside; facilities in and around Rochdale account for 5.1 per cent (£36.9m) of available expenditure; facilities in and around Manchester account for 2.0 per cent (£14.7m); with retail facilities in Bury accounting for 0.5 per cent (£3.2m) of available expenditure. A further 2.2 per cent (£15.8m) flows to more distant locations.
Table 6.6 Broad Destinations for Convenience Goods Expenditure
Destination Expenditure (£m) Expenditure (%)
Destinations within the Study Area 548.6 76.4
Total Retained Expenditure 548.6 76.4
Retail Facilities in Tameside 98.4 13.7
Retail Facilities in Rochdale 36.9 5.1
Retail Facilities in Manchester 14.7 2.0
Retail Facilities in Bury 3.2 0.5
Other more distant locations 15.8 2.2
Total Leakage 169.0 23.6
TOTAL 717.7 100.0 Source: Spreadsheet 5, Appendix C
6.5.4 Table 6.7 identifies the foodstores within the study area which achieve a convenience retail market share of 1.5 per cent or greater. The most popular destination for food and groceries shopping within Oldham Borough is the Asda foodstore at Milne Street, Chadderton District Centre, which has a convenience goods turnover of around £65.4m.
6.5.5 The Tesco Extra foodstore at Huddersfield Road, Oldham, is the second most popular destination for convenience shopping within the study area, with a convenience retail turnover of £51.5m and a market share of 7.2 per cent.
6.5.6 The third most popular foodstore within the study area is Asda at Greenfield Lane in Shaw District Centre. Asda has a convenience retail turnover of around £40.3m and a market share of 5.6 per cent, ahead of the Tesco foodstore at Chew Valley Road in Greenfield, which achieves a convenience goods turnover of approximately £26.8m and a market share of 3.7 per cent. The other foodstores within the study area which achieve a convenience retail turnover in excess of £15m include: Aldi, Refuge Street, Shaw; Aldi, Ellen Street, Oldham; Tesco, Featherstall Road North, Oldham; Morrisons, Hollinwood Avenue, Oldham; Sainsbury’s, Union Street, OIdham; Morrisons, Kingsway, Rochdale; Tesco Extra, Ashton Road West, Failsworth; Lidl, Croft Head, Royton; and Aldi, Sisson Street, Failsworth.
6.5.7 There are a further three foodstores in the study area which each achieve a convenience retail turnover in excess of £10m. These are Tesco Extra, Barton Road, Middleton (turnover of
67
£13.6m / market share of 1.9 per cent); Aldi, Elizabethan Way, Milnrow (turnover of £13.0m / market share of 1.8 per cent); and Morrisons, Poplar Street, Failsworth (turnover of £12.5m / market share of 1.7 per cent).
6.5.8 The findings outlined above and shown in Table 6.7 indicate that there is a wide dispersal of convenience retail expenditure in Oldham Borough. Unsurprisingly, the large Tesco and Asda foodstores have the highest turnover of foodstores within the study area. We note in passing that Aldi and Lidl – which are commonly referred to as ‘discount’ foodstores or ‘limited assortment discounters’ – sell an increasingly broad range of product lines, including well-known branded goods, and so the distinction between those retailers and the ‘big four’ (Tesco, Asda, Sainsbury’s and Morrisons) is becoming more blurred. There are seven discount foodstores in the study area comprising of five Aldi foodstores and two Lidl foodstores.
Table 6.7 Main Destinations for Convenience Goods Expenditure Retained within the Study Area
Foodstores within the Study Area Expenditure retained (£m)
6.5.9 The main leakage destinations for convenience goods expenditure are set out in Table 6.8. The most popular leakage destination is Asda, Cavendish Way, Ashton-under-Lyne (turnover of £26.5m / market share of 3.7 per cent), followed by Aldi, Wellington Road, Ashton-under-Lyne (turnover of £17.1m / market share 2.4 per cent) and Sainsbury’s, Lord Sheldon Way, Ashton-under-Lyne (turnover of £16.2m / market share of 2.3 per cent).
Table 6.8 Main Destinations for Convenience Goods Expenditure Leakage
Foodstores outside of the Study Area Expenditure retained (£m)
6.5.10 In Table 6.9, we provide an analysis of the study area’s retention level by zone, which is the proportion of expenditure on convenience goods available to residents in a specific zone which is spent in town centres and stores located within the study area, using the ‘Total Inside Study Area’ row of Spreadsheet 4, Appendix C.
6.5.11 The retention level is high in Zone 1 (70.0 per cent), which contains Shaw District Centre; Asda, Greenfield Lane, Shaw; and Aldi, Refuge Street, Shaw. Zone 7 also has a high retention rate (64.4 per cent) and contains Oldham Town Centre; Hill Stores District Centre; Tesco Extra, Huddersfield Road, Oldham; and Sainsbury’s, Union Street, Oldham.
6.5.12 Zones 3, 4 and 6 all have a retention level greater than 50 per cent. Zone 4 has a retention level of 57.7 per cent and contains Failsworth District Centre; Tesco Extra, Ashton Road West, Failsworth; Aldi Sisson Street, Failsworth; and Morrisons, Poplar Street, Failsworth. Zone 3 contains Chadderton District Centre; Asda, Milne Street, Chadderton; Tesco Extra, Barton Road, Middleton; and Lidl, Jardine Way, Chadderton and has a retention rate of 53.4 per cent. Zone 6 has a slightly lower retention rate of 51.8 per cent and contains Uppermill District Centre; and Tesco, Chew Valley Road, Greenfield.
6.5.13 Zones 2, 8 and 9 have similar retention rates of 31.0 per cent, 27.6 per cent and 35.3 per cent respectively. Zone 2 contains Royton District Centre; and Lidl, Croft Head, Royton. There is no defined centre within Zone 8, although Zone 8 does contain Aldi, Ellen Street, Oldham; Tesco, Featherstall Road North, Oldham; and Morrisons, Hollinwood Avenue, Oldham. Zone 9 also does not contain any defined centre, but does contain Morrisons, Kingsway, Rochdale; and Aldi, Elizabethan Way, Milnrow.
6.5.14 Zones 5 and 10 have low retention rates of 11.7 per cent and 15.9 per cent respectively. Zone 5 contains Lees District Centre; and Co-op, Athens Way, Lees. Zone 10 contains Mossley Town Centre; and Asda, Queens Road, Hurst Cross.
6.5.15 Table 6.10 shows, for each zone, ‘dominant’ stores with a zonal market share of over 25 per cent, and stores with shares between 8 and 25 per cent, which have a ‘subsidiary’ influence.
Table 6.10 Dominant Convenience Goods Stores and Stores with Subsidiary Influence
Zone Dominant Stores (greater than 25% market share)
Subsidiary Stores (market share between 8% and 25%)
Tesco Extra, Huddersfield Road, Oldham dominates Zones 5 and 7. This aside, there are no other foodstores which dominate more than one zone.
In Zone 1, Asda, Greenfield Lane is the dominant store and there are two subsidiary stores.
In Zone 3, Asda, Milne Street, Chadderton is the dominant store and Morrisons, Hollinwood Avenue, Oldham is a subsidiary store.
In Zone 5, Tesco Extra, Huddersfield Road, Oldham is the dominant store and there are three subsidiary stores.
In Zone 6, Tesco, Chew Valley Road, Greenfield is the dominant store and Tesco Extra, Huddersfield Road, Oldham is a subsidiary store.
Tesco Extra, Huddersfield Road Oldham is the dominant store in Zone 7 and there are two subsidiary stores.
Asda, Milne Street, Chadderton is the dominant store in Zone 8 and there are two subsidiary stores.
There are no dominant stores in Zones 2, 4, 9 and 10.
Zone 10 does not have any dominant stores, nor any subsidiary stores.
6.5.17 The survey findings indicate that a high proportion of convenience retail expenditure is retained within the study area and that most residents have access to a good choice of convenience retail destinations. We therefore consider that the current convenience retail offer provides sufficient choice and competition across the Borough.
70
6.6 Current Patterns of Spending on Leisure Services and Cultural Activities
6.6.1 As noted at the beginning of this section, the household survey questionnaire also sought to identify patterns of spending on various types of leisure and cultural services. The most popular destinations for these various activities enjoyed by residents of each survey zone, are set out in Table 6.11. We also provide our thoughts as to whether any centres within the study area have potentially greater roles to play in the provision of leisure and cultural services.
Table 6.11 Most Popular Destinations for Expenditure on Leisure Services and Culture (1) Zone Cinema Theatre Pub / Bar Restaurant /
Café Nightclub Bingo
1 Sandbrook Retail &
Leisure Park, Rochdale
Oldham Town Centre
Shaw District Centre
Manchester City Centre
N/A Oldham Town Centre
2 Oldham Town Centre
Manchester City Centre
Royton District Centre
Royton District Centre
Manchester City Centre
Oldham Town Centre
3 Oldham Town Centre
Manchester City Centre
Chadderton District Centre
Manchester City Centre
Manchester City Centre
Ashton-under-Lyne
Town Centre 4 Ashton Moss,
Ashton-under-Lyne
Manchester City Centre
Manchester City Centre
Manchester City Centre
Manchester City Centre
Ashton-under-Lyne
Town Centre 5 Oldham
Town Centre Manchester City Centre
Uppermill District Centre
Uppermill District Centre
Manchester City Centre
Manchester City Centre
6 Oldham Town Centre
Manchester City Centre
Uppermill District Centre
Uppermill District Centre
Oldham Town Centre
Mossley Town Centre
7 Oldham Town Centre
Manchester City Centre
Oldham Town Centre
Oldham Town Centre
Manchester City Centre
Oldham Town Centre
8 Oldham Town Centre
Manchester City Centre
Oldham Town Centre
Manchester City Centre
Manchester City Centre
Oldham Town Centre
9 Sandbrook Retail &
Leisure Park, Rochdale
Manchester City Centre
Rochdale Town Centre
Rochdale Town Centre
Manchester City Centre /
Rochdale Town Centre
Middleton Town Centre
10 Ashton Moss, Ashton-
under-Lyne
Manchester City Centre
Ashton-under-Lyne
Town Centre
Ashton-under-Lyne Town
Centre
N/A Stalybridge Town Centre
Table 6.12 Most Popular Destinations for Expenditure on Leisure Services and Culture (2) Zone Health &
Fitness Ten-pin Bowling
Museum / Library
Art Gallery Ice Rink Trampoline Centre
1 Shaw District Centre
Sandbrook Retail &
Leisure Park, Rochdale
Manchester City Centre
Manchester City Centre
Alkrington Village Centre
Manchester City Centre /
Oldham Town Centre /
Rochdale Town Centre
2 Royton District Centre
Sandbrook Retail &
Leisure Park, Rochdale
Manchester City Centre
Manchester City Centre
Manchester City Centre
Alexandra Retail Park,
Oldham
3 Chadderton District Centre
Ashton-under-Lyne
Town Centre
Manchester City Centre
Manchester City Centre
Manchester City Centre
Manchester City Centre
4 Failsworth District Centre
Ashton-under-Lyne
Town Centre
Manchester City Centre
Manchester City Centre
London Manchester City Centre
71
Zone Health & Fitness
Ten-pin Bowling
Museum / Library
Art Gallery Ice Rink Trampoline Centre
5 Oldham Town Centre
Ashton Moss, Ashton-
under-Lyne
Manchester City Centre
Manchester City Centre
Manchester City Centre
Oldham Town Centre
6 Uppermill District Centre
Ashton-under-Lyne
Town Centre
Manchester City Centre
Manchester City Centre
Altrincham Town Centre
Elk Mill Shopping
Park, Oldham 7 Oldham Town
Centre Rochdale
Town Centre Oldham Town
Centre Oldham Town
Centre Manchester City Centre
Oldham Town Centre
8 Oldham Town Centre
Ashton-under-Lyne
Town Centre
Oldham Town Centre
Oldham Town Centre
Manchester City Centre
Oldham Town Centre
9 Rochdale Town Centre
Sandbrook Retail &
Leisure Park, Rochdale
Manchester City Centre
Manchester City Centre
Manchester City Centre
Rochdale Town Centre
10 Stalybridge Town Centre
Ashton Moss, Ashton-
under-Lyne
Manchester City Centre
Manchester City Centre
Alkrington Village Centre / Manchester City Centre
Ashton-under-Lyne Town
Centre
Leisure Services and Cultural Activities Sub-Sectors
Cinemas
6.6.2 Over half (52 per cent) of respondents stated that they visit cinemas. The most popular destination for visits to the cinema is Oldham Town Centre (27 per cent), followed by Sandbrook Retail & Leisure Park, Rochdale (18 per cent), Ashton Moss, Ashton-under-Lyne (14 per cent), Ashton-under-Lyne Town Centre (10 per cent) and Manchester City Centre (9 per cent). Rochdale Town Centre is the only other destination to account for more than 5 per cent of responses.
6.6.3 Oldham Town Centre was the most popular destination for visits to the cinema in six of the ten survey zones (Zones 2, 3, 5, 6, 7 and 8). The most popular destination for visits to the cinema cited by Zone 1 residents was Sandbrook Retail & Leisure Park, Rochdale; Zone 4 was Ashton Moss, Ashton-under-Lyne; Zone 9 was Rochdale Town Centre; and Zone 10 was Ashton Moss, Ashton-under-Lyne.
Theatres
6.6.4 Over a third (36 per cent) of respondents confirmed that they visit the theatre. The most popular destinations for visits to the theatre are Manchester City Centre (60 per cent), Oldham Town Centre (14 per cent), London (5 per cent) and The Lowry, Salford Quays (4 per cent).
6.6.5 Manchester City Centre was extremely popular, being the most popular destination in nine out of ten zones (all but Zone 1 in which the most popular destination was Oldham Town Centre).
Pubs / Bars
6.6.6 Just under half (47 per cent) of respondents stated that they visit pubs / bars, the three most popular destinations being Manchester City Centre (19 per cent) and Oldham Town Centre and Royton District Centre (both 11 per cent). Other destinations identified were Uppermill District Centre (7 per cent), Ashton-under-Lyne Town Centre (6 per cent), Rochdale Town Centre (6 per cent) and Chadderton District Centre (5 per cent).
6.6.7 Uppermill District Centre and Oldham Town Centre were the most popular destination for residents of two zones each (Zones 5 and 6 and Zones 7 and 8 respectively). The most popular destinations stated by residents within the other six zones were as follows: Zone 1 (Shaw District Centre), Zone 2 (Royton District Centre), Zone 3 (Chadderton District Centre), Zone 4 (Manchester City Centre), Zone 9 (Rochdale Town Centre) and Zone 10 (Ashton-under-Lyne Town Centre).
72
Restaurants / Cafés
6.6.8 Three quarters of respondents confirmed that they visit restaurants and cafés, the most popular destination being Manchester City Centre (26 per cent), followed by Oldham Town Centre (14 per cent). Other popular destinations to account for more than 5 per cent of responses include Ashton-under-Lyne Town Centre (9 per cent), Royton District Centre (6 per cent) and Rochdale Town Centre (5 per cent).
6.6.9 Manchester City Centre was the most popular destination for visits to restaurants and cafés cited by residents in four of the ten survey zones (Zones 1, 3, 4 and 8). The most popular destination for visits to restaurants and cafés stated by Zone 2 residents was Royton District Centre; Zone 5 was Uppermill District Centre; Zone 6 was Uppermill District Centre; Zone 7 was Oldham Town Centre; Zone 9 was Rochdale Town Centre; and Zone 10 was Ashton-under-Lyne Town Centre.
Nightclubs
6.6.10 Nightclubs were very unpopular, with 96 per cent of respondents answering that they did not visit nightclubs. Of those that did, the most popular destinations for nightclubs were Manchester City Centre, followed by Rochdale Town Centre and Oldham Town Centre.
Bingo
6.6.11 Bingo was also extremely unpopular, with 95 per cent of respondents answering that they did not do bingo. Of those that did, the most popular destinations for bingo were Oldham Town Centre, followed by Ashton-under-Lyne Town Centre and Middleton Town Centre.
Health & Fitness Centres
6.6.12 Some 28 per cent of respondents visited health and fitness clubs. The three most popular destinations for health and fitness clubs are Oldham Town Centre (28 per cent) and Rochdale Town Centre and Royton District Centre (both 6 per cent).
6.6.13 Oldham Town Centre was the most popular destination for visits to health and fitness centres quoted by respondents in three of the ten survey zones (Zones 5, 7 and 8). Unsurprisingly, there were no other dominant destinations, as it is expected that residents visit a health & fitness centre close to their home or workplace. The most popular destination for visits to health & fitness centres in Zone 1 was Shaw District Centre; Zone 2 was Royton District Centre; Zone 3 was Chadderton District Centre; Zone 4 was Failsworth District Centre; Zone 6 was Uppermill District Centre; Zone 9 was Rochdale Town Centre; and Zone 10 was Stalybridge Town Centre.
Ten Pin Bowling
6.6.14 A fifth of respondents answered that they visit ten-pin bowling facilities. The most popular destinations for ten-pin bowling facilities were Sandbrook Retail & Leisure Park, Rochdale (28 per cent), Ashton-under-Lyme Town Centre (21 per cent), Ashton Moss, Ashton-under-Lyne (13 per cent) and Rochdale Town Centre (12 per cent).
6.6.15 Ashton-under-Lyne Town Centre was the most popular destination for visits to ten-pin bowling facilities quoted by residents in four of the ten survey zones (Zones 3, 4, 6 and 8). Sandbrook Retail & Leisure Park, Rochdale was the most popular destination in three of the ten survey zones (Zones 1, 2 and 9) and Ashton Moss, Ashton-under-Lyne was the most popular destination in Zones 5 and 10.
Museums / Libraries
6.6.16 Over a third (37 per cent) of respondents stated that they visit museums and libraries. The most popular destinations for museums and libraries were Manchester City Centre (41 per cent), Oldham Town Centre (17 per cent), London (5 per cent) and Rochdale Town Centre and Royton District Centre (both 4 per cent).
73
6.6.17 Manchester City Centre was the most popular destination for visits to museums and libraries in eight of the ten survey zones (Zones 1, 2, 3, 4, 5, 6, 9 and 10). Oldham Town Centre was the most popular destination in the other zones (Zones 7 and 8).
Art Galleries
6.6.18 Just over a fifth (21 per cent) of respondents confirmed that they visit art galleries. The most popular destinations for art galleries were Manchester City Centre (52 per cent), Oldham Town Centre (22 per cent) and London (5 per cent).
6.6.19 As with museums and libraries, Manchester City Centre was the most popular destination for visits to art galleries in eight of the ten survey zones (Zones 1, 2, 3, 4, 5, 6, 9 and 10). Oldham Town Centre was the most popular destination in the other zones (Zones 7 and 8).
Ice Rinks
6.6.20 Just 6 per cent of respondents answered that they visit ice rinks. Of those who did, the most popular destination for ice rinks was Manchester City Centre.
Trampoline Centres
6.6.21 Just 12 per cent of respondents answered that they visit trampoline centres. The most popular destinations for visits to trampoline centres are Oldham Town Centre which is no longer present (26 per cent), Rochdale Town Centre (16 per cent) and Manchester City Centre (11 per cent).
6.6.22 Oldham Town Centre was the most popular destination for visits to trampoline centres in four of the ten survey zones (Zones 1 (along with Manchester City Centre and Rochdale Town Centre), 5, 7 and 8). The most popular destination for visits to trampoline centres in Zone 2 was Alexandra Retail Park, Oldham; Zone 3 was Manchester City Centre; Zone 4 was also Manchester City Centre; Zone 6 was Elk Mill Shopping Park, Oldham; Zone 9 was Rochdale Town Centre; and Zone 10 was Ashton-under-Lyne Town Centre.
Oldham Town Centre
6.6.23 Oldham Town Centre is within / surrounded by Zones 7 and 8 and, as expected, Oldham Town Centre is the most popular destination in most leisure categories in these zones, particularly where the most localised patterns of trips might be expected. The exceptions to this are the theatres, nightclubs, ten-pin bowling and ice rinks. Zones 9 and 10 are mostly outside of Oldham Borough and contain Milnrow Town Centre and Mossley Town Centre and are close to Rochdale Town Centre and Stalybridge Town Centre respectively. Due to the close proximity of Rochdale and Stalybridge to Zones 9 and 10 respectively and the draw of these town centres, Oldham is not the most popular destination in either of these zones for any of the leisure activities mentioned above.
District Centres
6.6.24 Chadderton, Failsworth, Royton, Shaw and Uppermill District Centres only appear as the most popular destinations for leisure services where localised patterns would be expected, including pubs / bars, restaurants / cafés and health & fitness.
6.6.25 Chadderton is the most popular destination for pubs / bars and health & fitness in its own zone only (Zone 3).
6.6.26 Failsworth only features as the most popular destination for health & fitness in its own zone (Zone 4).
6.6.27 Royton features as the most popular destination for pubs / bars, restaurants / cafés and health & fitness in its own zone only (Zone 2).
6.6.28 As with Chadderton, Shaw features as the most popular destination for pubs / bars and health & fitness in its own zone only (Zone 1).
74
6.6.29 Uppermill District Centre is the most popular destination in both Zones 5 and 6 for both pubs / bars and restaurants / cafés. Uppermill’s own zone is Zone 6 and it is a little surprising that Uppermill is the most popular destination for these facilities in Zone 5 (Lees). This is probably reflective of the stronger provision for such facilities in Uppermill rather than Lees and also the better environment generally in Uppermill. Uppermill also features as the most popular destination for health & fitness in its own zone (Zone 6).
6.6.30 Lees and Hill Stores do not appear as the most popular destinations for leisure services whatsoever, including in their respective zones (Zones 5 and 7).
6.6.31 Overall, the results described above for the district centres are unsurprising, as they all primarily perform a localised function.
75
7 Assessment of Retail Needs 7.1 Introduction
7.1.1 Based on the retail spending patterns identified in the previous section, and forecasts of future population and retail expenditure growth, this section of the report sets out the quantitative need for additional retail floorspace in the Borough over the study period. It goes on to provide our assessment of qualitative needs based on the town centre performance analysis set out in Section 8 of this report and having regard to our review of market trends contained within Section 3.
7.2 Quantitative Assessment
Methodology
7.2.1 The key inputs and assumptions that have been applied as part of our quantitative assessment of retail needs are explained below. Our assessment is based on sub-national population projections provided by the Office for National Statistics (ONS).
7.2.2 At the outset, we emphasise that retail capacity forecasts should be subject to regular review throughout the plan period, in order to ensure an up-to-date evidence base which is informed by recent economic and market trends. Furthermore, we advise that longer-term quantitative forecasts should generally be treated as indicative given the inherent uncertainties in respect of longer-term economic and demographic trends.
Population and Expenditure Growth
7.2.3 Spreadsheets 1, 2 and 3 of Appendices C and D contain detailed figures for population and retail expenditure growth in the study area (which covers a wider area than Oldham Borough) over the period to 2037 in the convenience and comparison goods sectors. The population figures are derived from Experian MMG3 and are projected forward using ONS Sub-National Population Projections. The total population figures for the study area are presented below in Table 7.1.
7.2.4 The figures in Table 7.1 show that the study area is predicted to experience population growth of 5.8 per cent over the study period.
Table 7.1 Summary of ONS-Based Population Growth
Year Population Population Growth relative to 2019
2019 350,384 -
2024 357,144 6,760
2029 362,566 12,182
2034 37,649 17,265
2037 370,687 20,303 Source: Spreadsheet 1 of Appendices C and D
7.2.5 Table 7.2 below provides a summary of overall levels of convenience retail spending growth across the study period. This includes an allowance made for special forms of trading (‘SFT’), taken from Experian’s Retail Planner Briefing Note 17 (‘RPBN’) of February 2020. Expenditure on SFT is excluded from our assessment as it is not considered to be available to support the future development of retail floorspace.
7.2.6 Experian provides adjusted forecasts of SFT market shares to account for online transactions that are serviced through stores (that is, items ‘picked’ for home delivery from stores and purchases made via ‘click and collect’). Localised rates of SFT were captured by the
76
household survey, although they do not take account of how individual transactions are serviced. The localised rates vary for convenience and comparison retail goods.
7.2.7 For convenience retail goods, the SFT market share identified by the household survey was 2.1 per cent. This is lower than Experian’s adjusted market share for SFT of 4.2 per cent in 2019, but we have chosen to use the SFT market share identified by the household survey as it is a locally derived figure rather than a national average. Similarly, for the forecast years (2024 – 2.8 per cent, 2029 – 3.2 per cent, 2034 – 3.3 per cent and 2037 – 3.4 per cent), we have grown the 2019 household survey-based SFT figure and the rates we have used are lower than Experian’s forecast national rates (2024 – 5.5 per cent, 2029 – 6.3 per cent, 2034 – 6.6 per cent and 2037 – 6.8 per cent).
7.2.8 Based on Experian population data and expenditure forecasts, the total level of available convenience retail expenditure (excluding SFT) is expected to increase by £42.3 million in the period to 2037, as shown in Table 7.2 below.
Table 7.2 Convenience Expenditure Growth Summary
Year Convenience expenditure inc.
SFT (£m)
SFT (£m) Convenience expenditure exc.
SFT (£m)
2019 £733.1 £15.4 £717.7
2024 £749.2 £20.6 £728.6
2029 £764.1 £24.1 £740.0
2034 £778.3 £25.7 £752.6
2037 £786.7 £26.8 £760.0 Source: Spreadsheet 3 of Appendix C
7.2.9 Table 7.3 provides an equivalent summary for comparison goods expenditure. As with the convenience retail forecasts, we have used the SFT figure from the household survey for the 2019 base year, of 23.2 per cent, in preference to Experian’s adjusted market share for SFT of 17.6 per cent in 2019. We have also grown the 2019 household survey-based SFT figure and the SFT rates we have applied for the forecast years (2024 – 28.1 per cent, 2029 – 31.5 per cent, 2034 – 33.2 per cent and 2037 – 33.9 per cent) are higher than Experian’s forecast national rates (2024 – 21.3 per cent, 2029 – 23.9 per cent, 2034 – 25.2 per cent and 2037 – 25.7 per cent).
7.2.10 After allowing for SFT growth, we forecast an increase in available comparison retail expenditure within the study area of £510.6 million between 2019 and 2037.
7.2.11 The quantitative forecasts of retail need take account of the total amount of convenience and comparison goods expenditure which is retained within Oldham Borough. Table 7.4 sets out the total amount of expenditure retained within the study area in 2019.
77
Table 7.4 Summary of Expenditure Retention in Oldham Borough at 2019
Available expenditure within Oldham Borough
(£m)
Expenditure retained within
Oldham Borough (£m)
Expenditure retained within
Oldham Borough (%)
Convenience goods £717.7 £548.6 76.4 per cent
Comparison goods £886.0 £502.8 56.8 per cent Source: Spreadsheet 5 of Appendices C and D
7.2.12 In total, and as set out in greater detail in Section 5 of this report, 76.4 per cent of study area residents’ expenditure on convenience retail goods is retained within the study area and 56.8 per cent of study area residents’ expenditure on comparison retail goods is currently retained within the study area.
7.2.13 We do not consider there to be much scope for further improvement to the convenience retail retention rate, which is fairly high at above 75 per cent and given the availability of retail facilities close to, but outside of, the study area, in neighbouring Manchester, Rochdale and Tameside. We therefore assume that the aggregate convenience goods market share will remain constant over the study period.
7.2.14 For comparison retail goods, we also do not consider it realistic to expect that the retention rate can be improved beyond the 56.8 per cent currently achieved. In our judgement, maintaining the retention rate at the current level (56.8 per cent) is a more realistic target, given the relatively strong competition from retail facilities in Manchester, Rochdale, Tameside and elsewhere.
Claims on Expenditure
7.2.15 As we explained in the previous section, the claim from spending on SFT (such as online shopping) has already been removed from the retail expenditure forecasts.
7.2.16 In addition to SFT, it is necessary to take account of sales density growth (which is the expected growth in turnover of existing retailers within the study area), and commitments for new retail floorspace (schemes implemented but not yet trading at the time of the household survey, or extant planning permissions which would result in additional retail floorspace). We cover each of these claims in turn, below.
Sales Density Growth
7.2.17 Sales density growth relates to the improved productivity or efficiency of retail floorspace over time. In assessing the amount of expenditure that is available to support the development of new retail floorspace, we make an allowance for sales density growth associated with existing retail floorspace within the study area. Allowances for sales density growth are linked to expenditure growth and given the very low rates of expenditure growth forecast for the convenience retail sector, we do not allow for any real terms growth in sales densities for convenience goods floorspace within the study area. For comparison retail floorspace, we assume an average annual increase in sales densities of 1.5 per cent.
7.2.18 The ability of existing floorspace to absorb expenditure growth will depend on its type. More modern floorspace (such as that within purpose-built shopping centres and large, freestanding foodstores) is better able to accommodate growth than older, less flexible floorspace. Given that there is a variety of retail floorspace throughout the study area, it is considered robust to apply the average sales density growth figure of 1.5 per cent. We also make an allowance for sales density growth of committed comparison retail floorspace to account for the improved sales productivity of this additional floorspace.
Floorspace Commitments
7.2.19 The floorspace commitments that have been identified by the Council and are taken account of in the quantitative need assessment are identified in Table 7.5 below.
78
Table 7.5 Retail Commitments
Sales Area Floorspace
(sq.m)
Convenience Sales Area Floorspace
(sq.m)
Comparison Sales Area Floorspace
(sq.m)
Two retail units, Texaco PFS, Oldham Road, Failsworth
189 189 0
Commercial unit, Royton Town Hall and Royton Library
712 0 712
Retail unit adjacent to B&Q, Westhulme Way, Oldham
837 0 837
Retail unit, Housing Units, Failsworth 713 0 713
Retail unit, former Sainsbury’s, Bloom Street, Oldham
2,169 0 2,169
Retail unit, Adelaide Mill, Oldham 249 0 249
Retail unit, former Lifestyle Fitness Centre, Greenfield
123 0 123
Total 4,992 189 4,803 Source: Spreadsheet 6 of Appendices C and D
7.2.20 We estimate that the committed retail floorspace referred to in Table 7.5 will generate a convenience retail turnover of just £0.1 million in 2024 and a comparison goods turnover of £24.2 million in the same year, by which time we expect these committed developments to be fully trading. Further details of the assumptions applied in estimating the turnover of committed retail floorspace are contained in Spreadsheet 6 of Appendices C and D.
Need for Convenience Retail Floorspace
7.2.21 Spreadsheet 7 of Appendix C provides our forecasts of convenience retail floorspace requirements in Oldham Borough. Floorspace requirements have been calculated to the end of the study period and for the interval years of 2024, 2029, 2034 and 2037. The spreadsheet is structured as set out below in Table 6.6, where we explain some of the other assumptions that we have applied in calculating these quantitative requirements.
Table 7.6 Methodology for Convenience Retail Assessment
Row Explanation / Decision
A&B Total population and convenience retail expenditure within the study area. This is taken from Spreadsheets 1-3.
C&D Proportion of convenience retail expenditure which is retained within the study area (£m & per cent) based on the findings of the household telephone survey (as detailed in Spreadsheets 4 and 5). Market share is held constant at 76.4 per cent throughout the study period.
E&F Inflow of convenience retail expenditure to destinations within the study area from residents outside Oldham Borough. This is derived by applying the level of inflow specified in Row E to the convenience goods expenditure retained (Row D). The rate of inflow is held constant across the study period.
G & H Baseline turnover of retailers of convenience goods in the study area, and growth in retained convenience goods expenditure within the study area taking into account rows A-G.
I&J Claims on residual growth in convenience retail expenditure including sales density growth in existing stores within Oldham Borough and turnover from committed convenience retail floorspace. Commitments are expected to be implemented and
79
Row Explanation / Decision trading by 2024. Given the low levels of expenditure growth we have not allowed for any sales density growth for either existing stores or commitments over the study period.
K Total claims on expenditure (£m) from sales density growth in existing stores and committed convenience retail floorspace.
L Final residual convenience retail expenditure capacity (£m), calculated by deducting total claims on expenditure (Row K) from growth in available expenditure (Row H) within the study area.
M-O Final residual convenience retail expenditure converted into floorspace requirements by applying a generic convenience retail sales density of £11,500 per sq.m (kept constant over the study period in line with our approach to sales density growth). This produces a sales area floorspace requirement, which is converted to a gross convenience retail floorspace figure on the basis of an assumed net:gross floorspace ratio of 70:30.
7.2.22 Assuming a constant rate of expenditure retention, the result of Spreadsheet 7 in Appendix D indicates there will be no capacity for convenience retail goods at the end of the study period (as shown by Rows N and O of Spreadsheet 7 in Appendix D). This is primarily due to the relatively low level of expenditure growth. The floorspace requirements arising within each study period are summarised in Table 7.7 below.
-3,510 sq.m net -2,751 sq.m net -1,909 sq.m net -1,447 sq.m net -1,447 sq.m net Source: Spreadsheet 7 of Appendix C
7.2.23 Table 7.7 shows that there is no need for convenience retail floorspace over the period 2019-2037. On this basis, the Council does not need to plan for new convenience retail floorspace in the short, medium or long term, although it is acknowledged that there will be increases in population and expenditure within the catchment area over the Plan period to 2037.
7.2.24 This does not mean that proposals for new foodstores will not come forward and attempt to divert expenditure from existing foodstores in the study area.
Need for Comparison Retail Floorspace
7.2.25 Spreadsheet 7 of Appendix D calculates requirements for comparison retail floorspace over the study period, on the basis of the expenditure retention rate remaining constant at 56.8 per cent. Table 7.8 below explains the structure of this assessment, which is similar to the approach used for convenience retail floorspace, albeit the assumptions differ in terms of sales densities and net:gross floorspace ratios.
Table 7.8 Methodology for Comparison Retail Assessment
Row Explanation/Description
A&B Total population and comparison retail expenditure within the study area. This is taken from Spreadsheets 1-3.
C&D Proportion of comparison retail expenditure which is retained within the study area (£m & per cent) based on the findings of the household telephone survey (as detailed in Spreadsheets 4 and 5). Market share is held constant at 56.8 per cent throughout the study period.
E&F Inflow of comparison retail expenditure to destinations within the study area from residents outside Oldham Borough. This is derived by applying the level of inflow
80
Row Explanation/Description specified in Row E to the comparison goods expenditure retained (Row D). The rate of inflow is held constant across the study period.
G & H Baseline turnover of retailers of comparison goods in the study area, and growth in retained comparison goods expenditure within the study area taking into account rows A-G.
I&J
Claims on residual growth in comparison retail expenditure including sales density growth in existing stores within Oldham Borough and turnover from committed comparison retail floorspace. Commitments are expected to be implemented and trading by 2024. We have allowed for annual sales density growth of 1.5 per cent for existing stores and commitments over the study period.
K Total claims on expenditure (£m) from sales density growth in existing stores and committed comparison retail floorspace.
L Final residual comparison retail expenditure capacity (£m), calculated by deducting total claims on expenditure (Row K) from growth in available expenditure (Row H) within the study area.
M-O
Final residual comparison retail expenditure converted into floorspace requirements by applying a generic comparison retail sales density of £5,500 per sq.m, grown at a rate of 1.5 per cent, per annum over the study period in line with our approach to sales density growth. This produces a sales area floorspace requirement, which is converted to a gross comparison retail floorspace figure on the basis of an assumed net:gross floorspace ratio of 80:20.
7.2.26 Assuming a constant rate of expenditure retention, there will be capacity for a modest quantum of additional comparison retail goods at the end of the study period (as shown by Rows N and O of Spreadsheet 7 in Appendix D). This is primarily due to high forecast expenditure growth.
-8,136 sq.m net -1,487 sq.m net 2,381 sq.m net 2,381 sq.m net
Source: Spreadsheet 7 of Appendix D
7.2.27 Table 7.9 shows that there is a need for 2,976 sq.m (gross) of additional comparison retail floorspace over the period to 2037 across Oldham Borough, equating to a requirement for 2,381 sq.m of sales area floorspace, albeit the floorspace requirements only arise in the post 2034 period and there is no capacity in the early years of the plan period. On this basis, the Council could plan for new comparison retail floorspace in the long term, but not the short or medium term.
7.2.28 Commitments for comparison retail floorspace should be carefully monitored and if such commitments fall away, this will increase capacity for comparison retail floorspace further.
7.2.29 Appendix H sets out a number of potential development sites which could accommodate the need for comparison retail floorspace.
7.3 Qualitative Assessment
7.3.1 Deficiencies and gaps in existing retail provision can be considered on the basis of the study area as a whole and in terms of Oldham Borough’s individual centres. As set out within Section 4 of this report, we consider that the study area has a good retention rate for
81
convenience goods expenditure at 76.4 per cent and a very good retention rate for comparison goods expenditure at 56.8 per cent.
7.3.2 The health check assessments highlight a number of qualitative retail needs, in terms of deficiencies and gaps in existing provision, within some study centres, as follows:
Oldham – the town centre is well represented in the convenience and comparison goods sectors, the food and drink sector, and the professional services sector. However, there is a large proportion of vacant units. The town centre economy could be improved by reducing the number of retail units and repurposing them for other uses including office and residential.
Shaw – the proportion of convenience and comparison good retailers is as expected given the size of the centre. The district centre also commands a high average commercial rate and is very accessible by public transport. Despite the positives, the health of Shaw district centre is in decline, since the last study there has been a significant increase in the amount of vacant units and there has been a gradual decline in the quality of the physical environment.
Royton – the district centre is performing very well for a centre of its size. The proportion of comparison and convenience good retailers, retail services and professional services are largely in line with the national average.
Uppermill – the district centre is performing very well, with a good provision of retailers and services available within Uppermill. Whilst the district centre environment is positive overall, the accessibility of the centre could be improved by widening the walkways and creating new areas of public realm. This may prove difficult given the district centre is covered by a Conservation Area, and so any improvements to the public realm will need to consider that designation.
Lees – the district centre accommodates a high proportion of comparison good retailers, but the provision of convenience good retailers is somewhat limited.
Hill Stores – the provision of retailers and services within Hill Stores is as expected for a centre of this size. There is a concentration of vacant units to the north east of the centre, around the junction of Huddersfield Road and Ripponden Road. Some of these vacant units could be repurposed for other uses which may help increase the number of people visiting the centre.
Chadderton – the centre is performing relatively well and accommodates a good provision of both comparison and convenience good retailers. The accessibility of the centre could be improved by creating better pedestrian links between Asda and the rest of the district centre.
Failsworth – the centre is performing well with a good provision of both retailers and services. Much like Chadderton District Centre, accessibility through the centre could be improved, specifically pedestrian access across the canal.
7.3.3 Whilst we have set out some of the qualitative deficiencies in the district centres above, district centres in general tend to have a lower than average provision of comparison retail outlets (vis-à-vis the national average for all centres) whilst having a high proportion of services including food and beverage uses and health & beauty operators. As such, it is often unrealistic for district centres to have the full range of comparison retail goods sub-sectors, for example.
7.3.4 We have set out the qualitative deficiencies within the various centres and made recommendations for how the retail offer of different towns can be strengthened.
82
8 Commercial Leisure Needs 8.1 Introduction
8.1.1 In this section we consider quantitative and qualitative needs for leisure facilities and other main town centre uses, such as retail services, offices and cultural facilities, within Oldham Borough.
8.2 Leisure Uses
8.2.1 Appendix E sets out our assessment of expenditure growth in respect of various sub-categories of leisure spending, with a specific emphasis on food and beverage uses (including spending in cafés, restaurants, pubs and bars) given that this currently accounts for over 50 per cent of leisure spending and is by some margin the most significant expenditure category.
8.2.2 The leisure capacity tables are structured as follows:
Spreadsheet 1 presents the population projections for the individual study area zones (these reflect the figures shown in Spreadsheets 1 of the convenience and comparison capacity assessments).
Spreadsheet 2 presents per capita expenditure on different leisure categories in 2019, 2024, 2029, 2034 and 2037.
Spreadsheet 3 multiplies data from Spreadsheets 1 and 2 together to show the total spending for each main leisure category, by zone and for each interval year of the study period.
Spreadsheet 4 identifies the growth in leisure goods spending over the study period.
Spreadsheet 5 specifies leisure commitments.
Spreadsheet 6 sets out market shares for food and beverage spending derived from the household survey.
Spreadsheet 7 forecasts expenditure capacity for food and beverage uses based on a constant retention rate for the study area.
Leisure Spending
8.2.3 Spreadsheet 4 of Appendix E contains estimates of existing and future leisure expenditure for six sub-categories, namely: ‘accommodation services’ (mainly spending on hotels), ‘cultural services’ (such as cinemas, museums, galleries and theatres), ‘games of chance’ (including spending on bingo and bookmakers), ‘hairdressing and personal grooming’, ‘recreational and sporting services’ (including gyms, spectator and participant sports) and ‘restaurants, cafés, pubs etc’. Table 8.1 below summarises expenditure growth in these sub-categories.
Accommodation Services £64.4 £68.1 £73.1 £78.3 £81.5 £17.1 Cultural Services £94.7 £100.2 £107.5 £115.1 £119.8 £25.1 Games of Chance £57.3 £60.6 £65.0 £69.5 £72.4 £15.1 Hairdressing & personal grooming £26.7 £28.2 £30.3 £32.4 £33.7 £7.1 Recreational services £33.5 £35.4 £38.0 £40.7 £42.3 £8.8 Restaurants/cafés/pubs etc. £315.3 £333.5 £358.0 £383.0 £398.7 £83.4 Total £591.8 £626.0 £671.9 £718.9 £748.4 £156.6
83
8.2.4 Table 8.1 shows that total leisure services expenditure will grow by approximately £157 million in the period to 2037. In monetary terms, over half of this growth will occur in the ‘restaurants/cafés/pubs etc’ sub-category.
8.2.5 Given the dominance of the food and beverage sub-sector, and its increasing importance to the vitality and viability of town centres, we discuss expenditure capacity in this sub-sector in greater detail below. In terms of other sub-categories of leisure expenditure, we comment as follows:
Accommodation services – given its size and dominance within Oldham Borough we consider that there could be some demand for hotel development in Oldham Town Centre and that such demand would be likely to come from budget / mainstream operators (for example the hotel at Prince’s Gate). Such development could be incorporated into mixed-use town centre developments, reducing the amount of vacant retail floorspace concurrently.
Cultural services – our assessment of expenditure capacity has indicated significant growth in spending on cultural services, including cinemas. The majority of this expenditure will be directed to Oldham Town Centre, which has a more diverse and established range of cultural services. There is limited scope to improve local provision in the district centres. Cultural services can play an important role in supporting the food and beverage offer of town centres, and we discuss this further below.
We note that there is just one mainstream cinema facility within Oldham Borough, this being the Odeon at The Old Town Hall, Parliament Square, Oldham. ‘The Small Cinema’ on Greaves Street in Oldham Town Centre is a smaller facility and is delivered by Oldham Council Arts Development.
Whilst the total number of cinema facilities in the UK is broadly unchanged over the past decade, there have been some changes in the market with the growth of smaller or ‘boutique’ cinemas, led by operators such as Everyman and The Light. In 2017, there were approximately 6.4 cinema screens per 100,000 persons in in the UK (Source: British Film Institute Statistical Yearbook, 2017). This would indicate current capacity for 22 cinema screens in the study area, rising to 24 screens by 2037 (assuming an unlikely 100 per cent expenditure retention rate). The Odeon in Oldham Town Centre has seven screens. As such, we consider that that there is theoretical capacity for an additional 17 screens in the study area over the study period (not allowing for ‘The Small Cinema’ in Oldham Town Centre). Any new cinema will, however, have to compete with the Odeon in Oldham Town Centre and cinemas outside of Oldham Borough, in Ashton-under-Lyne, Rochdale and Manchester, and as noted above it is unrealistic to assume that all trips to cinemas will be captured by facilities within Oldham Borough.
Games of chance – spending in this sector will also experience significant growth over the study period. However, an increasing proportion of expenditure is expected to be spent online. We do not consider there to be any specific opportunities for new development in this sub-sector.
Hairdressing and personal grooming – whilst available expenditure growth in this sub-sector will be relatively small, we note that spending on these services occurs on a more localised basis. Our performance analysis identified that Royton, Shaw and Lees are well served by hairdressing and personal grooming services.
Recreational and sporting services – the diversification of the health and fitness sector has resulted in significant growth over recent years. Whilst there is a growing population in Oldham Borough and popularity of the health and fitness sector is increasing, we do not consider there to be scope for the development of additional commercial gyms and related facilities, primarily due to existing commitments for health and fitness facilities. ‘Big box’ Class D2 leisure uses such as trampolining centres and children’s soft play is also a growing market area in the UK, although they are often difficult uses to accommodate within traditional town centres due to their space requirements. However, given the large size of Oldham Town Centre, we consider there to be opportunities to accommodate such uses there and that these uses should be encouraged in order to provide additional facilities for indoor sports, leisure and family entertainment, whilst reducing the amount of vacant floorspace within the town centre.
84
Food and Beverage Spending
8.2.6 Spreadsheet 6 of Appendix E summarises existing spending patterns on food and beverage facilities by residents of the study area (this considers spending on restaurants, cafés, pubs and bars). In terms of destinations within Oldham Borough, Oldham Town Centre has the highest market share, of 13 per cent. Royton District Centre has a market share of 7 per cent, Uppermill District Centre is 6 per cent and Chadderton District Centre is 5 per cent. The market share achieved by the other four district centres is below 5 per cent.
8.2.7 In total, 40 per cent of food and beverage expenditure is retained within Oldham Town Centre and the seven district centres. In terms of destinations outside of Oldham Borough, Ashton-under-Lyne Town Centre, Manchester City Centre and Rochdale Town Centre are the most popular destinations. Other expenditure is directed to a diverse range of destinations.
8.2.8 Given that food and beverage expenditure currently accounts for 53 per cent of all available leisure services expenditure within the study area, and that such uses are increasingly important to the vitality and attractiveness of town centres (as discussed in Section 3 of this report), we have undertaken a more detailed assessment of expenditure capacity for this sub-sector.
8.2.9 Our detailed findings are set out in Spreadsheet 7 of Appendix E, which sets out expenditure capacity. A constant expenditure retention rate of 41.5 per cent is applied throughout the study period.
8.2.10 Spreadsheet 7 calculates food and beverage expenditure capacity by applying the assumed retention rate to total available food and beverage expenditure capacity in the assessment year and deducting the total turnover of existing facilities within the study area. These findings are summarised below in Table 8.2.
8.2.11 Our assessment shows that in the period to 2037, additional expenditure of approximately £8.1 million could be available to support further food and beverage facilities within the study area.
8.2.12 Given the wide range of operators and formats in the food and beverage sub-sector, and the fast-moving nature of the market, it is difficult to accurately identify floorspace requirements on the basis of available expenditure. Given that Oldham is the only town centre within the study area that has a sizeable and established food and beverage offer, we have calculated an existing sales density based on Experian Goad floorspace figures and existing food and beverage turnover figures for that town centre. Experian Goad data shows that Oldham Town Centre has 8,160 sq.m gross floorspace in the ‘restaurants, cafés etc.’ sub-category and 4,660 sq.m gross floorspace in pubs or bars, giving a total of 12,820 sq.m gross. Spreadsheet 6 of Appendix E shows that Oldham Town Centre attracted £41.4 million of food and beverage expenditure in 2019, which would equate to a sales density of approximately £3,250 per sq.m, rising to £3,500 per sq.m in 2037.
8.2.13 Table 8.3 below sets out our estimates of potential food and beverage floorspace requirements over the study period, on the assumption that these typical sales densities would apply to new development across the study area. The figures in Table 7.3 are based on a stable retention rate scenario, which we consider to be the most appropriate given the existing lack of provision within some parts of the Borough.
Table 8.3 Food and Beverage Floorspace Capacity
2037
Expenditure Capacity Floorspace Requirements
£8.1m 2,314 sq.m
85
8.2.14 A proportion of this capacity will be taken up by and future proposals for A3 and A4 development. There is likely to be scope to deliver additional facilities given existing market share, whilst improving Oldham Town Centre. In the district centres, there is limited scope to increase food and beverage provision, except potentially in the larger district centres, such as Shaw and Royton.
8.3 Other Main Town Centre Uses
Offices and Related Employment Uses
8.3.1 Office development can play a key role in supporting trade within town centres. As well as driving footfall, offices often increase the overall affluence of a centre’s customer base and support the viability of better-quality retail and food and drink facilities. However, the viability of office development is dependent on the size and status of individual centres, with more limited demand for such development within smaller centres. Nevertheless, the Council should seek to prioritise sites in Oldham Town Centre where this would be viable, in order to support the economy of the principal town within the Borough and achieve the wider benefits that can be derived from the co-location of main town centre uses.
8.3.2 We anticipate that demand for offices will be highest in Oldham, being the principal town centre within the Borough. In reality, Oldham Town Centre is the only town centre that will be able to accommodate any significant new office and related employment development. Notwithstanding market constraints, the Council should seek to encourage such development where feasible given its potential to support the wider regeneration of other town centre.
Residential Uses
8.3.3 As with employment uses, residential development in town centres serves to support footfall and trade. We consider that new residential development in Oldham Town Centre is likely to be viable, as part of developments such as the Prince’s Gate / Oldham Mumps development. According to Goad, there is 15,970 sq.m of gross vacant floorspace within Oldham Town Centre, meaning there are opportunities to facilitate residential development. Where development sites within the town centre do come forward then the Council should encourage mixed-use development wherever this is appropriate, including residential uses at upper floors.
8.3.4 In contrast, the district centres are much smaller and contain much less vacant floorspace (Shaw has the most with 4,090 sq.m gross vacant floorspace). As such, opportunities for residential development within these centres are likely to be more limited. In any event, demand for living within these lower order centres is likely to be less than in Oldham Town Centre. That being said, any new residential development within, and on the edges of, these defined centres could play a significant role in supporting their overall performance, better integrating the centre with surrounding residential areas, overcoming the barrier effects of existing infrastructure and encouraging more trips via non-car modes of transport. Given existing market realities, the Council may need to consider innovative delivery models and specialist residential sectors, such as retirement and supported living, which can help to create a loyal customer base for the town centre.
8.4 Conclusions
8.4.1 We have considered the growth in expenditure available to residents of the study area in all main sub-sectors of the leisure market. We have found that a moderate amount of additional expenditure is likely to be available to support leisure development within the Borough’s main centres in the period to 2037 (albeit more expenditure would be available if commitments are no longer considered realistic do not come forward). In monetary terms, growth in expenditure would be greatest in the food and beverage sub-sector and the cultural services sub-sector.
8.4.2 Given the dominance of the former in terms of overall spending on leisure services, we have undertaken a more detailed assessment of expenditure capacity taking account of existing market shares. Our assessment has shown that additional expenditure of up to approximately
86
£8.5 million would be available to support new food and beverage facilities in the period to 2037, on the basis of a constant retention rate. We therefore consider there to be potential (in quantitative need terms) to further strengthen the existing food and beverage provision in Oldham Town Centre.
8.4.3 In terms of other leisure services, and other main town centre uses, we note that there is potential for new development in Oldham Town Centre. We consider that public and / or private sector investment in new cultural and entertainment facilities could encourage the development of new food and beverage facilities and diversify the offer of the town centre. New residential or employment development within or adjacent to the town centre would also help to expand its customer base and reintegrate the existing centre and bring it all together.
Main Report Oldham Retail & Leisure Study
87
9 Summary of Findings, and Recommendations 9.1 Introduction
9.1.1 In this concluding section we summarise the findings of this study and set out our recommendations for the formulation of future planning policy within Oldham Borough. We provide recommendations in terms of retail and leisure requirements over the plan period and meeting these needs in a manner that will support the vitality and viability of the Borough’s town and district centres.
9.2 The Performance of Oldham Borough’s Town and District Centres
9.2.1 In Section 4 of this report we considered the performance of Oldham Town Centre and the Borough’s seven district centres in terms of the indicators of vitality and viability set out within national Planning Policy Guidance. We summarise are findings in respect of the individual centres below.
Oldham Town Centre
9.2.2 The health of Oldham Town Centre is mixed. In terms of positives, the town centre contains many national multiple retailers, including Boots, Debenhams, H&M, Next and Primark and there is strong representation across the various retail categories. The proportion of food and drink units is similar to the national average and there are 19 cafés and 10 restaurants within the town centre. The town centre is easily accessible by car and tram and there is good parking provision within Oldham Town Centre.
9.2.3 However, the health of the town centre has deteriorated since the 2009 Study. The proportion of vacant units in the town centre is almost double the current national average. The number of vacant units has increased by 39 units since 2009, which points to a lack of demand for floorspace within Oldham Town Centre. The town centre environment could be improved, particularly around the Spindles Town Square Shopping Centre and Tommyfield Market.
9.2.4 Whilst the town centre has managed to hold onto some national multiple retailers during the restructuring of the retail industry, it is clear that there is too much retail floorspace in the town centre. To prevent further decline in the health of the town centre, interventions will be required, such as those that can be achieved via initiatives such as the Future High Streets Fund, to enable parts of the town centre to move away from retail. The town centre would benefit from safe cycle storage. Potential locations for safe cycle storage include Central Bus Station, Lord Street and Tommyfield Market.
Shaw District Centre
9.2.5 On the whole, Shaw District Centre is not performing well and has declined in health since the 2009 Study. The proportion of vacant units has increased significantly and is well above the national average. The physical environment has experienced a gradual decline and no longer offers an attractive environment to shop in.
9.2.6 Notwithstanding the overall conclusion outlined above, the proportion of convenience goods and comparison goods retailers is similar to what would be expected for a centre of this size. The retail rents typically commanded by units within Shaw are above other similar-sized centres. Furthermore, Shaw is easily accessible by car, bus and tram.
Royton District Centre
9.2.7 The physical environment could be improved through the renovation of Market Square. Notwithstanding this, Royton District Centre is relatively healthy and performing well. The
Main Report Oldham Retail & Leisure Study
88
centre is anchored by two medium-sized foodstores. The vacancy rate is low and has remained below the national average since the 2009 Study. The centre has a good representation of retailers, a reasonable level of evening economy uses and a thriving market. Commercial retail rents are comparable to other district centres in Oldham Borough and the centre is easily accessible by car.
Uppermill District Centre
9.2.8 Uppermill is performing very well and is a healthy centre. The centre is almost fully occupied, with there being just two vacant units present. Uppermill is attractive with a relatively high proportion of comparison goods retailers. The centre is covered by a conservation area and contains a high number of independent retailers. Uppermill also has a reasonable evening economy and a low crime rate.
Lees District Centre
9.2.9 Lees is also currently performing well. There are only five vacant units within the centre, and it is easily accessible by car whilst pedestrian footfall was high when surveyed. Lees is an attractive centre with low reported crimes. There are no national multiple retailers within the centre, and parking provision is limited, but that is not unusual for this size of centre.
Hill Stores District Centre
9.2.10 Hill Stores is reasonably healthy and is performing as expected for a small district centre. The centre is dominated by a Tesco Extra superstore, which draws trade from residents across a wide area. Hill Stores is accessible by car and tram and crime rates in and around the centre are low.
9.2.11 Hill Stores would be vulnerable if Tesco was to leave the centre. The centre has a high number of takeaways, which draws visitors to the centre but does not necessarily lead to linked trips to retail facilities with other businesses in Hill Stores. The physical environment could be improved by providing more pedestrian crossing points along the A62.
Chadderton District Centre
9.2.12 Chadderton is a small centre anchored by Asda, which is centred around Chadderton Precinct and is reasonably healthy. There are just three vacant units within the centre and Chadderton contains a high proportion of national multiple operators relative to its size. Parking is plentiful in the centre.
Failsworth District Centre
9.2.13 Failsworth is the smallest district centre within Oldham Borough and contains just eight units. The centre is anchored by Tesco Extra and contains a high proportion of national multiple operators. There are no vacant units within the centre, which is reasonably attractive and is easily accessible by car and tram. When compared against key performance indicators, the centre is more than satisfactory . Failsworth is performing well and is a healthy centre. The centre is somewhat disjointed but serves a purpose and meets a local need.
9.3 Retail Needs over the Study Period
9.3.1 Based on the findings of our quantitative assessment of retail needs, set out in Section 6, we forecast that requirements for additional retail floorspace within the study area will be as set out below within Table 9.1.
Main Report Oldham Retail & Leisure Study
89
Table 9.1 Summary of Retail Sales Floorspace Requirements (2019-2037)
Convenience Retail Floorspace (sq.m net)
Comparison Retail Floorspace (sq.m net)
2019-2037 -1,447 2,381
9.3.2 Table 9.1 indicates a negative figure for convenience retail floorspace over the study period. Therefore, there is no quantitative need for additional convenience retail provision, taking into account existing commitments and increases in floorspace efficiency over the study period. However, this does not mean that the Council will not receive applications for new foodstores – such proposals make seek to divert trade from existing foodstores.
9.3.3 In qualitative terms, we note that the centres within Oldham Borough are already well served by a number of different foodstores providing a ranging of choice to local residents such as Oldham (Sainsbury’s), Shaw (Asda and Aldi), Royton (Lidl and Co-op), Uppermill (Co-op), Lees (edge-of-centre Co-op), Hill Stores (Tesco Extra), Chadderton (Asda) and Failsworth (Tesco Extra and Aldi). Accordingly, there is no qualitative need for additional convenience retail provision over the study period above that which is already operating or programmed to be delivered.
9.3.4 Table 9.1 shows a maximum requirement for an additional 2,381 sq.m of comparison retail sales area floorspace over the study period, which is a relatively modest requirement. We consider that the majority of this floorspace should be located within Oldham Town Centre, to retain its current market share and to diversify its comparison retail offer. Should any comparison retail commitments also fail to come forward over the period, any additional floorspace requirement arising should also be concentrated in Oldham Town Centre, rather than the district centres, which perform more localised functions.
9.3.5 In terms of qualitative needs, Oldham Town Centre has too much vacant retail floorspace and the health of the centre would benefit from other uses in place of clusters of vacant retail units, such as offices and residential uses. Shaw contains just one bank and the loss of this would be detrimental to the district centre. Royton is performing to an acceptable level. Uppermill is performing well and is not particularly deficient in any area. Lees lacks convenience retail provision although there is a Co-op on the edge of the district centre. Hill Stores contains a cluster of vacant units which could be recycled or repurposed for other uses. As with Uppermill, Chadderton is not particularly lacking in convenience retail, comparison retail or service provision. Failsworth is a very small district centre but performs a function in the local area.
9.4 Need for Leisure and Other Main Town Centre Uses over the Study Period
9.4.1 We have considered the growth in expenditure available to residents of the study area in all main sub-sectors of the leisure market. We have found that some additional expenditure is likely to be available to support leisure development within the Borough’s main centres in the period to 2037. In monetary terms, growth in expenditure would be greatest in the food and beverage sub-sector and the cultural services sub-sector.
9.4.2 Given the dominance of the former in terms of overall spending on leisure services, we have undertaken a more detailed assessment of expenditure capacity taking account of existing market shares. Our assessment has shown that additional expenditure of up to approximately £8.1 million would be available to support new food and beverage facilities in the period to 2037, on the basis of a constant retention rate. We therefore consider there to be potential (on a quantitative need basis) to further strengthen the existing food and beverage provision in Oldham Town Centre.
9.4.3 In terms of other leisure services, and other main town centre uses, we note that there is potential for new development in Oldham Town Centre, for example, with a new small-scale boutique cinema facility and additional food and beverage floorspace. New residential or
Main Report Oldham Retail & Leisure Study
90
employment development within or adjacent to the town centre would also help to expand its customer base and reintegrate the existing centre and bring it all together.
9.5 Meeting Needs and Other Recommendations
9.5.1 In view of our findings in respect of the current performance of the Borough’s main centres, current expenditure patterns and the capacity for additional retail and leisure development over the study period, we set out below our recommendations in terms of potential strategies for meeting these future needs and supporting town centre regeneration. We consider that the retail hierarchy within Oldham Borough, currently set out by Policy 15 of the Joint Core Strategy Development Management Policies Document, continues to be appropriate (insofar as it relates to Oldham Town Centre and the district centres). Whilst the district centres vary in terms of their size and the issues that they face, they all individually perform a range of functions that distinguish them from other, smaller centres within the Borough.
Retail Hierarchy
9.5.2 Policy 15 Centres states that Oldham Town Centre and the centres of Chadderton, Failsworth, Hill Stores, Lees, Royton, Shaw and Uppermill make significant contributions to the Borough and act as focal points for its commercial, shopping, social, civic, community and cultural activities. Oldham Town Centre should at least maintain, and if possible, enhance, its existing role as the Bough’s principal centre by improving the quality as well as the quantity of its retail offer. The Borough’s retail hierarchy is defined as:
Oldham Town Centre.
The centres of Chadderton, Failsworth, Hill Stores, Lees, Royton, Shaw and Uppermill.
Local shopping parades.
Oldham Town Centre
9.5.3 As set out above, Oldham currently has a mixed performance, and the health of the town centre has deteriorated, affected by the global financial crisis and restructuring in the retail industry. The centre would benefit from more uses other than retail the commercial leisure offer could be improved. The proportion of vacant units and floorspace in the town centre is far too high and close to double the national average. We therefore make the following recommendations in terms of Oldham Town Centre:
Whilst the capacity for comparison retail floorspace is relatively insignificant and long-term only, the town centre should be expected to accommodate the majority of the comparison retail floorspace requirements over the study period. Some of this can be taken up by recycling or redeveloping vacant units.
The foodstore market within the town centre is under-provided for on a qualitative need basis. Whilst Iceland and Heron Foods are present, there is lack of competition for the Sainsbury’s foodstore within the town centre. The nearest discount foodstore is the Lidl foodstore in Royton, located 2.5km north of Oldham Town Centre. The town centre could benefit from more convenience stores, potentially as part of residential-led mixed-use development.
Spindles Town Square Shopping Centre appears to be performing well (albeit does contain some vacancies) and contains many familiar national multiple retailers. As a key part of retailing within the town centre, we recommend that the Council should monitor the health of the shopping centre in the medium to long term.
Opportunities should be sought to improve the leisure offer within Oldham Town Centre, particularly in terms of food and beverage uses, which would help improve its evening economy.
Main Report Oldham Retail & Leisure Study
91
Investment in cultural and entertainment facilities should also be encouraged to diversify the town centre offer and strengthen the evening economy.
The Prince’s Gateway mixed-use development will deliver a foodstore, hotel, parking and smaller retail units within a key town centre site opposite the Metrolink tramline. We understand that there are also plans for office and residential development at other nearby sites. Further development opportunities should be identified in this area and on the edges of the town centre to accommodate higher density mixed use development, including residential and employment uses.
It is important that the Council focuses on integrating the developments at Prince’s Gateway with the traditional town centre. This could be achieved by providing active frontages along linking streets.
To be successful, areas of the Oldham Town Centre that are struggling should be considered for uses other than large retail units occupied by national multiples, which are unlikely to return to the town centre. Successful high streets need to have a mix of independent shops, markets, well-known retail chains, leisure & entertainment, community facilities and key services.
We recommend that a tightly drawn primary shopping area should be defined for the town centre. This should help focus retail development in the primary shopping area and other new development within the town centre boundary, whilst assisting with re-developing vacant units, the proportion of which, is far too high currently.
District Centres
9.5.4 The Council should seek to ensure that the district centres continue to provide day-to-day retail and service facilities to its residents, whilst supporting independent operators through a difficult period in the town centre and retail sector (where possible). If retailers leave the district centres, particularly national multiples, they are unlikely to be replaced with other retailers (particularly in terms of national multiples), meaning the offer in the district centres will likely need to be diversified.
9.6 Town and District Centre Boundaries
9.6.1 We have reviewed the existing town centre boundaries and primary shopping areas (where applicable) for Oldham Town Centre and the district centres and our recommendations are provided within Appendix G. The proposed boundaries are based on the definitions of primary shopping areas / town centre boundaries within Annex 2: Glossary of the NPPF and proposed amendments are based on our professional judgement.
9.6.2 The proposed town centre boundaries and primary shopping areas are largely the same as the boundaries identified within the adopted development plan. One notable amendment is the extension of the town centre boundary within Lees to incorporate the Co-op foodstore. We believe the Co-op foodstore and car park should be considered within the boundary as the foodstore is an anchor to the district centre and the car park is well utilised by those visiting the centre.
9.7 Local Impact Floorspace Threshold
9.7.1 The PPG states that the impact test only applies to proposals exceeding 2,500 sq.m gross of floorspace unless a different locally appropriate threshold is set by the local planning authority. In setting a locally appropriate threshold it will be important to consider the:
scale of proposals relative to town centres;
the existing viability and vitality of town centres;
cumulative effects of recent developments;
whether local town centres are vulnerable;
Main Report Oldham Retail & Leisure Study
92
likely effects of development on any town centre strategy; and
impact on any other planned investment.
9.7.2 As a guiding principle, impact should be assessed on a like-for-like basis in respect of that particular sector (for example, it may not be appropriate to compare the impact of an out of centre DIY store with small scale town-centre stores as they would normally not compete directly). Retail uses tend to compete with their most comparable competitive facilities. Conditions may be attached to appropriately control the impact of a particular use.
9.7.3 Policy 16 of the Joint Core Strategy states that the following uses will be permitted outside the defined town and district centres provided they satisfy the requirements of national and local policies:
i. Local shops with a gross floorspace of 500 sq.m or less.
1. Leisure facilities with a gross floorspace of 1,000 sq.m or less.
9.7.4 There is not currently a locally set impact threshold for retail and leisure development outside of town centres, which are not in accordance with an up-to-date plan. We consider that the NPPF minimum threshold of 2,500 sq.m gross is inappropriate as a blanket threshold across Oldham Borough. Retail development smaller than 2,500 sq.m gross could have a significant adverse impact, on centres within the Borough. The adoption of a reduced threshold is recommended.
9.7.5 We have considered the scale of Oldham Town Centre and its relatively high turnover, but also its current health, high vacancy rate and potential vulnerability to market changes. On this basis, we recommend that the impact threshold for Oldham Town Centre should be set at 1,500 sq.m gross.
9.7.6 The district centres are much more vulnerable to impacts from edge- and out-of-centre retail proposals. Accordingly, a threshold of 300 sq.m gross is considered appropriate for all of the district centres.
9.8 Monitoring and Review
9.8.1 There are a number of indicators that should be monitored by the Council to determine likely changes to retail floorspace requirements over the development plan period, which include:
the Council should have regard to the rate of housing development in the Borough and pay close attention to any revised population projections issued the Office for National Statistics or revised forecasts that emerge as a result of other evidence base work;
the implementation of existing retail commitments. Non-implementation of commitments or the expiry of existing planning permissions will create additional capacity;
expenditure growth rates reflect general economic conditions and therefore an acceleration in economic growth is likely to result in higher floorspace requirements as a result of increased expenditure growth rates. Conversely, any future economic downturn is likely to reduce floorspace requirements as a result of lower or negative expenditure growth rates; and
the market share of non-store retail sales (special forms of trading). Such market shares have increased considerably in recent years, but it remains to be seen whether this growth will be maintained.
9.8.2 In addition to monitoring, we recommend that the Council should maintain an up-to-date picture of the performance of the defined centres of Oldham Town Centre and the district centres and any qualitative retail needs by continuing to review the composition of the centres, vacancy rates and environmental quality.
9.8.3 Any sustained and significant changes in any of the key indicators should trigger a review and update of this assessment to ensure that the Council is meeting objectively assessed retail
Main Report Oldham Retail & Leisure Study
93
needs, encouraging sustainable shopping patterns and implementing the most appropriate strategy to support the vitality and viability of Oldham Town Centre and the district centres.
OL1 4, OL2 7 and OL28OL1 2, OL2 5 and OL2 6M24 1, OL9 0, OL9 8 and OL9 9M35 0, M35 9 and OL8 3OL 3, OL4 4 and OL4 5OL3 5, OL3 6 AND OL3 7OL1 1, OL1 3, OL4 1 and OL4 2OL8 1, OL8 2, OL8 4, OL9 6 AND OL9 7OL11 2, OL16 3, OL16 4, M24 2 and M24 6OL5 O, OL5 9, OL6 8, OL6 9, OL7 9 and SK15 3
Post Code SectorsSurvey Zone
Oldham Council
Main Report Oldham Retail & Leisure Study
Appendix B NEMS Household Survey Data
This market research and the design of material used to obtain this survey information have been originated by and belong to NEMS market research and may not be used or reproduced in whole or part without the company's written consent, or that of the Client.
NEMS market research 22 Manor Way Belasis Hall Technology Park Billingham TS23 4HN Tel 01642 37 33 55 www.nemsmr.co.uk
Oldham Household Survey for Peter Brett Associates December 2019 Job Ref:151019
NEMS market research 2 Oldham Household Survey, December 2019
Table of Contents Introduction: Research Background & Objectives 3 Research Methodology 3 Sampling 3 Weightings 5 Statistical Accuracy 7 Data Tables 8 Appendices: Data Tabulations - By Zone 10-96 By Zone (Weighted) 98-185 By Q34 x Q33 187-189 By Q34 x Q33 (Weighted) 191-193 Other Responses – Summary Counts 195-206 Composite Analysis (Incl. SFT) Composite Analysis (Excl. SFT) Sample Questionnaire
NEMS market research 3 Oldham Household Survey, December 2019
Introduction
1.1 Research Background & Objectives To conduct a survey amongst residents in the Oldham area to assess shopping habits for main food and grocery, top-up food, non-food shopping and leisure activities.
1.2 Research Methodology A total of 1,010 telephone interviews were conducted between Thursday 7th November 2019 and Monday 9th December 2019. Interviews were conducted using NEMS in-house CATI (Computer Assisted Telephone Interviewing) Unit. Respondents were contacted during the day and in the evening. All respondents were the main shopper in the household, determined using a preliminary filter question.
1.3 Sampling
1.3.1 Survey Area The survey area was segmented into 10 zones, defined using postcode sectors. The zone details were:
Zone Postcode Sectors Number of Interviews
1 OL1 4, OL2 7, OL2 8 100
2 OL1 2, OL2 5, OL2 6 108
3 M24 1, OL9 8, OL9 9, OL9 0 100
4 M35 9, M35 0, OL8 3 100
5 OL4 3, OL4 4, OL4 5 100
6 OL3 5, OL3 6, OL3 7 101
7 OL1 1, OL1 3, OL4 1, OL4 2 100
8 OL8 1, OL8 2, OL8 4, OL9 6, OL9 7 100
9 OL11 2, OL16 3, OL16 4, M24 2, M24 6 100
10 OL5 9, OL5 0, OL6 8, OL6 9, OL7 9, SK15 3 101
Total 1,010
NEMS market research 4 Oldham Household Survey, December 2019
1.3.2 Telephone Numbers All available telephone numbers are used to obtain the sample of interviews. This includes published telephone numbers and ex-directory numbers as the demographic profile of this sub-set is different to the demographics of the published numbers. All numbers are randomly generated using the area code as a ‘seed’. Business numbers are de-duped and excluded. We don’t screen against the TPS (Telephone Preference Service) database, again because the demographic profile of TPS registered numbers is slightly different to the rest of the population. In addition, there is no legal requirement to screen against TPS registered numbers; market research is not classified as unsolicited sales and marketing.
1.3.3 Sample Profile It should be noted that as per the survey’s requirements, the profile of respondents is that of the main shopper / person responsible for most of the food shopping in the household. As such it will always differ from the demographic profile of all adults within the survey area. With any survey among the main shopper / person responsible for most of the food shopping in the household the profile is typically biased more towards females and older people. The age of the main shopper / person responsible for most of the food shopping in the household is becoming older due to the financial constraints on young people setting up home. A number of measures are put in place to ensure the sample is representative of the profile of the person responsible for most of the food / shopping in the household. First of all, interviewing is normally spread over a relatively long period of time, certainly longer than the theoretical minimum time it would take. This allows us time to call back people who weren't in when we made the first phone call. If we only interview people who are at home the first time we call, we over-represent people who stay at home the most; these people tend to be older / less economically active. We also control the age profile of respondents; this is a two-stage process. First of all, we look at the age profile of the survey area according to the latest Census figures. Using a by-product from additional data we collect from a weekly telephone survey of a representative sample of all adults across the country we know the age profile of the main shopper in any given area. This information is from data based on in excess of 100,000 interviews and is regularly updated and is therefore probably the most accurate and up to date information of its kind.
NEMS market research 5 Oldham Household Survey, December 2019
Stratified random sampling helps ensure that the sample is as representative as possible. While the system dials the next randomly selected number for interviewers, all calls are made by interviewers; no automated call handling systems are used.
1.3.4 Time of Interviewing Approximately two-thirds of all calls are made outside normal working hours.
1.3.5 Monitoring of Calls At least 5% of telephone interviews are randomly and remotely monitored by Team Leaders to ensure the interviewing is conducted to the requisite standard. Both the dialogue and on-screen entries are monitored and evaluated. Interviewers are offered re-training should these standards not be met.
1.4 Weightings To correct the small differences between the sample profile and population profile, the data was weighted. The population is of the main shopper in the household. Weightings have been applied to age bands based on an estimated age profile of main shoppers (see section 1.3.3 for details). The weighted totals differ occasionally from the adjusted population due to rounding error. Details of the age weightings are given in the table below:
Age Main Shopper Profile (%)
Interviews Achieved
Age Weightings
18-34 23.0% 98 2.3753
35-44 19.1% 79 2.4437
45-54 18.3% 248 0.7454
55-64 17.8% 178 1.0125
65+ 21.7% 407 0.5386
(Refused) n/a 0 1.0000
Total 1,010
NEMS market research 6 Oldham Household Survey, December 2019
Further weightings were then applied to adjust zone samples to be representative by population. Details of those weightings are given in the table below:
Zone Population * Interviews Achieved
Interviews Achieved (Weighted
by Age)
Zone Weightings
1 22,562 100 73 1.1822
2 25,196 108 130 0.7405
3 31,152 100 112 1.0672
4 24,717 100 98 0.9657
5 18,436 100 89 0.7975
6 12,399 101 89 0.5335
7 18,753 100 106 0.6779
8 30,437 100 130 0.8958
9 38,822 100 98 1.5197
10 41,362 101 86 1.8468
Total 263,836 1,010
* Source: Census 2011
NEMS market research 7 Oldham Household Survey, December 2019
1.5 Statistical Accuracy As with any data collection where a sample is being drawn to represent a population, there is potentially a difference between the response from the sample and the true situation in the population as a whole. Many steps have been taken to help minimise this difference (e.g. random sample selection, questionnaire construction etc) but there is always potentially a difference between the sample and population – this is known as the standard error. The standard error can be estimated using statistical calculations based on the sample size, the population size and the level of response measured (as you would expect you can potentially get a larger error in a 50% response than say a 10% response simply because of the magnitude of the numbers). To help understand the significance of this error, it is normally expressed as a confidence interval for the results. Clearly to have 100% accuracy of the results would require you to sample the entire population. The usual confidence interval used is 95% - this means that you can be confident that in 19 out of 20 instances the actual population behaviour will be within the confidence interval range. For example, if 50% of a sample of 1,010 answers “Yes” to a question, we can be 95% sure that between 46.9% and 53.1% of the population holds the same opinion (i.e. +/- 3.1%). The following is a guide showing confidence intervals attached to various sample sizes from the study:
%ge Response 95% confidence interval
10% ±1.9%
20% ±2.5%
30% ±2.8%
40% ±3.0%
50% ±3.1%
NEMS market research 8 Oldham Household Survey, December 2019
1.6 Data Tables Tables are presented in question order with the question number analysed shown at the top of the table. Those questions where the respondent is prompted with a list of possible answers are indicated in the question text with a suffix of [PR]. The sample size for each question and corresponding column criteria is shown at the base of each table. A description of the criteria determining to whom the question applies is shown in italics directly below the question text; if there is no such text evident then the question base is the full study sample. If the tabulated data is weighted (indicated in the header of the tabulations), in addition to the sample base, the weighted base is also shown at the bottom of each table. Unless indicated otherwise in the footer of the tabulations, all percentages are calculated down the column. Arithmetic rounding to whole numbers may mean that columns of percentages do not sum to exactly 100%. Zero per cent denotes a percentage of less than 0.05%. Percentages are calculated on the number of respondents and not the number of responses. This means that where more than one answer can be given to a question the sum of percentages may exceed 100%. All such multi-response questions are indicated in the tabulated by a suffix of [MR] on the question text. Where appropriate to the question, means are shown at the bottom of response tables. These are calculated in one of two ways: if the data is captured to a coded response a weighted mean is calculated and the code weightings are shown as a prefix above the question text; if actual specific values were captured from respondents these individual numbers are used to calculate the mean.
Appendix 1: Data Tabulations By Zone
by Zone Oldham Household Survey Page 10 for Peter Brett Associates December 2019
Total Zone 1 - Shaw Zone 2 - Royton
Zone 3 - Chadderton
Zone 4 - Failsworth
Zone 5 - Lees Zone 6 - Uppermill
Zone 7 - Oldham East
Zone 8 - Oldham West
Zone 9 - Rochdale
South
Zone 10 - Mossley
151019 NEMS market research
Q01 Where did your household last undertake a main food and grocery purchase? Aldi, Ashton New Road,
by Zone Oldham Household Survey Page 18 for Peter Brett Associates December 2019
Total Zone 1 - Shaw Zone 2 - Royton
Zone 3 - Chadderton
Zone 4 - Failsworth
Zone 5 - Lees Zone 6 - Uppermill
Zone 7 - Oldham East
Zone 8 - Oldham West
Zone 9 - Rochdale
South
Zone 10 - Mossley
151019 NEMS market research
Q04 When your household undertakes its main food and grocery spend (STORE MENTIONED AT Q01) does it visit other shops, leisure or service outlets on the same shopping trips? And if so which ones? [MR]
Not those who shop online at Q01 Yes - financial service (i.e.
by Zone Oldham Household Survey Page 19 for Peter Brett Associates December 2019
Total Zone 1 - Shaw Zone 2 - Royton
Zone 3 - Chadderton
Zone 4 - Failsworth
Zone 5 - Lees Zone 6 - Uppermill
Zone 7 - Oldham East
Zone 8 - Oldham West
Zone 9 - Rochdale
South
Zone 10 - Mossley
151019 NEMS market research
Mean score [Times a week]: Everyday = 7, 5 - 6 times a week = 5.5, 3 - 4 times a week = 3.5, Twice a week = 2, Once a week = 1, Once every two weeks = 0.5, Once a month = 0.25, Less often = 0.1 Q06 How often does your household normally visit its main food and grocery shopping destination (STORE MENTIONED AT Q01)? Everyday 2.0% 20 2.0% 2 2.8% 3 2.0% 2 2.0% 2 1.0% 1 2.0% 2 2.0% 2 0.0% 0 5.0% 5 1.0% 15 - 6 times a week 0.8% 8 0.0% 0 0.0% 0 0.0% 0 1.0% 1 0.0% 0 3.0% 3 0.0% 0 1.0% 1 0.0% 0 3.0% 33 - 4 times a week 4.6% 46 6.0% 6 5.6% 6 3.0% 3 4.0% 4 4.0% 4 4.0% 4 4.0% 4 2.0% 2 5.0% 5 7.9% 8Twice a week 8.4% 85 9.0% 9 10.2% 11 11.0% 11 5.0% 5 8.0% 8 5.0% 5 9.0% 9 7.0% 7 12.0% 12 7.9% 8Once a week 70.5% 712 74.0% 74 64.8% 70 75.0% 75 73.0% 73 74.0% 74 70.3% 71 70.0% 70 75.0% 75 66.0% 66 63.4% 64Once every two weeks 6.0% 61 4.0% 4 5.6% 6 4.0% 4 7.0% 7 9.0% 9 5.9% 6 6.0% 6 6.0% 6 5.0% 5 7.9% 8Once a month 4.6% 46 3.0% 3 4.6% 5 3.0% 3 2.0% 2 3.0% 3 5.0% 5 7.0% 7 6.0% 6 5.0% 5 6.9% 7Less often 0.3% 3 1.0% 1 0.0% 0 0.0% 0 1.0% 1 0.0% 0 1.0% 1 0.0% 0 0.0% 0 0.0% 0 0.0% 0(Don't know / varies) 2.9% 29 1.0% 1 6.5% 7 2.0% 2 5.0% 5 1.0% 1 4.0% 4 2.0% 2 3.0% 3 2.0% 2 2.0% 2Mean: 1.30 1.31 1.37 1.27 1.27 1.18 1.34 1.24 1.10 1.49 1.39Base: 1010 100 108 100 100 100 101 100 100 100 101
by Zone Oldham Household Survey Page 20 for Peter Brett Associates December 2019
Total Zone 1 - Shaw Zone 2 - Royton
Zone 3 - Chadderton
Zone 4 - Failsworth
Zone 5 - Lees Zone 6 - Uppermill
Zone 7 - Oldham East
Zone 8 - Oldham West
Zone 9 - Rochdale
South
Zone 10 - Mossley
151019 NEMS market research
Q07 Where did your household last undertake your ‘top-up’ food and grocery purchases? (i.e smaller/ 'basket' shopping purchases which are not part of your main food and groceries shop) Aldi, East Way, Middleton,
Base: 1010 100 108 100 100 100 101 100 100 100 101 Mean score [Times a year]: Everyday = 365, 5 - 6 times a week = 286, 3 - 4 times a week = 182, Twice a week = 104, Once a week = 52, Once every two weeks = 26, Once a month = 12, Once every two
months = 6, 3 or 4 times a year = 3.5, Twice a year = 2, Once a year = 1, Less often = 0.5 Q15 How often do you visit (LOCATION MENTIONED AT Q14) for clothes or shoes shopping? Not Don't know and not Don't do at Q14 Everyday 0.4% 4 0.0% 0 0.0% 0 0.0% 0 0.0% 0 0.0% 0 0.0% 0 1.0% 1 2.1% 2 0.0% 0 1.0% 15 - 6 times a week 0.0% 0 0.0% 0 0.0% 0 0.0% 0 0.0% 0 0.0% 0 0.0% 0 0.0% 0 0.0% 0 0.0% 0 0.0% 03 - 4 times a week 0.6% 6 0.0% 0 0.0% 0 1.1% 1 0.0% 0 0.0% 0 1.1% 1 1.0% 1 2.1% 2 0.0% 0 1.0% 1Twice a week 1.1% 10 1.1% 1 1.0% 1 1.1% 1 1.0% 1 1.1% 1 0.0% 0 1.0% 1 1.0% 1 0.0% 0 3.1% 3Once a week 5.4% 51 2.2% 2 4.9% 5 10.5% 10 7.3% 7 6.3% 6 1.1% 1 5.1% 5 3.1% 3 8.0% 7 5.2% 5Once every two weeks 7.7% 73 7.6% 7 11.8% 12 8.4% 8 8.3% 8 8.4% 8 4.4% 4 7.1% 7 9.3% 9 6.8% 6 4.1% 4Once a month 21.0% 200 20.7% 19 28.4% 29 26.3% 25 17.7% 17 26.3% 25 23.1% 21 21.4% 21 16.5% 16 17.0% 15 12.4% 12Once every two months 16.7% 159 31.5% 29 11.8% 12 15.8% 15 14.6% 14 14.7% 14 15.4% 14 14.3% 14 16.5% 16 14.8% 13 18.6% 183 or 4 times a year 12.2% 116 10.9% 10 10.8% 11 6.3% 6 16.7% 16 9.5% 9 9.9% 9 13.3% 13 8.2% 8 15.9% 14 20.6% 20Twice a year 9.8% 93 5.4% 5 9.8% 10 10.5% 10 10.4% 10 6.3% 6 15.4% 14 8.2% 8 11.3% 11 11.4% 10 9.3% 9Once a year 2.8% 27 4.3% 4 2.0% 2 0.0% 0 2.1% 2 7.4% 7 2.2% 2 2.0% 2 3.1% 3 4.5% 4 1.0% 1Less often 4.1% 39 0.0% 0 1.0% 1 5.3% 5 5.2% 5 1.1% 1 8.8% 8 9.2% 9 6.2% 6 2.3% 2 2.1% 2(Don't know / varies) 18.2% 173 16.3% 15 18.6% 19 14.7% 14 16.7% 16 18.9% 18 18.7% 17 16.3% 16 20.6% 20 19.3% 17 21.6% 21Mean: 15.60 10.92 13.94 17.87 13.06 13.75 9.99 18.26 25.09 12.00 20.59Base: 951 92 102 95 96 95 91 98 97 88 97
by Zone Oldham Household Survey Page 37 for Peter Brett Associates December 2019
by Zone Oldham Household Survey Page 38 for Peter Brett Associates December 2019
Total Zone 1 - Shaw Zone 2 - Royton
Zone 3 - Chadderton
Zone 4 - Failsworth
Zone 5 - Lees Zone 6 - Uppermill
Zone 7 - Oldham East
Zone 8 - Oldham West
Zone 9 - Rochdale
South
Zone 10 - Mossley
151019 NEMS market research
Q17 And the time before that, where did your household make a purchase of clothes or shoes? Not Don't know and not Don't do at Q14 Costco, The Broadway,
by Zone Oldham Household Survey Page 43 for Peter Brett Associates December 2019
Total Zone 1 - Shaw Zone 2 - Royton
Zone 3 - Chadderton
Zone 4 - Failsworth
Zone 5 - Lees Zone 6 - Uppermill
Zone 7 - Oldham East
Zone 8 - Oldham West
Zone 9 - Rochdale
South
Zone 10 - Mossley
151019 NEMS market research
Q19 And the time before that, where did your household make a purchase of furniture, carpets, or soft household furnishings? Not Don't know and not Don't do at Q18 B&Q, Westhulme Way,
by Zone Oldham Household Survey Page 48 for Peter Brett Associates December 2019
Total Zone 1 - Shaw Zone 2 - Royton
Zone 3 - Chadderton
Zone 4 - Failsworth
Zone 5 - Lees Zone 6 - Uppermill
Zone 7 - Oldham East
Zone 8 - Oldham West
Zone 9 - Rochdale
South
Zone 10 - Mossley
151019 NEMS market research
Q21 And the time before that, where did your household make a purchase of DIY and decorating goods? Not Don't know and not Don't do at Q20 B&Q, Bridge Hall Lane,
by Zone Oldham Household Survey Page 50 for Peter Brett Associates December 2019
Total Zone 1 - Shaw Zone 2 - Royton
Zone 3 - Chadderton
Zone 4 - Failsworth
Zone 5 - Lees Zone 6 - Uppermill
Zone 7 - Oldham East
Zone 8 - Oldham West
Zone 9 - Rochdale
South
Zone 10 - Mossley
151019 NEMS market research
Q22 Can you tell me where you or your household last made a purchase of electrical items such as TVs, DVD players, digital cameras, MP3 players, mobile phones or computers? B&Q, Westhulme Way,
by Zone Oldham Household Survey Page 53 for Peter Brett Associates December 2019
Total Zone 1 - Shaw Zone 2 - Royton
Zone 3 - Chadderton
Zone 4 - Failsworth
Zone 5 - Lees Zone 6 - Uppermill
Zone 7 - Oldham East
Zone 8 - Oldham West
Zone 9 - Rochdale
South
Zone 10 - Mossley
151019 NEMS market research
Q23 And the time before that, where did you or your household make a purchase of electrical items such as TVs, DVD players, digital cameras, MP3 players, mobile phones or computers? Not Don't know and not Don't do at Q22 B&Q, Westhulme Way,
by Zone Oldham Household Survey Page 56 for Peter Brett Associates December 2019
Total Zone 1 - Shaw Zone 2 - Royton
Zone 3 - Chadderton
Zone 4 - Failsworth
Zone 5 - Lees Zone 6 - Uppermill
Zone 7 - Oldham East
Zone 8 - Oldham West
Zone 9 - Rochdale
South
Zone 10 - Mossley
151019 NEMS market research
Q24 Can you tell me where you or your household last made a purchase of domestic appliances, such as washing machines, fridges or cookers? B&Q, Sandbrook Park, off
by Zone Oldham Household Survey Page 59 for Peter Brett Associates December 2019
Total Zone 1 - Shaw Zone 2 - Royton
Zone 3 - Chadderton
Zone 4 - Failsworth
Zone 5 - Lees Zone 6 - Uppermill
Zone 7 - Oldham East
Zone 8 - Oldham West
Zone 9 - Rochdale
South
Zone 10 - Mossley
151019 NEMS market research
Q25 And the time before that, where did you or your household make a purchase of domestic appliances, such as washing machines, fridges or cookers? Not Don't know and not Don't do at Q24 B&Q, Snipe Retail Park,
by Zone Oldham Household Survey Page 65 for Peter Brett Associates December 2019
Total Zone 1 - Shaw Zone 2 - Royton
Zone 3 - Chadderton
Zone 4 - Failsworth
Zone 5 - Lees Zone 6 - Uppermill
Zone 7 - Oldham East
Zone 8 - Oldham West
Zone 9 - Rochdale
South
Zone 10 - Mossley
151019 NEMS market research
Q27 And the time before that, where did you or your household make a purchase of health, beauty or chemist items? Not Don't know and not Don't do at Q26 B&Q, Westhulme Way,
by Zone Oldham Household Survey Page 68 for Peter Brett Associates December 2019
Total Zone 1 - Shaw Zone 2 - Royton
Zone 3 - Chadderton
Zone 4 - Failsworth
Zone 5 - Lees Zone 6 - Uppermill
Zone 7 - Oldham East
Zone 8 - Oldham West
Zone 9 - Rochdale
South
Zone 10 - Mossley
151019 NEMS market research
Q28 Can you tell me where you or your household last made a purchase of recreational goods such as sports equipment, bicycles, musical instruments or toys? Ashton-under-Lyne town
by Zone Oldham Household Survey Page 70 for Peter Brett Associates December 2019
Total Zone 1 - Shaw Zone 2 - Royton
Zone 3 - Chadderton
Zone 4 - Failsworth
Zone 5 - Lees Zone 6 - Uppermill
Zone 7 - Oldham East
Zone 8 - Oldham West
Zone 9 - Rochdale
South
Zone 10 - Mossley
151019 NEMS market research
Q29 And the time before that, where did you or your household make a purchase of recreational goods such as sports equipment, bicycles, musical instruments or toys? Not Don't know and not Don't do at Q28 B&Q, Westhulme Way,
by Zone Oldham Household Survey Page 72 for Peter Brett Associates December 2019
Total Zone 1 - Shaw Zone 2 - Royton
Zone 3 - Chadderton
Zone 4 - Failsworth
Zone 5 - Lees Zone 6 - Uppermill
Zone 7 - Oldham East
Zone 8 - Oldham West
Zone 9 - Rochdale
South
Zone 10 - Mossley
151019 NEMS market research
Q30 And where was the last purchase of other non-food items such as books, CDs, jewellery or china and glass items? Ikea, Ashton, Manchester 0.3% 3 0.0% 0 0.0% 0 0.0% 0 1.0% 1 0.0% 0 1.0% 1 0.0% 0 0.0% 0 0.0% 0 1.0% 1Ashton-under-Lyne town
by Zone Oldham Household Survey Page 74 for Peter Brett Associates December 2019
Total Zone 1 - Shaw Zone 2 - Royton
Zone 3 - Chadderton
Zone 4 - Failsworth
Zone 5 - Lees Zone 6 - Uppermill
Zone 7 - Oldham East
Zone 8 - Oldham West
Zone 9 - Rochdale
South
Zone 10 - Mossley
151019 NEMS market research
Q31 And the time before that, where did you or your household make a purchase of other non-food items such as books, CDs, jewellery or china and glass items? Not Don't know and not Don't do at Q30 Costco, The Broadway,
by Zone Oldham Household Survey Page 76 for Peter Brett Associates December 2019
Total Zone 1 - Shaw Zone 2 - Royton
Zone 3 - Chadderton
Zone 4 - Failsworth
Zone 5 - Lees Zone 6 - Uppermill
Zone 7 - Oldham East
Zone 8 - Oldham West
Zone 9 - Rochdale
South
Zone 10 - Mossley
151019 NEMS market research
Q32 When undertaking shopping via the internet, how do you NORMALLY receive the items you have purchased? Delivery to home 61.7% 623 54.0% 54 69.4% 75 57.0% 57 54.0% 54 57.0% 57 73.3% 74 63.0% 63 60.0% 60 65.0% 65 63.4% 64Delivery to another address
e.g neighbour / work (but not a store or collection point)
by Zone Oldham Household Survey Page 84 for Peter Brett Associates December 2019
Total Zone 1 - Shaw Zone 2 - Royton
Zone 3 - Chadderton
Zone 4 - Failsworth
Zone 5 - Lees Zone 6 - Uppermill
Zone 7 - Oldham East
Zone 8 - Oldham West
Zone 9 - Rochdale
South
Zone 10 - Mossley
151019 NEMS market research
Base: 400 32 52 39 38 53 52 37 19 37 41
by Zone Oldham Household Survey Page 85 for Peter Brett Associates December 2019
Total Zone 1 - Shaw Zone 2 - Royton
Zone 3 - Chadderton
Zone 4 - Failsworth
Zone 5 - Lees Zone 6 - Uppermill
Zone 7 - Oldham East
Zone 8 - Oldham West
Zone 9 - Rochdale
South
Zone 10 - Mossley
151019 NEMS market research
Q38 Where did you or a member of your family last visit a pub / bar? Pub / bar at Q35 Alkrington village centre 0.2% 1 0.0% 0 0.0% 0 0.0% 0 0.0% 0 0.0% 0 0.0% 0 0.0% 0 0.0% 0 2.0% 1 0.0% 0Ashton-under-Lyne town
by Zone Oldham Household Survey Page 87 for Peter Brett Associates December 2019
Total Zone 1 - Shaw Zone 2 - Royton
Zone 3 - Chadderton
Zone 4 - Failsworth
Zone 5 - Lees Zone 6 - Uppermill
Zone 7 - Oldham East
Zone 8 - Oldham West
Zone 9 - Rochdale
South
Zone 10 - Mossley
151019 NEMS market research
Q39 Where did you or a member of your family last visit a restaurant / café? Restaurant / café at Q35 Alkrington village centre 0.1% 1 0.0% 0 0.0% 0 0.0% 0 0.0% 0 0.0% 0 0.0% 0 0.0% 0 0.0% 0 1.3% 1 0.0% 0Ashton-under-Lyne town
Base: 263 25 32 24 26 23 31 26 31 24 21 Q43 Where did you or a member of your family last go for ten-pin bowling? Ten-pin bowling at Q35 Ashton-under-Lyne town
by Zone Oldham Household Survey Page 108 Weighted: for Peter Brett Associates December 2019
Total Zone 1 - Shaw Zone 2 - Royton
Zone 3 - Chadderton
Zone 4 - Failsworth
Zone 5 - Lees Zone 6 - Uppermill
Zone 7 - Oldham East
Zone 8 - Oldham West
Zone 9 - Rochdale
South
Zone 10 - Mossley
151019 NEMS market research
Q07 Where did your household last undertake your ‘top-up’ food and grocery purchases? (i.e smaller/ 'basket' shopping purchases which are not part of your main food and groceries shop) Aldi, East Way, Middleton,
by Zone Oldham Household Survey Page 118 Weighted: for Peter Brett Associates December 2019
Total Zone 1 - Shaw Zone 2 - Royton
Zone 3 - Chadderton
Zone 4 - Failsworth
Zone 5 - Lees Zone 6 - Uppermill
Zone 7 - Oldham East
Zone 8 - Oldham West
Zone 9 - Rochdale
South
Zone 10 - Mossley
151019 NEMS market research
Q09A When your household undertakes its top-up food and grocery spend (STORE MENTIONED AT Q07) does it visit other shops, leisure or service outlets on the same shopping trips? And if so which ones? [MR]
Not Don't know / Don't do / Internet at Q07 Yes - financial service (i.e.
Weighted base: 1010 86 96 119 95 71 47 72 117 149 158Sample: 1010 100 108 100 100 100 101 100 100 100 101 Mean score [Times a year]: Everyday = 365, 5 - 6 times a week = 286, 3 - 4 times a week = 182, Twice a week = 104, Once a week = 52, Once every two weeks = 26, Once a month = 12, Once every two
months = 6, 3 or 4 times a year = 3.5, Twice a year = 2, Once a year = 1, Less often = 0.5 Q15 How often do you visit (LOCATION MENTIONED AT Q14) for clothes or shoes shopping? Not Don't know and not Don't do at Q14 Everyday 0.3% 3 0.0% 0 0.0% 0 0.0% 0 0.0% 0 0.0% 0 0.0% 0 0.7% 1 1.6% 2 0.0% 0 0.7% 15 - 6 times a week 0.0% 0 0.0% 0 0.0% 0 0.0% 0 0.0% 0 0.0% 0 0.0% 0 0.0% 0 0.0% 0 0.0% 0 0.0% 03 - 4 times a week 0.6% 6 0.0% 0 0.0% 0 0.7% 1 0.0% 0 0.0% 0 1.2% 1 0.5% 0 2.7% 3 0.0% 0 0.9% 1Twice a week 1.1% 11 1.5% 1 2.0% 2 0.5% 1 0.6% 1 2.8% 2 0.0% 0 1.0% 1 0.4% 0 0.0% 0 2.5% 4Once a week 5.9% 56 1.6% 1 3.2% 3 10.6% 12 6.9% 6 6.7% 4 0.7% 0 3.3% 2 1.4% 2 11.7% 15 6.5% 10Once every two weeks 9.3% 88 5.8% 5 15.0% 14 9.7% 11 13.2% 12 10.6% 7 5.2% 2 11.1% 8 9.0% 10 9.1% 12 5.2% 8Once a month 21.6% 206 24.3% 20 31.3% 29 27.7% 31 18.3% 17 29.8% 20 26.3% 11 23.4% 16 17.6% 20 20.2% 27 10.3% 15Once every two months 16.8% 160 28.4% 23 10.2% 9 17.2% 19 17.0% 16 10.0% 7 16.1% 7 16.7% 12 19.6% 22 16.3% 22 15.9% 243 or 4 times a year 12.1% 115 9.8% 8 12.4% 11 5.7% 6 13.8% 13 8.0% 5 12.5% 5 12.5% 9 10.1% 11 13.2% 17 19.1% 29Twice a year 9.1% 87 4.5% 4 6.7% 6 8.3% 9 11.5% 11 7.5% 5 14.3% 6 7.4% 5 9.0% 10 10.7% 14 10.8% 16Once a year 2.7% 26 4.4% 4 1.2% 1 0.0% 0 1.3% 1 6.2% 4 1.3% 1 3.3% 2 4.2% 5 3.0% 4 2.9% 4Less often 2.8% 26 0.0% 0 0.6% 1 6.1% 7 3.3% 3 0.6% 0 6.2% 3 7.8% 5 2.7% 3 1.8% 2 1.3% 2(Don't know / varies) 17.5% 166 19.6% 16 17.4% 16 13.5% 15 14.0% 13 17.8% 12 16.2% 7 12.4% 9 21.8% 25 14.0% 18 23.8% 36Mean: 16.21 11.15 15.24 16.88 13.43 16.83 10.56 15.60 23.20 14.59 19.08Weighted base: 952 81 91 112 92 67 43 70 113 132 150Sample: 951 92 102 95 96 95 91 98 97 88 97
by Zone Oldham Household Survey Page 125 Weighted: for Peter Brett Associates December 2019
by Zone Oldham Household Survey Page 126 Weighted: for Peter Brett Associates December 2019
Total Zone 1 - Shaw Zone 2 - Royton
Zone 3 - Chadderton
Zone 4 - Failsworth
Zone 5 - Lees Zone 6 - Uppermill
Zone 7 - Oldham East
Zone 8 - Oldham West
Zone 9 - Rochdale
South
Zone 10 - Mossley
151019 NEMS market research
Q17 And the time before that, where did your household make a purchase of clothes or shoes? Not Don't know and not Don't do at Q14 Costco, The Broadway,
by Zone Oldham Household Survey Page 131 Weighted: for Peter Brett Associates December 2019
Total Zone 1 - Shaw Zone 2 - Royton
Zone 3 - Chadderton
Zone 4 - Failsworth
Zone 5 - Lees Zone 6 - Uppermill
Zone 7 - Oldham East
Zone 8 - Oldham West
Zone 9 - Rochdale
South
Zone 10 - Mossley
151019 NEMS market research
by Zone Oldham Household Survey Page 132 Weighted: for Peter Brett Associates December 2019
Total Zone 1 - Shaw Zone 2 - Royton
Zone 3 - Chadderton
Zone 4 - Failsworth
Zone 5 - Lees Zone 6 - Uppermill
Zone 7 - Oldham East
Zone 8 - Oldham West
Zone 9 - Rochdale
South
Zone 10 - Mossley
151019 NEMS market research
Q19 And the time before that, where did your household make a purchase of furniture, carpets, or soft household furnishings? Not Don't know and not Don't do at Q18 B&Q, Westhulme Way,
by Zone Oldham Household Survey Page 137 Weighted: for Peter Brett Associates December 2019
Total Zone 1 - Shaw Zone 2 - Royton
Zone 3 - Chadderton
Zone 4 - Failsworth
Zone 5 - Lees Zone 6 - Uppermill
Zone 7 - Oldham East
Zone 8 - Oldham West
Zone 9 - Rochdale
South
Zone 10 - Mossley
151019 NEMS market research
Q21 And the time before that, where did your household make a purchase of DIY and decorating goods? Not Don't know and not Don't do at Q20 B&Q, Bridge Hall Lane,
by Zone Oldham Household Survey Page 139 Weighted: for Peter Brett Associates December 2019
Total Zone 1 - Shaw Zone 2 - Royton
Zone 3 - Chadderton
Zone 4 - Failsworth
Zone 5 - Lees Zone 6 - Uppermill
Zone 7 - Oldham East
Zone 8 - Oldham West
Zone 9 - Rochdale
South
Zone 10 - Mossley
151019 NEMS market research
Q22 Can you tell me where you or your household last made a purchase of electrical items such as TVs, DVD players, digital cameras, MP3 players, mobile phones or computers? B&Q, Westhulme Way,
by Zone Oldham Household Survey Page 142 Weighted: for Peter Brett Associates December 2019
Total Zone 1 - Shaw Zone 2 - Royton
Zone 3 - Chadderton
Zone 4 - Failsworth
Zone 5 - Lees Zone 6 - Uppermill
Zone 7 - Oldham East
Zone 8 - Oldham West
Zone 9 - Rochdale
South
Zone 10 - Mossley
151019 NEMS market research
Q23 And the time before that, where did you or your household make a purchase of electrical items such as TVs, DVD players, digital cameras, MP3 players, mobile phones or computers? Not Don't know and not Don't do at Q22 B&Q, Westhulme Way,
by Zone Oldham Household Survey Page 145 Weighted: for Peter Brett Associates December 2019
Total Zone 1 - Shaw Zone 2 - Royton
Zone 3 - Chadderton
Zone 4 - Failsworth
Zone 5 - Lees Zone 6 - Uppermill
Zone 7 - Oldham East
Zone 8 - Oldham West
Zone 9 - Rochdale
South
Zone 10 - Mossley
151019 NEMS market research
Q24 Can you tell me where you or your household last made a purchase of domestic appliances, such as washing machines, fridges or cookers? B&Q, Sandbrook Park, off
by Zone Oldham Household Survey Page 148 Weighted: for Peter Brett Associates December 2019
Total Zone 1 - Shaw Zone 2 - Royton
Zone 3 - Chadderton
Zone 4 - Failsworth
Zone 5 - Lees Zone 6 - Uppermill
Zone 7 - Oldham East
Zone 8 - Oldham West
Zone 9 - Rochdale
South
Zone 10 - Mossley
151019 NEMS market research
Q25 And the time before that, where did you or your household make a purchase of domestic appliances, such as washing machines, fridges or cookers? Not Don't know and not Don't do at Q24 B&Q, Snipe Retail Park,
by Zone Oldham Household Survey Page 154 Weighted: for Peter Brett Associates December 2019
Total Zone 1 - Shaw Zone 2 - Royton
Zone 3 - Chadderton
Zone 4 - Failsworth
Zone 5 - Lees Zone 6 - Uppermill
Zone 7 - Oldham East
Zone 8 - Oldham West
Zone 9 - Rochdale
South
Zone 10 - Mossley
151019 NEMS market research
Q27 And the time before that, where did you or your household make a purchase of health, beauty or chemist items? Not Don't know and not Don't do at Q26 B&Q, Westhulme Way,
by Zone Oldham Household Survey Page 157 Weighted: for Peter Brett Associates December 2019
Total Zone 1 - Shaw Zone 2 - Royton
Zone 3 - Chadderton
Zone 4 - Failsworth
Zone 5 - Lees Zone 6 - Uppermill
Zone 7 - Oldham East
Zone 8 - Oldham West
Zone 9 - Rochdale
South
Zone 10 - Mossley
151019 NEMS market research
Q28 Can you tell me where you or your household last made a purchase of recreational goods such as sports equipment, bicycles, musical instruments or toys? Ashton-under-Lyne town
by Zone Oldham Household Survey Page 159 Weighted: for Peter Brett Associates December 2019
Total Zone 1 - Shaw Zone 2 - Royton
Zone 3 - Chadderton
Zone 4 - Failsworth
Zone 5 - Lees Zone 6 - Uppermill
Zone 7 - Oldham East
Zone 8 - Oldham West
Zone 9 - Rochdale
South
Zone 10 - Mossley
151019 NEMS market research
Q29 And the time before that, where did you or your household make a purchase of recreational goods such as sports equipment, bicycles, musical instruments or toys? Not Don't know and not Don't do at Q28 B&Q, Westhulme Way,
by Zone Oldham Household Survey Page 161 Weighted: for Peter Brett Associates December 2019
Total Zone 1 - Shaw Zone 2 - Royton
Zone 3 - Chadderton
Zone 4 - Failsworth
Zone 5 - Lees Zone 6 - Uppermill
Zone 7 - Oldham East
Zone 8 - Oldham West
Zone 9 - Rochdale
South
Zone 10 - Mossley
151019 NEMS market research
Q30 And where was the last purchase of other non-food items such as books, CDs, jewellery or china and glass items? Ikea, Ashton, Manchester 0.4% 4 0.0% 0 0.0% 0 0.0% 0 2.5% 2 0.0% 0 0.6% 0 0.0% 0 0.0% 0 0.0% 0 0.9% 1Ashton-under-Lyne town
by Zone Oldham Household Survey Page 163 Weighted: for Peter Brett Associates December 2019
Total Zone 1 - Shaw Zone 2 - Royton
Zone 3 - Chadderton
Zone 4 - Failsworth
Zone 5 - Lees Zone 6 - Uppermill
Zone 7 - Oldham East
Zone 8 - Oldham West
Zone 9 - Rochdale
South
Zone 10 - Mossley
151019 NEMS market research
Q31 And the time before that, where did you or your household make a purchase of other non-food items such as books, CDs, jewellery or china and glass items? Not Don't know and not Don't do at Q30 Costco, The Broadway,
by Zone Oldham Household Survey Page 165 Weighted: for Peter Brett Associates December 2019
Total Zone 1 - Shaw Zone 2 - Royton
Zone 3 - Chadderton
Zone 4 - Failsworth
Zone 5 - Lees Zone 6 - Uppermill
Zone 7 - Oldham East
Zone 8 - Oldham West
Zone 9 - Rochdale
South
Zone 10 - Mossley
151019 NEMS market research
Q32 When undertaking shopping via the internet, how do you NORMALLY receive the items you have purchased? Delivery to home 65.5% 662 56.2% 49 72.0% 69 59.7% 71 61.2% 58 61.5% 43 73.4% 35 69.2% 50 68.6% 80 67.7% 101 66.9% 106Delivery to another address
e.g neighbour / work (but not a store or collection point)
by Zone Oldham Household Survey Page 174 Weighted: for Peter Brett Associates December 2019
Total Zone 1 - Shaw Zone 2 - Royton
Zone 3 - Chadderton
Zone 4 - Failsworth
Zone 5 - Lees Zone 6 - Uppermill
Zone 7 - Oldham East
Zone 8 - Oldham West
Zone 9 - Rochdale
South
Zone 10 - Mossley
151019 NEMS market research
Q38 Where did you or a member of your family last visit a pub / bar? Pub / bar at Q35 Alkrington village centre 0.8% 4 0.0% 0 0.0% 0 0.0% 0 0.0% 0 0.0% 0 0.0% 0 0.0% 0 0.0% 0 4.8% 4 0.0% 0Ashton-under-Lyne town
by Zone Oldham Household Survey Page 176 Weighted: for Peter Brett Associates December 2019
Total Zone 1 - Shaw Zone 2 - Royton
Zone 3 - Chadderton
Zone 4 - Failsworth
Zone 5 - Lees Zone 6 - Uppermill
Zone 7 - Oldham East
Zone 8 - Oldham West
Zone 9 - Rochdale
South
Zone 10 - Mossley
151019 NEMS market research
Q39 Where did you or a member of your family last visit a restaurant / café? Restaurant / café at Q35 Alkrington village centre 0.5% 4 0.0% 0 0.0% 0 0.0% 0 0.0% 0 0.0% 0 0.0% 0 0.0% 0 0.0% 0 3.3% 4 0.0% 0Ashton-under-Lyne town
Weighted base: 285 22 29 24 30 18 17 24 44 40 38Sample: 263 25 32 24 26 23 31 26 31 24 21 Q43 Where did you or a member of your family last go for ten-pin bowling? Ten-pin bowling at Q35 Ashton-under-Lyne town
Q07 Where did your household last undertake your ‘top-up’ food and grocery purchases? (i.e
smaller/ 'basket' shopping purchases which are not part of your main food and groceries shop)
Go Local Extra, Wilshaw Lane, Ashton-under-Lyne, OL7 9QX 2 M&S, Lord Sheldon Way, Ashton-under-Lyne, OL6 7UB 2 Aldi, Scot Lane, Wigan, WN5 0TQ 1 Asda, Manchester Road, Bolton, BL3 2QS 1 Home Bargains, Old Street, Ashton-under-Lyne, OL6 7JL 1 Londis, Hollinwood Avenue, Manchester, M40 0JQ 1 Spar, Millbrook Way, Penwortham, Preston, PR1 0XW 1 Tesco, Thomas Street, off Bury Old Road, Manchester. M8 5DP 1 Total 10
196
Q08 And where did you go for top-up food shopping the time before that?
Asda, Pilsworth Road, Bury, BL9 8RS 2 Aldi, Scot Lane, Wigan, WN5 0TQ 1 Asda, Harpurhey Shopping Centre, Manchester, M9 4DJ 1 Asda, Manchester Road, Bolton, BL3 2QS 1 Go Local Extra, Wilshaw Lane, Ashton-under-Lyne, OL7 9QX 1 Home Bargains, Old Street, Ashton-under-Lyne, OL6 7JL 1 Home Bargains, Whitworth Road, Rochdale, OL12 0EU 1 Lidl, Wilmslow Road, Manchester, M13 9PD 1 Londis, Hollinwood Avenue, Manchester, M40 0JQ 1 M&S Simply Food, Manchester Fort, Manchester M8 8EP 1 M&S, Briggate, Leeds, LS1 6HF 1 M&S, Coppice Way, Handforth, Wilmslow, SK9 3PB 1 M&S, Lord Sheldon Way, Ashton-under-Lyne, OL6 7UB 1 Morrisons, Black Horse Street, Bolton, BL1 1PQ 1 Spar, Millbrook Way, Penwortham, Preston, PR1 0XW 1 Tesco, Thomas Street, off Bury Old Road, Manchester. M8 5DP 1 Total 17
Q11 Where are these small shops or market stalls located?
Hollinwood Local Centre, OL8 3PH 3 Crowhill Road, Ashton-under-Lyne, OL7 9HD 2 Glodwick Local Centre, OL4 1AB 2 Carrbrook Local Centre, SK15 3LE 1 Hunslet Local Centre, LS10 2AU 1 Littleborough Town Centre, OL15 9DQ 1 Marsden Village Centre, HD7 6EZ 1 Micklehurst Village Centre, OL5 9EL 1 Skipton Town Centre, BD23 1AH 1 Todmorden Town Centre, OL14 7BX 1 Westwood Local Centre, OL9 6BG 1 Total 15
197
Q14 So, speaking as an individual, can you tell me where you last made a purchase of clothes or shoes?
Boundary Mill, Vivary Way, Colne, BB8 9NW 6 York City Centre, YO24 1AA 2 Affinity Outlet, Anchorage Road, Fleetwood, FY7 6AE 1 Aldi, Wellington Road, Ashton-under-Lyne, OL6 7Fn 1 Central London 1 Handforth Town Centre, SK9 3BA 1 Harrogate Town Centre, HG1 2QU 1 Heaton Park Local Centre, M9 0QS 1 Hebden Bridge Town Centre, HX7 7DD 1 Kendal Town Centre, LA9 4RF 1 Littleborough Town Centre, OL15 9DQ 1 Liverpool City Centre, L1 4NW 1 Northerallerton Town Centre, DL6 1NP 1 Parkgate Shopping Park, Stadium Way, Rotherham, S60 1TG 1 Plymouth City Centre, PL1 1EA 1 Total 21
Q17 And the time before that, where did your household make a purchase of clothes or shoes?
Boundary Mill, Vivary Way, Colne, BB8 9NW 4 Chester City Centre, CH1 2HJ 2 Handforth Town Centre, SK9 3BA 2 Blackpool Town Centre, FY1 4BJ 1 Cleveleys Town Centre, FY5 1EE 1 Crawley Town Centre, RH10 1JA 1 Harrogate Town Centre, HG1 2QU 1 Hebden Bridge Town Centre, HX7 7DD 1 Holmfirth Town Centre, HD9 3AY 1 Kendal Town Centre, LA9 4RF 1 Rawtenstall Town Centre, BB4 6RX 1 Ross-on-Wye Town Centre, HR9 5BY 1 Skipton Town Centre, BD23 1DN 1 Telford Town Centre, TF3 4BX 1 White Rose Shopping Centre, Dewsbury Road, Leeds, LS11 8LU 1 Total 20
198
Q18 Now can you tell me where your household last made a purchase of furniture, carpets, or soft household furnishings?
Hollingwood Village Centre, S43 2JG 4 Hathershaw Local Centre, OL8 3ED 2 Salford City Centre, M6 5JA 2 The Peel Centre, Stockport, SK1 2HD 2 Bredbury Town Centre, SK6 2AH 1 Central London 1 Chorley Town Centre, PR7 1LB 1 DFS, The Peel Centre, St. Marys Way, Stockport, SK1 2HD 1 Marsden Village Centre, HD7 6EZ 1 Meadow Industrial Estate, Water Street, Stockport, SK1 2BU 1 Messingham Village Centre, DN17 3QT 1 Mytholmroyd Village Centre, HX7 5LH 1 Swinton Town Centre, M27 9LB 1 Total 19
Q19 And the time before that, where did your household make a purchase of furniture, carpets,
or soft household furnishings?
Hollingwood Village Centre, S43 2JG 4 Accrington Town Centre, BB5 1QQ 1 Boundary Mill, Vivary Way, Colne, BB8 9NW 1 Bredbury Town Centre, SK6 2AH 1 Carpetright, St Mary's Gate, Rochdale, OL12 0TY 1 DFS, The Peel Centre, St. Marys Way, Stockport, SK1 2HD 1 Hathershaw Local Centre, OL8 3ED 1 Heyside Local Centre, OL2 8SZ 1 Homesense, Broughton Shopping Park, Chester, CH4 0DE 1 Littleborough Town Centre, OL15 9DQ 1 Messingham Village Centre, DN17 3QT 1 Middlebrook Retail & Leisure Park, Horwich, Bolton, BL6 6JA 1 Swinton Town Centre, M27 9LB 1 White City Retail Park, Chester Road, Stretford, M16 0RP 1 Total 17
199
Q20 Now can you tell me where your household last made a purchase of DIY and decorating goods?
Hollingwood Village Centre, S43 2JG 4 Middleton Trade Park, Oldham Road, Middleton, M24 1QZ 2 Ashton Commerce Park, Ashton-under-Lyne, OL7 0QN 1 B&Q, Manchester Fort Shopping Park, Manchester, M8 8EP 1 Bolton Town Centre, BL1 1TN 1 Homebase, Sandbrook Park, Rochdale, OL11 1RY 1 Magnum Trade Park, Fishwick Street, Rochdale, OL16 5NP 1 Screwfix, The Hollands Centre, Haverhill, CB9 8PR 1 Sutton Town Centre, SM1 1DD 1 Toolstation, Magnum Centre, Rochdale, OL16 5NP 1 Wilmslow Town Centre, SK9 1AY 1 Total 15
Q21 And the time before that, where did your household make a purchase of DIY and
decorating goods?
Hollingwood Village Centre, S43 2JG 3 B&Q, Manchester Fort Shopping Park, Manchester, M8 8EP 2 B&Q, George's Road, Stockport, SK4 1DR 1 Glossop Town Centre, SK13 8PN 1 Homebase, Sandbrook Park, Rochdale, OL11 1RY 1 Magnum Trade Park, Fishwick Street, Rochdale, OL16 5NP 1 Middleton Trade Park, Oldham Road, Middleton, M24 1QZ 1 Sutton Town Centre, SM1 1DD 1 Toolstation, Magnum Centre, Rochdale, OL16 5NP 1 Wilmslow Town Centre, SK9 1AY 1 Total 13
Q22 Can you tell me where you or your household last made a purchase of electrical items such
as TVs, DVD players, digital cameras, MP3 players, mobile phones or computers?
Hollingwood Village Centre, S43 2JG 2 Altrincham Town Centre, WA14 1EN 1 Currys PC World, The Old Cricket Ground, Rochdale, OL12 6XT 1 Dewsbury Town Centre, WF13 1JS 1 Habitat in Sainsbury's, Wilmslow Road, Cheadle, SK8 3BB 1 Handforth Town Centre, SK9 3BA 1 Ipswich Town Centre, IP1 3DR 1 Llandudno Town Centre, LL30 2PD 1 Stanley Green Retail Park, Cheadle Hulme, Cheadle, SK8 6RB 1 Warrington Town Centre, WA1 1QB 1 Total 11
200
Q23 And the time before that, where did you or your household make a purchase of electrical items such as TVs, DVD players, digital cameras, MP3 players, mobile phones or computers?
Currys PC World, The Old Cricket Ground, Rochdale, OL12 6XT 2 Dewsbury Town Centre, WF13 1JS 1 Habitat in Sainsbury's, Wilmslow Road, Cheadle, SK8 3BB 1 Ipswich Town Centre, IP1 3DR 1 Rawtenstall Town Centre, BB4 6RX 1 Stanley Green Retail Park, Cheadle Hulme, Cheadle, SK8 6RB 1 Warrington Town Centre, WA1 1QB 1 Total 8
Q24 Can you tell me where you or your household last made a purchase of domestic appliances,
such as washing machines, fridges or cookers?
Cheetham Hill Local Centre, M8 8EP 1 Currys PC World, The Old Cricket Ground, Rochdale, OL12 6XT 1 Glossop Town Centre, SK13 8PN 1 Moston District Centre, M40 9JS 1 Wilmslow Town Centre, SK9 1AY 1 Total 5
Q25 And the time before that, where did you or your household make a purchase of domestic
appliances, such as washing machines, fridges or cookers?
Cheetham Hill Local Centre, M8 8EP 1 Co-op, High Street, Royston, S71 4RF 1 Co-op, Owl Mill Street, Lees, Oldham, OL4 3BP 1 Currys PC World, The Old Cricket Ground, Rochdale, OL12 6XT 1 Moston Lane Appliances, Moston Lane, Manchester, M40 9JS 1 Wilmslow Town Centre, SK9 1AY 1 Total 6
Q26 Can you tell me where you or your household last made a purchase of health, beauty or
chemist items?
Aldi, Elizabethan Way, Milnrow, Rochdale, OL16 4GJ 1 Cleveleys Town Centre, FY5 1EE 1 Hathershaw Local Centre, OL8 3ED 1 Hollingwood Village Centre, S43 2JG 1 Morrisons, Foundry Street, Dukinfield, SK16 4DL 1 Sainsbury's, Golden Way, Urmston, Manchester, M41 0NA 1 Todmorden Town Centre, OL14 7AA 1 Total 7
201
Q27 And the time before that, where did you or your household make a purchase of health, beauty or chemist items?
Bradford City Centre, BD2 1NH 2 Aldi, Elizabethan Way, Milnrow, Rochdale, OL16 4GJ 1 Cleveleys Town Centre, FY5 1EE 1 Ferrybridge Village Centre, WF11 8NQ 1 Hathershaw Local Centre, OL8 3ED 1 Hebden Bridge Town Centre, HX7 7DD 1 Hollingwood Village Centre, S43 2JG 1 Holmfirth Town Centre, HD9 3AY 1 Morrisons, Foundry Street, Dukinfield, SK16 4DL 1 Total 10
Q28 Can you tell me where you or your household last made a purchase of recreational goods
such as sports equipment, bicycles, musical instruments or toys?
Decathlon in Asda, Ashton New Road, Manchester M11 4BD 2 Wenerth Golf Club, Green Lane, Oldham, OL8 3AZ 2 Aberystwyth Town Centre, SY23 1DE 1 Bents Garden & Home, Warrington Road, Glazebury, WA3 5NT 1 Bolton Town Centre, BL1 1TN 1 Bradford City Centre, BD2 1NH 1 Eccles Town Centre, M30 0DD 1 Etihad Stadium, Ashton New Road, Manchester, M11 3FF 1 Glasgow City Centre, G1 1YU 1 Leisure Lakes Bikes, Rochdale Road, Bury, BL9 7AY 1 Southampton City Centre, SO15 1GE 1 Telford Town Centre, TF3 4BX 1 Wandahome, Brough Road, South Cave, Brough, HU15 2DB 1 Total 15
Q29 And the time before that, where did you or your household make a purchase of recreational
goods such as sports equipment, bicycles, musical instruments or toys?
Wenerth Golf Club, Green Lane, Oldham, OL8 3AZ 2 Aberystwyth Town Centre, SY23 1DE 1 Ambleside Town Centre, LA22 0AE 1 Betws-y-coed Village Centre, LL24 0AE 1 Glasgow City Centre, G1 1YU 1 Todmorden Town Centre, OL14 7AA 1 Total 7
202
Q30 And where was the last purchase of other non-food items such as books, CDs, jewellery or china and glass items?
Manchester Airport, Manchester, M90 1QX 2 Corbridge Village Centre, NE45 5AA 1 Glasshoughton Local Centre, WF10 4TS 1 Meltham Town Centre, HD9 5NN 1 Southport Town Centre, PR8 1RB 1 York City Centre, YO24 1AA 1 Total 7
Q31 And the time before that, where did you or your household make a purchase of other non-
food items such as books, CDs, jewellery or china and glass items?
Manchester Airport, Manchester, M90 1QX 3 Bradford City Centre, BD2 1NH 1 Central London 1 Glasshoughton Local Centre, WF10 4TS 1 Marsden Village Centre, HD7 6EZ 1 Meltham Town Centre, HD9 5NN 1 Morrisons, Cheapside, Hyde, SK14 2NN 1 Total 9
Q33 What is your nearest town centre?
Bradford City Centre, BD1 3SR 1 Brighton Town Centre, BN1 1EN 1 Carrbrook Local Centre, SK15 3LE 1 Dobcross Village Centre, OL3 5AA 1 Grasscroft Village Centre, OL4 4EA 1 Total 5
Q36 Where did you or a member of your family last visit the cinema?
Audenshaw Town Centre, M34 5NL 1 Barnstaple Town Centre, EX32 8RL 1 Blackpool Town Centre, FY1 4BJ 1 Gorton Local Centre, M12 5PS 1 Newcastle upon Tyne City Centre, NE1 7PF 1 Odeon, John Smith's Stadium, Huddersfield, HD1 6PQ 1 Stockport Town Centre, SK1 1QW 1 Total 7
203
Q37 Where did you or a member of your family last visit the theatre?
Blackpool Town Centre, FY1 4BJ 2 Abroad 1 Alhambra Theatre, Morley Street, Bradford, BD7 1AJ 1 Bolton Town Centre, BL1 2AL 1 Buxton Town Centre, SK17 6AY 1 Chesterfield Town Centre, S40 1PY 1 Colchester Town Centre, CO3 3LL 1 Guide Bridge Local Centre, OL7 0NS 1 Oxford City Centre, OX1 1AY 1 Southport Town Centre, PR8 1LR 1 Stratford-upon-Avon Town Centre, CV37 6LW 1 The Curtain Theatre, Milkstone Road, Rochdale, OL11 1EB 1 Torquay Town Centre, TQ1 2AA 1 Total 14
Q38 Where did you or a member of your family last visit a pub / bar?
Mossley Road, Ashton-under-Lyne, OL6 6NQ 2 Slaithwaite Village Centre, HD7 5JX 2 Bakewell Town Centre, DE45 1DA 1 Castleton Village Centre, S33 8WG 1 Chester City Centre, CH1 2HJ 1 Elephant & Castle, Hollowgate, Holmfirth, HD9 2DG 1 Glossop Town Centre, SK13 8PN 1 Holmfirth Town Centre, HD9 3AY 1 Lytham St Annes, Local Centre, FY8 3NE 1 Mexborough Town Centre, S64 0JP 1 Newark Town Centre, NG24 4BZ 1 Tewkesbury Town Centre, GL20 5RS 1 Urmston Town Centre, M41 5DN 1 Walkden Town Centre, M28 3JE 1 Total 16
204
Q39 Where did you or a member of your family last visit a restaurant / café?
Audenshaw Town Centre, M34 5NL 3 Castleton Village Centre, S33 8WG 2 Mossley Road, Ashton-under-Lyne, OL6 6NQ 2 Southport Town Centre, PR8 1LR 2 Abroad 1 Brighton Town Centre, BN1 1UE 1 Carlisle City Centre, CA1 1DJ 1 Cheadle Village Centre, SK8 1LY 1 Glossop Town Centre, SK13 8PN 1 Gloucester City Centre, GL1 1XR 1 Gordon Rigg, Moss Bridge Road, Rochdale, OL16 4UX 1 Halesowen Town Centre, B63 4AB 1 Ipswich Town Centre, IP1 3DR 1 Lidgate Village Centre, CB8 9PW 1 Lytham St Annes, Local Centre, FY8 3NE 1 Marks & Spencer, Ashton-under-Lyne, OL6 7UB 1 Meltham Town Centre, HD9 5NN 1 Northenden Local Centre, M22 4JT 1 Oldham Road, Ashton-under-Lyne, OL7 9LL 1 Ramsbotton Town Centre, BL0 9HU 1 Slaithwaite Village Centre, HD7 5JX 1 Southampton City Centre, SO15 1DE 1 Sowerby Bridge Town Centre, HX6 3BN 1 Tesco Superstore, Silk Street, Rochdale, OL11 3ER 1 Urmston Town Centre, M41 5DN 1 Total 30
Q40 Where did you or a member of your family last visit a nightclub?
Birmingham City Centre, B4 7LN 1 Total 1
Q41 Where did you or a member of your family last go to play bingo?
Blackpool Town Centre, FY1 4BJ 1 Buzz Bingo, Kirkmanshulme Lane, Manchester, M18 7BA 1 Chester City Centre, CH1 2HJ 1 Mecca Bingo, Smith Street, Rochdale, OL16 1YH 1 Total 4
205
Q42 Where did you or a member of your family last go to a healthclub?
Active Copley, Huddersfield Road, Stalybridge, SK15 3ET 2 Old Trafford Stadium, Stretford, Manchester M16 0RA 2 Etihad Stadium, Ashton New Road, Manchester, M11 3FF 1 Shaw Hill Leisure Centre, Shall Hill, Whittle-le-Woods, PR6 7PP 1 Stockport Town Centre, SK1 1QW 1 Stratford Sports Club, Stratford-upon-Avon, CV37 7LS 1 Tonge Social & Bowling Club, Middleton, Manchester, M24 2DQ 1 Village Gym, Pamir Drive, Ashton-under-Lyne, OL7 0LY 1 Total 10
Q43 Where did you or a member of your family last go for ten-pin bowling?
Abroad 1 Centre Parcs Woburn, Millbrook Road, Bedford, MK45 2HZ 1 Total 2
Q44 Where did you or a member of your family last go to a museum / library?
Abroad 8 Durham City Centre, DH1 4DX 2 Alnwick Town Centre, NE66 1SX 1 Birmingham City Centre, B4 7LN 1 Dorchester Town Centre, DT1 1RQ 1 Edinburgh City Centre 1 Hull City Centre, HU7 0BE 1 Kirkwall Town Centre, KW15 1LB 1 Lancaster Town Centre, LA1 1RE 1 National Museum, Edinburgh Castle, Edinburgh, EH1 2NG 1 Nottingham City Centre, NG1 5RH 1 Saltaire Village Centre, BD18 3LA 1 Science and Media Museum, Pictureville, Bradford, BD1 1NQ 1 Whitby Town Centre, YO21 1QL 1 Total 22
206
Q45 Where did you or a member of your family last go to an art gallery?
Abroad 6 Arnside Village Centre, LA5 0HG 1 Colchester Town Centre, CO3 3LL 1 Edinburgh City Centre 1 Glasgow City Centre 1 Llandudno Town Centre, LL30 2PD 1 Newark Town Centre, NG24 4BZ 1 Oxford City Centre, OX1 1AY 1 Skipton Town Centre, BD23 1JX 1 Stow-on-the-Wold Town Centre, GL54 1AB 1 Torquay Town Centre, TQ1 2AA 1 Total 16
Q46 Where did you or a member of your family last go to an ice rink?
Abroad 1 Bolton Town Centre, BL1 2AL 1 Bradford Ice Arena, Little Horton Lane, Bradford, BD5 0AD 1 Planet Ice, Lower Audley Street, Blackburn, BB2 3DY 1 Total 4
Q47 Where did you or a member of your family last go to a trampoline centre?
Flip Out, Ashton New Road, Manchester, M11 4TA 5 Flip Out, Royle Pennine Trading Estate, Rochdale, OL11 3EX 1 Prestwich Town Centre, M25 1AR 1 Trafford Park, Manchester, M17 1SA 1 Total 8
Good morning / afternoon / evening, I am …… from NEMS market research and we are conducting a short survey in your area about shopping & leisure on behalf of Oldham Council. Do you have time to answer some questions? It will take about seven minutes.
QA Are you the main shopper in your household?
1 Yes2 No - Ask if main shopper is available, if not - close
PC Could you please provide your post code?RECORD POSTCODE
"First we have a few questions about where you undertake food and groceries shopping. In answering these questions the location may be a supermarket, a smaller store or independent retailer, or a town centre, or could be the use of facilities such as the Internet."
Q01 Where did your household last undertake a main food and grocery purchase? DO NOT PROMPT. ONE ANSWER ONLY.
#Food Food Shopping List
Q02 And where did you shop the time before that (was it the same, or different, and if so, please specify)?DO NOT PROMPT. ONE ANSWER ONLY.
#Food Food Shopping List
Skip Q03 if Internet / delivered at Q01:Q03 What form of transport do you use to visit (STORE / LOCATION MENTIONED AT Q01)?
DO NOT PROMPT. ONE ANSWER ONLY.
1 Car - driver2 Car - passenger3 Bus4 Cycle5 Disabled vehicle (e.g. mobility scooter)6 Taxi7 Train8 Tram9 WalkA Other (PLEASE WRITE IN)B (Don't know / varies)
Skip Q04 if Internet / delivered at Q01Q04 When your household undertakes its main food and grocery spend (STORE MENTIONED AT Q01) does it visit other
shops, leisure or service outlets on the same shopping trips? And if so which ones?DO NOT READ OUT. CAN BE MULTICODED.
1 Yes - financial service (i.e. bank, building society)2 Yes - leisure activity3 Yes - other food shops4 Yes - other non food shops (clothing, footwear, electrical etc)5 Yes - other service (e.g. hairdresser, travel agent, estate agent)6 Yes - pubs, restaurants or cafes7 Yes - other (PLEASE WRITE IN)8 (No)9 (Don't know / varies)
Q05 Approximately how much money does your household spend per week on its main food and groceries shop at (STORE MENTIONED AT Q01)?DO NOT PROMPT. ONE ANSWER ONLY.
X To the nearest £: (PLEASE WRITE IN)Y (Don't know / varies)Z (Refused)
Q06 How often does your household normally visit its main food and grocery shopping destination (STORE MENTIONED AT Q01)?DO NOT READ OUT. ONE ANSWER ONLY.
1 Everyday2 5 - 6 times a week3 3 - 4 times a week4 Twice a week5 Once a week6 Once every two weeks7 Once a month8 Less often9 (Don't know / varies)
Q07 Where did your household last undertake your ‘top-up’ food and grocery purchases? (i.e smaller/ 'basket' shopping purchases which are not part of your main food and groceries shop)DO NOT PROMPT. ONE ANSWER ONLY.
#Food Food Shopping List
040419 North Lincolnshire Questionnaire NEMS market research
Q08 And where did you go for top-up food shopping the time before that?DO NOT PROMPT. ONE ANSWER ONLY.
#Food Food Shopping List
Q09 Approximately how much money does your household spend per week on top-up food and groceries shopping (STORE MENTIONED AT Q07)?PLEASE WRITE IN TO THE NEAREST £
X To the nearest £: (PLEASE WRITE IN)Y (Don't know / varies)Z (Refused)
Skip Q09A if Internet / delivered at Q07:Q09A When your household undertakes its top-up food and grocery spend (STORE MENTIONED AT Q07) does it visit other
shops, leisure or service outlets on the same shopping trips? And if so which ones?DO NOT READ OUT. CAN BE MULTICODED.
1 Yes - financial service (i.e. bank, building society)2 Yes - leisure activity3 Yes - other food shops4 Yes - other non food shops (clothing, footwear, electrical etc)5 Yes - other service (e.g. hairdresser, travel agent, estate agent)6 Yes - pubs, restaurants or cafes7 Yes - other (PLEASE WRITE IN)8 (No)9 (Don't know / varies)
Ask Q10 if small shops / market stalls not mentioned at Q01, Q02, Q07 or Q08, others to Q13Q10 Does your household also spend money on food and groceries in small shops or market stalls? (i.e., not
supermarkets)DO NOT PROMPT. ONE ANSWER ONLY.
1 Yes GO TO Q112 No GO TO Q133 N/A
Q11 Where are these small shops or market stalls located?DO NOT PROMPT. ONE ANSWER ONLY.
#CentresCentres List
Q12 Approximately how much money does your household spend per week on food and groceries in these small shops?
DO NOT PROMPT. ONE ANSWER ONLY.
X To the nearest £: (PLEASE WRITE IN)Y (Don't know / varies)Z (Refused)
Q13 Approximately what proportion of your household's total spending on all food and grocery goods is done using the Internet?DO NOT PROMPT. ONE ANSWER ONLY.
X To the nearest % (PLEASE WRITE IN)Y (Don't know / varies)Z (Refused)
"We now have a few questions about where you go for non-food shopping. In answering these questions the location may be a town centre, a retail park, or a free standing store, or could be facilities such as the Internet, TV / interactive shopping or use of a home catalogue. "
Q14 So, speaking as an individual, can you tell me where you last made a purchase of clothes or shoes?DO NOT PROMPT. ONE ANSWER ONLY.
#NonFoodNon Food List
Q15 How often do you visit (LOCATION MENTIONED AT Q14) for clothes or shoes shopping?ONE ANSWER ONLY.
1 Everyday2 5 - 6 times a week3 3 - 4 times a week4 Twice a week5 Once a week6 Once every two weeks7 Once a month8 Once every two months9 3 or 4 times a yearA Twice a yearB Once a yearC Less oftenD (Don't know / varies)
040419 North Lincolnshire Questionnaire NEMS market research
Skip Q16 if Internet / other delivered at Q14:Q16 How do you normally travel to (LOCATION MENTIONED AT Q14)?
ONE ANSWER ONLY.
1 Car - Driver2 Car - Passenger3 Bus4 Cycle5 Disabled vehicle (e.g. mobility scooter)6 Taxi7 Train8 Tram9 WalkA Other (PLEASE WRITE IN)B (Don't know / varies)
Q17 And the time before that, where did your household make a purchase of clothes or shoes?DO NOT PROMPT. ONE ANSWER ONLY.
#NonFoodNon Food List
Q18 Now can you tell me where your household last made a purchase of furniture, carpets, or soft household furnishings?
DO NOT PROMPT. ONE ANSWER ONLY.
#NonFoodNon Food List
Q19 And the time before that, where did your household make a purchase of furniture, carpets, or soft household furnishings?DO NOT PROMPT. ONE ANSWER ONLY.
#NonFoodNon Food List
Q20 Now can you tell me where your household last made a purchase of DIY and decorating goods?DO NOT PROMPT. ONE ANSWER ONLY.
#NonFoodNon Food List
Q21 And the time before that, where did your household make a purchase of DIY and decorating goods?DO NOT PROMPT. ONE ANSWER ONLY.
#NonFoodNon Food List
Q22 Can you tell me where you or your household last made a purchase of electrical items such as TVs, DVD players, digital cameras, MP3 players, mobile phones or computers? DO NOT PROMPT. ONE ANSWER ONLY.
#NonFoodNon Food List
Q23 And the time before that, where did you or your household make a purchase of electrical items such as TVs, DVD players, digital cameras, MP3 players, mobile phones or computers?DO NOT PROMPT. ONE ANSWER ONLY.
#NonFoodNon Food List
Q24 Can you tell me where you or your household last made a purchase of domestic appliances, such as washing machines, fridges or cookers?DO NOT PROMPT. ONE ANSWER ONLY.
#NonFoodNon Food List
Q25 And the time before that, where did you or your household make a purchase of domestic appliances, such as washing machines, fridges or cookers?DO NOT PROMPT. ONE ANSWER ONLY.
#NonFoodNon Food List
Q26 Can you tell me where you or your household last made a purchase of health, beauty or chemist items?DO NOT PROMPT. ONE ANSWER ONLY.
#NonFoodNon Food List
Q27 And the time before that, where did you or your household make a purchase of health, beauty or chemist items?
DO NOT PROMPT. ONE ANSWER ONLY.
#NonFoodNon Food List
Q28 Can you tell me where you or your household last made a purchase of recreational goods such as sports equipment, bicycles, musical instruments or toys?DO NOT PROMPT. ONE ANSWER ONLY.
#NonFoodNon Food List
Q29 And the time before that, where did you or your household make a purchase of recreational goods such as sports equipment, bicycles, musical instruments or toys?DO NOT PROMPT. ONE ANSWER ONLY.
#NonFoodNon Food List
040419 North Lincolnshire Questionnaire NEMS market research
Q30 And where was the last purchase of other non-food items such as books, CDs, jewellery or china and glass items?
DO NOT PROMPT. ONE ANSWER ONLY.
#NonFoodNon Food List
Q31 And the time before that, where did you or your household make a purchase of other non-food items such as books, CDs, jewellery or china and glass items?DO NOT PROMPT. ONE ANSWER ONLY.
#NonFoodNon Food List
Q32 When undertaking shopping via the internet, how do you NORMALLY receive the items you have purchased?
PROMPT IF NECESSARY. ONE ANSWER ONLY.
1 Delivery to home2 Delivery to another address e.g neighbour / work (but not a store or collection point)3 Delivered to store (Click & collect)4 Delivered to a collection point (e.g third party newsagent or convenience store etc.)5 Other (PLEASE WRITE IN)6 Don't shop online7 (Don't know / can't remember / varies)
Q33 What is your nearest town centre?DO NOT PROMPT. ONE ANSWER ONLY.
#TownsTown Centre list GO TO Q34
Q34 What things do you think could be improved about (TOWN MENTIONED AT Q33)?DO NOT PROMPT. SELECT ALL THAT APPLY.
001 Better signposting within the centre002 Cheaper parking 003 Cheaper public transport fares004 Improved access for wheelchair and pushchair users005 More accessible car parking 006 More facilities for cyclists (cycle routes / stands etc.)007 More frequent bus services to the centre008 More frequent train services009 More parking010 More priority for pedestrians 011 More reliable / comfortable bus services 012 More reliable train services013 More secure parking014 New / relocated bus stops015 Better street furniture / floral displays016 Cleaner streets / removal of litter017 Improve appearance / environment of centre 018 Improved security measures / more CCTV / more police019 More attractive shop fronts020 More control on alcohol / drinkers / drug users021 More control on other anti-social behaviour 022 More green spaces / areas023 More shelter from wind / rain 024 Better choice of shops in general025 Better crèche facilities026 Better quality of shops027 Bigger / better supermarket028 Expand the town centre’s colleges / expand university029 Fewer bars / nightclubs 030 Improvement to the market031 More / better eating places032 More / better leisure facilities033 More / better pubs / night-life034 More family oriented facilities035 More independent shops 036 More national multiple (high street chain) retailers037 More secure children’s play areas038 Provision of more residential accommodation 039 Other (PLEASE WRITE IN)040 (Don’t know)041 (None mentioned)
"Finally, I am going to ask a few questions on destinations for leisure and cultural activities."
Q35 Does you or your household do any of the following leisure activities? READ OUT. CODE ALL THAT APPLY.
1 Cinema ASK Q362 Theatre ASK Q373 Pub / bar ASK Q384 Restaurant / cafés ASK Q395 Nightclub ASK Q406 Bingo ASK Q417 Health & fitness club ASK Q428 Ten-pin bowling ASK Q439 Museum / library ASK Q44A Art gallery ASK Q45B Ice rink ASK Q46C Trampoline centre ASK Q47D (None of these) GO TO GEN
040419 North Lincolnshire Questionnaire NEMS market research
Q36 Where did you or a member of your family last visit the cinema?DO NOT PROMPT. ONE ANSWER ONLY.
#CentresCentres List
Q37 Where did you or a member of your family last visit the theatre?DO NOT PROMPT. ONE ANSWER ONLY.
#CentresCentres List
Q38 Where did you or a member of your family last visit a pub / bar?DO NOT PROMPT. ONE ANSWER ONLY.
#CentresCentres List
Q39 Where did you or a member of your family last visit a restaurant / café?DO NOT PROMPT. ONE ANSWER ONLY.
#CentresCentres List
Q40 Where did you or a member of your family last visit a nightclub?DO NOT PROMPT. ONE ANSWER ONLY.
#CentresCentres List
Q41 Where did you or a member of your family last go to play bingo?DO NOT PROMPT. ONE ANSWER ONLY.
#CentresCentres List
Q42 Where did you or a member of your family last go to a healthclub?DO NOT PROMPT. ONE ANSWER ONLY.
#CentresCentres List
Q43 Where did you or a member of your family last go for ten-pin bowling?DO NOT PROMPT. ONE ANSWER ONLY.
#CentresCentres List
Q44 Where did you or a member of your family last go to a museum / library?DO NOT PROMPT. ONE ANSWER ONLY.
#CentresCentres List
Q45 Where did you or a member of your family last go to an art gallery?DO NOT PROMPT. ONE ANSWER ONLY.
#CentresCentres List
Q46 Where did you or a member of your family last go to an ice rink?DO NOT PROMPT. ONE ANSWER ONLY.
#CentresCentres List
Q47 Where did you or a member of your family last go to a trampoline centre?DO NOT PROMPT. ONE ANSWER ONLY.
#CentresCentres List
GEN Gender of respondent:CODE FROM OBSERVATION
1 Male2 Female
AGE Could I ask how old you are please?ONE ANSWER ONLY. DO NOT READ OUT.
1 18 to 242 25 to 343 35 to 444 45 to 545 55 to 646 65 +7 (Refused)
Thank & close.
040419 North Lincolnshire Questionnaire NEMS market research
Main Report Oldham Retail & Leisure Study
Appendix C Convenience Retail Capacity Tables
Spreadsheet 1 - Population Projections
Year Zone 1 Zone 2 Zone 3 Zone 4 Zone 5 Zone 6 Zone 7 Zone 8 Zone 9 Zone 10All Zones
1. 2016-based per capita convenience expenditure data were sourced from Experian MMG3
2. The 2016-based per capita convenience expenditure data were rolled forward to the base year and forecast years using the forecasts contained within Experian Retail Planner Briefing Note 17
(Figure 1a, February 2020)
All monetary values are held constant at 2016 prices.
Spreadsheet 3 - Total Convenience Goods Expenditure and Expenditure Growth (£m)
Year Zone 1 Zone 2 Zone 3 Zone 4 Zone 5 Zone 6 Zone 7 Zone 8 Zone 9 Zone 10All Zones
Growth in total expenditure 2019 - 2024 1.64 1.51 1.46 1.57 0.96 0.81 1.35 2.26 1.82 2.76 16.14
Growth in total expenditure 2024 - 2029 1.39 1.63 1.31 1.06 0.57 0.70 1.47 2.38 1.59 2.75 14.84
Growth in total expenditure 2029 - 2034 1.13 1.43 1.22 1.10 0.51 0.59 1.59 2.45 1.38 2.78 14.18
Growth in total expenditure 2034 - 2037 0.64 0.69 0.77 0.68 0.36 0.15 0.99 1.60 1.08 1.51 8.47
Growth in total expenditure 2019 - 2037 4.80 5.26 4.76 4.40 2.41 2.25 5.39 8.70 5.87 9.79 53.63
Notes
1. The figures in the above table are the product of multiplying the data presented in Spreadsheet 1 (population) by Spreadsheet 2 (per capita convenience goods expenditure) and are in millions of pounds (£m).
2. The total expenditure includes a proportion of expenditure on Special Forms of Trading (SFT) (e.g. internet shopping). The proportion of expenditure on SFT in 2019 is derived from the telephone survey of households.
For each of the forecast years, we have applied the rate of growth in adjusted SFT market share implied by Experian's forecasts.
All monetary values are held constant at 2016 prices.
Spreadsheet 4 - Convenience Goods Spending Patterns in 2019 as a Percentage across the Study Area Zones
Zone 1 Zone 2 Zone 3 Zone 4 Zone 5 Zone 6 Zone 7 Zone 8 Zone 9 Zone 10
% % % % % % % % % %
INSIDE STUDY AREA
Zone 1
Shaw District Centre 68.5% 26.7% 0.0% 0.2% 2.4% 4.6% 6.0% 1.6% 6.5% 0.0%
1. The spending patterns are calculated by multiplying the total comparison goods expenditure in 2019 (Spreadsheet 3) by the market share (Spreadsheet 4). The figures in the 'Total' column are the sum of the expenditure attracted to each centre /
store from each zone.
2. The 'All Zones Market Share' is calculated by dividing the total expenditure retained by each centre / store by the total expenditure in the study area.
Destination
Spreadsheet 6 - Convenience Retail Commitments
Application Proposal Planning Application Ref. No. Sales Area Floorspace
1. Growth in convenience retail sales area floorspace taken from planning application material or based on PBA estimate.
2. Sales density based on Stantec estimate to reflect average of main convenience goods retailers and to reflect nature and location of proposed development.
Spreadsheet 7 - Summary of Capacity for Convenience Goods Retail Floorspace (Constant Retention Rate)
Cumulative
Change
2019-2037 2019-24 2024-29 2029-34 2034-37
Total Population and Expenditure
A. Total study area population (persons) 350,384 357,144 362,566 367,649 370,687 20,303 6,760 5,422 5,083 3,038
B. Total convenience goods expenditure (excluding SFT) (£m) 717.7 728.6 740.0 752.6 760.0 42.3 11 11 13 7
Retained Expenditure
C. Convenience goods expenditure retained in study area (%) 76.4% 76.4% 76.4% 76.4% 76.4% 0.0 0.0 0.0 0.0 0.0
D. Convenience goods expenditure retained in study area (£m) 548.6 557.0 565.7 575.3 581.0 32.3 8.4 8.7 9.6 5.7
Inflow
E. Inflow to study area at 9% (£m) 49.4 50.1 50.9 51.8 52.3 2.9 0.8 0.8 0.9 0.5
F. Growth in Inflow (£m) 0.0 0.8 0.8 0.9 0.5 0.5 0.8 0.0 0.1 -0.4
Total Turnover in Study Area
G. Baseline convenience goods turnover of stores in study area (£m) 598.0 598.0 598.0 598.0 598.0 0.0 0.0 0.0 0.0 0.0
Initial Surplus
H. Growth in retained convenience goods expenditure (£m) 0.0 -40.3 -31.5 -21.9 -16.6 -16.6 -40.3 8.7 9.7 5.3
Claims on Expenditure
I. Sales density growth in existing stores (£m) 0.0 0.0 0.0 0.0 0.0 0.0 0.0 0.0 0.0 0.0
J. Turnover from commitments 0.0 0.1 0.1 0.1 0.1 0.1 0.1 0.0 0.0 0.0
K. Total claims on expenditure (£m) 0.0 0.1 0.1 0.1 0.1 0.1 0.1 0.0 0.0 0.0
L. Residual expenditure (£m) 0.0 -40.4 -31.6 -22.0 -16.6
Convenience Retail Floorspace Requirements (8)
M. Assumed sales density (£/sq.m) 11,500 11,500 11,500 11,500 11,500 0 0 0 0 0
N. Floorspace requirement (sales area floorspace sq.m) 0 -3,510 -2,751 -1,909 -1,447 -1,447 -3,510 759 843 461
1. Total population of the study area taken from Spreadsheet 1. Total convenience expenditure (excluding SFT) taken from Spreadsheet 3.
2. Retained expenditure - proportion of all convenience goods expenditure spent at retail facilities within the study area, taken from Spreadsheet 5. This is held constant throughout the assessment period.
3. Inflow - additional convenience goods expenditure drawn to retail facilities within the study area from residents outside the study area. Assumed to be 9% of retained expenditure.
4. Total convenience goods turnover of stores within study area in the base year taken from Spreadsheet 5.
5. Initial surplus - total growth in retained convenience goods expenditure before claims on expenditure.
6. Claims on expenditure - the turnover of commitments for new convenience retail floorspace in the study area taken from Spreadsheet 6. No allowance is made for improving sales efficiency in existing stores due to very low /
negative forecasts of sales density growth.
7. Convenience retail floorspace requirements calculated by converting the residual expenditure using a sales density estimate of £11,500 / sq. m in 2019.
8. All monetary figures are rounded to one decimal place and all floorspace figures are rounded to the nearest square metre.
Incremental
Change2019 2024 2029 2034 2037
Main Report Oldham Retail & Leisure Study
Appendix D Comparison Retail Capacity Tables
Spreadsheet 1 - Population Projections
Year Zone 1 Zone 2 Zone 3 Zone 4 Zone 5 Zone 6 Zone 7 Zone 8 Zone 9 Zone 10All Zones
1. 2016-based per capita comparison expenditure were sourced from Experian MMG3.
2. The 2016-based per capita comparison expenditure data were rolled forward to the base year and forecast years using the forecasts contained within Experian Retail Planner Briefing Note 17 (Figure 1a,
February 2020)
All monetary values are held constant at 2016 prices.
Spreadsheet 3 - Total Comparison Goods Expenditure and Expenditure Growth (£m)
Year Zone 1 Zone 2 Zone 3 Zone 4 Zone 5 Zone 6 Zone 7 Zone 8 Zone 9 Zone 10All Zones
Growth in total expenditure 2019 - 2024 19.54 22.64 27.37 20.16 16.97 14.94 14.99 24.06 31.07 37.22 228.96
Growth in total expenditure 2024 - 2029 21.15 25.26 29.72 21.24 17.79 16.18 16.91 27.03 33.63 41.13 250.04
Growth in total expenditure 2029 - 2034 23.71 28.58 33.72 24.40 20.09 18.19 19.87 31.47 37.93 47.42 285.39
Growth in total expenditure 2034 - 2037 16.02 19.01 23.00 16.62 13.76 11.71 13.72 21.91 26.37 31.93 194.06
Growth in total expenditure 2019 - 2037 80.42 95.49 113.82 82.42 68.61 61.03 65.50 104.47 129.00 157.70 958.45
Notes
1. The figures in the above table are the product of multiplying the data presented in Spreadsheet 1 (population) by Spreadsheet 2 (per capita comparison goods expenditure) and are in millions of pounds (£m).
2. The total expenditure includes a proportion of expenditure on Special Forms of Trading (SFT) (e.g. internet shopping). The proportion of expenditure on SFT in 2019 is derived from the telephone survey of households.
This headline rate has been adjusted to take account of SFT sales from stores. For each of the forecast years, we have applied the rate of growth in adjusted SFT market shares implied by Experian's forecasts.
All monetary values are held constant at 2016 prices.
Spreadsheet 4 - Comparison Goods Spending Patterns in 2019 as a Percentage across the Study Area Zones
Zone 1 Zone 2 Zone 3 Zone 4 Zone 5 Zone 6 Zone 7 Zone 8 Zone 9 Zone 10
% % % % % % % % % %
INSIDE STUDY AREA
Zone 1
Shaw District Centre 12.2% 2.2% 0.9% 0.0% 0.3% 0.6% 0.9% 0.3% 2.4% 0.0%
1. The spending patterns are calculated by multiplying the total comparison goods expenditure in 2019 (Spreadsheet 3) by the market share (Spreadsheet 4). The figures in the 'Total' column are the sum of the expenditure attracted to each centre /
store from each zone.
2. The 'All Zones Market Share' is calculated by dividing the total expenditure retained by each centre / store by the total expenditure in the study area.
Destination
Spreadsheet 6 - Comparison Retail Commitments
Application Proposal Planning Application Ref. No. Sales Area Floorspace
(sq. m)
Sales Density in Opening Year
(£ / sq. m)
Turnover from Study Area in
Opening Year (£m)
Commercial unit, Royton Town Hall and Royton Library PA/342430/18 712 3,000 2.1
Retail unit adjacent to B&Q, Westhulme Way, Oldham PA/341323/18 837 6,000 5.0
Retail unit, Housing Units, Failsworth PA/340026/17 713 3,000 2.1
Retail unit, former Sainsbury's, Bloom Street, Oldham PA/339744/17 2169 6,000 13.0
Retail unit, Adelaide Mill, Oldham 339577 249 6,000 1.5
Retail unit, former Lifestyle Fitness Centre, Greenfield 341337 123 3,000 0.4
Sub-total - 4,803 - 24.2
Notes
1. Growth in comparison retail sales area taken from planning application material or based on PBA estimate.
2. Sales density based on Stantec estimate to reflect the average of main comparison goods retailers and to reflect nature and location of proposed development.
Spreadsheet 7 - Summary of Capacity for Comparison Goods Retail Floorspace (Constant Retention Rate)
Cumulative
Change
2019-2037 2019-24 2024-29 2029-34 2034-37
Total Population and Expenditure
A. Total study area population (persons) 350,384 357,144 362,566 367,649 370,687 20,303 6,760 5,422 5,083 3,038
B. Total comparison goods expenditure (excluding SFT) (£m) 886.0 994.4 1,118.3 1,280.9 1,396.6 510.6 108 124 163 116
Retained Expenditure
C. Comparison goods expenditure retained in study area (%) 56.8% 56.8% 56.8% 56.8% 56.8%
D. Comparison goods expenditure retained in study area (£m) 502.8 564.4 634.7 727.0 792.6 289.8 61.5 70.3 92.3 65.6
Inflow
E. Inflow to study area at 15% (£m) 75.4 84.7 95.2 109.0 118.9 43.5 9.2 10.5 13.8 9.8
F. Growth in Inflow (£m) 0.0 9.2 10.5 13.8 9.8 9.8 9.2 1.3 3.3 -4.0
Total Turnover in Study Area
G. Baseline comparison goods turnover of stores in study area (£m) 578.3 578.3 578.3 578.3 578.3
Initial Surplus
H. Growth in retained comparison goods expenditure (£m) 0.0 -4.7 66.9 162.5 224.2 224.2 -4.7 71.6 95.6 61.7
Claims on Expenditure
I. Sales density growth in existing stores (£m) 0.0 44.7 92.8 144.7 177.7 177.7 44.7 48.1 51.9 33.0
J. Turnover from commitments 0.0 24.2 26.0 28.1 29.3 29.3 24.2 1.9 2.0 1.3
K. Total claims on expenditure (£m) 0.0 68.9 118.9 172.8 207.1 207.1 68.9 50.0 53.9 34.3
L. Residual expenditure (£m) 0.0 -73.5 -51.9 -10.2 17.1
Comparison Retail Floorspace Requirements (8)
M. Assumed sales density (£/sq.m) 5,500 5,925 6,383 6,876 7,190 1,690 425 458 493 314
N. Floorspace requirement (sales area floorspace sq.m) 0 -12,412 -8,136 -1,487 2,381 2,381 -12,412 4,276 6,649 3,868
1. Total population of the study area taken from Spreadsheet 1. Total comparison goods expenditure (excluding SFT) taken from Spreadsheet 3.
2. Retained expenditure - proportion of all comparison goods expenditure spent at retail facilities within the study area, taken from Spreadsheet 5. This is held constant throughout the assessment period.
3. Inflow - additional comparison goods expenditure drawn to retail facilities within the study area from residents outside the study area. Assumed to be 15% of retained expenditure.
4. Total comparison goods turnover of stores within study area in the base year taken from Spreadsheet 5.
5. Initial surplus - total growth in retained comparison goods expenditure before claims on expenditure.
6. Claims on expenditure - the turnover of commitments for new comparison retail floorspace in the study area taken from Spreadsheet 6. An allowance for growth in the turnover of both existing stores and committed comparison
retail floorspace based on the assumption that sales densities will grow by an average of 1.5% per annum throughout the study period.
7. Residual expenditure - the product of deducting claims on expenditure from the initial surplus.
8. Comparison retail floorspace requirements calculated by converting the residual expenditure using a sales density estimate of £5,500 / sq. m in 2016, increased by 1.5% per annum to account for anticipated sales density growth.
70% net to gross ratio assumed.
9. All monetary figures are rounded to one decimal place and all floorspace figures are rounded to the nearest square metre.
All monetary values are held constant at 2016 prices.
Incremental
Change2019 2024 2029 2034 2037
Main Report Oldham Retail & Leisure Study
Appendix E Leisure Capacity Tables
Spreadsheet 1 - Population Projections
Year Zone 1 Zone 2 Zone 3 Zone 4 Zone 5 Zone 6 Zone 7 Zone 8 Zone 9 Zone 10All Zones
This market research and the design of material used to obtain this survey information have been originated by and belong to NEMS market research, and may not be used or reproduced in whole or part without the company's written consent, or that of the Client.
NEMS market research 22 Manor Way Belasis Hall Technology Park Billingham TS23 4HN Tel 01642 37 33 55 www.nemsmr.co.uk
Oldham In Centre Survey for Peter Brett Associates November 2019 Job Ref: 171019
NEMS market research 2 Oldham In Centre Survey, November 2019
Table of Contents Introduction: Research Background & Objectives 3 Research Methodology 3 Statistical Accuracy 4 Data Tables 5 Appendices: Data Tabulations - By Demographics 7 – 25 Sample Questionnaire
NEMS market research 3 Oldham In Centre Survey, November 2019
Introduction
1.1 Research Background & Objectives To conduct an independent face to face survey amongst a sample of visitors to Oldham Town Centre.
The main aims and objectives of the study were as follows:
• To find out respondents’ main purpose for visiting;
• To find out how much respondents have spent;
• To find out how respondents think Oldham compares to other centres.
• To find out what type of shops, services and leisure facilities people would like to see more of in Oldham Town Centre.
1.2 Research Methodology A total of 150 face to face interviews were conducted. Fieldwork was carried out between Saturday 16th November and Monday 25th November 2019. Interviews were conducted using NEMS field interviewers. We engaged our resident professional field market researchers on this project, virtually all of who possess substantial experience in shopper research studies. The interviews were subject to a 10% random back check to ensure the survey was being conducted to the required standard.
NEMS market research 4 Oldham In Centre Survey, November 2019
1.3 Statistical Accuracy As with any data collection where a sample is being drawn to represent a population, there is potentially a difference between the response from the sample and the true situation in the population as a whole. Many steps have been taken to help minimise this difference (e.g. random sample selection, questionnaire construction etc) but there is always potentially a difference between the sample and population – this is known as the standard error. The standard error can be estimated using statistical calculations based on the sample size, the population size and the level of response measured (as you would expect you can potentially get a larger error in a 50% response than say a 10% response simply because of the magnitude of the numbers). To help understand the significance of this error, it is normally expressed as a confidence interval for the results. Clearly to have 100% accuracy of the results would require you to sample the entire population. The usual confidence interval used is 95% - this means that you can be confident that in 19 out of 20 instances the actual population behaviour will be within the confidence interval range.
For example, if 50% of a sample of 150 answers “Yes” to a question we can be 95% sure that between 42.0% and 58.0% of the population holds the same opinion (i.e. +/- 8.0%).
%age Response 95% confidence interval
10% ±4.8%.
20% ±6.4%
30% ±7.3%
40% ±7.8%
50% ±8.0%
NEMS market research 5 Oldham In Centre Survey, November 2019
1.4 Data Tables Tables are presented in question order with the question number analysed shown at the top of the table. Those questions where the respondent is prompted with a list of possible answers are indicated in the question text with a suffix of [PR]. The sample size for each question and corresponding column criteria is shown at the base of each table. A description of the criteria determining to whom the question applies is shown in italics directly below the question text; if there is no such text evident then the question base is the full study sample. If the tabulated data is weighted (indicated in the header of the tabulations), in addition to the sample base, the weighted base is also shown at the bottom of each table. Unless indicated otherwise in the footer of the tabulations, all percentages are calculated down the column. Arithmetic rounding to whole numbers may mean that columns of percentages do not sum to exactly 100%. Zero per cent denotes a percentage of less than 0.05%. Percentages are calculated on the number of respondents and not the number of responses. This means that where more than one answer can be given to a question the sum of percentages may exceed 100%. All such multi-response questions are indicated in the tabulated by a suffix of [MR] on the question text. Where appropriate to the question, means are shown at the bottom of response tables. These are calculated in one of two ways: if the data is captured to a coded response a weighted mean is calculated and the code weightings are shown as a prefix above the question text; if actual specific values were captured from respondents these individual numbers are used to calculate the mean.
Appendix 1: Data Tabulations By Demographics
by Demographics Oldham In Centre Survey Page 7 for Peter Brett Associates November 2019
Total Male Female 18 - 34 35 - 54 55 + ABC1 C2DE
Column %ges. 171019 NEMS market research
Q01 Do you normally have regular access to a car for personal use during the day? Yes 40.0% 60 45.9% 17 38.1% 43 39.3% 11 49.1% 26 33.3% 23 58.1% 25 32.7% 35No 60.0% 90 54.1% 20 61.9% 70 60.7% 17 50.9% 27 66.7% 46 41.9% 18 67.3% 72Base: 150 37 113 28 53 69 43 107 Q02 Do you normally have regular access to a car for personal use during the evening / night? Yes 40.7% 61 45.9% 17 38.9% 44 42.9% 12 49.1% 26 33.3% 23 58.1% 25 33.6% 36No 59.3% 89 54.1% 20 61.1% 69 57.1% 16 50.9% 27 66.7% 46 41.9% 18 66.4% 71Base: 150 37 113 28 53 69 43 107 Q03 How did you travel to Oldham Town Centre today (main part of journey) ? Car / van (as driver) 24.0% 36 37.8% 14 19.5% 22 21.4% 6 34.0% 18 17.4% 12 37.2% 16 18.7% 20Car / van (as passenger) 6.7% 10 0.0% 0 8.9% 10 10.7% 3 3.8% 2 7.2% 5 11.6% 5 4.7% 5Bus, minibus or coach 45.3% 68 35.1% 13 48.7% 55 35.7% 10 37.7% 20 55.1% 38 37.2% 16 48.6% 52Motorcycle, scooter or
Doctors surgery 0.7% 1 0.0% 0 0.9% 1 0.0% 0 0.0% 0 1.4% 1 0.0% 0 0.9% 1Shaw 0.7% 1 0.0% 0 0.9% 1 0.0% 0 0.0% 0 1.4% 1 0.0% 0 0.9% 1Rochdale 0.7% 1 0.0% 0 0.9% 1 0.0% 0 0.0% 0 1.4% 1 0.0% 0 0.9% 1Base: 150 37 113 28 53 69 43 107 Q08 In terms of your visit to Oldham Town Centre do you live in Oldham Town Centre, work in Oldham Town Centre or are you a visitor to
the area ? [MR] Those who did not say holiday at Q07 Live in the centre 6.8% 10 2.9% 1 8.0% 9 11.1% 3 7.5% 4 4.4% 3 4.7% 2 7.6% 8Work in the centre 8.1% 12 5.7% 2 8.9% 10 14.8% 4 11.3% 6 2.9% 2 20.9% 9 2.9% 3Visiting the centre 85.8% 127 91.4% 32 84.1% 95 74.1% 20 83.0% 44 92.6% 63 76.7% 33 89.5% 94Base: 148 35 113 27 53 68 43 105
by Demographics Oldham In Centre Survey Page 9 for Peter Brett Associates November 2019
Total Male Female 18 - 34 35 - 54 55 + ABC1 C2DE
Column %ges. 171019 NEMS market research
Q09 Why do you choose to shop/visit Oldham Town Centre? [MR] Proximity to home 53.3% 80 51.4% 19 54.0% 61 35.7% 10 66.0% 35 50.7% 35 46.5% 20 56.1% 60Proximity to work 8.7% 13 8.1% 3 8.9% 10 10.7% 3 13.2% 7 4.3% 3 16.3% 7 5.6% 6Accessibility to Oldham 31.3% 47 27.0% 10 32.7% 37 21.4% 6 35.8% 19 31.9% 22 30.2% 13 31.8% 34Range of
by Demographics Oldham In Centre Survey Page 12 for Peter Brett Associates November 2019
Total Male Female 18 - 34 35 - 54 55 + ABC1 C2DE
Column %ges. 171019 NEMS market research
Q16 Where did you last visit for your main food and grocery shopping ? Please give name and location of store if possible, otherwise just the town. [MR]
Base: 122 33 89 25 41 56 33 89 Q17 Why do you choose to do your main food shop at (LOCATION AT Q.16) rather than Oldham Town Centre ? [MR] Those who said No or Don’t know at Q13 and did not mention Oldham at Q16 Nearer to home 67.4% 58 68.0% 17 67.2% 41 78.6% 11 63.3% 19 66.7% 28 70.8% 17 66.1% 41Nearer to work 14.0% 12 12.0% 3 14.8% 9 7.1% 1 20.0% 6 11.9% 5 4.2% 1 17.7% 11Poor accessibility to Oldham 3.5% 3 4.0% 1 3.3% 2 0.0% 0 0.0% 0 7.1% 3 0.0% 0 4.8% 3Choice of food goods
by Demographics Oldham In Centre Survey Page 16 for Peter Brett Associates November 2019
Total Male Female 18 - 34 35 - 54 55 + ABC1 C2DE
Column %ges. 171019 NEMS market research
Q25 Why did you choose to shop at (LOCATION AT Q.22) for non food shopping instead of Oldham Town Centre ? [MR] Those who said No or Don’t know at Q19 and did not mention Oldham at Q22 Nearer to home 47.5% 38 45.0% 9 48.3% 29 38.5% 5 44.0% 11 52.4% 22 47.4% 9 47.5% 29Nearer to work 6.3% 5 10.0% 2 5.0% 3 7.7% 1 4.0% 1 7.1% 3 10.5% 2 4.9% 3Poor accessibility to Oldham 0.0% 0 0.0% 0 0.0% 0 0.0% 0 0.0% 0 0.0% 0 0.0% 0 0.0% 0Independent/specialist shops 12.5% 10 5.0% 1 15.0% 9 23.1% 3 20.0% 5 4.8% 2 26.3% 5 8.2% 5Provision of a department
Job No. 171019 NEMS market research November 2019 OLDHAM ON-STREET VISITORS SURVEY INTRODUCTION: Good morning / afternoon, I am …… from NEMS market research, an independent market research company. I am conducting a survey on behalf of Oldham Council into the shopping behaviours of people who are visiting Oldham Town Centre, to assist in planning for future improvements to the centre. May I ask you a few questions ? It should take no longer than 5 minutes.
ASK ALL: Q.A. Do you or any members of your family work in any of these occupations: MARKET RESEARCH, RETAIL. IF ‘YES’ – CLOSE INTERVIEW, DO NOT COUNT AS INTERVIEW. IF ‘NONE OF THESE’ – GO TO Q.B ASK ALL: Q.B. Could you tell me your home postcode please, not your holiday address if you are on holiday ? INTERVIEWER, PLEASE WRITE CLEARLY AND IN CAPITALS. Home Postcode: Please record respondents home postcode BUT NOT THE LAST 2 CHARACTERS
ASK ALL Q.1 Do you normally have regular access to a car for personal use during the day? Q.2 Do you normally have regular access to a car for personal use during the evening / night? ONE ANSWER ONLY. DO NOT PROMPT
Day (Q.1) Night (Q.2) ( 1 ) ( 2 ) Yes 1 1 No 2 2
ASK ALL: Q.3 How did you travel to Oldham Town Centre today (main part of journey) ? ONE ANSWER ONLY. DO NOT PROMPT
( 3 ) Car / van (as driver) 1 GO TO Q.4 Car / van (as passenger) 2 GO TO Q.4 Bus, minibus or coach 3 GO TO Q.6 Motorcycle, scooter or moped 4 GO TO Q.6 Walk 5 GO TO Q.6 Taxi / minicab 6 GO TO Q.6 Tram 7 GO TO Q.6 Bicycle 8 GO TO Q.6 Other (PLEASE WRITE IN) A GO TO Q.6
_______________________________________
* ASK THOSE WHO ‘ARRIVED BY CAR’ AT Q.3, OTHERS GO TO Q.6: Q.4 Where did you park today ? ONE ANSWER ONLY. DO NOT PROMPT
( 4 ) Bloom Street 1
Bow Street 2 Bradshaw Street 3 Civic Centre 4
Hobson Street 5 New Radcliffe Street 6 Prince Street (bottom of Yorkshire Street) 7 Rock Street 8 Southgate Street 9 Spindles Town Centre Car Park A Sports Centre B Tommyfield Market C Waterloo Street D Sainsbury’s, Union Street, Oldham Town Centre E On-Street F Other (PLEASE WRITE IN) G ______________________________ (Don’t know / can’t remember) H (Dropped off – didn’t park) I GO TO Q.6
2
ASK THOSE WHO PARKED AT Q.4, OTHERS GO TO Q.6: Q.5 Did you have any difficulties obtaining a car parking space today? ONE ANSWER ONLY. DO NOT PROMPT
( 5 )
Yes 1 No 2 ASK ALL: Q.6 How long did your journey to Oldham Town Centre take ?
ONE ANSWER ONLY. DO NOT PROMPT ( 6 ) 0-5 minutes 1 6-10 minutes 2 11-15 minutes 3 16-20 minutes 4 21-30 minutes 5 31-60 minutes 6 Over 60 minutes 7 (Don’t know / can’t remember) 8 ASK ALL: Q.7 Did you travel to Oldham Town Centre directly from home, work or elsewhere ? ONE ANSWER ONLY. DO NOT PROMPT
( 7 ) Home 1 GO TO Q.8 Work 2 GO TO Q.8 On holiday 3 GO TO Q.9 Elsewhere (PLEASE WRITE IN) 4 GO TO Q.8
_______________________________________ (Refused) 5 GO TO Q.8
ASK THOSE WHO DID NOT SAY ‘ON HOLIDAY’ AT Q.7, OTHERS GO TO Q.9: Q.8 In terms of your visit to Oldham Town Centre do you live in Oldham Town Centre, work in Oldham Town Centre or are you a
visitor to the area ? CAN BE MULTI-CODED
( 8 ) Live in the centre 1 Work in the centre 2 Visiting the centre 3
ASK ALL: Q.9 Why do you choose to shop/visit Oldham Town Centre? CODE UP TO THREE RESPONSES
( 9 ) Proximity to home 1 Proximity to work 2 Accessibility to Oldham 3 Range of independent/specialist shops 4 Department store 5 Choice of High Street retailers 6 Quality of shops selling food goods 7 Choice of shops selling non-food goods 8 Provision of services, such as banks / financial services 9 Provision of leisure services A Shopping environment B Cleanliness C Car parking provision D Car parking prices E Accessibility by public transport F Public information, signposts, public facilities G Entertainment / events H Safety (during the day) I Safety (during the night) J Other (PLEASE WRITE IN) K
_____________________________________ (Don’t know / no reason) L
3
ASK ALL: Q.10 What is the main reason why you are in Oldham Town Centre today ? ONE ANSWER ONLY. ASK ALL: Q.11 What else do you intend to do whilst in Oldham Town Centre today ? CODE UP TO THREE RESPONSES. Q10 Q11
Main Reason Other Reasons ( 10 ) ( 11 ) Food and grocery shopping 1 1 Clothes / shoes shopping 2 2 Electrical goods shopping 3 3 Stationers / newsagents 4 4 Furniture / carpet 5 5 Jewellery / gift shops 6 6 Chemist 7 7 Market 8 8 Library 9 9 Public offices A A Bank / Building Society / Post Office B B Doctor / dentist C C Café / restaurant / pub D D Work / School / College E E Social / leisure activities F F Other (PLEASE WRITE IN) G G
______________________________ (No other activities / reason) - H ASK ALL: Q.12 How long do you think you will stay in Oldham Town Centre today ?
ONE ANSWER ONLY. DO NOT PROMPT ( 12 ) Up to half an hour 1 Up to two hours 2 Half the day 3 All day 4 (Don’t know) 5
ASK ALL: Q.13 Will you buy your food and grocery goods, that is undertake your main food shop, whilst in Oldham Town Centre today ? ONE ANSWER ONLY. DO NOT PROMPT ( 13 ) Yes 1 GO TO Q.14 No 2 GO TO Q.16 (Don’t know) 3 GO TO Q.16
ASK THOSE WHO SAID ‘YES’ AT Q.13, OTHERS GO TO Q.16: Q.14 How frequently do you visit Oldham Town Centre for your main food and grocery shopping ?
ONE ANSWER ONLY. DO NOT PROMPT ( 14 )
Daily 1 Once a week or more 2 Less than once a week 3 Less than once a fortnight 4 Less than once a month 5 (Don’t know / varies) 6
4
ASK THOSE WHO SAID ‘YES’ AT Q.13, OTHERS GO TO Q.17: Q.15 Approximately how much have you spent or will you spend today on food goods ? ONE ANSWER ONLY. DO NOT PROMPT ( 15 ) Nothing 1 Up to £5 2 £5.01 - £10 3 £10.01 - £15 4 £15.01 - £20 5 £20.01 - £25 6 £25.01 - £50 7 £50.01 - £75 8 £75.01 - £100 9 More than £100 A (Don’t know) B (Refused) C
ASK IF ANSWER AT Q.13 IS ‘NO’ OR ‘DON’T KNOW’, OTHERS GO TO Q.19: Q.16 Where did you last visit for your main food and grocery shopping ? Please give name and location of store if possible, otherwise
ASK IF ANSWER AT Q.13 IS ‘NO’ OR ‘DON’T KNOW’, AND DID NOT SAY ‘OLDHAM’ AT Q.16. OTHERS GO TO Q.19:
Q.17 Why do you choose to do your main food shop at (LOCATION AT Q.16) rather than Oldham Town Centre ? CAN BE MULTI CODED. PROBE FULLY. What else? ( 17 ) Nearer to home 1 Nearer to work 2 Poor accessibility to Oldham 3 Choice of food goods available 4 Choice of shops selling food goods 5 Quality of food goods available 6 Quality of shops selling food goods 7 Choice of shops selling non-food goods 8 Provision of services, such as banks / financial services 9 Provision of leisure services A Shopping environment B Cleanliness C Car parking provision D Car parking prices E Accessibility by public transport F Public information, signposts, public facilities G Entertainment / events H Safety (during the day) I Safety (during the night) J Other (PLEASE WRITE IN) K
________________________ (Don’t know / no reason) L
ASK IF ANSWER AT Q.13 IS ‘NO’ OR ‘DON’T KNOW’, AND DID NOT SAY ‘OLDHAM’ AT Q.16. OTHERS GO TO Q.19:
Q.18 How do you usually travel to (LOCATION AT Q.16) (main part of journey) ? ONE ANSWER ONLY. DO NOT PROMPT
( 18 ) Car / van (as driver) 1
Car / van (as passenger) 2 Bus, minibus or coach 3 Motorcycle, scooter or moped 4 Walk 5 Taxi / minicab 6 Tram 7 Bicycle 8 Other (PLEASE WRITE IN) A _______________________ (Do not travel, goods delivered) B
ASK ALL: Q.19 Will you buy any of the following today, whilst in Oldham Town Centre ? ONE ANSWER ONLY. DO NOT PROMPT ( 19 ) Yes- clothing, footwear or household goods 1 GO TO Q.20 Yes- bulky items such as furniture, carpets, 2 GO TO Q.20 electrical items or DIY goods Yes - toys 3 GO TO Q.20 Yes - all of the above 4 GO TO Q.20 No 5 GO TO Q.22
(Don’t know) 6 GO TO Q.22
ASK THOSE WHO SAID ‘YES’AT Q.19. OTHERS GO TO Q.21 Q.20 How frequently do you visit Oldham Town Centre for non food shopping? ONE ANSWER ONLY. ( 20 ) Daily 1 Once a week or more 2 Less than once a week 3 Less than once a fortnight 4 Less than once a month 5 (Don’t know / varies) 6 (Never) 7
6
ASK IF ANSWER AT Q.19 IS ‘YES’, OTHERS GO TO Q.22 Q.21 How much have you spent or will you spend today in Oldham Town Centre on non food shopping? ONE ANSWER ONLY. DO NOT PROMPT ( 21 ) Nothing 1 Up to £5 2 £6 – £10 3 £11 - £15 4 £16 - £20 5 £21 - £25 6 £26 - £50 7 £51 - £75 8 £76- £100 9 More than £100 A (Don’t know) B (Refused) C
ASK IF ANSWER AT Q.19 IS ‘NO’ / ‘DON’T KNOW’, OTHERS GO TO Q.25 Q.22 Which centre / facility did you last shop at for non food goods? ONE ANSWER ONLY. DO NOT PROMPT Town / District Centres: ( 22 ) Ashton under Lyne 001
Chadderton 002 Droylsden 003 Failsworth 004 Hapurhey 005 Lees 006 Huddersfield Road 007 Manchester City Centre 008 Middleton 009 Oldham 010 Rochdale 011 Royton 012 Shaw 013 Uppermill 014
Retail Parks / Shopping Centres: Alexandra Retail Park, Oldham 015 Centre Retail Park/Elk Mill, Oldham 016 Cheetham Hill Shopping Centre 017 Kingsway Retail Park, Rochdale 018 Manchester Fort Shopping Park 019
Snipe Retail Park, Ashton under Lyne 020 Crown Point, Denton 021
The Trafford Centre 022 Other (PLEASE WRITE IN) 023
________________________ Internet 024 GO TO Q.25 (Don’t know / varies) 025 GO TO Q.25
ASK IF LOCATION MENTIONED AT Q.20, OTHERS GO TO Q.27 Q.23 How frequently do you visit (ANSWER TO Q.20) for clothing and footwear or other non food goods? ONE ANSWER ONLY. DO NOT PROMPT. ( 23 ) Daily 1 Once a week or more 2 Less than once a week 3 Less than once a fortnight 4 Less than once a month 5 (Don’t know / varies) 6
7
ASK IF LOCATION MENTIONED AT Q.20, OTHERS GO TO Q.27 Q.24 Approximately how much did you spend on your last visit to (ANSWER TO Q.20) on clothing or non food goods? ONE ANSWER ONLY. DO NOT PROMPT ( 24 ) Nothing 1 Up to £5 2 £5.01 - £10 3 £10.01 - £15 4 £15.01 - £20 5 £20.01 - £25 6 £25.01 - £50 7 £50.01 - £75 8 £75.01 - £100 9 More than £100 A (Don’t know) B (Refused) C ASK IF ANSWER AT Q.19 IS ‘NO’ OR ‘DON’T KNOW’, AND DID NOT SAY ‘OLDHAM’ AT Q.22. OTHERS GO TO
Q.27: Q.25 Why did you choose to shop at (LOCATION AT Q.22) for non food shopping instead of Oldham Town Centre ? CAN BE MULTI CODED. PROBE FULLY. What else?
( 25 ) Nearer to home 1 Nearer to work 2 Poor accessibility to Oldham 3 Independent/specialist shops 4 Provision of a department store 5 High street names 6 Choice of goods available 7 Choice of shops selling clothing or household goods 8 Quality of clothing or household goods available 9 Choice of shops selling other goods A Provision of services, such as banks / financial services B Provision of leisure services C Shopping environment D Cleanliness E Car parking provision F Car parking prices G Accessibility by public transport H Public information, signposts, public facilities I Entertainment / events J Safety (during the day) K Safety (during the night) L Other (PLEASE WRITE IN) M
_________________________________ (Don’t know / no reason) N
ASK IF LOCATION MENTIONED AT Q.22, OTHERS GO TO Q.27
Q.26 How do you normally travel to (LOCATION AT Q.22) (main part of journey)? ONE ANSWER ONLY. DO NOT PROMPT ( 26 ) Car / van (as driver) 1 Car / van (as passenger) 2 Bus, minibus or coach 3 Motorcycle, scooter or moped 4 Walk 5 Taxi / minicab 6 Tram 7 Bicycle 8 Other (PLEASE WRITE IN) A
__________________________________ (Do not travel, goods delivered) B GO TO Q.27
8
ASK ALL: SHOWCARD ‘A’ Q.27 Which of these statements would you say best describes how frequently you visit Oldham Town Centre, compared with five
years ago? ONE ANSWER ONLY ( 27 )
Much more frequently than before 1 More frequently than before 2 About as frequently 3 Less frequently than before 4 Much less frequently than before 5 Didn’t visit five years ago 6 This is my first visit 7 (Don’t know / can’t remember) 8 ____________________________________________________________________________________________________________ ASK ALL: Q.28 How long do you typically spend in Oldham Town Centre during the evening / night ? ONE ANSWER ONLY.
( 28 ) Up to 1 hour 1 1 to 2 hours 2 Over 2 and up to 4 hours 3 Over 4 hours 4 Don’t visit in the evening 5 (Don’t know / varies) 6
ASK ALL: SHOWCARD ‘B’ Q.29 Comparing Oldham Town Centre with other centres, how does it compare on the following aspects ? READ OUT STATEMENTS. CODE ONE RESPONSE PER STATEMENT Much Better About the Worse Much (Don’t better same worse know) ( 29 ) ( 30 ) ( 31 ) ( 32 ) ( 33 ) ( 34 ) Choice of shops 1 1 1 1 1 1 Choice of High Street names 2 2 2 2 2 2 Choice of independent/specialist shops 3 3 3 3 3 3 Quality of shops 4 4 4 4 4 4 Range of services such as banks 5 5 5 5 5 5 and other financial services Range and choice of pubs / restaurants 6 6 6 6 6 6 Leisure facilities 7 7 7 7 7 7 Town centre environment 8 8 8 8 8 8 Cleanliness 9 9 9 9 9 9 Car parking provision A A A A A A Car parking prices B B B B B B Accessibility by public transport C C C C C C Public information / signposts / public facilities D D D D D D Leisure facilities E E E E E E Cinemas F F F F F F Restaurants G G G G G G Entertainment / events / performances H H H H H H Tourist facilities/hotels I I I I I I Day-time safety J J J J J J Evening / night safety K K K K K K Layout L L L L L L Public Art M M M M M M General environment N N N N N N
9
ASK ALL: Q.30 What type of shops or services would you like to see more of in Oldham Town Centre ? CAN BE MULTI CODED. PROBE FULLY. Which others? ( 35 ) Large supermarkets 1 Specialist foodstores 2 Department stores 3 Clothing stores 4 Footwear stores 5 Electrical goods 6 Household goods stores 7 Pharmacies 8 Independent retailers 9 Restaurants / cafes A Drinking establishments (e.g. pub / bar) B Building Society C Banks D Solicitors E Other (PLEASE WRITE) F ______________________ (None mentioned) F (Don’t know) G ASK ALL: Q.31 What type of leisure facilitites would you like to see more of in Oldham Town Centre ? CAN BE MULTI CODED. PROBE FULLY. Which others? ( 36 ) Health and fitness 1 Swimming pool 2 Bingo 3 Cinema 4 Bowling alley 5 Hotels 6 Ice rink 7 Museums 8 Art galleries 9 Go-karting A Parks/gardens B Civic Hall / Civic spaces C Theatre D Pub / bar E Restaurant / cafes F Nightclub G Other (PLEASE WRITE IN) H ______________________ (None mentioned) I (Don’t know) J
10
ASK ALL: Q.32 What measures do you think would improve Oldham Town Centre and make it more attractive ? CAN BE MULTI CODED. PROBE FULLY. What others?
( 37 ) Increased choice / range of shops 1 More speciality shops 2 More national multiples 3 Better foodstore provision 4 More non-food stores 5 More independent / Specialist traders 6 Improved street paving 7 Cheaper parking 8 Flexible parking 9 Reduce traffic congestion A Improved public transport B More entertainment / leisure facilities C More quality restaurants / pavement cafes D More evening activities E More organised events e.g. street markets F More cultural facilities G Improved security / CCTV H Improved cleanliness I Greater promotion / marketing of the centre J Public toilets K Expansion of the centre L Improved cultural facilities M More tourist facilities N Improved signage/information O More open spaces P Other (PLEASE WRITE IN) Q ______________________ (None mentioned) R . (Don’t know) S ASK ALL: Q.33 What do you think are the biggest weaknesses of Oldham Town Centre ? CAN BE MULTI CODED. PROBE FULLY. What others? ( 38 ) Choice / range of non-food shops 1 Range of specialist/independent retailers 2 Foodstore provision 3 Lack of cultural facilities 4 Accessibility by private car 5 Car parking 6 Accessibility by public transport 7 Accessibility by cycling and by foot 8 Public information / events 9 Range and choice of pubs / restaurants A Tourism facilities B Town centre environment C Non-retail provision (e.g. banks, estate agents (etc.) D Leisure facilities E Security / safety F Lack of open spaces G Other (PLEASE WRITE IN) H
__________________________ (None mentioned) I (Don’t know) J
11
RESPONDENT DETAILS FOR THE PURPOSE OF HEAD OFFICE CHECKING THE QUALITY OF MY WORK, MAY I TAKE YOUR NAME AND A CONTACT TELEPHONE NUMBER OR EMAIL ADDRESS PLEASE? INTERVIEWER: PLEASE RECORD IN BLOCK CAPITALS.
NAME: _________________________________________________________________________________________________ TEL. NO. _____________________________ OR EMAIL ADDRESS: _______________________________________________
GENDER: Q.34 AGE GROUP: Q.35 Male 1 16 - 24 years 1 Female 2 25 - 34 years 2 35 - 44 years 3 45 - 54 years 4 55 - 64 years 5 65+ years 6 OCCUPATION OF CHIEF WAGE EARNER IN HHOLD: ________________________________________________________ ( 39 ) AB 1 C1 2 C2 3 DE 4 ETHNICITY: SHOWCARD ‘C’ ( 40 ) White 1 Indian 2 Pakistani 3 Bangladeshi 4 Other Asian 5 Black Caribbean 6 Black African 7 Other Black 8 Chinese 9 Any other Ethnic group (PLEASE WRITE IN) A
__________________________________________ Mixed background B (Refused) C DATE OF INTERVIEW: ( 41 ) TIME OF INTERVIEW: ( 42 ) Monday 1 09.00 – 12.00 1 Saturday 2 12.01 – 14.00 2 14.01 – 16.00 3 LOCATION : ( 43 ) 16.01 – 17.00 4 High Street Outside Primark 1 Albion St / Henshaw St Junction 2 Parliament Square 3 DECLARATION: I certify that the interview has been personally carried out by me with the informant and conducted within the MRS
Code of Conduct. I further certify that the informant is not a friend or relative of mine and I have not interviewed him / her on any survey in the last six months. ( 44 ) ( 45 )
J:\47000 to 47999\47212 Oldham Retail & Leisure Study\4501 Planning\Reps-Tech Notes\Final Report\Appendices\Appendix H - Potential
Oldham Town Centre
5 Horsedge Street, Oldham
Evaluation Criteria Comment Site Size Approximately 550 sq. m.
Current Use Vacant Healthcare Facilities.
Sequential Status In centre.
Availability The property is listed for sale at £575,000 and is being actively marketed by Breaker and Nuttall.
Potential Uses There is potential to clear the site for medium to high-density residential accommodation. Accommodation could cater for a specific group e.g. student accommodation, age-restricted apartments or specialist supported living accommodation.
There is also an opportunity to convert the building into low grade offices.
Scale of Development Small scale up to 550 sq. m.
Development Constraints Potential cost of site clearance and remediation (if required); or, cost of conversion of healthcare facility.
J:\47000 to 47999\47212 Oldham Retail & Leisure Study\4501 Planning\Reps-Tech Notes\Final Report\Appendices\Appendix H - Potential
Access Vehicle access from Bartlam Place, pedestrian access from Horsedge Street. Car parking area to the south of the site.
Overall Development Prospects Good.
J:\47000 to 47999\47212 Oldham Retail & Leisure Study\4501 Planning\Reps-Tech Notes\Final Report\Appendices\Appendix H - Potential
71 Yorkshire Street, Oldham
Evaluation Criteria Comment Site Size Approximately 600 sq. m.
Current Use Vacant Public House.
Sequential Status In centre.
Availability Leasehold available and being marketed by Fleurets. It is unclear whether the owners (A1 Ace Limited) would be willing to sell the unit.
Potential Uses The site could be converted to a restaurant use which would complement the neighbouring Theatre and public houses/bars.
The upper floors could be converted to an office use and be accessed via the service entrance on Bartlam Place.
Scale of Development Small scale up to 600 sq. m.
Development Constraints Cost of conversion of the unit. The neighbouring units accommodate uses which are not compatible with noise-sensitive development.
Access Pedestrian and vehicle access from Yorkshire Street. The unit can also be serviced from Bartlam Place.
J:\47000 to 47999\47212 Oldham Retail & Leisure Study\4501 Planning\Reps-Tech Notes\Final Report\Appendices\Appendix H - Potential
Overall Development Prospects Good.
J:\47000 to 47999\47212 Oldham Retail & Leisure Study\4501 Planning\Reps-Tech Notes\Final Report\Appendices\Appendix H - Potential
Old Town Hall, Oldham
Evaluation Criteria Comment Site Size Approximately 650 sq. m.
Current Use Food and Drink.
Sequential Status In centre.
Availability Whole building owned by the Council. Two units available to let, one of which is under offer. Both units are being marketed by Metis Real Estate.
Potential Uses A small-scale leisure use, e.g. crazy golf or table tennis, could be accommodated in one of the units to complement the surrounding food and drink offer.
Scale of Development Small scale up to 650 sq. m.
Development Constraints No known constraints.
Access Pedestrian access from Yorkshire Street. No vehicle access; however, the vacant units can be serviced from Greaves Street and Finn Street.
Overall Development Prospects Very good.
J:\47000 to 47999\47212 Oldham Retail & Leisure Study\4501 Planning\Reps-Tech Notes\Final Report\Appendices\Appendix H - Potential
Pennine House, 77 Union Street
Evaluation Criteria Comment Site Size Approximately 1,200 sq. m.
Current Use Former education establishment, lawful use as an office.
Sequential Status In centre.
Availability All four floors are available to let and are being actively marketed by breaker Nuttall.
Potential Uses The building could be converted for a specialist residential use, e.g. age restricted apartments, specialised supported living apartments.
The ground floor could separately be converted into a food and drink offering. Could be ideal for a fast-food / takeaway use to be utilised by commuters using the tram station.
Scale of Development Medium scale up to 1,200 sq. m.
Development Constraints No known constraints, cost of conversion.
J:\47000 to 47999\47212 Oldham Retail & Leisure Study\4501 Planning\Reps-Tech Notes\Final Report\Appendices\Appendix H - Potential
Access Pedestrian and tram access via Union Street. vehicle access via Ascroft Street.
Overall Development Prospects Good.
J:\47000 to 47999\47212 Oldham Retail & Leisure Study\4501 Planning\Reps-Tech Notes\Final Report\Appendices\Appendix H - Potential
Shaw District Centre
64-66 Market Street
Evaluation Criteria Comment Site Size Approximately 270 sq. m.
Current Use Retail with associated office use.
Sequential Status In centre.
Availability The property is currently for sale and is being actively marketed by Fleurets.
Potential Uses The building could be repurposed into an office use. However, this is dependent on the demand for office space within Shaw.
There is also the potential for the site to be cleared and redeveloped to support a residential use.
Scale of Development Small scale up to 270 sq. m.
Development Constraints No known constraints, cost of site remediation / conversion of building.
Access Pedestrian and vehicle access from Market Street.
Overall Development Prospects Good.
J:\47000 to 47999\47212 Oldham Retail & Leisure Study\4501 Planning\Reps-Tech Notes\Final Report\Appendices\Appendix H - Potential
Legends, Rochdale Road
Evaluation Criteria Comment Site Size Approximately 180 sq. m.
Current Use Vacant Public House.
Sequential Status In centre.
Availability We are unaware of the availability of the site.
Potential Uses The building could be repurposed into either a small-scale leisure facility or food and drink establishment.
Scale of Development Small-scale up to 180 sq. m.
Development Constraints The cost of converting the building could be high. It is also unclear whether there is demand for leisure or further food and drink facilities in Shaw.
Access Pedestrian and vehicle access from Beal Lane.
Overall Development Prospects Good.
J:\47000 to 47999\47212 Oldham Retail & Leisure Study\4501 Planning\Reps-Tech Notes\Final Report\Appendices\Appendix H - Potential
Royton District Centre
Vernon Works
Evaluation Criteria Comment Site Size Approximately 32,000 sq. m.
Current Use General Industrial.
Sequential Status Edge-of-centre.
Availability For sale and being actively marketed by Davies Harrison.
Potential Uses The building could be converted to provide office space or residential accommodation, including specialist forms of accommodation. The site could also be cleared, and a new residential / office mixed-use development could be constructed.
We would advise against retail development on this site as it is an edge-of-centre location and would likely compete directly with Royton District Centre, as there are no clear linkages between the district centre and the site.
Scale of Development Large scale.
J:\47000 to 47999\47212 Oldham Retail & Leisure Study\4501 Planning\Reps-Tech Notes\Final Report\Appendices\Appendix H - Potential
Development Constraints The site is located within an employment area with the Local Plan, as such employment space is protected. The cost of converting or remediating the site are likely to be high.
Access Pedestrian and vehicle access from High Barn Street.
Overall Development Prospects Ok.
J:\47000 to 47999\47212 Oldham Retail & Leisure Study\4501 Planning\Reps-Tech Notes\Final Report\Appendices\Appendix H - Potential
Former Lloyd TSB, Market Square
Evaluation Criteria Comment Site Size Approximately 140 sq. m.
Current Use Financial services.
Sequential Status In centre.
Availability Available to let, actively marketed by Breakey and Nuttall.
Potential Uses The building could be converted into a retail use and potentially be leased to successful market traders. The building could also be converted into a food a drink use to complement existing uses.
Scale of Development Small scale up to 140 sq. m.
Development Constraints No known constraints, demand for further food and drink establishments unknown.
Access Pedestrian access via Market Square. As Market Square is pedestrianised the unit can only be serviced from Spring Gardens.
Overall Development Prospects Good.
J:\47000 to 47999\47212 Oldham Retail & Leisure Study\4501 Planning\Reps-Tech Notes\Final Report\Appendices\Appendix H - Potential
Lees District Centre
89 High Street
Evaluation Criteria Comment Site Size Approximately 275 sq. m.
Current Use Vacant public house.
Sequential Status In centre.
Availability Unit for sale and being actively marketed by Fleurets.
Potential Uses The unit could be converted into retail with residential above or wholly converted into residential.
Scale of Development Small scale – maximum 275 sq. m.
Development Constraints The site is located wholly within a Conservation Area. Consideration will have to be given to the Conservation Area designation if the site is redeveloped.
Access Pedestrian access via High Street and Benyon Street. The unit is serviced by Benyon Street.
Overall Development Prospects Good.
J:\47000 to 47999\47212 Oldham Retail & Leisure Study\4501 Planning\Reps-Tech Notes\Final Report\Appendices\Appendix H - Potential