Page 1
Article
Oligodendroglial NMDA Re
ceptors Regulate GlucoseImport and Axonal Energy Metabolism
Highlights
d Oligodendroglial NMDA receptors regulate GLUT1 trafficking
and glucose import
d Mouse mutants lacking NMDA receptors from
oligodendrocytes are delayed in myelination
d Activation of oligodendroglial NMDA receptor supports the
axonal energy metabolism
d Mice lacking oligodendroglial NMDA receptors develop late-
onset axonopathy and neuroinflammation
Saab et al., 2016, Neuron 91, 119–132July 6, 2016 ª 2016 Elsevier Inc.http://dx.doi.org/10.1016/j.neuron.2016.05.016
Authors
Aiman S. Saab, Iva D. Tzvetavona,
Andrea Trevisiol, ...,
Johannes Hirrlinger, Frank Kirchhoff,
Klaus-Armin Nave
[email protected] (F.K.),[email protected] (K.-A.N.)
In Brief
Saab et al. identify a novel feature of
axonal metabolic support. Activation of
oligodendroglial NMDA receptors
stimulates GLUT1 export and release of
lactate. Targeted inactivation of
oligodendroglial NMDA receptors in vivo
impairs axonal energy metabolism and
causes late-onset axonopathy.
Page 2
Neuron
Article
Oligodendroglial NMDA Receptors RegulateGlucose Import and Axonal Energy MetabolismAiman S. Saab,1,2,3 Iva D. Tzvetavona,1 Andrea Trevisiol,1 Selva Baltan,4 PayamDibaj,1 Kathrin Kusch,1WiebkeMobius,1,5
Bianka Goetze,6 Hannah M. Jahn,1,2 Wenhui Huang,1,2 Heinz Steffens,7,8 Eike D. Schomburg,7 Alberto Perez-Samartın,9
Fernando Perez-Cerda,9 Davood Bakhtiari,5,10 Carlos Matute,9 Siegrid Lowel,6 Christian Griesinger,5,10
Johannes Hirrlinger,1,11 Frank Kirchhoff,1,2,5,* and Klaus-Armin Nave1,5,*1Max Planck Institute of Experimental Medicine, Department of Neurogenetics, Gottingen 37075, Germany2Center for Integrative Physiology and Molecular Medicine, Molecular Physiology, University of Saarland, Homburg 66421, Germany3University of Zurich, Institute of Pharmacology and Toxicology, 8057 Zurich, Switzerland4Lerner Research Institute, Cleveland Clinic, Department of Neurosciences, Cleveland, OH 44195, USA5Center Nanoscale Microscopy and Molecular Physiology of the Brain (CNMPB), 37073 Gottingen, Germany6Bernstein Focus for Neurotechnology (BFNT) and School of Biology, Department of Systems Neuroscience, University of Gottingen,
37075 Gottingen, Germany7Institute of Physiology, University of Gottingen, 37073 Gottingen, Germany8Max Planck Institute for Biophysical Chemistry, Department of NanoBiophotonics, 37077 Gottingen, Germany9Universidad del Paıs Vasco, CIBERNED and Departamento de Neurociencias and Achucarro Basque Center for Neuroscience, Leioa 48940,
Spain10Department of NMR Based Structural Biology, Max Planck Institute for Biophysical Chemistry, 37077 Gottingen, Germany11Carl-Ludwig-Institute for Physiology, Faculty of Medicine, University of Leipzig, 04103 Leipzig, Germany
*Correspondence: [email protected] (F.K.), [email protected] (K.-A.N.)
http://dx.doi.org/10.1016/j.neuron.2016.05.016
SUMMARY
Oligodendrocytes make myelin and support axonsmetabolically with lactate. However, it is unknownhow glucose utilization and glycolysis are adapted tothe different axonal energy demands. Spiking axonsrelease glutamate and oligodendrocytes expressNMDA receptors of unknown function. Here we showthat the stimulation of oligodendroglial NMDA recep-tors mobilizes glucose transporter GLUT1, leading toits incorporation into the myelin compartment in vivo.Whenmyelinatedoptic nerves fromconditionalNMDAreceptor mutants are challenged with transient oxy-gen-glucose deprivation, they show a reduced func-tional recovery when returned to oxygen-glucose butare indistinguishable from wild-type when providedwith oxygen-lactate.Moreover, the functional integrityof isolated optic nerves, which are electrically silent, isextended by preincubation with NMDA, mimickingaxonal activity, and shortened by NMDA receptorblockers. This reveals a novel aspect of neuronalenergymetabolism inwhich activity-dependent gluta-mate release enhances oligodendroglial glucose up-take and glycolytic support of fast spiking axons.
INTRODUCTION
Oligodendrocytes, best known for making myelin (Emery, 2010;
Nave and Werner, 2014), also support the survival of myelinated
axons (Griffiths et al., 1998; Kassmann et al., 2007; Lappe-Siefke
et al., 2003). Myelin is assembled as a spiral extension of oligo-
dendroglial cell membrane, which requires vesicular transport
of membrane material through non-compacted cytosolic chan-
nels to the growing tip (Snaidero et al., 2014). In mature myelin,
a system of nanometer-wide ‘‘myelinic channels’’ is left behind,
the dynamics and dimensions of which were only appreciated
with the application of high-pressure freezing (HPF) electron mi-
croscopy (Snaidero et al., 2014).
Recently, the identification of metabolic coupling between
oligodendrocytes and the axonal compartment, with glycolytic
oligodendrocytes providing lactate to axons for aerobic ATP pro-
duction (Funfschilling et al., 2012; Lee et al., 2012), has intro-
duced a new paradigm for the interaction of axons and their
associated glial cells. However, the concept of glycolytic support
by oligodendrocytes (Morrison et al., 2013; Saab et al., 2013) rai-
ses the question of how glucose utilization is quantitatively regu-
lated. Since the average spike count rate is the key determinant
of axonal ATP consumption, oligodendrocytes need to ‘‘know’’
the spiking activity of myelinated axons, which can differ greatly
in vivo (Barry, 2015; Perge et al., 2012). The constitutive overpro-
duction of lactate would result in lactic acidosis, detrimental
for white matter function. A plausible preventive mechanism
would be that oligodendrocytes ‘‘learn’’ their association with
fast spiking axons to adapt their own energy metabolism.
Like unmyelinated axons (Kukley et al., 2007;Wakeet al., 2011;
Ziskin et al., 2007) alsomyelinated axons release glutamate upon
spiking, which induces calcium elevations in myelin (Micu et al.,
2016). Oligodendrocytes could take trace amounts of glutamate
as a proxy for axonal spiking activity and energy needs. Indeed,
periaxonal spaces underneath myelin are narrow (<50 nm), and
glutamate could reach high local concentrations (Stys, 2011).
Oligodendrocytes express different glutamate receptors,
including NMDA receptors of unknown function (Karadottir et al.,
Neuron 91, 119–132, July 6, 2016 ª 2016 Elsevier Inc. 119
Page 3
Merge
Unt
reat
ed30
min
NM
DA
+ D
-AP
5
0
20
40
60
GLU
T1/ G
alC
are
a (%
)
UntreatedNMDA+ D-AP5
* **
Untr. NMDA Untr. NMDA
Total Biotinylated
MCT1
GLUT1
0
50
100
150
200
250
GLUT1 MCT1
UntreatedNMDA
surf
ace
prot
ein
(%) *
ns
BA
GFE
C D
BaselineNMDA/ Gly+ 7CKA/ D-AP5
-10 -5 0 5 10 15 20 25 30
NMDA/ Gly+ 7CKA/ D-AP5
time (min)
% F
RET
baseline stimulation
# F (251, 7109) = 1.96P < 0.0001
-20
0
20
40
#
10 mM Glc
+ CytB (40 μM)
wash10 mM Glc
+ IA (1 mM)
0 mM Glc
+ IA (1 mM)
H I
0.0
0.5
1.0
1.5
2.0
2.5
26-28 min stimulation
Glu
cose
(mM
) ******
UntreatedNMDA/ Gly+ 7CKA/ D-AP5
020406080
100120140
2DG
upt
ake
(%)
***1H [ppm] 1.28 1.32 1.36
Lactate (CH3)
J
UntreatedNMDA/ Gly
Lact
ate
rele
ased
(%)K
UntreatedNMDA/ Gly
1.52.02.53.03.54.01H [ppm]
13C
[ppm
]
1.36 1.32 1.28
1.36 1.32 1.28
15
60
30
45
75
15
60
30
45
75
13C
[ppm
]
1.52.02.53.03.54.0
22.2
22.7
23.2
22.2
22.7
23.2
NMR spectroscopy
Untreated
NMDA/ Gly
Lactate (CH3)
Lactate (CH3)
Lactate (CH)
Lactate (CH)
020406080
100120140 *
0 5 10 15 20 25 30
stimulation +2DG
[min]
10 min
20 %
FRE
T
Glc
-Sen
sor
MB
PGLUT1 GalC
Mer
ge
(legend on next page)
120 Neuron 91, 119–132, July 6, 2016
Page 4
2005;Micuet al., 2006;Salter and Fern, 2005). A role for NMDA re-
ceptor signaling in oligodendrocyte differentiation and promoting
myelinationhasbeensuggested, basedon in vitroobservations (Li
et al., 2013; Lundgaard et al., 2013), which is compatible with
neuronal activity stimulating OPC proliferation and myelination
in vivo (Gibson et al., 2014; Liu et al., 2012). Recently, axonal
activity was shown to induce NMDA receptor-mediated calcium
increases in myelin, indicating that adult oligodendrocytes have
functional NMDA receptors (Micu et al., 2016). However, condi-
tional mouse mutants lacking this receptor from OPC reveal no
major abnormality (De Biase et al., 2011; Guo et al., 2012).
NR1 is the obligate subunit of tetrameric NMDA receptors, and
expression of its gene (Grin1) is higher in OPC than in mature ol-
igodendrocytes (Zhang et al., 2014) but remains detectable
throughout adult life (this study). Here, we tested the hypothesis
that NMDA receptor signaling to oligodendrocytes is the missing
link in coupling axonal activity and ATP consumption to oligo-
dendroglial glucose utilization and lactate supply.
RESULTS
NMDA Receptor Activation Triggers GLUT1 SurfaceExpression and Enhances Glucose Import in CulturedOligodendrocytesOligodendroglial GLUT1 was localized to intracellular compart-
ments and primary processes (but only weakly to secondary
and tertiary processes) and immature myelin membranes (Fig-
ure 1A, top). Cultured neurons mobilize glucose transporter
GLUT3 in response to glutamate (Ferreira et al., 2011). We there-
fore asked whether GLUT1, the predominant transporter of oli-
godendrocytes and astrocytes (Zhang et al., 2014), behaves
similarly.
Remarkably, treatment with NMDA triggered GLUT1 redistri-
bution inoligodendrocyteswithin 30min, leading toapparent sur-
face expression (Figure 1A, middle) that was efficiently blocked
by D-(-)-2-amino-5-phosphonopentanoic acid (D-AP5) (Figures
Figure 1. NMDA Stimulates GLUT1 Surface Expression and Glucose U
(A) Oligodendrocyte immunostained for GLUT1 and GalC. NMDA receptor stim
blocked by D-AP5. Scale bar, 20 mm.
(B) GLUT1 and MCT1 immunoblots following cell surface biotinylation of immuno
(C) Quantification of the experiments giving the ratio of GLUT1:GalC in a stained ar
way ANOVA with Bonferroni’s multiple comparisons test).
(D) Quantification of the experiments in (B), normalizing biotinylated to total prote
(E) FRET imaging of oligodendrocytes expressing a glucose sensor (Takanaga
baseline FRET signals, n = 4) drop with addition of cytochalasin B (CytB, glucose
that intracellular glucose is rapidly phosphorylated and undetectable.
Inset: oligodendrocyte transfected with the glucose sensor and counterstained fo
Scale bar, 20 mm.
(F) NMDA receptor stimulation (by applying 100 mM NMDA and glycine) increa
(Finteraction(251, 7,109) = 1.96, p < 0.0001, two-way ANOVA).
(G) Quantification of calibrated FRET signals of NMDA-stimulated oligodendrocyt
(***p < 0.001, one way ANOVA with Bonferroni’s multiple comparisons test).
(H) Immunopanned oligodendrocytes stimulated with NMDA/Gly (25 min) before
blocked by 7CKA and D-AP5 (n = 5 experiments, *p < 0.05, **p < 0.01; paired t t
(I) 13C, 1H-HSQC spectra at 700 MHz corresponding to proton resonance from the
NMDA/Gly (top) and controls (bottom). Boxed: lactate signals. Quantification
standard DSS.
(J) Increased lactate following NMDA/Gly treatment, depicted by overlaying the
(K) Lactate release after NMDA receptor stimulation increased to 124% ± 4% (n
1A, bottom, and 1C). In contrast, monocarboxylate transporter
MCT1 distribution was unaffected by NMDA (Figures S1A and
S1B). To confirm that NMDA promotes membrane insertion of
GLUT1, we performed biotinylation assays with immunopanned
oligodendrocytes (Figure 1B), revealing a 2-fold GLUT1 increase
at the cell surface following 30minNMDA stimulation (Figure 1D),
whereas the abundance of MCT1 was the same. To determine
functional GLUT1 insertion, we expressed a glucose sensor (Ta-
kanaga et al., 2008) in transfected oligodendrocytes (Figure 1E).
Activation of NMDA receptors caused a significantly increased
FRET signal that was abolished by 7-CKA and D-AP5, which
block both the glycinergic and glutamatergic NMDA receptor
binding sites, respectively (Figure 1F). Calibration of the FRET
sensor allowed the measurement of cytosolic glucose in oligo-
dendrocytes, i.e., 0.56 ± 0.04 mM at baseline and 1.85 ±
0.24 mM following NMDA receptor stimulation (Figure 1G).
Finally, we used immunopanned oligodendrocytes and quanti-
fied the uptake of 2-deoxyglucose (2DG) to confirm that NMDA
elevates glucose import (Figure 1H). In these experiments,
elevated glucose was not caused by inhibition of glycolysis
because the release of lactate was simultaneously enhanced.
By NMR spectroscopy, we calculated a 24% ± 4% increase of
U-13C-lactate release originating from U-13C6-labeled glucose
(Figures 1I–1K). As expected, lactate release from cultured oligo-
dendrocytes relies on glucose availability (Figures S1C andS1D).
However, NMDA-stimulated lactate release was unexpected
(Figures 1I–1K and S1E) because basic metabolic demands did
not change, and there were no signs of oligodendrocyte death
(Figure S1F). Most likely, membrane repolarization (triggered by
NMDA receptor signaling and ion influx) consumes the additional
ATP and leads to more glycolysis with lactate release.
Myelination In Vivo in the Absence of OligodendroglialNMDA ReceptorsGlucose is amajor carbon source for lipid precursor metabolites,
which are rate-limiting for myelination (Rinholm et al., 2011).
ptake by Cultured Oligodendrocytes
ulation mobilizes GLUT1 and increases its cell surface expression, which is
panned NMDA-treated oligodendrocytes and controls.
ea of n = 3 experiments and 20–24 cells per condition (*p < 0.05, **p < 0.01 one-
in (p = 0.03, n = 3; paired t test). MCT1 surface expression is unchanged.
et al., 2008) (FLII12Pglu-700mD6). Intracellular glucose levels (normalized to
transporter blocker) or increase with iodoacetate (IA, glycolysis inhibitor). Note
r MBP. Note that the sensor is mainly located in the soma and main processes.
ses FRET signals that can be blocked by the addition of 7CKA and D-AP5
es (26–28 min), compared to baseline and cells also receiving 7CKA and D-AP5
switching to 2-deoxyglucose (2DG, 10 mM, 5 min). Increased 2DG uptake was
est).
culture medium of immunopanned oligodendrocytes 30 min after exposure to
by comparison of the peak volume of lactate methyl group to the internal
1D-1H slices of spectra in the lactate methyl signal range.
= 4 paired NMR experiments, p = 0.023 paired t test).
Neuron 91, 119–132, July 6, 2016 121
Page 5
Con
trol
A
D
B
ControlNR1 cKO
Control NR1 cKOMyelin Lysate
GLUT1
1 2 3 4 5 6 3 6
Sirt2
7055
35
kd
35
NR
1
x C
np1
fl/fl
Cre
/+
NR1 NR1 NR1 MBP
NR
1 si
gnal
inte
nsity
(%)
*
0
20
40
60
80
100
120
GLU
T1 m
yelin
pro
tein
(%)
0
20
40
60
80
100
120 **
GLU
T1 g
old
part
icle
s /
mye
linat
ed a
xons
(%)
0
20
40
60
80
100
120 **
ControlNR1 cKO
ControlNR1 cKO
G
E
37
10075
kd
Control NR1 cKO
NR1
GAPDH
0
20
40
60
80
100
120
NR
1 fl/
fl co
pies
(%)
P5 P10 P16 P96
genomic DNAfrom optic nerves
******
ControlNR1 cKO
C
P75
NR
1 pr
otei
n (%
)**
0
20
40
60
80
100
120
P80
lysate from optic nerves
F
200 nm
GLUT1 localization
axon
axon
●
●
paranodalloops
●
●
myelin outer tongue
●
outer tongue
●
outer tongue
H
axon axon
NR1 cKOControl
I MCT1 localization
●
outer tongue
●
innertongue
●
outer tongue
●
innertongue
(legend on next page)
122 Neuron 91, 119–132, July 6, 2016
Page 6
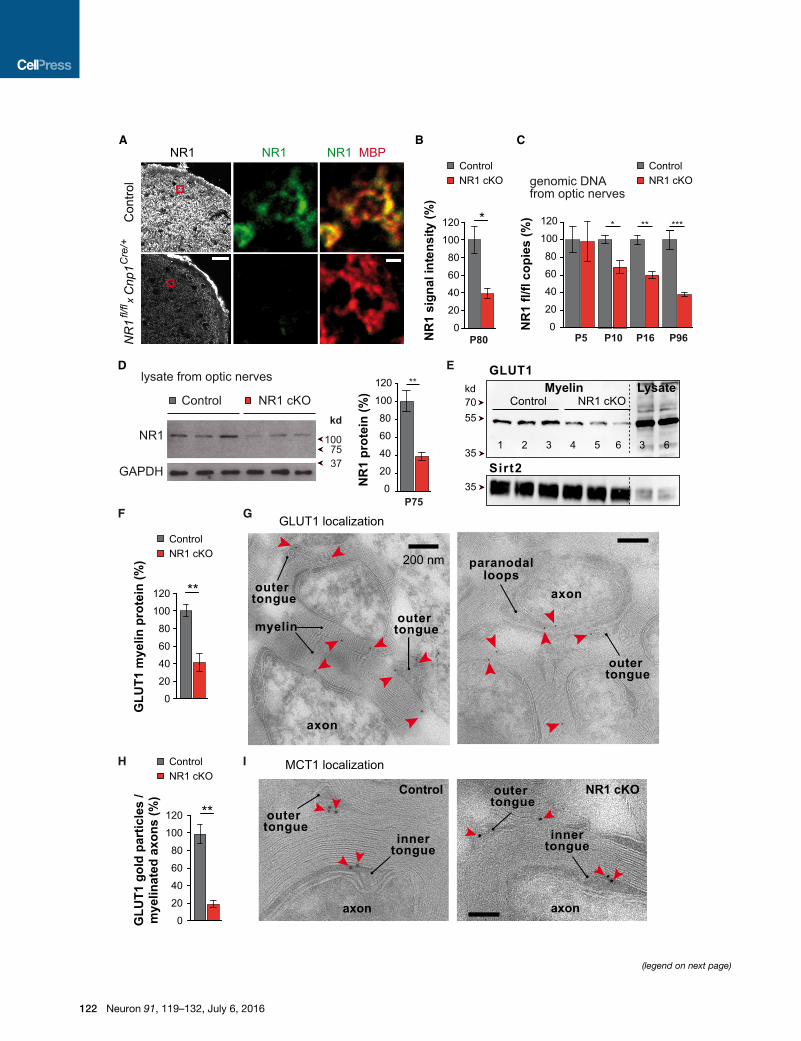
In vivo, reduced glutamate signaling might thus affect myelina-
tion during development. To study oligodendroglial NMDA re-
ceptor function, we crossed mice with a floxed NR1 allele (Tsien
et al., 1996) to Cnp1Cre/+ mice (Lappe-Siefke et al., 2003). NR1
(gene symbolGrin1) encodes the obligatory subunit of functional
NMDA receptors (Tsien et al., 1996).
In Grin1flox/flox*Cnp1Cre/+ mice (hereafter termed NR1 mutant
or cKO, withGrin1flox/flox*Cnp1+/+ andGrin1flox/+*Cnp1Cre/+ being
controls), NR1 was lost by immunostaining, as shown for optic
nerve (Figures 2A, 2B, and S2A), by qPCR of genomic DNA
and by western blot analysis (Figures 2C and 2D). Recombina-
tion analysis revealed that at P5, when the optic nerve is already
populated with oligodendroglial precursor cells (OPCs), loss of
the floxed allele was not yet significant. However, at P10, when
many oligodendrocytes had matured and express Cnp1, about
one-third of the floxed alleles were excised, and recombination
reached 62% ± 8% at P96, when myelination is completed,
matching the expected proportion of oligodendrocyte in adult
optic nerves (Miller et al., 1985). Cre-mediated reporter expres-
sion in optic nerves demonstrated that virtually all recombined
cells were of oligodendroglial origin (Figures S2B and S2C).
NR1 expression in astrocytes and OPCs could account for the
remaining 40% NR1 signal of whole optic nerve immunostain-
ings (Figure 2B) or protein lysates (Figure 2D).
In purified myelin from mutant brains, we found a strong
reduction of GLUT1 (but not MCT1) compared to controls (Fig-
ures 2E, 2F, S1G, and S1H), whereas total tissue GLUT1 was
unchanged in NR1 mutants. By immunogold labeling of mature
optic nerves, GLUT1 was localized in the myelin sheath, in the
outer tongue, and in the paranodal loops (Figure 2G), well posi-
tioned for functional glucose uptake into the system of myelinic
channels.
GLUT1 abundance in myelin sheaths of optic nerve axons was
reduced by 80% in NR1mutants compared to littermate controls
(Figures 2H), in line with its NR1-dependent mobilization in
cultured oligodendrocytes.
GLUT1 mRNA is more abundant in mature oligodendrocytes
than in precursor cells (Zhang et al., 2014). FromCNSwhite mat-
ter samples, we amplified equal amounts of GLUT1 and MCT1
cDNA when comparing mutants and controls, indicating that
NMDA receptor signaling does not regulate GLUT1 at the level
Figure 2. Oligodendroglial NMDA Receptor Mutants with Reduced GL
(A) Immunostaining of NR1 in optic nerve cross sections at age P80 from control
reveal that NR1 (green) is absent from mutants and overlaps with MBP (red) in c
(B) Quantitation of NR1 staining intensity from whole optic nerve sections (n = 3;
(C) Cre-mediated recombination of genomic DNA in individual optic nerves of ea
floxed NR1 allele after recombination (normalized to the abundance in NR1fl/fl litte
abundance of NR1 flox copies was determined at ages P5 (98% ± 22% flox copie
age P16 (60% ± 4%; n = 4 versus 3, p = 0.0024), and P96 (38% ± 2%; n = 4 ver
(D) Western blot analysis of NR1 expression in individual nerves from mutant and
NR1 cKO nerves (n = 3, p = 0.0079). GAPDH, loading control.
(E) By western blotting, GLUT1 is reduced in purified myelin of NR1 mutants (Sir
(F) Quantification of E (n = 3; p = 0.008, Student’s t test).
(G) Localization of GLUT1 by immunogold labeling. In optic nerve cross sections,
Scale bar, 200 nm. Gold particles, red arrows.
(H) Reduced abundance of immunogold labeled GLUT1 in myelin of NR1 muta
images per animal, n = 3; p = 0.0025, Student’s t test).
(I) By immunogold labeling, MCT1 is associated with adaxonal (outer tongue) and
and controls. Scale bar, 100 nm.
of gene expression (Figure S1I). Interestingly, we localized
MCT1 by immuno-electron microscopy at both the outer and in-
ner tongue of myelin (Figure 2I). Thus, lactate transporters are
strategically positioned for taking up and supplying glycolysis
products (Funfschilling et al., 2012; Lee et al., 2012).
Phenotypically, mutant mice were normally developed with
functional white matter tracts, as shown for the optic nerve (Fig-
ure S3), and are long-lived. This suggests that NMDA receptors
are not essential for myelination per se, in agreement with earlier
reports (De Biase et al., 2011; Guo et al., 2012). However, the
paucity of GLUT1 in myelin (Figures 2E, 2F, and 2H) suggested
reduced glucose import, which could affect the rate of myelin
growth that is metabolically controlled (Rinholm et al., 2011). In
the rodent optic nerve, the highest myelination rate occurs dur-
ing the third postnatal week (Hildebrand and Waxman, 1984)
and predicts the highest demands for glucose as a carbon
source for lipid synthesis at this time. Indeed, by EM we noted
at ages P18–P20 that myelin was thinner, with fewer myelinated
axons in the mutant optic nerves (Figures 3B and 3D–3G). This
difference was only transient as adult (P70) NR1 mutant optic
nerves ‘‘catch up’’ and exhibit a normal myelin sheath thickness
(Figures 3C, 3H, and 3I).
Functional Analysis of Myelinated AxonsTo study function, we assessed optic nerve conduction at
different stages of development by recording compound action
potentials (CAPs) ex vivo, comparing NR1 mutant and controls
(Figure S4). CAP profiles revealed a transiently reduced con-
duction velocity, again only at the peak of myelination (age
P19–P21) and mainly affecting small caliber axons (Figures
S4D–S4F). These are best explained by the delay of CNS mye-
lination (Figures 3D–3I), as nerve caliber and axon numbers
were normal (Figures S4J and S4K). The developmental delay
of myelination in NR1 mutant optic nerves fits well the unex-
plained observation that demyelinating lesions repair less well
when NMDA receptors are blocked (Li et al., 2013; Lundgaard
et al., 2013).
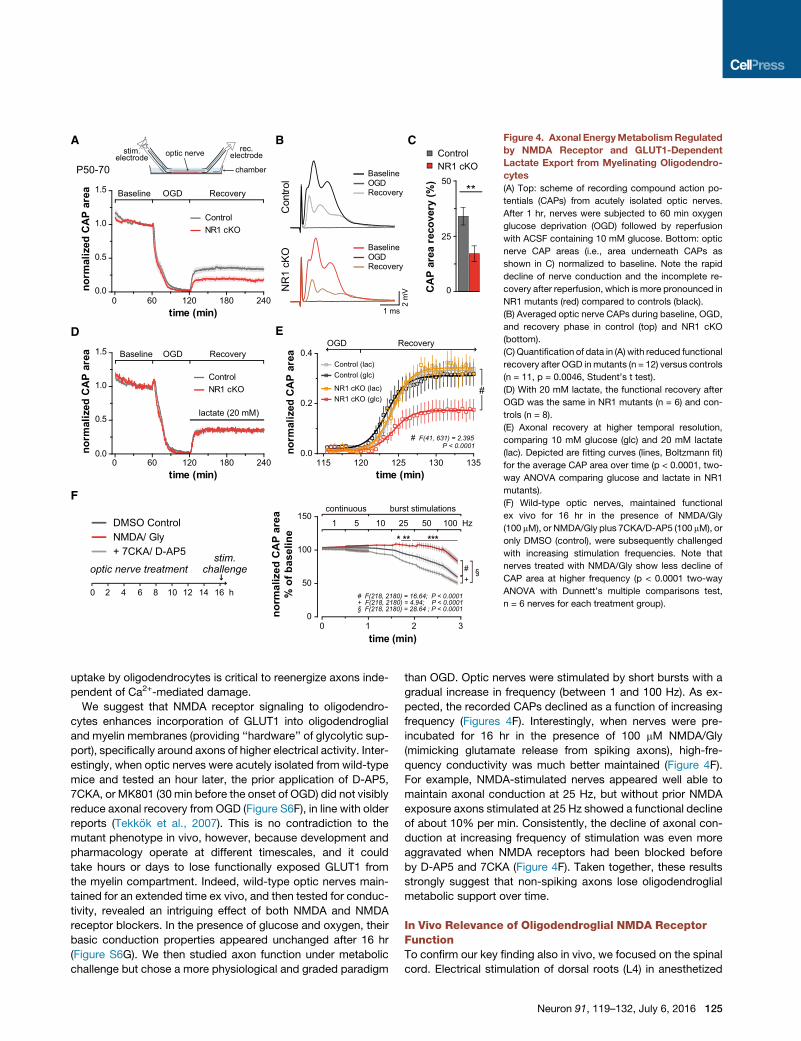
Next, we examined myelinated optic nerves under metabolic
stress for their ability to recover from transient oxygen-glucose
deprivation (OGD), a well-established model of acute ischemia
(Tekkok et al., 2007). Optic nerves were acutely isolated
UT1 Incorporation into Myelin
and NR1 cKO mice (left panel). Higher magnifications (middle and right panels)
ontrol mice. Scale bars, 20 mm (left) and 1 mm. See also Figure S2A.
p = 0.019, Student’s t test).
ch genotype as quantified by qPCR. Depicted is the relative abundance of the
rmate controls, defined as 100% at different ages). In NR1 mutant nerves, the
s remaining; n = 5 versus 4, p = 0.939), age P10 (69% ± 7%; n = 4, p = 0.0119),
sus 9, p < 0.0001).
control mice at age P75. Quantification revealed a reduction by 61% ± 12% in
t2, loading control).
GLUT1 was detected in myelin sheaths, the outer tongue, and paranodal loops.
nt optic nerves when compared to littermate controls (10–12 randomly taken
abaxonal (inner tongue) myelinic channels, without difference betweenmutants
Neuron 91, 119–132, July 6, 2016 123
Page 7
E
0.0 0.5 1.0 1.5 2.00
10
20
30
abun
danc
e (%
)
0.0 0.5 1.0 1.5 2.00
10
20
30
myelinated axons (μm)
abun
danc
e (%
)
H
0.60 0.68 0.76 0.84 0.920
50
100
0
50
100
g-ratio0.60 0.68 0.76 0.84 0.92
cum
ulat
ive
(%)
F
I
cum
ulat
ive
(%)
P18
P70
ControlNR1 cKO
F(20, 84) = 7.59P < 0.0001
F(44,180) = 1.66P = 0.012
0.75
0.80
0.85
axon size (μm)
g-ra
tio
0.4 - 0.8 0.8 - 1
.2
*** ***
ControlNR1 cKO
ControlNR1 cKO
***
**
ControlNR1 cKO
P70
myelinated axons (μm) g-ratio
P18D
M
EU
M
EU
Con
trol
NR
1 cK
O
P18 P70
ControlNR1 cKO
G
0
20
40
60
axon
s (%
)
U E M
n.s.
*n.s.
P18
Con
trol
NR
1 cK
O
P10A P20 P70CB
Con
trol
NR
1 cK
O
Con
trol
NR
1 cK
O
Figure 3. Myelination in the Absence of Oligo-
dendroglial NMDA Receptors In Vivo
(A–C) High-pressure freezing (HPF) electron micro-
scopy of the developing optic nerve.
Overview of optic nerve cross sections from control
and NR1 mutant mice at P10 (A), P20 (B), and P70
(C). At early and late stages, NR1 mutant nerves are
indistinguishable from controls. A minor hypomyeli-
nation is apparent at P20. Scale bars, 0.5 mm (A and B)
and 0.2 mm (C).
(D) Electron microscopy of conventionally fixed optic
nerves from mutant and controls, with unmyelinated
(U), ensheathed (E), and myelinated (M) axons. Scale
bar, 1 mm.
(E–I) Axon size distribution and myelin sheath thick-
ness (g-ratio) at P18 and P70.
(E) Diameter spectrum of myelinated axons with
relatively more myelinated small caliber axons in
control nerves than in NR1 cKO at P18 (***p < 0.001,
two-way ANOVA, Bonferroni’s post-test).
(F) Cumulative frequency of g-ratios (low to high)
measured for individual optic nerves of each geno-
type. Note the significant shift to higher g-ratios in P18
NR1 mutants (inset: means ± SEM of all g-ratios for
two axon size groups).
(G) At P18, myelinated (M) axons are transiently
reduced in mutant optic nerves, unlike the number of
unmyelinated (U) and merely ensheathed (E) axons
(400–700 axons counted per nerve; n = 3, p = 0.048).
(H and I) Axon size distribution (H) and optic nerve
g-ratios (I) are similar in mutants and controls.
and CAPs were recorded ex vivo (Figure 4A, top). In these exper-
iments, all optic nerves maintained conductivity (defined as
‘‘CAP area’’ of 1.0) and, within minutes after OGD onset, dis-
played block of nerve conduction, as illustrated by the rapid
decline of CAP area (Figures 4A and 4B). When re-perfused
60 min later using oxygenated artificial cerebrospinal fluid
(ACSF, 10 mM glucose), we determined some persistent loss
of conduction in wild-type nerves, a Ca2+-dependent damage
to axons (Tekkok et al., 2007). Surprisingly, in NR1mutant nerves
the recovery of axon function was further reduced by 50% (Fig-
ures 4C). NMDA-receptor-mediated excitotoxicity in oligoden-
drocytes (Karadottir et al., 2005; Micu et al., 2006; Salter and
Fern, 2005) may not be the main mechanism causing myelin
damage (Hamilton et al., 2016). Indeed, ultrastructural damage
following OGD alone, such as myelin delamination, was the
same in NR1 mutants and controls (Figure S5A). Thus, further
loss of axonal conductivity was not caused by more severe
myelin injury, but rather by less-efficient axonal recovery from
the metabolic stress of OGD. Importantly, axonal recovery after
OGD was normal prior to age P10 (Figure S6A), suggesting that
axons require oligodendroglial support mostly after myelination,
which limits rapid axonal access to extracellular metabolites
(Nave, 2010).
124 Neuron 91, 119–132, July 6, 2016
Causality of NMDAReceptor Signalingand Glucose Metabolism in AxonalSupportTo demonstrate causality between oligo-
dendroglial glucose metabolism and axonal
recovery, we asked whether lactate, permeating through MCT1
(Figures 2I), can replace glucose as an energy source and restore
conduction independent of prior NMDA receptor signaling. As
predicted, using lactate-containing ACSF for reperfusion, optic
nerves from NR1 mutants recovered as well as control nerves
and even better than in the presence of glucose (Figures 4D
and 4E). This confirms that axons readily use lactate for ATP
generation (Funfschilling et al., 2012; Lee et al., 2012; Tekkok
et al., 2005; Wyss et al., 2011). More importantly, it also proves
that optic nerves in NR1mutants are not per semore susceptible
to axonal injury. We confirmed this experimentally with MOG-
induced experimental allergic encephalomyelitis (EAE), associ-
ated with secondary axonal dysfunction. Here, we found no
difference in the onset of EAE symptoms or in clinical severity
(Figures S5B–S5D), as indicated earlier (Guo et al., 2012; Matute,
2010).
During OGD, abnormal Ca2+ entry into the axonal compart-
ment triggers axon loss probably resulting from excessive gluta-
mate signaling caused by reversal of glutamate transporters
(Stirling and Stys, 2010; Tekkok et al., 2007). Indeed, in the
absence of free extracellular Ca2+, the axonal recovery was
almost 100% in control nerves yet remained significantly
impaired in NR1 mutants (Figures S6E and S6F). Thus, glucose
Page 8
A
0 60 120 180 2400.0
0.5
1.0
1.5
time (min)
norm
aliz
ed C
AP
area
ControlNR1 cKO
BaselineOGDRecovery
Con
trol
BaselineOGDRecovery
2 m
V
1 ms
NR
1 cK
O
OGDBaseline Recovery
optic nerve
chamber
stim.electrode
rec.electrode
P50-70
CB
D E
0 60 120 180 2400.0
0.5
1.0
1.5
time (min)
norm
aliz
ed C
AP
area
Control NR1 cKO
lactate (20 mM)
OGDBaseline RecoveryControl (lac) Control (glc)
NR1 cKO (glc)NR1 cKO (lac)
OGD Recovery
50
25
0CA
P ar
ea r
ecov
ery
(%)
ControlNR1 cKO
**
115 120 125 130 1350.0
0.2
0.4
time (min)
norm
aliz
ed C
AP
area
# F(41, 631) = 2.395P < 0.0001
#
2 4 6 8 10 12 14 16 h0
optic nerve treatmentstim.
challenge
DMSO ControlNMDA/ Gly+ 7CKA/ D-AP5
F
0 1 2 30
50
100
150
time (min)
norm
aliz
ed C
AP
area
% o
f bas
elin
e
1 5 10 25 50 100 Hz
burst stimulationscontinuous
#+
§
# F(218, 2180) = 16.64; P < 0.0001+ F(218, 2180) = 4.94; P < 0.0001§ F(218, 2180) = 28.64 ; P < 0.0001
* ** ***
Figure 4. Axonal EnergyMetabolismRegulated
by NMDA Receptor and GLUT1-Dependent
Lactate Export from Myelinating Oligodendro-
cytes
(A) Top: scheme of recording compound action po-
tentials (CAPs) from acutely isolated optic nerves.
After 1 hr, nerves were subjected to 60 min oxygen
glucose deprivation (OGD) followed by reperfusion
with ACSF containing 10 mM glucose. Bottom: optic
nerve CAP areas (i.e., area underneath CAPs as
shown in C) normalized to baseline. Note the rapid
decline of nerve conduction and the incomplete re-
covery after reperfusion, which is more pronounced in
NR1 mutants (red) compared to controls (black).
(B) Averaged optic nerve CAPs during baseline, OGD,
and recovery phase in control (top) and NR1 cKO
(bottom).
(C) Quantification of data in (A) with reduced functional
recovery after OGD inmutants (n = 12) versus controls
(n = 11, p = 0.0046, Student’s t test).
(D) With 20 mM lactate, the functional recovery after
OGD was the same in NR1 mutants (n = 6) and con-
trols (n = 8).
(E) Axonal recovery at higher temporal resolution,
comparing 10 mM glucose (glc) and 20 mM lactate
(lac). Depicted are fitting curves (lines, Boltzmann fit)
for the average CAP area over time (p < 0.0001, two-
way ANOVA comparing glucose and lactate in NR1
mutants).
(F) Wild-type optic nerves, maintained functional
ex vivo for 16 hr in the presence of NMDA/Gly
(100 mM), or NMDA/Gly plus 7CKA/D-AP5 (100 mM), or
only DMSO (control), were subsequently challenged
with increasing stimulation frequencies. Note that
nerves treated with NMDA/Gly show less decline of
CAP area at higher frequency (p < 0.0001 two-way
ANOVA with Dunnett’s multiple comparisons test,
n = 6 nerves for each treatment group).
uptake by oligodendrocytes is critical to reenergize axons inde-
pendent of Ca2+-mediated damage.
We suggest that NMDA receptor signaling to oligodendro-
cytes enhances incorporation of GLUT1 into oligodendroglial
and myelin membranes (providing ‘‘hardware’’ of glycolytic sup-
port), specifically around axons of higher electrical activity. Inter-
estingly, when optic nerves were acutely isolated from wild-type
mice and tested an hour later, the prior application of D-AP5,
7CKA, or MK801 (30 min before the onset of OGD) did not visibly
reduce axonal recovery from OGD (Figure S6F), in line with older
reports (Tekkok et al., 2007). This is no contradiction to the
mutant phenotype in vivo, however, because development and
pharmacology operate at different timescales, and it could
take hours or days to lose functionally exposed GLUT1 from
the myelin compartment. Indeed, wild-type optic nerves main-
tained for an extended time ex vivo, and then tested for conduc-
tivity, revealed an intriguing effect of both NMDA and NMDA
receptor blockers. In the presence of glucose and oxygen, their
basic conduction properties appeared unchanged after 16 hr
(Figure S6G). We then studied axon function under metabolic
challenge but chose a more physiological and graded paradigm
than OGD. Optic nerves were stimulated by short bursts with a
gradual increase in frequency (between 1 and 100 Hz). As ex-
pected, the recorded CAPs declined as a function of increasing
frequency (Figures 4F). Interestingly, when nerves were pre-
incubated for 16 hr in the presence of 100 mM NMDA/Gly
(mimicking glutamate release from spiking axons), high-fre-
quency conductivity was much better maintained (Figure 4F).
For example, NMDA-stimulated nerves appeared well able to
maintain axonal conduction at 25 Hz, but without prior NMDA
exposure axons stimulated at 25 Hz showed a functional decline
of about 10% per min. Consistently, the decline of axonal con-
duction at increasing frequency of stimulation was even more
aggravated when NMDA receptors had been blocked before
by D-AP5 and 7CKA (Figure 4F). Taken together, these results
strongly suggest that non-spiking axons lose oligodendroglial
metabolic support over time.
In Vivo Relevance of Oligodendroglial NMDA ReceptorFunctionTo confirm our key finding also in vivo, we focused on the spinal
cord. Electrical stimulation of dorsal roots (L4) in anesthetized
Neuron 91, 119–132, July 6, 2016 125
Page 9
spinal cord
StimulationL4 DR
RecordingL1
CBA
1 ms
1 mV
Control
NR1 cKO
0 1 2 3 4 5 60.0
0.5
1.0
stimulus intensity (V)
norm
. am
plitu
de
0 5 10 15 20 25 300.0
0.5
1.0
ControlNR1 cKO
time (min)0 5 10 15 20 25 30
0.0
0.5
1.0
Control NR1 cKO
time (min)
norm
. am
plitu
de
norm
. am
plitu
de
EDBaseline MFS Recovery0.1 Hz 10 Hz 0.1 Hz
Baseline HFS Recovery0.1 Hz 100 Hz 0.1 Hz
peak-to-peak ampl.
Control NR1 cKO
0.5
0.6
0.7
0.8
0.9
1.0
10 11 12
ControlNR1 cKO
0
1
2
3
4
5
Ʈ re
cove
ry (m
in) **
Figure 5. Requirement of Oligodendroglial
NMDA Receptors for High-Frequency Con-
duction
(A) Scheme of stimulating DRG axons of lumbar
segment L4 and recording from fasciculus gracilis at
L1 (inset: intact myelination of spinal cord in mutants
and controls, Gallya’s stain).
(B) Representative CAPs (averaged) in control (top)
and mutants at age 4–6 months. Dotted line: peak-
to-peak amplitude used to analyze firing strength
of fastest axon groups. Conduction delays were un-
changed.
(C) Normal axonal excitability in mutants measured
at increasing stimulus intensities with peak-to-peak
amplitude normalized to maximal readings.
(D) After 10 min at 0.1 Hz, stimulation frequency
increased to 10 Hz (medium frequency stimulation,
MFS), showing no difference between mutants (n = 6)
and controls (n = 3).
(E) 100 Hz (high frequency stimulation, HFS) caused a
decrease of firing strength (within seconds) that was
significantly faster and stronger in NR1mutants (n = 7)
than controls (n = 5). Left inset: higher temporal res-
olution for indicated region, Finteraction (119, 1,190) =
3.07, p < 0.0001, two-way ANOVA). Right inset:
slower recovery of CAPs at the end of HFS, monitored
at 0.1 Hz (t calculated from normalized exponential
fits, p = 0.0084, Student’s t test).
mice evoked stable CAPs that could be recorded from the dorsal
columns (L1) (Figure 5A). We detected no overt differences be-
tween NR1mutants and controls in spinal conduction properties
or axon excitability (Figures 5B and 5C), confirming the overall
integrity of myelinated tracts (Figures 5A, inset). Next, we moni-
tored CAP (peak-to-peak) amplitudes following challenges at
low (0.1 Hz), medium (10 Hz) and high frequency (100 Hz). At
low ormedium frequency (for 10min), we observed no difference
between mutants and controls (Figures 5D). However, upon
high-frequency stimulation, CAP amplitudes dropped signifi-
cantly faster in mutant mice (Figures 5E, inset left). When allowed
to recover at low frequency (0.1 Hz), CAPs inmutant spinal cords
recovered more slowly than in controls (Figures 5E, inset right).
Myelinated axons vary in length, diameter, and firing fre-
quencies, suggesting that their long-term energy demands differ
greatly (Perge et al., 2012). We anticipated that NR1mutant mice
with a developmentally reduced presence of GLUT1 in myelin
sheaths develop at least some signs of axonal pathology. We
therefore examined white matter integrity in different CNS re-
gions of adult NR1 mutants and controls, kept under normal
cage conditions (10–12months) andwithout specific challenges.
While most white and gray matter regions in mutant mice,
including optic nerves, appeared devoid of pathology within the
first year (data not shown), such changes became detectable in
white matter tracts of the medulla (Figures 6A and S7A). In longi-
tudinal sections, we observed an increased abundance of reac-
tive microglia and astrogliosis (Figures 6A–6D). Also in spinal
cord cross sections we occasionally noticed reactive microglia
in white matter tracts of the dorsal and lateral columns (Figures
S7B and S7C). By electron microscopy, we observed myelin
delamination and degenerating axons in cervical spinal cord sec-
tions (Figures 6Eand6F) thatwerenot a feature ofwild-typemice.
126 Neuron 91, 119–132, July 6, 2016
The majority of myelinated axons in cortico-spinal tracts fire at
a high frequency and comprise a high energy demanding white
matter tract (Perge et al., 2012). We therefore performed a mo-
tor-behavioral analysis to assess the function of spinal tracts in
adult NR1 mutant mice. Indeed, even on a simple rotarod test,
1 year old NR1 mutants revealed a significant deficit in perfor-
mance when compared to age-matched controls (Figure 6G).
At the age of 19 months, NR1 mutants exhibited a severe
neurological phenotype including hind limbclasping, hunchback,
and ataxia (Figure 6H) caused by ongoing neurodegeneration,
which became visible at 10 months. Signs of neuroinflammation
and axonopathywere seen in all CNSwhitematter tracts (Figures
6I–6L).
DISCUSSION
Oligodendroglial metabolic support can explain why myelinated
axons are vitally dependent on myelin integrity, independent of
the myelin function in saltatory conduction (Griffiths et al.,
1998; Kassmann et al., 2007; Lappe-Siefke et al., 2003). How-
ever, the question arises as to how glycolysis in oligodendro-
cytes is matched to different axonal energy needs and how
excessive lactate production is avoided. Our study yields a novel
working model in which oligodendrocytes regulate glucose utili-
zation by using NMDA receptor signals as a surrogate marker for
axonal spiking activity (Figure 7).
While NMDA receptors are widely studied in glutamatergic
neurotransmission, the role of NMDA receptors in oligodendro-
cytes has remained enigmatic (De Biase et al., 2011; Guo
et al., 2012; Karadottir et al., 2005; Li et al., 2013; Lipton, 2006;
Lundgaard et al., 2013; Micu et al., 2006; Pina-Crespo et al.,
2010; Salter and Fern, 2005; Yang et al., 2014). In myelin, NR1
Page 10
is associated with NR2C and NR3A subunits that provide a weak
Mg2+ block (Burzomato et al., 2010; Das et al., 1998), suggesting
that calcium entry does not require prior membrane depolariza-
tion. In development, NMDA receptors are most abundant in
oligodendrocyte precursors (De Biase et al., 2010; Zhang
et al., 2014). Unfortunately, the early functions of glutamate
signaling were not revealed by the deletion of NR1 in OPC (De
Biase et al., 2011; Guo et al., 2012). It is possible that calcium
permeable AMPA receptors compensate functions other than
GLUT1 trafficking, which is specifically regulated by NMDA re-
ceptor signaling. This is reminiscent of hippocampal LTP, which
also requires NMDA receptors and is not compensated by AMPA
receptors alone (Tsien et al., 1996).
Oligodendroglial NMDA receptors are localized in special-
ized microdomains of myelinating processes (Stirling and
Stys, 2010; Stys, 2011) and also face the periaxonal space
(Micu et al., 2006). Is NMDA receptor-dependent regula-
tion of GLUT1 in oligodendrocytes and the non-compacted
myelin compartment the same as GLUT4 regulation in other
cell types (Bogan and Kandror, 2010)? In adipocytes, insu-
lin-dependent GLUT4 trafficking requires calcium-depen-
dent myosin motors (Yip et al., 2008). We were unable to
mobilize GLUT1 with insulin in oligodendrocytes, but when
triggered with NMDA, trafficking was expectedly calcium
dependent and required a stable microtubule network (data
not shown).
With the completion of developmental myelination, glycolysis
products become gradually available to support the axonal
energy metabolism, which is presumably more critical for fibers
with high spiking activity. The ultrastructure of mature myelin is
complex with narrow (non-compacted) cytosolic compartments
in which glycolysis can take place. Once incorporated into these
myelin membranes, glucose transporters are more likely to serve
long-term functions than fast (‘‘insulin-like’’) adaptations to
changing energy needs. Indeed, our ex vivo experiment showed
that it takes many hours for oligodendrocytes to metabolically
respond to the loss of glutamate signaling. However, activity-
dependent regulation of axonal energy metabolism may be clin-
ically relevant, e.g., in the aging brain or in neurodegenerative
diseases (‘‘use it or lose it’’).
It is therefore of interest that NR1 mutant mice, when kept in
standard housing (i.e., without physical challenges), showed
signs of neurodegeneration beginning in the medulla and
spinal cord at 10 months of age and progressing later to all
CNS white matter tracts. Here, visible axonopathy and inflam-
mation are most likely a ‘‘tip of the iceberg,’’ reflecting
reduced energy metabolism in (many more) myelinated axons
in vivo.
Finally, we note that astrocytes can also support axon function
by releasing lactate in the white matter. They have direct access
to the vasculature, store glycogen, and rapidly respond to en-
ergy deprivation with glycogen breakdown (Brown and Ransom,
2007). Theoretically, astrocytes may compensate some meta-
bolic functions in oligodendroglial NMDA receptor mutants.
The regulated metabolic interactions between axons, oligoden-
drocytes, and astrocytes are increasingly recognized as key for
normal white matter function and likely for axon survival in
many neurodegenerative diseases.
EXPERIMENTAL PROCEDURES
Mouse Strains
Female Cnp1-Cre mice (RRID: MGI_3051754) (Lappe-Siefke et al., 2003) were
crossbred to floxed NR1 (gene symbol Grin1) mice (RRID: MGI_2175051)
(Tsien et al., 1996). Conditional knockout animals were Grin1flox/flox*Cnp1Cre/+
mice. As controls, we used Cnp1Cre/+
, Grin1flox/flox*Cnp1+/+, or Grin1flox/+*
Cnp1Cre/+ mice obtained as respective littermates. Some of the mice also
carried the R26-stop-EYFP reporter gene for Cre activity (RRID: IMSR_
JAX:006148) (Srinivas et al., 2001). Mice were maintained on the C57Bl6 back-
ground. Experiments were carried out mainly on male mice. Animal experi-
ments were performed according to German, Spanish, and European guide
lines for Animal Experimentation.
Cell Culture Preparation
Primary mouse or rat oligodendrocyte progenitor cells (OPCs) were isolated
from cerebral cortices at P0–P2 as described previously (Barros et al., 2009;
McCarthy and de Vellis, 1980). Cells were grown in DMEM (Lonza) supple-
mented with 10% fetal calf serum, Glutamax (Invitrogen), Penicillin and Strep-
tomycin (Invitrogen) at 37�C, and 5%CO2. Following OPC isolation, cells were
differentiated for 5 days in Sato’s medium. For all experiments, Glutamax was
withdrawn from the growthmedium in the last 12–16 hr of differentiation. OPCs
utilized for biotinylation assays, 2-deoxyglucose uptake, or lactate release
were further purified to 98.2% ± 0.3% by negative selection immunopanning
(Barres et al., 1992).
Immunocytochemistry
For GLUT1 and MCT1 immunocytochemistry, differentiated cells were
treated for 30 min at 37�C with 100 mM NMDA. Glycine as co-agonist for
NMDA receptors was already present in the medium. NMDA receptor
blockers D-AP5 and/or 7CKA (100 mM) were applied 30 min prior to NMDA
stimulation. Plasma membranes of mature oligodendrocytes were labeled
with anti-galactocerebroside (GalC) antibody (Millipore Cat# MAB342 RRID:
AB_94857) for 15 min at 37�C prior to fixation with 4% paraformaldehyde
for 10 min at RT. Cells were permeabilized with ice-cold methanol for
5 min, washed with PBS, and incubated with anti-GLUT1 antibody (Abcam
Cat# ab32551 RRID: AB_732605) or with anti-MCT1 (Millipore Cat#
AB1286 RRID: AB_90565) overnight at 4�C. Analysis was carried out on
confocal stacks of individual cells using ImageJ (http://rsb.info.nih.gov/ij/).
Data are presented as the ratio of GLUT1 or MCT1 signal area to GalC
area. Three individual experiments with 14–24 cells per condition were
analyzed. Data were grouped per experiment and normalized to control
condition.
Cell Surface Biotinylation
Immunopanned oligodendrocytes were treated with NMDA receptor agonists
or antagonists as described above. Cell surface-associated proteins were
labeled by incubation with 0.5 mg/ml membrane-impermeable EZ-link
Sulfo-NHS-Biotin (Thermo Scientific) at 4�C for 30 min. After removing un-
bound biotin, cells were lysed for 15 min on ice with 1% Triton X-100,
0.2% SDS in PBS (pH 7.4) containing protease/phosphatase inhibitors. To
isolate biotinylated proteins, 350–450 mg of lysate was incubated overnight
at 4�C with 150 ml of 50% Pierce Streptavidin Agarose Resin in PBS
(pH 7.2). After elution of biotinylated material, proteins were resolved by
SDS-PAGE and immunoblotted with anti-GLUT1 or anti-MCT1 antibodies
as described below.
Glucose Sensor Imaging
Ratmixed glial cells (after 8–12 days in culture) were transfected (using Fugene
HD, Roche) with glucose sensor FLII12Pglu-700mD6 (Takanaga et al., 2008;
Addgene plasmid 17866). 1 day after transfection, OPCs were isolated and
further cultivated for 5 days. For details on FRET imaging, see Supplemental
Information. NMDA receptor agonists and antagonists (each 100 mM) were
applied, and FRET changes were analyzed. For control experiments and
sensor calibration (Bittner et al., 2010), cells were incubated without glucose
or adding either iodoacetate (glycolysis inhibitor, 1 mM) or cytochalasin B
(glucose transporter blocker, 40 mM).
Neuron 91, 119–132, July 6, 2016 127
Page 11
NR1 cKO Mac3
DCBA
0
2
4
6
Mac
3+ a
rea
(%) ***
vWM GM
ControlNR1 cKO
0
500
1000
1500
2000
Nuc
lei d
ensi
ty/ m
m2
*
vWM GM
10-1
2 m
onth
s
0
10
20
30
GFA
P+ a
rea
(%) *
vWMvWM
GMMac3
60
305
80
100
120
140Control NR1 cKO
age (d)La
tenc
y to
fall
(s)
*
*GE NR1 cKO
306 307 334 335 336
ControlNR1 cKO
0
1
2
3
4M
ean
dege
nera
tive
axon
s pe
r sec
tion **
F
10-1
2 m
onth
s
H
19 m
onth
s
Mac3 Mac3
NR1 cKO
corp
us c
allo
sum
fimbr
ia
I
LK
19 m
onth
s
Axonal swellings by APP labelling
corpus callosum fimbria
J
subventricular WM
NR1 cKO
0
2
4
6
8
Mac
3+ a
rea
(%)
ControlNR1 cKOCnp1Cre/+
*** ***
0
50
100
150
200
250
APP
sph
eroi
ds/ m
m2
ControlNR1 cKOCnp1Cre/+
*** *
Neu
rode
gene
ratio
n Ph
enot
ype
Scor
ing
19 months
0
1
2
3
4
ControlNR1 cKO
***
AA
NN
D
B
D
Figure 6. Late-Onset Neuroinflammation and Axonopathy in NR1 cKO Mice
(A) Indirect signs of neurodegeneration in white matter tracts at 1 year of age and overview (left) of sagittal cerebellum-spinal cord section from NR1 cKO mice.
Signs of local inflammation (Mac3 immunostaining) were more obvious in the ventral white matter (vWM) compared to spinal cord gray matter (GM). Higher
magnification (region marked by a red rectangle) reveals activated microglia (Mac3). Scale bar, 20 mm. See also Figure S7.
(B) Neuroinflammation in the ventral whitematter of NR1 cKOmice confirmed by increased density of cell nuclei (p = 0.029, n = 4, Student’s t test). In adjacent GM,
nuclear densities are unaltered.
(C) Quantification of the Mac3+ immunostained area (microgliosis) in vWM of NR1 mutant mice (p = 0.0004, n = 4, Student’s t test)
(D) Quantification of the GFAP+ area (astrogliosis) in vWM of NR1 mutant mice (p = 0.013, Student’s t test).
(legend continued on next page)
128 Neuron 91, 119–132, July 6, 2016
Page 12
Glucose
GlucoseCa2+
Glucose
Lipids
Pyruvate, LactateGlGlGlGl tttutam tttateGlutamate
NMDAR
Pyruvate
Lactate
GLUT1
Oligodendrocyte
MCT1
MCT2
Compact Myelin
Axon6
4
5
1
23
Capilla
ry Glucose
ATPATP
ATP
Glucose
GLUT1
GLUT1
GlycolysisATP
Myelin
Figure 7. Schematic Depiction of Oligoden-
droglial NMDA Receptor Signaling
Working model in which axonal electrical activity in
developing white matter tracts constitutes a gluta-
matergic signal for the surrounding OPC/oligoden-
drocytes/myelin compartments (1). After myelination,
NMDA receptors associated with the internodal/
paranodal membrane respond to axonal glutamate
release as a surrogate marker for increased axonal
electrical activity and energy needs, causing (2) the
incorporation of additional glucose transporters into
oligodendrocytes and myelin and the adaptation of
glucose uptake (feed-forward regulation). Glycolysis
products (3) are initially used for ATP and lipid syn-
thesis (4). Later, mature oligodendrocytes release
lactate (or pyruvate) to fuel the axonal compartment
(5) for mitochondrial ATP production (6). Regulation of
oligodendroglial glucose uptake by axonal energy
needs could help prevent abnormal accumulation of
lactate. The possible effect of glutamate on glucose
transporters on astrocytes is not shown.
2-Deoxyglucose Uptake Measurements
Immunopanned oligodendrocytes differentiated for 5 days were incubated for
25 min in the presence or absence of NMDA/Gly (100 mM) in a modified me-
dium (in mM: NaCl 91.17; KCl 5.37; NaH2PO4 0.91; Na2HPO4 0.23; NaHCO3
17.86; MgSO4 0.81; CaCl2 1.8; NaOH 16.7; HEPES 20; glucose 10; adjusted
to pH 7.4 with HCl after equilibration with 5% CO2). Then glucose was re-
placed by 10 mM 2-deoxyglucose (2DG) for 5 min. 2-deoxyglucose-6-phos-
phate present within the cells was quantified using a commercial kit according
to the instructions of the manufacturer (Cosmobio).
Measurements of Lactate Release by NMR
Immunopanned oligodendrocytes were differentiated for 4 days in Sato’s
medium containing 25 mM unlabeled glucose and for an additional day in
Sato’s medium containing 25 mM U-13C6-glucose. 100 mM NMDA/Gly was
added for 30 min at 37�C in modified medium (see above) containing
U-13C6-glucose. Conditioned media was immediately collected and snap
frozen until NMR analysis. For details on NMR analysis, see Supplemental
Information.
Immunohistochemistry
For NR1 labeling, mice were perfused with ice-cold artificial cerebrospinal fluid
(ACSF). Optic nerves were isolated and immersion fixed with 4% PFA for 2 hr
at RT and prepared for later cryo-sectioning. Slide-mounted sections (12 mm)
were air-dried at RT and then treated with 0.3% Triton X-100 and 5% horse
serum for 1 hr. Primary antibodies for NR1 (1:250, Millipore Cat# MAB363,
RRID: AB_94946) and MBP (1:300, rabbit, Dako) were incubated overnight
(E and F) By electron microscopy of ventral cervical spinal cord cross sections
frequent in NR1 mutant mice compared to controls (F) (n = 4–5 mice with 12–14
Scale bar, 2 mm. In (E): A, axonal degeneration; B, blebbing membranes; D, dela
(G) Motor deficits of NR1 cKOmutants at 10�11 months of age, demonstrated by
latency to fall is decreased in NR1 mutant mice (red line) compared to littermate
(H) At age 19months, NR1 cKOmice (n = 11) display significant neurological defic
asymptomatic; 1, hind limb clasping; 2, additionally, hunchback visible; 3, additio
inverted grid; 4, additionally, hind limb ataxia and unable to hold on upright grid;
(I) Brain sections of 19-month-old NR1 cKOmice immunostained for Mac3+ show
and fimbria are magnified (right panel).
(J) Quantification of Mac3+ immunostained area in NR1mutants compared to litter
mixed effects analysis with post hoc Tukey correction for multiple comparisons)
(K) Axonopathy in white matter tracts revealed by APP immunolabeling (arrow hea
and subventricular white matter are shown.
(L) Quantification of APP spheroids in NR1mutants in comparison to littermate co
p < 0.001 and Cnp1Cre/+ versus NR1 cKO p = 0.03, linear mixed effects analysis
at 4�C in the same solution. Secondary antibodies were incubated in 2% horse
serum for 2 hr at RT.
For analysis of local inflammation and pathology, paraffin sections of perfu-
sion-fixed tissues were used. Sections were treated with primary antibodies
diluted in PBS/BSA (1% w/v BSA) overnight at 4�C. Dilutions were as follows:
GFAP (1:200, mouse, Novocastra), Mac3 (1:400, rat, BD PharMingen), and
APP (1:1000, Millipore Cat# MAB348 RRID: AB_94882). Biotinylated second-
ary antibodies were then incubated for 30min at RT, and chromogenic staining
was completed using HRP-DAB detection.
Protein Analysis
Protein lysates of optic nerves from individual mice were prepared using the
Precellys Ceramic Kit 1.4 mm and the Precellys 24 homogenizer (Peqlab).
Nerves were homogenized in 150 ml sucrose buffer (in mM: 320 sucrose, 10
Tris [pH 7.4], 1 NaHCO3, and 1 MgCl2) and protease inhibitors (Complete tab-
lets, Roche). For Western blotting, 30 mg protein lysate was size-separated on
12% SDS-polyacrylamide gels and blotted onto nitrocellulose membranes
following instructions fromBioRad. Primary antibodies to NR1 (1:500,Millipore
Cat# MAB363, RRID: AB_94946) and GAPDH (1:2000, Enzo Life Sciences
Cat# ADI-CSA-335-E, RRID: AB_2039148) were diluted in blocking buffer
(5% milk) and incubated overnight at 4�C. Membranes were washed in
0.05% Tween prepared in phosphate buffer (PBS-T) followed by incubation
with a horseradish peroxidase-conjugated secondary antibody. Proteins
were detected with an enhanced chemiluminescence kit (Western Lightning,
PerkinElmer) according to the manufacturer’s instructions. Exposed ECL films
(Amersham Biosciences) were scanned at grayscale (300 dpi resolution) using
(E), ultrastructural features of axonal pathology and degeneration were more
randomly taken images, covering 530 mm2 each, p = 0.0014, Student’s t test).
mination; N, normal myelin.
Rotarod testing on three consecutive days (repeated the following month). The
controls (Fgenotype (1, 17) = 4.95, p = 0.040, n = 9–10, two-way ANOVA).
its compared to controls (n = 8, p < 0.001 Student’s t test). Clinical scores are 0,
nally, frequent slipping while walking on grid; 3.5, additionally, failure to hold on
4.5, spastic hind limbs.
widespread signs of neuroinflammation in white matter tracts; corpus callosum
mate controls and age-matched Cnp1Cre/+ mice (n = 4–6mice, p < 0.001, linear
.
ds) in brain sections of 19-month-old NR1 cKOmice; corpus callosum, fimbria,
ntrols and age-matched Cnp1Cre/+ mice (n = 4–6 mice; control versus NR1 cKO
with post hoc Tukey correction for multiple comparisons).
Neuron 91, 119–132, July 6, 2016 129
Page 13
a regular image scanner, followed by densitometric analysis with ImageJ. The
peak intensity for NR1 was normalized to the peak intensity of GAPDH.
Immunoelectron Microscopy
Freshly dissected optic nerves were immersion fixed with 4% formalde-
hyde and 0.2% glutaraldehyde in 0.1 M phosphate buffer containing
0.5% NaCl. After embedding in 10% gelatine and subsequent infiltration
with 2.3 M sucrose in 0.1 M PB overnight, small blocks of gelatin contain-
ing optic nerve pieces were mounted onto aluminum pins for ultramicrot-
omy and frozen in liquid nitrogen. Ultrathin cryosections were picked up
with a 1:1 mixture of 2% methylcellulose and 2.3 M sucrose. Sections
were incubated with antibodies against GLUT1 (1:100, Abcam Cat#
ab32551 RRID: AB_732605) and MCT1 (1:1,000, Millipore Cat# AB1286
RRID: AB_90565) and detected with protein A-gold (10 nm, obtained
from the Cell Microscopy Center, Department of Cell Biology, University
Medical Center Utrecht, NL), and by anti-chicken immunogold (10 nm,
Aurion), respectively. Sections were analyzed with a LEO EM912AB (Zeiss),
and digital micrographs were obtained with an on-axis 204832048-CCD
camera (TRS, Moorenweis). For quantification, 10–12 randomly taken im-
ages from three controls and three NR1 mutants were assessed. Per im-
age, all myelinated axons and immunogold particles associated with
myelinated axons were counted, and a ratio of immunogold particles to
the number of myelinated axons was calculated. The mean ratio per animal
was then normalized to controls.
Myelin Preparation and Immunoblotting
Myelin was purified as described before (Norton and Poduslo, 1973) from
mouse brain homogenate in 0.32 M sucrose. Immunoblotting was performed
as described before (Werner et al., 2007). Briefly, 30 mg of protein were sepa-
rated on 10% SDS-polyacrylamide gels, blotted onto polyvinylidene difluoride
membranes (Roche), and incubated with primary antibodies for GLUT1 (1:500,
Abcam Cat# ab32551 RRID: AB_732605), MCT1 (1:1,000, Millipore Cat#
AB1286 RRID: AB_90565), and SIRT2 (1:2,000) (Dryden et al., 2003). Blots
were incubated with horseradish peroxidase-coupled secondary antibodies
(Dianova) and developed by enhanced chemiluminescence (Western Light-
ning ECL, PerkinElmer) using a luminescence imager (Intas).
Electron Microscopy and Morphometry
Optic nerves were acutely removed and either immersion-fixed for conven-
tional sample preparation or cryofixed by HPF and freeze substituted as
described in detail (Mobius et al., 2010). For analysis of axonal pathology, an-
imals were perfusion-fixed (4% formaldehyde, 2.5% glutaraldehyde). For
structural analysis of optic nerves that were subjected to OGD, nerves were
directly immersion-fixed (4% formaldehyde, 2.5% glutaraldehyde). For anal-
ysis of unmyelinated, myelinated, and ensheathed axons (defined as 1–3 un-
compacted layers), 4–6 EM images with 12,0003 magnification 400–700
axons were counted for each nerve. Data were grouped per animal. For g-ratio
analysis, 4–5 random overview pictures were taken at 8,0003 magnification,
200 axons analyzed using ImageJ (images were blinded for experimenter).
G-ratios (axonal diameter divided by the fiber diameter including the myelin
sheath) were calculated from circular areas equivalent to the measured areas
of axons and myelin sheath including the axon.
Optic Nerve Recordings
Following anesthesia and decapitation, nerves were gently removed, placed
into an interface perfusion chamber (Haas Top, Harvard Apparatus), and
superfused with ACSF containing the following (in mM): 124 NaCl, 3.0 KCl,
2.0 CaCl2, 2.0 MgSO4, 1.25 NaH2PO4, 23 NaHCO3, and 10 glucose. Perfusion
chamber was continuously aerated by a humidified gasmixture of 95%O2/5%
CO2, and experiments were performed at 37�C.For oxygen-glucose deprivation (OGD), the protocol was performed as
described previously (Baltan et al., 2008). CAPs were elicited every 30 s,
and OGD (applied for 60 min) was induced by switching to glucose-free
ACSF and a gas mixture containing 95% N2/5% CO2. After OGD control
ACSF and O2 were restored and CAPs were recorded for up to 2–3 hr, re-
sponses were stabilized within 20 to 30 min. When L-Lactate (20 mM, Sigma)
was used during recovery, it was substituted for 20 mM NaCl.
130 Neuron 91, 119–132, July 6, 2016
CAP area is proportional to the total number of excited axons (Stys et al.,
1991). Irreversible injury was measured by determining residual CAP area
1.5–2 hr after conclusion of OGD, normalized to baseline CAP area.
For the long-term ex vivo analysis, wild-type nerves were continuously
superfused with ACSF containing either NMDA and glycine (NMDA/Gly
100 mM), NMDA/Gly plus 7CKA and D-AP5 (7CKA/D-AP5 100 mM), or DMSO
only (DMSO Control). After 16 hr of treatment, CAPs were recorded at
0.2 Hz to obtain baseline, and then nerves were challenged with a gradual
increase in stimulation frequency (from 1 to 100 Hz), with each stimulus train
lasting 30 s. For 1 and 5 Hz stimulations, CAPs were continuously recorded.
For 10, 25, 50, and 100 Hz stimulations, CAPs were sampled after a burst of
each 100 stimuli with an inter-burst interval of 300 ms. CAP area of the graded
responses were analyzed for each treatment group (2.1 ms after stimulus
onset) and normalized to baseline.
In Vivo Spinal Cord CAP Recordings
For details, see Supplemental Information. Stimulation and recording from
spinal cord axons in vivo were performed with bipolar platinum electrodes.
Square-wave constant voltage pulses (100 ms) were used to stimulate the
dorsal root L4, and CAPs were recorded from the ipsilateral fasciculus gracilis
at spinal cord level L1. Dorsal roots were stimulated at different frequencies
(0.1, 10, and 100 Hz), and CAP recordings were sampled at 50 kHz. Distance
between the electrodes was measured using a thin cotton thread to evaluate
conduction velocities. For analysis of axonal firing strength, the peak-to-
peak amplitude (of the first and most robust peak of the CAP recording) was
monitored over time and normalized to baseline (0.1 Hz).
Rotarod and Clinical Score
Mice (10–12 months) were placed on a horizontal rod at 1 rpm and accelerated
with 1 rpm every 10 s (three tests per trial). The clinical scores at the age of
19monthswere as follows: 0, asymptomatic; 1, hind limb clasping; 2, addition-
ally, hunchback visible; 3, additionally, slipping during walking on a grid; 3.5,
additionally, not able to hold on an inverted grid; 4, additionally, hind limb
ataxia, not able to hold on an upright grid and reduced righting reflex; 4.5,
spastic hind limbs.
Statistical Analysis
Inter-group comparisons were done by Mann Whitney t test or two-tailed
Student’s t test. For multiple comparisons, data were analyzed with one-way
or two-way ANOVA with Bonferroni’s post-test or using linear mixed effects
models (lme4 package v.1.1.9; https://cran.r-project.org/web/packages/
lme4/). All analyses were conducted through GraphPad Prism 4 or R (v.3.2.2, R
Core Team, 2015). The levels of significance were set as *p < 0.05; **p < 0.01;
***p < 0.001. Data are represented as means ± SEM.
SUPPLEMENTAL INFORMATION
Supplemental Information includes Supplemental Experimental Procedures
and seven figures and can be found with this article online at http://dx.doi.
org/10.1016/j.neuron.2016.05.016.
AUTHOR CONTRIBUTIONS
All authors analyzed data and contributed ideas to the manuscript. A.S.S. per-
formed mouse breeding experiments, histology, qPCR and protein analysis,
microscopy, optic nerve recordings, and EM analysis. S.B., A.S.S., and A.T.
performed optic nerve recordings; culture experiments and FRET sensor im-
aging were performed by J.H., I.D.T., A.T., and A.S.S.; NMR measurements
and analysis were performed by D.B. and C.G.; W.M. performed HPF-EM
and immuno-EM analyses; P.D., H.S., and E.D.S. performed in vivo spinal
cord recordings; K.K. performed myelin preparations, protein analysis, and
neurological scoring of aged mice; B.G. and S.L. performed behavioral
assessment of visual performance; H.M.J. helped with EM analysis; W.H.
contributed to optic nerve protein analysis; A.P.-S., F.P.-C. and C.M. per-
formed EAE analysis; F.K. and K.-A.N. supervised the project; A.S.S. and
K.-A.N. wrote the manuscript.
Page 14
ACKNOWLEDGMENTS
We thankM.J. Barrett for help in statistical analyses. We thank T. Ruhwedel, A.
Fahrenholz, U. Bode, F. Rhode, O. Lopez, and H. Gomez for technical assis-
tance, D. Rhode and C. Casper for animal husbandry, and B. Hamprecht for
helpful discussions. This work was supported by the DFG (Research Center
Molecular Physiology of the Brain/CNMPB to K.-A.N, F.K., W.M., and C.G.),
DFG SPP-1757 (K.-A.N.), NIH/NIA Grant AG033720 and the American Heart
Association National Scientist Development Grant (S.B.), Ministerio de Ciencia
e Innovacion (grant no. SAF2013-45084-R) and CIBERNED (C.M.), DFG SPP-
1172 (F.K. and K.-A.N.), DFG SFB 894 (F.K.), DFG SFB/Transregio TRR43 (K.-
A.N. and F.K.), European Commission FP7-202167 NeuroGLIA (F.K.), and an
ERC Advanced Investigators Grant (K.-A.N.). A.S.S. is supported by a long-
term EMBO fellowship.
Received: November 12, 2015
Revised: March 11, 2016
Accepted: May 5, 2016
Published: June 9, 2016
REFERENCES
Baltan, S., Besancon, E.F., Mbow, B., Ye, Z., Hamner, M.A., and Ransom, B.R.
(2008). White matter vulnerability to ischemic injury increases with age
because of enhanced excitotoxicity. J. Neurosci. 28, 1479–1489.
Barres, B.A., Hart, I.K., Coles, H.S., Burne, J.F., Voyvodic, J.T., Richardson,
W.D., and Raff, M.C. (1992). Cell death and control of cell survival in the oligo-
dendrocyte lineage. Cell 70, 31–46.
Barros, C.S., Nguyen, T., Spencer, K.S., Nishiyama, A., Colognato, H., and
Muller, U. (2009). Beta1 integrins are required for normal CNS myelination
and promote AKT-dependent myelin outgrowth. Development 136, 2717–
2724.
Barry, J.M. (2015). Axonal activity in vivo: technical considerations and impli-
cations for the exploration of neural circuits in freely moving animals. Front.
Neurosci. 9, 153.
Bittner, C.X., Loaiza, A., Ruminot, I., Larenas, V., Sotelo-Hitschfeld, T.,
Gutierrez, R., Cordova, A., Valdebenito, R., Frommer, W.B., and Barros, L.F.
(2010). High resolution measurement of the glycolytic rate. Front.
Neuroenergetics 2, 2.
Bogan, J.S., and Kandror, K.V. (2010). Biogenesis and regulation of insulin-
responsive vesicles containing GLUT4. Curr. Opin. Cell Biol. 22, 506–512.
Brown, A.M., and Ransom, B.R. (2007). Astrocyte glycogen and brain energy
metabolism. Glia 55, 1263–1271.
Burzomato, V., Frugier, G., Perez-Otano, I., Kittler, J.T., and Attwell, D. (2010).
The receptor subunits generating NMDA receptor mediated currents in oligo-
dendrocytes. J. Physiol. 588, 3403–3414.
Das, S., Sasaki, Y.F., Rothe, T., Premkumar, L.S., Takasu, M., Crandall, J.E.,
Dikkes, P., Conner, D.A., Rayudu, P.V., Cheung, W., et al. (1998). Increased
NMDA current and spine density in mice lacking the NMDA receptor subunit
NR3A. Nature 393, 377–381.
De Biase, L.M., Nishiyama, A., and Bergles, D.E. (2010). Excitability and syn-
aptic communication within the oligodendrocyte lineage. J. Neurosci. 30,
3600–3611.
De Biase, L.M., Kang, S.H., Baxi, E.G., Fukaya, M., Pucak, M.L., Mishina, M.,
Calabresi, P.A., and Bergles, D.E. (2011). NMDA receptor signaling in oligo-
dendrocyte progenitors is not required for oligodendrogenesis and myelina-
tion. J. Neurosci. 31, 12650–12662.
Dryden, S.C., Nahhas, F.A., Nowak, J.E., Goustin, A.S., and Tainsky, M.A.
(2003). Role for human SIRT2 NAD-dependent deacetylase activity in control
of mitotic exit in the cell cycle. Mol. Cell. Biol. 23, 3173–3185.
Emery, B. (2010). Regulation of oligodendrocyte differentiation and myelina-
tion. Science 330, 779–782.
Ferreira, J.M., Burnett, A.L., and Rameau, G.A. (2011). Activity-dependent
regulation of surface glucose transporter-3. J. Neurosci. 31, 1991–1999.
Funfschilling, U., Supplie, L.M., Mahad, D., Boretius, S., Saab, A.S., Edgar, J.,
Brinkmann, B.G., Kassmann, C.M., Tzvetanova, I.D., Mobius, W., et al. (2012).
Glycolytic oligodendrocytes maintain myelin and long-term axonal integrity.
Nature 485, 517–521.
Gibson, E.M., Purger, D., Mount, C.W., Goldstein, A.K., Lin, G.L., Wood, L.S.,
Inema, I., Miller, S.E., Bieri, G., Zuchero, J.B., et al. (2014). Neuronal activity
promotes oligodendrogenesis and adaptive myelination in the mammalian
brain. Science 344, 1252304.
Griffiths, I., Klugmann, M., Anderson, T., Yool, D., Thomson, C., Schwab,M.H.,
Schneider, A., Zimmermann, F., McCulloch, M., Nadon, N., and Nave, K.A.
(1998). Axonal swellings and degeneration in mice lacking the major proteoli-
pid of myelin. Science 280, 1610–1613.
Guo, F., Maeda, Y., Ko, E.M., Delgado, M., Horiuchi, M., Soulika, A., Miers, L.,
Burns, T., Itoh, T., Shen, H., et al. (2012). Disruption of NMDA receptors in
oligodendroglial lineage cells does not alter their susceptibility to experimental
autoimmune encephalomyelitis or their normal development. J. Neurosci. 32,
639–645.
Hamilton, N.B., Kolodziejczyk, K., Kougioumtzidou, E., and Attwell, D. (2016).
Proton-gated Ca(2+)-permeable TRP channels damage myelin in conditions
mimicking ischaemia. Nature 529, 523–527.
Hildebrand, C., and Waxman, S.G. (1984). Postnatal differentiation of rat optic
nerve fibers: electron microscopic observations on the development of nodes
of Ranvier and axoglial relations. J. Comp. Neurol. 224, 25–37.
Karadottir, R., Cavelier, P., Bergersen, L.H., and Attwell, D. (2005). NMDA
receptors are expressed in oligodendrocytes and activated in ischaemia.
Nature 438, 1162–1166.
Kassmann, C.M., Lappe-Siefke, C., Baes,M., Brugger, B., Mildner, A.,Werner,
H.B., Natt, O., Michaelis, T., Prinz, M., Frahm, J., and Nave, K.A. (2007). Axonal
loss and neuroinflammation caused by peroxisome-deficient oligodendro-
cytes. Nat. Genet. 39, 969–976.
Kukley, M., Capetillo-Zarate, E., and Dietrich, D. (2007). Vesicular glutamate
release from axons in white matter. Nat. Neurosci. 10, 311–320.
Lappe-Siefke, C., Goebbels, S., Gravel, M., Nicksch, E., Lee, J., Braun, P.E.,
Griffiths, I.R., and Nave, K.A. (2003). Disruption of Cnp1 uncouples oligoden-
droglial functions in axonal support and myelination. Nat. Genet. 33, 366–374.
Lee, Y., Morrison, B.M., Li, Y., Lengacher, S., Farah, M.H., Hoffman, P.N., Liu,
Y., Tsingalia, A., Jin, L., Zhang, P.W., et al. (2012). Oligodendroglia metaboli-
cally support axons and contribute to neurodegeneration. Nature 487,
443–448.
Li, C., Xiao, L., Liu, X., Yang, W., Shen, W., Hu, C., Yang, G., and He, C. (2013).
A functional role of NMDA receptor in regulating the differentiation of oligoden-
drocyte precursor cells and remyelination. Glia 61, 732–749.
Lipton, S.A. (2006). NMDA receptors, glial cells, and clinical medicine. Neuron
50, 9–11.
Liu, J., Dietz, K., DeLoyht, J.M., Pedre, X., Kelkar, D., Kaur, J., Vialou, V., Lobo,
M.K., Dietz, D.M., Nestler, E.J., et al. (2012). Impaired adult myelination in the
prefrontal cortex of socially isolated mice. Nat. Neurosci. 15, 1621–1623.
Lundgaard, I., Luzhynskaya, A., Stockley, J.H., Wang, Z., Evans, K.A., Swire,
M., Volbracht, K., Gautier, H.O., Franklin, R.J., Attwell, D., and Karadottir,
R.T.; Charles Ffrench-Constant (2013). Neuregulin and BDNF induce a switch
toNMDA receptor-dependentmyelination by oligodendrocytes. PLoSBiol. 11,
e1001743.
Matute, C. (2010). Calcium dyshomeostasis in white matter pathology. Cell
Calcium 47, 150–157.
McCarthy, K.D., and de Vellis, J. (1980). Preparation of separate astroglial and
oligodendroglial cell cultures from rat cerebral tissue. J. Cell Biol. 85, 890–902.
Micu, I., Jiang, Q., Coderre, E., Ridsdale, A., Zhang, L., Woulfe, J., Yin, X.,
Trapp, B.D., McRory, J.E., Rehak, R., et al. (2006). NMDA receptors mediate
calcium accumulation in myelin during chemical ischaemia. Nature 439,
988–992.
Micu, I., Plemel, J.R., Lachance, C., Proft, J., Jansen, A.J., Cummins, K., van
Minnen, J., and Stys, P.K. (2016). Themolecular physiology of the axo-myelinic
synapse. Exp. Neurol. 276, 41–50.
Neuron 91, 119–132, July 6, 2016 131
Page 15
Miller, R.H., David, S., Patel, R., Abney, E.R., and Raff, M.C. (1985). A quanti-
tative immunohistochemical study of macroglial cell development in the rat
optic nerve: in vivo evidence for two distinct astrocyte lineages. Dev. Biol.
111, 35–41.
Mobius, W., Cooper, B., Kaufmann,W.A., Imig, C., Ruhwedel, T., Snaidero, N.,
Saab, A.S., and Varoqueaux, F. (2010). Electron microscopy of the mouse
central nervous system. Methods Cell Biol. 96, 475–512.
Morrison, B.M., Lee, Y., and Rothstein, J.D. (2013). Oligodendroglia: metabolic
supporters of axons. Trends Cell Biol. 23, 644–651.
Nave, K.A. (2010). Myelination and the trophic support of long axons. Nat. Rev.
Neurosci. 11, 275–283.
Nave, K.A., andWerner, H.B. (2014). Myelination of the nervous system:mech-
anisms and functions. Annu. Rev. Cell Dev. Biol. 30, 503–533.
Norton, W.T., and Poduslo, S.E. (1973). Myelination in rat brain: method of
myelin isolation. J. Neurochem. 21, 749–757.
Perge, J.A., Niven, J.E., Mugnaini, E., Balasubramanian, V., and Sterling, P.
(2012). Why do axons differ in caliber? J. Neurosci. 32, 626–638.
Pina-Crespo, J.C., Talantova, M., Micu, I., States, B., Chen, H.S., Tu, S.,
Nakanishi, N., Tong, G., Zhang, D., Heinemann, S.F., et al. (2010). Excitatory
glycine responses of CNS myelin mediated by NR1/NR3 ‘‘NMDA’’ receptor
subunits. J. Neurosci. 30, 11501–11505.
Rinholm, J.E., Hamilton, N.B., Kessaris, N., Richardson, W.D., Bergersen,
L.H., and Attwell, D. (2011). Regulation of oligodendrocyte development and
myelination by glucose and lactate. J. Neurosci. 31, 538–548.
Saab, A.S., Tzvetanova, I.D., and Nave, K.A. (2013). The role of myelin and
oligodendrocytes in axonal energy metabolism. Curr. Opin. Neurobiol. 23,
1065–1072.
Salter, M.G., and Fern, R. (2005). NMDA receptors are expressed in devel-
oping oligodendrocyte processes and mediate injury. Nature 438, 1167–1171.
Snaidero, N., Mobius, W., Czopka, T., Hekking, L.H., Mathisen, C., Verkleij, D.,
Goebbels, S., Edgar, J., Merkler, D., Lyons, D.A., et al. (2014). Myelin mem-
brane wrapping of CNS axons by PI(3,4,5)P3-dependent polarized growth at
the inner tongue. Cell 156, 277–290.
Srinivas, S., Watanabe, T., Lin, C.S., William, C.M., Tanabe, Y., Jessell, T.M.,
and Costantini, F. (2001). Cre reporter strains produced by targeted insertion
of EYFP and ECFP into the ROSA26 locus. BMC Dev. Biol. 1, 4.
Stirling, D.P., and Stys, P.K. (2010). Mechanisms of axonal injury: internodal
nanocomplexes and calcium deregulation. Trends Mol. Med. 16, 160–170.
Stys, P.K. (2011). The axo-myelinic synapse. Trends Neurosci. 34, 393–400.
132 Neuron 91, 119–132, July 6, 2016
Stys, P.K., Ransom, B.R., andWaxman, S.G. (1991). Compound action poten-
tial of nerve recorded by suction electrode: a theoretical and experimental
analysis. Brain Res. 546, 18–32.
Takanaga, H., Chaudhuri, B., and Frommer, W.B. (2008). GLUT1 and GLUT9
as major contributors to glucose influx in HepG2 cells identified by a high
sensitivity intramolecular FRET glucose sensor. Biochim. Biophys. Acta
1778, 1091–1099.
Tekkok, S.B., Brown, A.M., Westenbroek, R., Pellerin, L., and Ransom, B.R.
(2005). Transfer of glycogen-derived lactate from astrocytes to axons via spe-
cific monocarboxylate transporters supports mouse optic nerve activity.
J. Neurosci. Res. 81, 644–652.
Tekkok, S.B., Ye, Z., and Ransom, B.R. (2007). Excitotoxic mechanisms of
ischemic injury in myelinated white matter. J. Cereb. Blood Flow Metab. 27,
1540–1552.
Tsien, J.Z., Huerta, P.T., and Tonegawa, S. (1996). The essential role of hippo-
campal CA1 NMDA receptor-dependent synaptic plasticity in spatial memory.
Cell 87, 1327–1338.
Wake, H., Lee, P.R., and Fields, R.D. (2011). Control of local protein synthesis
and initial events in myelination by action potentials. Science 333, 1647–1651.
Werner, H.B., Kuhlmann, K., Shen, S., Uecker, M., Schardt, A., Dimova, K.,
Orfaniotou, F., Dhaunchak, A., Brinkmann, B.G., Mobius, W., et al. (2007).
Proteolipid protein is required for transport of sirtuin 2 into CNS myelin.
J. Neurosci. 27, 7717–7730.
Wyss, M.T., Jolivet, R., Buck, A., Magistretti, P.J., andWeber, B. (2011). In vivo
evidence for lactate as a neuronal energy source. J. Neurosci. 31, 7477–7485.
Yang, X., Hamner, M.A., Brown, A.M., Evans, R.D., Ye, Z.C., Chen, S., and
Ransom, B.R. (2014). Novel hypoglycemic injury mechanism: N-methyl-D-
aspartate receptor-mediated white matter damage. Ann. Neurol. 75, 492–507.
Yip, M.F., Ramm, G., Larance, M., Hoehn, K.L., Wagner, M.C., Guilhaus, M.,
and James, D.E. (2008). CaMKII-mediated phosphorylation of the myosin
motor Myo1c is required for insulin-stimulated GLUT4 translocation in adipo-
cytes. Cell Metab. 8, 384–398.
Zhang, Y., Chen, K., Sloan, S.A., Bennett, M.L., Scholze, A.R., O’Keeffe, S.,
Phatnani, H.P., Guarnieri, P., Caneda, C., Ruderisch, N., et al. (2014). An
RNA-sequencing transcriptome and splicing database of glia, neurons, and
vascular cells of the cerebral cortex. J. Neurosci. 34, 11929–11947.
Ziskin, J.L., Nishiyama, A., Rubio, M., Fukaya, M., and Bergles, D.E. (2007).
Vesicular release of glutamate from unmyelinated axons in white matter.
Nat. Neurosci. 10, 321–330.