Oliver, Olin, and Martin Lakes Diagnostic Study LaGrange County, Indiana October 16, 2009 Prepared for: Oliver and Martin Lakes Conservation and Improvement Association c/o Lynn Bowen 1155 E 455 S LaGrange, IN 46761 Prepared by: 708 Roosevelt Road Walkerton, Indiana 46574 (574) 586-3400
Transcript
Oliver, Olin, and Martin Lakes Diagnostic Study LaGrange County, Indiana
October 16, 2009
Prepared for: Oliver and Martin Lakes Conservation and Improvement Association
c/o Lynn Bowen 1155 E 455 S
LaGrange, IN 46761
Prepared by:
708 Roosevelt Road
Walkerton, Indiana 46574 (574) 586-3400
File #070874.00 Page i
OLIVER, OLIN, AND MARTIN LAKES DIAGNOSTIC STUDY LAGRANGE COUNTY INDIANA
EXECUTIVE SUMMARY
Oliver, Olin, and Martin lakes are 391.9-acre, 101.4-acre, and 25.6-acre (158.6-ha, 41-ha, and 10.4-ha), natural lakes that lie in the southeast portion of LaGrange County, Indiana within the Oliver Lake-Little Elkhart Creek watershed (HUC 040500011506). Together, the lakes create the Oliver, Olin, and Martin (OOM) lakes watershed, which stretches out to the north and east of the lakes, encompassing approximately 6,856 acres (2,774.6 ha or 10.7 square miles). Water flows from Martin Lake to Olin Lake and into Oliver Lake before discharging out of Oliver Lake’s outlet in the southwest corner. Most of the OOM lakes watershed (~64%) is utilized for row-crop agricultural while approximately 16% of the watershed is utilized for hay or pasture. The remaining 20% of the watershed is divided among remnants of natural landscapes (~7%) composed of wetlands and forested areas, and residential and commercial developments (~4%). Open water including Oliver, Olin, and Martin lakes covers approximately 7% of the entire watershed. Water quality parameters and biotic metrics were assessed at four stream locations throughout the watershed. In general, the biological condition of the streams in the OOM lakes watershed is poor with the macroinvertebrate community being classified either “Impaired” or “Slightly Impaired” and the stream habitat being classified in the three of the four sites as “Non-supporting of aquatic life”. Turbidity, stream temperature, and total suspended solids measured during the study were within normal levels for northern Indiana streams and not at levels that would significantly affect aquatic organisms. Nutrient levels such as nitrogen-nitrate, nitrogen-ammonia, and total phosphorus were, in general, elevated during storm flows. Dove Creek in the Oliver Lake watershed and an unnamed tributary in the Martin Lake watershed contribute the highest amounts of sediment and nutrient loading to the lakes. E.coli levels were at or above Indiana state standards a minimum of once during the sampling period at each of the four stream sampling sites. Oliver, Olin, and Martin lakes contain good water quality. Historical data for the lakes suggest that water quality has remained relatively stable over the past 30 years. The lakes possess generally better water clarity and lower nutrient levels than most Indiana lakes. Evaluating the lakes using various trophic state indices suggest the lakes are primarily mesotrophic in nature. Internal loading of phosphorus through its release from the sediments in Oliver and Olin lakes represents a potential for each lake to increase the productivity over time. During the summer aquatic vegetation assessment, northeastern bladderwort, a species thought to be extirpated from Indiana, was observed. Continued good water quality in Oliver, Olin, and Martin lakes will require both in-lake and watershed management. Oliver and Olin lakes possess hydraulic residence times of 1.9 and 1.1 years, respectively, while Martin Lake has a hydraulic residence time of 0.3 years. Attention to watershed and near shore practices prior to addressing in-lake processes is necessary. Stream sampling and phosphorus modeling indicate the row-crop agriculture within the each lake’s watershed contributes the largest single external source of phosphorus. Good watershed management is necessary to protect the OOM lakes’ water quality. Recommended watershed management techniques include: replacement or repair of several failed existing sediment control structures and grassed waterways, stream and drainage stabilization, wetland restoration, stormwater filtration, and agricultural best management
Oliver, Olin and Martin lakes Diagnostic Study October 16, 2009 LaGrange County, Indiana
File #070874.00 Page ii
practices (BMPs). Within the lakes themselves, stakeholders are encouraged to develop an aquatic plant management plan to provide a framework to manage invasive exotic species present in the lake and protect the native plant community. Also, the implementation of BMPs such as using Phosphorus free fertilizers, not mowing lawns to the waterline, utilizing rain gardens or rain barrels for increased water detention and naturalizing existing concrete seawalls are recommended to lake residents.
ACKNOWLEDGMENTS The Oliver, Olin and Martin lakes Diagnostic Study was made possible with funding from the Indiana Department of Natural Resources (IDNR) Division of Fish and Wildlife, Lake and River Enhancement Program (LARE), and the Oliver and Martin Lakes Conservation and Improvement Association (OMLCIA). The Oliver, Olin, and Martin lakes Diagnostic Study was completed by JFNew and their subcontractor, Indiana University School of Public and Environmental Affairs. Contributors to this study included the IDNR Division of Division of Fish and Wildlife and the IDNR Division of Nature Preserves. Special thanks to the dedicated members of the OMLCIA for their initiative and assistance in getting this study completed. OMLCIA members who participated in the study included: Lynn Bowen, who served as the primary liaison between JFNew and the OMLCIA; provided JFNew with directions and information during the watershed tour; Fred Leiter who navigated us around the lake during the rooted plant survey; Buck Toenges, who provided useful historical fishery information. Authors of this report included William Jones and Thomas Parr at Indiana University. The primary author at JFNew was Mark Pranckus with contributions from Betsy Ewoldt, Karen Quinlan, Holly Jones, Sara Peel, Tom Estrem, and John Richardson.
Oliver, Olin and Martin lakes Diagnostic Study October 16, 2009 LaGrange County, Indiana
File #070874.00 Page iii
TABLE OF CONTENTS PAGE
1.0 Introduction ............................................................................................................................. 1 2.0 Watershed Characteristics ...................................................................................................... 4 2.1 Topography and Physical Setting ........................................................................................... 4 2.2 Climate .................................................................................................................................. 10 2.3 Geology ................................................................................................................................. 11 2.4 Soils ...................................................................................................................................... 12 2.5 Natural History ...................................................................................................................... 19 2.6 Land Use ............................................................................................................................... 20 2.7 Wetlands ............................................................................................................................... 23 2.8 Natural Communities and Endangered, Threatened, and Rare Species .............................. 27 2.9 Prior Studies ......................................................................................................................... 29 3.0 Stream Assessment .............................................................................................................. 30 3.1 Stream Assessment Introduction .......................................................................................... 30 3.2 Stream Assessment Methods ............................................................................................... 32 3.3 Stream Assessment Results and Discussion ....................................................................... 39 4.0 Lake Assessment .................................................................................................................. 57 4.1 Morphology ........................................................................................................................... 57 4.2 Shoreline Development ......................................................................................................... 63 4.3 Historical Water Quality ........................................................................................................ 66 4.4 Lake Water Quality Assessment ........................................................................................... 83 4.5 Macrophyte Inventory ......................................................................................................... 105 4.6 Fisheries ............................................................................................................................. 129 4.7 Lake Use ............................................................................................................................ 131 5.0 Modeling ............................................................................................................................. 132 5.1 Water Budget ...................................................................................................................... 132 5.2 Phosphorus Budget ............................................................................................................ 137 6.0 Management ....................................................................................................................... 141 6.1 Public Outreach During the Diagnostic Study ..................................................................... 142 6.2 Historic Watershed Management ........................................................................................ 142 6.3 Watershed Management ..................................................................................................... 143 6.4 In-Lake Management .......................................................................................................... 152 7.0 Recommendations .............................................................................................................. 170 8.0 Literature Cited ................................................................................................................... 173
Oliver, Olin and Martin lakes Diagnostic Study October 16, 2009 LaGrange County, Indiana
File #070874.00 Page iv
TABLE OF FIGURES PAGE
Figure 1. General location of the Oliver, Olin, and Martin lakes watershed............................. 1 Figure 2. Oliver, Olin, and Martin lakes watershed .................................................................. 2 Figure 3. Individual lake watersheds for the Oliver, Olin, and Martin lakes watershed ........... 3 Figure 4. Topographical map of the Oliver Lake watershed .................................................... 5 Figure 5. Oliver Lake subwatersheds ...................................................................................... 6 Figure 6. Olin Lake subwatersheds ......................................................................................... 8 Figure 7. Martin Lake subwatersheds ..................................................................................... 9 Figure 8. Soil associations in the Oliver, Olin, and Martin lakes watershed .......................... 13 Figure 9. Highly erodible and potentially highly erodible soils within the Oliver, Olin, and
Martin lakes watershed .......................................................................................... 15 Figure 10. Soil septic tank suitability within the Oliver, Olin, and Martin lakes watershed ....... 18 Figure 11. Land use in the Oliver, Olin, and Martin lakes watershed ...................................... 22 Figure 12. National wetland inventory wetlands in the Oliver, Olin, and Martin lakes watershed ............................................................................................................... 24 Figure 13. Hydric soils in the Oliver, Olin, and Martin lakes watershed .................................. 26 Figure 14. FEMA map indicating areas within the one-percent flooding zone ........................ 27 Figure 15. Location of the Olin Lake Nature Preserve and other IDNR preserves in the
watershed ............................................................................................................... 29 Figure 16. Stream sampling locations ..................................................................................... 31 Figure 17. Discharge measurements during base flow and storm flow sampling of Oliver, Olin, and Martin lakes inlet streams ............................................................ 40 Figure 18. Water temperatures measured at Oliver, Olin, and Martin lakes stream sampling sites during storm flow and base flow conditions .................................... 41 Figure 19. Total suspended solids measured at Oliver, Olin, and Martin lakes stream sampling sites during storm flow and base flow conditions .................................... 42 Figure 20. Nitrate concentrations at Oliver, Olin, and Martin lakes stream sampling sites
during storm flow and base flow conditions ............................................................ 44 Figure 21. Ammonia concentrations at Oliver, Olin, and Martin lakes stream sampling sites during storm flow and base flow conditions ................................................... 44 Figure 22. Total Kjeldahl nitrogren concentrations measured at Oliver, Olin, and Martin lakes stream sampling sites during storm flow and base flow conditions ............... 45 Figure 23. Total phosphorus concentrations measured at Oliver, Olin, and Martin lakes stream sampling sites during storm flow and base flow conditions ............... 46 Figure 24. E.coli concentrations measured at Oliver, Olin, and Martin lakes stream sampling sites during storm flow and base flow conditions .................................... 47 Figure 25. Nitrate loads in the Oliver, Olin, and Martin lakes streams as sampled during storm flow and base flow conditions ............................................................ 48 Figure 26. Ammonia loads in the Oliver, Olin, and Martin lakes streams as sampled during storm flow and base flow conditions ............................................................ 49 Figure 27. Total Kjeldahl nitrogen loads in the Oliver, Olin, and Martin lakes streams as sampled during storm flow and base flow conditions ........................................ 49 Figure 28. Soluble reactive phosphorus loads in the Oliver, Olin, and Martin lakes streams as sampled during storm flow and base flow conditions .......................... 50 Figure 29. Total phosphorus loads in the Oliver, Olin, and Martin lakes streams as sampled during storm flow and base flow conditions ........................................ 50 Figure 30. Total suspended solids loads in the Oliver, Olin, and Martin lakes streams as sampled during storm flow and base flow conditions ......................................... 51 Figure 31. Burt Hart Ditch, stream sampling Site 2 ................................................................. 53
Oliver, Olin and Martin lakes Diagnostic Study October 16, 2009 LaGrange County, Indiana
File #070874.00 Page v
Page Figure 32. Burt Hart Ditch at sampling site .............................................................................. 54 Figure 33. Site 4 - Unnamed Tributary at manmade pool ....................................................... 55 Figure 34. Site 4 - Unnamed Tributary looking downstream with researcher at sampling site .......................................................................................................... 55 Figure 35. Oliver Lake bathymetric map .................................................................................. 58 Figure 36. Depth-area curve for Oliver Lake ........................................................................... 59 Figure 37. Depth-volume curve for Oliver Lake ....................................................................... 59 Figure 38. Olin and Martin Lakes bathymetric map ................................................................. 60 Figure 39. Depth-area curve for Olin Lake .............................................................................. 61 Figure 40. Depth-volume curve for Olin Lake .......................................................................... 61 Figure 41. Depth-area curve for Martin Lake ........................................................................... 62 Figure 42. Depth-volume curve for Martin Lake ...................................................................... 63 Figure 43. Shoreline development survey results from October 2008 .................................... 64 Figure 44. Example of the existing natural shoreline along Oliver Lake .................................. 65 Figure 45. Example of the existing modified shoreline along Oliver Lake ............................... 65 Figure 46. Example of the existing modified natural shoreline along Oliver Lake ................... 66 Figure 47. Historic Secchi disk transparency data for Oliver Lake .......................................... 69 Figure 48. Secchi disk transparency trends in Oliver Lake from 1993 to 2007 for the
months of June through September ....................................................................... 69 Figure 49. Historic total phosphorus concentrations measured in Oliver Lake ....................... 70 Figure 50. Historical temperature profiles for Oliver Lake ....................................................... 71 Figure 51. Historical dissolved oxygen profiles for Oliver Lake ............................................... 72 Figure 52. Historic Secchi disk transparency data for Olin Lake ............................................. 75 Figure 53. Secchi disk transparency trends in Olin Lake from 1993 to 2007 for the
months of June through September ....................................................................... 75 Figure 54. Historic total phosphorus concentrations measured in Olin Lake .......................... 76 Figure 55. Historical temperature profiles for Olin Lake .......................................................... 77 Figure 56. Historical dissolved oxygen profiles for Olin Lake .................................................. 78 Figure 57. Historic Secchi disk transparency data for Martin Lake ......................................... 80 Figure 58. Historic total phosphorus concentrations measured in Martin Lake ....................... 81 Figure 59. Historical temperature profiles for Martin Lake ....................................................... 82 Figure 60. Historical dissolved oxygen profiles for Martin Lake .............................................. 83 Figure 61. Temperature and dissolved oxygen profiles for Oliver Lake on 7/23/2008 ............ 88 Figure 62. Temperature and dissolved oxygen profiles for Olin Lake on 7/23/2008 ............... 92 Figure 63. Temperature and dissolved oxygen profiles for Martin Lake on 7/23/2008 ............ 96 Figure 64. Carlson’s Trophic State Index with Olin, Oliver, and Martin lakes indicated ........ 104 Figure 65. Northeastern bladderwort locations identified within Oliver, Olin, and Martin
lakes during the August 6, 2008 assessments ..................................................... 109 Figure 66. Dense curly-leaf pondweed and Eurasian watermilfoil locations identified within Oliver, Olin, and Martin Lakes during the 2008 assessments .................... 110 Figure 67. Locations sampled during the Oliver, Olin, and Martin Lakes Tier II
survey which occurred on May 29, 2008 .............................................................. 114 Figure 68. Eurasian watermilfoil locations in Oliver, Olin, and Martin Lakes as sampled
during the Tier II surveys which occurred on May 29, 2008. ................................ 115 Figure 69. Curly-leaf pondweed locations in Oliver, Olin, and Martin Lakes as sampled
during the Tier II surveys which occurred on May 29, 2008 ................................. 116 Figure 70. Locations sampled during the Oliver, Olin, and Martin Lakes summer Tier II
survey which occurred on August 6, 2008 ........................................................... 120
Oliver, Olin and Martin lakes Diagnostic Study October 16, 2009 LaGrange County, Indiana
File #070874.00 Page vi
Page Figure 71. Eurasian watermilfoil locations in Oliver, Olin, and Martin Lakes as sampled
during the summer Tier II survey which occurred on August 6, 2008 .................. 121 Figure 72. Example of Eurasian watermilfoil (Myriophyllum spicatum) ................................. 127 Figure 73. Example of Curly-leaf pondweed (Potamogeton crispus) .................................... 127 Figure 74. Example of Purple loosestrife (Lythrum salicaria) ................................................ 127 Figure 75. Example of Reed canary grass (Phalaris arundinacea) ....................................... 127 Figure 76. Perceived problems from Oliver, Olin, and Martin lake users .............................. 132 Figure 77. Water Budget Flow Chart for the Olin, Oliver and Martin Watershed ................... 137 Figure 78. Phosphorus loadings to Olin, Oliver and Martin lakes compared to acceptable
loadings determined from Vollenweider’s model .................................................. 141 Figure 79. Areas in the Oliver, Olin, and Martin lakes watershed that would benefit from watershed management technique installation ............................................ 143 Figure 80. Grass species suggested for shoreline planting along Oliver and Martin lakes .......................................................................................................... 150 Figure 81. Some forbs species suggested for shoreline planting along Oliver and Martin lakes ................................................................................................... 150 Figure 82. Example of Oliver Lake’s rooted plant community ............................................... 153 Figure 83. Example of the density of Eurasian watermilfoil along the shoreline of Martin Lake ....................................................................................................... 154 Figure 84. Example of an aquatic weed cutter designed to cut emergent weeds along the edge of ponds ................................................................................................. 157 Figure 85. Locations where aquatic macrophytes are often found on boats and trailers ...... 159 Figure 86. Aerial view of the seven sites sampled during the sediment survey .................... 161 Figure 87. Distribution of sediment survey sampling points with corresponding water and sediment depths at Site 1. Raw data can be found in Appendix I ................ 161 Figure 88. Shoreline erosion occurring at Site 2 on the west side of Oliver Lake ................. 163 Figure 89. Distribution of sediment survey sampling points with corresponding water and
sediment depths at Site 2 where shoreline erosion is occurring on the west shore of Oliver Lake. Raw data can be found in Appendix I ............................... 164 Figure 90. Distribution of sediment survey sampling points with corresponding water and
sediment depths in the channel connecting Olin and Oliver Lake Site 3. Raw data can be found in Appendix I ................................................................... 165 Figure 91. Distribution of sediment survey sampling points with corresponding water and
sediment depths at unnamed tributary to Oliver Lake, Site 4. Raw data can be found in Appendix I ................................................................................... 166 Figure 92. Distribution of sediment survey sampling points with corresponding water and
sediment depths at inlet to Olin Lake Site 5. Raw data can be found in Appendix I ............................................................................................................ 167 Figure 93. Distribution of sediment survey sampling points with corresponding water and
sediment depths at Martin Lake Site 6. Raw data can be found in Appendix I ............................................................................................................ 168 Figure 94. Aerial view of Site 7 at Martin Lake showing sampling points and corresponding water and sediment depths. Raw data can be found in Appendix I ............................................................................................................ 169
Oliver, Olin and Martin lakes Diagnostic Study October 16, 2009 LaGrange County, Indiana
File #070874.00 Page vii
TABLE OF TABLES PAGE
Table 1. Watershed and subwatershed sizes for the Oliver Lake watershed ........................... 6 Table 2. Watershed and subwatershed sizes for the Olin Lake watershed .............................. 8 Table 3. Watershed and subwatershed sizes for the Martin Lake watershed ......................... 10 Table 4. Monthly rainfall data (in inches) for year 2008 as compared to average monthly rainfall .......................................................................................................... 11 Table 5. Highly erodible and potentially highly erodible soil units in the Oliver, Olin, and Martin lakes watershed ...................................................................................... 15 Table 6. Soil types in the Oliver Lake watershed and the features restrictive to their
suitability to serve as a septic tank absorption field .................................................. 19 Table 7. Detailed land use in the Oliver Lake watershed ........................................................ 21 Table 8. Detailed land use in the Olin Lake watershed ........................................................... 23 Table 9. Detailed land use in the Martin Lake watershed ....................................................... 23 Table 10. Acreage and classification of wetland habitat in the Oliver, Olin, and Martin lakes watershed ........................................................................................................ 25 Table 11. List of prior studies conducted within the OOM chain ............................................... 30 Table 12. Location of stream sampling sites ............................................................................. 32 Table 13. Benthic Macroinvertebrate Scoring Criteria Used by IDEM ...................................... 38 Table 14. Physical characteristics of the Oliver, Olin, and Martin lakes watershed stream
samplings on 7/09/08 (storm flow) and 7/23/08 (base flow) ...................................... 40 Table 15. Chemical and bacterial characteristics of the Oliver, Olin, and Martin lakes watershed stream samplings on 7/09/08 (storm flow) and 7/23/08 (base flow) ........ 43 Table 16. Chemical and sediment load characteristics of the Oliver, Olin, and Martin lakes
watershed streams on July 9, 2008 (storm flow) and July 23, 2008 (base flow) ...... 48 Table 17. Classification Scores and mIBI Score for each sampling site directly entering
Oliver, Olin, and Martin lakes watershed, 7/23/08 ..................................................... 52 Table 18. QHEI Scores for the Oliver, Olin, and Martin lakes stream sampling sites, 07/23/08 ........................................................................................................... 52 Table 19. Lake characteristics for Oliver Lake .......................................................................... 58 Table 20. Lake characteristics for Olin Lake ............................................................................. 60 Table 21. Lake characteristics for Martin Lake .......................................................................... 62 Table 22. Summary of historic data for Oliver Lake .................................................................. 67 Table 23. Median and average transparencies measured in Oliver Lake from 1972 to
2007 .......................................................................................................................... 68 Table 24. Summary of historic data for Olin Lake ..................................................................... 73 Table 25. Median and average transparencies measured in Olin Lake from 1972 to
2007 .......................................................................................................................... 74 Table 26. Summary of historic data for Martin Lake .................................................................. 79 Table 27. Median and average transparencies measured in Martin Lake from 1972 to
2007 .......................................................................................................................... 80 Table 28. Water Quality Characteristics of Oliver Lake, 7/23/2008 ........................................... 87 Table 29. Oliver Lake plankton sample representing the species assemblage on
7/23/2008 .................................................................................................................. 90 Table 30. Water Quality Characteristics of Olin Lake, 7/23/2008 .............................................. 91 Table 31. Olin Lake plankton sample representing the species assemblage on
7/23/2008 .................................................................................................................. 94 Table 32. Water Quality Characteristics of Martin Lake, 7/23/2008 .......................................... 95 Table 33. Martin Lake plankton sample representing the species assemblage on
Oliver, Olin and Martin lakes Diagnostic Study October 16, 2009 LaGrange County, Indiana
File #070874.00 Page viii
PAGE Table 34. Mean values of some water quality parameters and their relationship to lake production. (after Vollenweider, 1975) ............................................................... 99 Table 35. Summary of arithmetic mean total phosphorus, total nitrogen, Secchi disk
transparency, and Chlorophyll a results for Oliver, Olin, and Martin lakes .............. 100 Table 36. Water Quality Characteristics of 456 Indiana Lakes Sampled From 1994 through
2004 by the Indiana Clean Lakes Program ............................................................. 100 Table 37. Comparison Factors* of Median for All Indiana Lakes over Olin, Oliver, and Martin lakes for Selected Water Parameters ........................................................... 100 Table 38. The Indiana Trophic State Index ............................................................................. 101 Table 39. Olin, Oliver, and Martin lakes: Historic Indiana Trophic State Index ....................... 103 Table 40. Tier II sampling strategy for the Oliver, Olin, and Martin Lakes using the 2007
Tier II protocol ......................................................................................................... 108 Table 41. Survey schedule of Tier II surveys .......................................................................... 108 Table 42. Aquatic plant species observed in Oliver Lake during the spring and summer
surveys completed May 29 and August 6, 2008 ..................................................... 111 Table 43. Aquatic plant species observed in Olin Lake during the spring and summer
surveys completed May 29 and August 6, 2008 ..................................................... 112 Table 44. Aquatic plant species observed in Martin Lake during the spring and summer
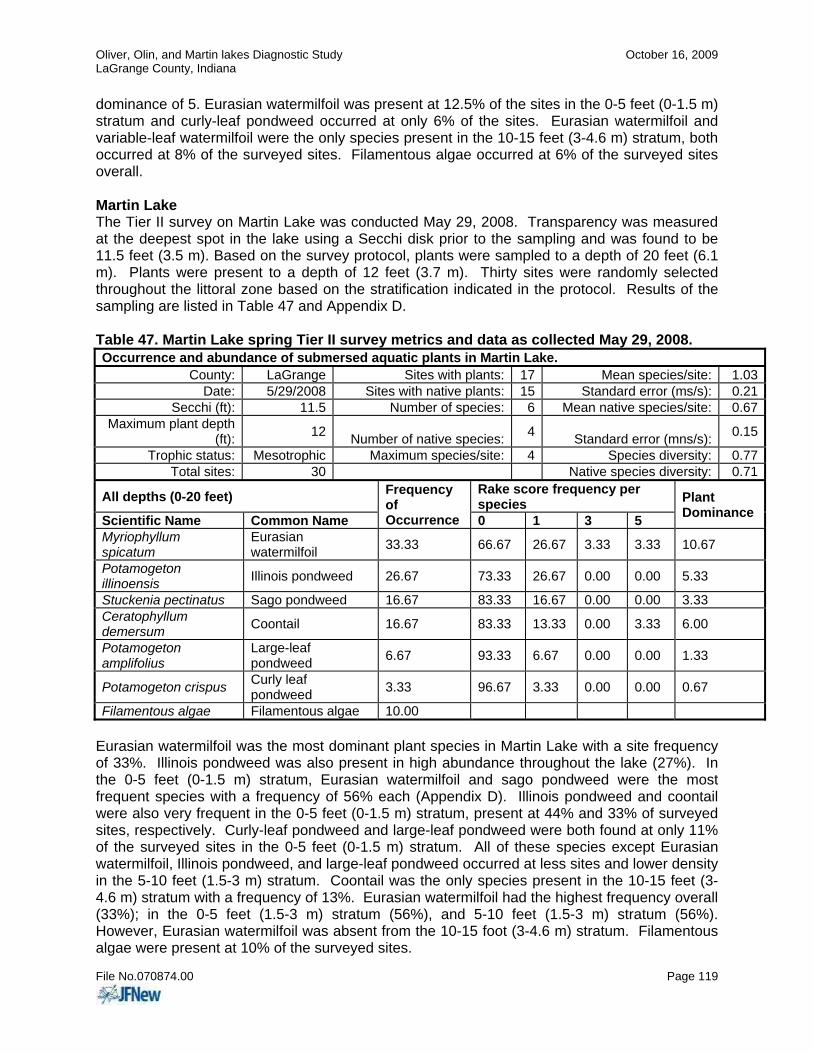
surveys completed May 29 and August 6, 2008 ..................................................... 113 Table 45. Oliver Lake spring Tier II survey metrics and data as collected May 29, 2008 ....... 117 Table 46. Olin Lake spring Tier II survey metrics and data as collected May 29, 2008 .......... 118 Table 47. Martin Lake spring Tier II survey metrics and data as collected May 29, 2008 ....... 119 Table 48. Oliver Lake summer Tier II survey metrics and data as collected
August 6, 2008 ........................................................................................................ 122 Table 49. Olin Lake summer Tier II survey metrics and data as collected
August 6, 2008 ........................................................................................................ 123 Table 50. Martin Lake summer Tier II survey metrics and data as collected
August 6, 2008 ........................................................................................................ 124 Table 51. A comparison of the aquatic plant communities in Oliver, Olin, and Martin lakes
to the average values for plant community metrics found by Pearson (2004) in his survey of 21 northern Indiana lakes ............................................................... 125 Table 52. Variation in site frequency and dominance of Eurasian watermilfoil and curly-leaf pondweed within Oliver, Olin, and Martin Lakes during all assessments ........................................................................................................... 126 Table 53. Water Budget Calculations for Olin Lake ................................................................ 133 Table 54. Water Budget Calculations for Oliver Lake ............................................................. 134 Table 55. Water Budget Calculations for Martin Lake ............................................................. 135 Table 56. Water Budget Summaries for Olin, Oliver, and Martin lakes ................................... 136 Table 57. Phosphorus Export Coefficients (units are kg/hectare except the septic category, which are kg/capita-yr) ............................................................................ 138 Table 58. Estimated External Phosphorus Loads (kg/yr) from Various Sources .................... 138 Table 59. Areal Phosphorus Loading Rates Determined from Models ................................... 139 Table 60. Little Evidence of Internal Phosphorus Loading in Martin Lake .............................. 140 Table 61. Phosphorus Reduction Required to Achieve Acceptable Phosphorus Loading Rate and a Mean Lake Concentration of 0.03 mg/L .................................. 140 Table 62. Results of the Oliver, Olin, and Martin lakes watershed tour conducted April 4, 2008 ............................................................................................................ 144 Table 63. Average water and sediment depth for each site sampled during the sediment
Oliver, Olin and Martin lakes Diagnostic Study October 16, 2009 LaGrange County, Indiana
File #070874.00 Page ix
TABLE OF APPENDICES
Appendix A. Endangered, threatened, and rare species list Appendix B. QHEI and macroinvertebrate data Appendix C. Volunteer lake water quality monitoring data Appendix D. Tier II aquatic plant survey data from spring and summer assessments Appendix E. Fish species Appendix F. 2008 lake use survey Appendix G. 2008 watershed tour summary and results Appendix H. Potential shoreline buffer species Appendix I. Sediment sampling data Appendix J. Potential funding sources
Oliver, Olin, and Martin lakes Diagnostic Study October 16, 2009 LaGrange County, Indiana
File No.070874.00 Page 1
1.0 INTRODUCTION Oliver, Olin, and Martin lakes are 391.9-acre, 101.4-acre, and 25.6-acre (158.6-ha, 41-ha, and 10.4-ha), respectively, natural lakes that lie in the southeast portion of LaGrange County, Indiana (Figure 1). Specifically, the lakes are located in Sections 17, 18, 19, 20, and 21 of Township 36 North, Range 10 East in LaGrange County. Together, the lakes create the Oliver, Olin, and Martin (OOM) lakes watershed, which stretches out to the north and east of the lakes, encompassing approximately 6,856 acres (2,774.6 ha or 10.7 square miles; Figure 2). Water flows from Martin Lake to Olin Lake and into Oliver Lake before discharging out of Oliver Lake’s outlet in the southwest corner (Figure 3). Water from Oliver Lake’s outlet flows southwest into Hackenburg and Messick lakes. Water from Messick Lake discharges into the North Branch of the Elkhart River, which flows south and west to the Elkhart River. The Elkhart River flows northwest and discharges into the St. Joseph River in Elkhart, Indiana and eventually discharges into Lake Michigan at St. Joseph/Benton Harbor.
Figure 1. General location of the Oliver, Olin, and Martin lakes watershed. Source: DeLorme, 1998.
PROJECT LOCATION
Oliver, Olin, and Martin lakes Diagnostic Study October 16, 2009 LaGrange County, Indiana
File No.070874.00 Page 2
Figure 2. Oliver, Olin, and Martin lakes watershed.
Oliver, Olin, and Martin lakes Diagnostic Study October 16, 2009 LaGrange County, Indiana
File No.070874.00 Page 3
Figure 3. Individual lake watersheds for the Oliver, Olin, and Martin lakes watershed. Oliver, Olin, and Martin lakes have historically exhibited good water quality and are considered one of Indiana’s least developed lake chains. In fact, Olin Lake is the largest lake in Indiana to be undeveloped. This lack of development has help maintain good water quality and preserve the natural beauty of the lakes. Historical records from the past 35 years show that OOM chain Secchi disk transparencies (a measure of water clarity) have been consistently greater than 9 or 10 feet (2.7 m and 3.0 m) compared to a regional median of less than 6.9 feet (2.1 m). Additionally, nutrient levels have remained relatively low over the past 35 years in the OOM chain. Total phosphorous (often the limiting nutrient for overall productivity) concentrations in OOM are below the state wide median value. Primary productivity of the lakes (algae and plant growth) has been low as well. Chlorophyll a concentrations (an indicator of algae production) in the OOM chain have never exceeded the state median value except during three sampling events at Martin Lake. The combination of low nutrient levels and overall morphology of the three lakes limit the potential for the establishment and flourishing of aquatic plant communities in the OOM chain. In general, the area within the lakes able to support a rooted plant community is between one-fourth and one-third the total area of each lake. The aquatic plant community that exists within the OOM chain is more diverse than most other lakes in the lakes in the region. (There was the recent discovery of a plant species once thought to be extirpated from Indiana waters). The physical and chemical characteristics of the lakes are also central in determining the fish
Oliver, Olin, and Martin lakes Diagnostic Study October 16, 2009 LaGrange County, Indiana
File No.070874.00 Page 4
community. The fish community in the OOM chain is unique to most other fish communities in Indiana because it is managed for coldwater species. Warmwater species such as bluegill and largemouth bass are present in the chain, but due to a lack of suitable habitat are only present in a limited abundance. Brown trout, a coldwater species, is currently stocked annually in the OOM chain. Trout do not naturally exist in the OOM chain or exhibit natural reproduction; therefore, trout populations are maintained through stocking efforts. Cisco, a member of the Salmonidae (Salmon) family, once abundant in the OOM chain is thought to be extirpated from the fishery. In fact, Martin Lake and Olin Lake historically contained some of the most abundant populations of cisco in the state of Indiana as reported by Gulish (1975). Not unique to the OOM chain, the loss of cisco populations throughout Indiana has been a concern. Lose of suitable habitat due to eutrophication is often associated with this trend. Historical dissolved oxygen (D.O) and temperature profiles in Oliver, Olin, and Martin Lakes have consistently provided suitable year round habitat for cisco. The reason for the loss of the species in the OOM chain has not been determined. Despite the lakes’ excellent water quality and their ability to provide unique fishing, lake residents, particularly long-time residents, became interested in documenting and assessing the health of the lakes and their watersheds. The Oliver and Martin Lakes Improvement and Conservation Association initiated an Indiana Department of Natural Resources (IDNR) Lake and River Enhancement (LARE) program diagnostic study. The purpose of the diagnostic study was to describe the conditions and trends in Oliver, Olin, and Martin Lakes and their watershed, identify potential problems, and make prioritized recommendations addressing these problems. The study consisted of a review of historical studies, interviews with lake residents and state/local regulatory agencies, the collection of current water quality data, pollutant modeling, and field investigations. In order to obtain a broad understanding of the water quality in Oliver, Olin, and Martin Lakes and the water entering the lakes, the diagnostic study included an examination of the lake and inlet stream water chemistry and their biotic communities (macroinvertebrates, plankton, macrophytes) which tend to reflect the long-term trends in water quality. The lake and inlet streams’ habitat was also assessed to help distinguish between water quality and habitat effects on the existing biotic communities. This report documents the results of the study. 2.0 WATERSHED CHARACTERISTICS 2.1 Topography and Physical Setting Oliver, Olin, and Martin lakes are headwaters lakes in the Great Lakes Basin. The lakes and the 6,856 acre (2,774.6-ha) watershed lies north of the north-south continental divide. Similar to its more famous cousin, the east-west Continental Divide, which divides the United States into two watersheds, one that drains to the Atlantic Ocean and one that drains to the Pacific Ocean, the north-south continental divide separates the Mississippi River Basin (land that drains south to the Mississippi River) from the Great Lakes Basin (land that drains north to the Great Lakes). As part of the St. Joseph River Basin, water from Oliver, Olin, and Martin lakes flows southwest through LaGrange County as the North Branch of the Elkhart River, which discharge into the Elkhart River near Ligonier, Indiana. The Elkhart River flows northwest and discharges into the St. Joseph River in Elkhart, Indiana, which eventually discharges into Lake Michigan at St. Joseph/Benton Harbor, Michigan. The topography of the OOM Lakes watershed reflects the geological history of the watershed. The highest areas of the watershed lie along the watershed’s northern and eastern edges, where the Erie Lobe of the last glacial age left end moraines. Along the watershed’s eastern boundary, the elevation nears 1,000 feet (304.8 m) above mean sea level. The ridges along the
Oliver, Olin, and Martin lakes Diagnostic Study October 16, 2009 LaGrange County, Indiana
File No.070874.00 Page 5
watershed’s northern boundary are nearly as high (930 to 991 feet msl (283 m – 302 m)), but are less steep than the ridge along the eastern watershed boundary. The watershed’s southwestern boundary occupies a lower elevation in the watershed, ranging between 910 feet msl (277 m) and 940 feet msl (287 m). Oliver, Olin, and Martin lakes, each at elevation 900 feet (274 m) above mean sea level, are the lowest points in the watershed. Figure 4 presents a topographical relief map of the Oliver Lake watershed.
Figure 4. Topographical map of the Oliver, Olin, and Martin lakes watershed. 2.1.1 Oliver Lake Surface water drains to Oliver Lake via five primary routes: through Dove Creek, through Bert Hart Ditch which enters along the eastern shoreline, through an unnamed tributary just south of Bert Hart Ditch on the eastern shoreline, from the Olin and Martin lakes subwatershed, and via direct drainage. Dove Creek drains approximately 1,430.3 acres (578.8 ha or 20.9%) of the watershed north of Oliver Lake (Table 1). This stream empties into Oliver Lake in the lake’s northwest corner. This drain is a legal drain, which means that the drain is maintained by the drainage board and any activity in and around the drain must be approved by the drainage board prior before construction. Bert Hart Ditch transports water to Oliver Lake from the watershed northeast of the lake emptying into the lake along its eastern boundary. In total, this tributary drains 339.6 acres (137.4 ha or 5%) of the Oliver Lake watershed (Table 1). This drain is also a legal drain. An unnamed tributary empties into Oliver Lake on the eastern shoreline just to the south of Bert Hart Ditch and drains approximately 733.6 acres (296.9 ha or 10.7%) of the
Oliver, Olin, and Martin lakes Diagnostic Study October 16, 2009 LaGrange County, Indiana
File No.070874.00 Page 6
Oliver Lake watershed (Table 1). The subwatershed containing Olin and Martin Lakes drains approximately 3,463 acres (1,401.4 ha or 50.5%) of the Oliver Lake watershed (Table 1). Direct drainage to Oliver Lake accounts for 7.3% of the Oliver Lake watershed (497.6 acres; 201.4 ha) (Table 1). Oliver Lake, at 391.9 acres (158.6 ha), comprises approximately 5.7% of the watershed. Figure 5 illustrates the boundaries of each of these subwatersheds of Oliver Lake.
Figure 5. Oliver Lake subwatersheds. Table 1. Watershed and subwatershed sizes for the Oliver Lake watershed.
Subwatershed/Lake Area (acres)
Area (hectares) Percent of Watershed
Unnamed tributary 733.6 296.9 10.7 Dove Creek 1,430.3 578.8 20.9% Bert Hart Ditch 339.6 137.4 5.0% Olin Lake and Martin Lake watersheds 3,463.0 1,401.4 50.5% Area draining directly to Oliver Lake 497.6 201.4 7.3% Watershed Draining to Lake 6,464.1 2,615.9 94.3% Oliver Lake 391.9 158.6 5.7% Total Watershed 6,856.0 2,774.5 100% Watershed to Lake Area Ratio 17.5:1
Oliver, Olin, and Martin lakes Diagnostic Study October 16, 2009 LaGrange County, Indiana
File No.070874.00 Page 7
Table 1 also provides the watershed area to lake area ratio for Oliver Lake. Watershed size and watershed to lake area ratios can affect the chemical and biological characteristics of a lake. For example, lakes with large watersheds have the potential to receive greater quantities of pollutants (sediments, nutrients, pesticides, etc.) from runoff than lakes with smaller watersheds. For lakes with large watershed to lake ratios, watershed activities can potentially exert a greater influence on the health of the lake than lakes possessing small watershed to lake ratios. Conversely, for lakes with small watershed to lake ratios, shoreline activities and internal lake processes may have a greater influence on the lake’s health than lakes with large watershed to lake ratios. Oliver Lake possesses a watershed area to lake area ratio of approximately 17.5:1 (Table 1). This is a relatively normal but when compared to other lakes in northern Indiana. Many glacial lakes have watershed area to lake area ratios of less than 50:1 and watershed area to lake area ratios between 10:1 and 30:1 are fairly common (Vant, 1987). Conversely, Lake Tippecanoe, Ridinger Lake, and Smalley Lake, glacial lakes in the Upper Tippecanoe River watershed in Kosciusko, Noble, and Whitley Counties, possess watershed area to lake area ratios of 93:1, 165:1, and 248:1, respectively. All of these lakes have extensive watersheds compared to Oliver Lake. In terms of lake management, Oliver Lake’s watershed area to lake area ratio means that near lake (i.e. shoreline) and watershed-based activities and processes can potentially exert a significant influence on the health of Oliver Lake. Consequently, implementing best management practices along the lake’s shoreline, such as maintaining native, emergent vegetated buffers between the lakeside residences and the lake, should be given equal attention as other watershed best management practices. If the watershed area to lake area ratio were larger, there would be more evidence to focus on primarily on watershed-based activities. 2.1.2 Olin Lake Surface water drains to Olin Lake via three primary routes: via Stoner Ditch, from the Martin Lake subwatershed, and via direct drainage. Stoner Ditch drains approximately 218.8 acres (88.5 ha or 6.3%) of the Olin Lake watershed and enters Olin Lake from the northeast emptying along the lake’s north shore (Table 2). Stoner Ditch is a legal drain. The subwatershed containing Martin Lake drains approximately 2,869.9 acres (1,161.4 ha or 82.9%) of the Olin Lake watershed (Table 2). Direct drainage to Olin Lake accounts for approximately 7.8% (271.2 acres; 109.8 ha) of the land in the Olin Lake watershed (Table 2). Olin Lake, at 101.4 acres (41 ha) accounts for 2.9% of the watershed (Table 2). Figure 6 illustrates the boundaries of each of these subwatersheds of Olin Lake.
Oliver, Olin, and Martin lakes Diagnostic Study October 16, 2009 LaGrange County, Indiana
File No.070874.00 Page 8
Figure 6. Olin Lake subwatersheds. Table 2. Watershed and subwatershed sizes for the Olin Lake watershed.
Subwatershed/Lake Area (acres)
Area (hectares) Percent of Watershed
Stoner Ditch 218.8 88.5 6.3% Martin Lake watershed 2,869.9 1,161.4 82.9% Area draining directly to Olin Lake 271.2 109.8 7.8% Watershed Draining to Lake 3,359.9 1,359.7 97.1% Olin Lake 101.4 41.0 2.9% Total Watershed 3,461.3 1,400.7 100% Watershed to Lake Area Ratio 34.1:1 Like Oliver Lake, Olin Lake possesses a relatively average watershed area to lake area ratio (34.1:1) (Table 2). Olin Lake’s watershed area to lake area ratio is typical for glacial lakes (Vant, 1987). In terms of lake management, Olin Lake is somewhat unique to Indiana because it is completely undeveloped. Typical near shore influences such as residential housing on the lake or shoreline modification should not be affecting the lake. Protecting and improving water quality in Olin Lake should focus on the Olin Lake watershed and the upstream influence of Martin Lake and its watershed.
Oliver, Olin, and Martin lakes Diagnostic Study October 16, 2009 LaGrange County, Indiana
File No.070874.00 Page 9
2.1.3 Martin Lake Surface water drains to Martin Lake via three primary routes: through Truman Flint Ditch, which drains from the northeast into the east end of the lake, through an unnamed tributary, which drains from the southeast into the east end of the lake, and via direct drainage. Truman Flint Ditch drains 745.5 acres (301.5 ha or 26%) of the Martin Lake watershed and is a legal drain. (Table 3). An unnamed tributary drains approximately 2,017.4 acres (816.4 ha or 70.4%) of the Martin Lake watershed (Table 3). Direct drainage to Martin Lake accounts for 2.7% of the (76.5 acres; 31.0 ha) of the land in the Martin Lake watershed (Table 3). Martin Lake, at 25.6 acres (10.4 ha), comprises 0.9% of the watershed (Table 3). Figure 7 illustrates the boundaries of each of these subwatersheds of Martin Lake.
Figure 7. Martin Lake subwatersheds.
Oliver, Olin, and Martin lakes Diagnostic Study October 16, 2009 LaGrange County, Indiana
File No.070874.00 Page 10
Table 3. Watershed and subwatershed sizes for the Martin Lake watershed.
Subwatershed/Lake Area (acres)
Area (hectares) Percent of Watershed
Unnamed tributary 2,017.4 816.4 70.4% Truman Flint Ditch 745.5 301.5 26.0% Area draining directly to Martin Lake 76.5 31.0 2.7% Watershed Draining to Lake 2,839.4 1,149.1 99.1% Martin Lake 25.6 10.4 0.9% Total Watershed 2,865.0 1,159.4 100% Watershed to Lake Area Ratio 111.9:1 Unlike Oliver and Olin Lakes, Martin Lake possesses a relatively large watershed area to lake area ratio (111.9:1) (Table 3). This ratio is large for glacial lakes, and is more typical of reservoirs, where the watershed area to reservoir area ration typically ranges from 100:1 to 300:1 (Vant, 1987). This ratio is also relatively large compared to other lakes in the area. In terms of lake management, Martin Lake’s large watershed area to lake area ratio means that watershed activities and processes can potentially exert a significant influence on the health of Martin Lake. Consequently, implementing best management practices within the lake’s watershed should rank high when prioritizing management options. This does not mean that in-lake management should be ignored. Near shore management practices, such as maintaining native, emergent vegetated buffers between the lakeside residences and the lake, should receive special attention; however, the relatively large watershed area to lake area ratio should be considered when prioritizing the use of limited funds for lake management. 2.2 Climate Indiana Climate Indiana’s climate can be described as temperate with cold winters and warm summers. The National Climatic Data Center summarizes Indiana weather well in its 1976 Climatology of the United States document no. 60: “Imposed on the well known daily and seasonal temperature fluctuations are changes occurring every few days as surges of polar air move southward or tropical air moves northward. These changes are more frequent and pronounced in the winter than in the summer. A winter may be unusually cold or a summer cool if the influence of polar air is persistent. Similarly, a summer may be unusually warm or a winter mild if air of tropical origin predominates. The action between these two air masses of contrasting temperature, humidity, and density fosters the development of low-pressure centers that move generally eastward and frequently pass over or close to the state, resulting in abundant rainfall. These systems are least active in midsummer and during this season frequently pass north of Indiana” (National Climatic Data Center, 1976). Prevailing winds in Indiana are generally from the southwest but are more persistent and blow from a northerly direction during the winter months. Oliver, Olin, and Martin lakes Watershed Climate The climate of the Oliver, Olin, and Martin lakes watershed is characterized as having four well-defined seasons of the year. Winter temperatures average 27º F (-2.7º C), while summers are warm with temperatures averaging 71º F (21.7º C). The growing season typically begins in early April and ends in September. Yearly annual rainfall averages 36.7 inches (93.2 cm) (Table 4). Winter snowfall averages about 33 inches (83.82 cm). During summers, relative humidity varies from about 65 percent in mid-afternoon to near 80 percent at dawn. Prevailing winds typically blow from the southwest except during the winter when westerly and northwesterly winds predominate. In 2008, almost 30.15 inches (76.6 cm) of precipitation (Table 4) was recorded at a co-operative weather station in Kendallville, Noble County. This is slightly less
Oliver, Olin, and Martin lakes Diagnostic Study October 16, 2009 LaGrange County, Indiana
File No.070874.00 Page 11
than the average annual precipitation for LaGrange County. A weather station located at Prairie Heights High School in LaGrange County was not used due to an absence of data from January 2008 through April 2008. Table 4. Monthly rainfall data (in inches) for 2008 as compared to average monthly rainfall.
Jan Feb Mar Apr May Jun Jul Aug Sept Oct Nov Dec Total2008 2.39 3.53 1.33 1.90 1.90 3.97 3.32 1.78 4.87 1.80 1.47 1.89 30.15
Average 1.79 1.76 2.67 3.34 3.63 4.17 3.59 4.00 3.46 2.79 2.89 2.61 36.70All data were recorded at a weather station in Kendallville, Whitley County. Averages are 30-year normal based on available weather observations taken during the years of 1971-2000 at Prairie Heights High School (Purdue Applied Meteorology Group, 2008). 2.3 Geology The advance and retreat of the glaciers in the last ice age (the Wisconsin Age) removed, shaped and reshaped much of the landscape found in Indiana today. In the northern portion of the state, ground moraines, end moraines, lake plains, outwash plains, and other geologically complex features dominate the landscape. Further, the interaction of three glacial lobes, (Michigan Lobe, Saginaw Lobe, and the Erie Lobe, respectively) left behind a vast array of deposits and landforms that changed the region’s hydrogeology. In comparison to the central portion of the state, surface water, groundwater and soils are more varied and complex. Large raised landforms, such as the Valparaiso Moraine, the Maxinkuckee Moraine, and the Packerton Moraine, indicate the glacial margins of these ice sheets in the northern portion of the state. Major rivers in northern Indiana cut through course grained outwash and transect these dominant topographical features, suggesting a drainage pattern that was established in an ice proximal and or subglacial environment. Later, outwash plains formed as the glacial melt waters flowed from retreating glaciers. This further altered the drainage of the landscape as dams between ice, morainal deposits and melt water pooled into lakes. As a result, lake plains and kettle lakes formed as stagnant water settled out and deposited silt and clay (Brown, et al, 1998). The movement, stagnation, and melting of the Saginaw Lobe of the Wisconsin glacial age is largely responsible for the landscape covering the Oliver Lake watershed. The Saginaw glacial lobe moved out of Canada toward the southwest carrying a mixture of Canadian and Michigan basin bedrock with it. The Packerton Moraine and the Maxinkuckee Moraine mark the extent of the Saginaw Lobe’s coverage in northern Indiana. The Oliver Lake watershed lies within Malott’s Steuben Morainal Lake Area (Schneider, 1966.) In addition to these major moraines, the Saginaw Lobe also deposited many unnamed end moraines. The ridge that separates the Oliver Lake watershed from the headwaters of the Pigeon River watershed to the north is part of one end moraine left by the Saginaw Lobe while a similar ridge along the southern edge of the larger Five Lakes watershed, which contains the Oliver Lake watershed, represents another. Gravel lithologies indicate that the Erie and Saginaw Lobes deposited sediments and modified existing landforms in the area. Oliver, Olin, and Martin lakes are good examples of deep (relative to many lakes in the region) kettle lakes lying in an end moraine. They are part of the “knob and kettle” topography that is characteristic of end moraines. These ice block depressions occur in moraine deposits that were later sculpted by water from the melting Erie Lobe of ice (Brown and Jones, 1999). Surficial geology indicates that Oliver, Olin and Martin lakes lie within glacial till material. Glacial drift covers the Oliver Lake watershed to a depth of 300 to 400 feet (91 to 122 m; Wayne, 1966).
Oliver, Olin, and Martin lakes Diagnostic Study October 16, 2009 LaGrange County, Indiana
File No.070874.00 Page 12
The watershed’s surficial geology originates from silty clay loam and clay loam till materials. The bedrock underlying the watershed’s glacial deposits includes Coldwater shale to a depth of 90 and 350 feet (27 to 107 m). Beneath that, the underlying bedrock is a broad lowland, which formed on Upper Devonian and Lower Mississippian shales (Wayne, 1966; Gutschick, 1966). 2.4 Soils Before detailing the major soil associations covering the OOM lakes watershed, it may be useful to examine the concept of soil associations. Major soil associations are determined at the county level. Soil scientists review the soils, relief, and drainage patterns on the county landscape to identify distinct proportional groupings of soil units. The review process typically results in the identification of eight to fifteen distinct patterns of soil units. These patterns are the major soil associations in the county. Each soil association typically consists of two or three soil units that dominate the area covered by the soil association and several soil units that occupy only a small portion of the soil association’s landscape. Soil associations are named for their dominant components. For example, the Wawasee-Hillsdale-Conover soil association consists primarily of Wawasee fine sandy loam, Hillsdale sandy loam, and Conover loam. One major soil association, the Wawasee-Hillsdale-Conover soil association, covers most of the OOM lakes watershed; the Boyer-Oshtemo soil association and the Houghton-Adrian soil association each cover a relatively small portion of the OOM lakes watershed (Figure 8). The following discussion on soil associations in the OOM lakes watershed relies heavily on the Soil Survey of LaGrange County (Hillis, 1980). Readers should refer to this source for a more detailed discussion of soil associations covering LaGrange County.
Oliver, Olin, and Martin lakes Diagnostic Study October 16, 2009 LaGrange County, Indiana
File No.070874.00 Page 13
Figure 8. Soil associations in the Oliver, Olin, and Martin lakes watershed. The Wawasee-Hillsdale-Conover soil association covers 4,785.5 acres (1,936.6 ha) of the OOM lakes watershed. The Wawasee-Hillsdale-Conover soil association is the most plentiful association in LaGrange County, covering 34% of the County. Soils in this soil association developed from glacial till and occur on till plains and moraines. Thirty percent of the soil association consists of Wawasee soils, while Hillsdale soils cover 17% and Conover soils cover 14%. Wawasee soils are well drained and occur on knobs and breaks between drainageways. Hillsdale soils are also well drained soils; however, they are typically found on ridges between drainageways and on level till plains. Conover soils are typically located on broad flats or along drainageways and are somewhat poorly drained. Boyer loamy sand, Oshtemo loamy sand, Chelsea fine sand, Metea loamy sand, and Martinsville sandy loam soils are minor components of this association. Whitaker soils are common on low areas in the landscape, while Rensselaer soils are located in depressions and drainageways and Houghton soils are found in low-lying pockets and deep depressions. Cultivated cropland, pasture, woodland, and housing or other urban uses are the typical uses for areas mapped in this association (Hillis, 1980). Soils in this association are well suited to crop production. However, erosion is a major hazard especially on the sloping, well-drained soils of this association. Low available water capacity limits Hillsdale soils, while Conover soils are limited by wetness. Many of the soils in the Wawasee-Hillsdale-Conover soil association have severe limitations when used as a septic tank absorption field. As a consequence, this soil
Oliver, Olin, and Martin lakes Diagnostic Study October 16, 2009 LaGrange County, Indiana
File No.070874.00 Page 14
association is not well suited for residential developments which utilize septic systems for wastewater treatment. The Boyer-Oshtemo soil association covers 1,225.7 acres (496 ha) of the OOM lakes watershed and is located on the eastern boundary of the watershed (Figure 8). The Boyer-Oshtemo soil association covers about 30% of LaGrange County. Thirty-nine percent of the soil association consists of Boyer soils and 33% Oshtemo soils. The remaining 28% of the soil association is made of a minor extent of Adrian and Houghton soils in the deeper depressions and low-lying pockets; the Brady, Homer, and Bronson soils on slightly lower positions in the landscape; the Gilford and Sebewa soils in depressions on the outwash flats and along large drainageways; and the Hillsdale and Chelsea soils on moraines. Most areas consisting of Boyer-Oshtemo soil association are used for the production of cultivated crops or pasture.
The Houghton-Adrian soil association forms the southern shoreline of Olin and Martin lakes and covers some of the southern portion of Oliver Lake and accounts for 370.8 acres (150.1 ha) of the OOM lakes watershed. The Houghton-Adrian soil association is a minor component of the soils in LaGrange County, covering 6% of the county. Nearly level, very poorly drained muck soils dominate the Houghton-Adrian soil association. These soils developed from partially decaying organic matter that accumulated in depressional areas on uplands and outwash plains, till plains and moraines. Generally, Houghton soils account for 51% of the association, and Adrian soils cover 18% of the association; the remaining 31% is soils of minor extent. Typically, corn or soybeans are grown on soils of the Houghton-Adrian association; however, specialty crops such as mint, blueberries, sweet corn, potatoes, and onions are also grown on this association throughout the County. Soils in this association have severe limitations for use as septic system absorption fields due to wetness, while wind erosion limits the usability of these soils for row crop agriculture when drained. 2.4.1 Highly Erodible Soils Soils that erode from the landscape are transported to waterways where they degrade water quality, interfere with recreational uses, and impair aquatic habitat and health. In addition, such soils can carry attached nutrients, which further impair water quality by increasing production of plant and algae growth. Soil-associated chemicals, like some herbicides and pesticides, can kill aquatic life and damage water quality. Highly erodible and potentially highly erodible are classifications used by the Natural Resources Conservation Service (NRCS) to describe the potential of certain soil units to erode from the landscape. The NRCS examines common soil characteristics such as slope and soil texture when classifying soils. The NRCS maintains a list of highly erodible soil units for each county. Table 5 lists and Figure 9 displays the soil units in the OOM lakes watershed that the NRCS considers to be highly erodible and potentially highly erodible.
Oliver, Olin, and Martin lakes Diagnostic Study October 16, 2009 LaGrange County, Indiana
File No.070874.00 Page 15
Table 5. Highly erodible and potentially highly erodible soil units in the OOM lakes watershed.
Soil Unit Status Soil Name Soil Description BoC PHES Boyer loamy sand 6-12% slopes BoD PHES Boyer loamy sand 12-18% slopes ChC PHES Chelsea fine sand 6-12% slopes HdC PHES Hillsdale sandy loam 6-12% slopes MeC PHES Metea loamy sand 6-12% slopes OsC PHES Oshtemo loamy sand 6-12% slopes OsE HES Oshtemo loamy sand 18-25% slopes OuC PHES Oshtemo-Hillsdale-Chelsea complex 6-12% slopes
Note: PHES stands for potentially highly erodible soil and HES stands for highly erodible soil.
Figure 9. Highly erodible and potentially highly erodible soils within the Oliver, Olin, and Martin lakes watershed.
Oliver, Olin, and Martin lakes Diagnostic Study October 16, 2009 LaGrange County, Indiana
File No.070874.00 Page 16
Highly erodible (HES) and potentially highly erodible soil (PHES) units in the form of Boyer loamy sand, Chelsea fine sand, Hillsdale sandy loam, Metea loamy sand, Oshtemo loamy sand, Oshtemo-Hillsdale-Chelsea complex, and Wawasee fine sandy loam and loam soils cover portions of the OOM lakes watershed. Areas of the watershed that are mapped in these soil units and have gentle slopes are considered only slightly limited for agricultural production. As slope increases, the severity of the limitation increases. Some steeply sloped Oshtemo and Wawasee soils are considered unsuitable for agricultural production due to erosion hazard. The erosion hazard would also exist during residential development on these soils. As Figure 9 indicates, highly erodible soils located on the most steeply sloped areas (HES) cover approximately 15 acres (6.1 ha) or 0.2% of the OOM lakes watershed. These soils are located in three areas of the watershed. Potentially highly erodible soils on steep-sloped soils (PHES) cover approximately 519 acres (210 ha) or 8% of the watershed. This acreage is spread throughout the watershed, and, in many cases, is located on the slopes bordering the low-lying portions of the watershed. 2.4.2 Soils Used for Septic Tank Absorption Fields Nearly half of Indiana’s population lives in residences having private waste disposal systems. As is common in many areas of Indiana, septic tanks and septic tank absorption fields are utilized for wastewater treatment throughout the OOM lakes watershed. The shorelines of Oliver and Martin lakes are exceptions to this. Wastewater from all of the residences directly adjacent to these lakes is treated by a sewer system owned and operated by the LaGrange County Regional Utility District. The sewer system treats wastewater from residences along the entire shorelines of both Oliver and Martin lakes. Wastewater from the LaGrange County Regional Utility District is transported to the wastewater treatment plant. Once treated, effluent is discharged to Turkey Creek eventually reaching the Pigeon River. Much of the wastewater from the remainder of the OOM lakes watershed is still primarily treated by private waste disposal systems. Private waste disposal systems rely on the septic tank for primary treatment to remove solids and the soil for secondary treatment to reduce the remaining pollutants in the effluent to levels that protect surface and groundwater from contamination. The soil’s ability to sequester and degrade pollutants in septic tank effluent will ultimately determine how well surface and groundwater is protected. While all septic system use in the OOM lakes watershed has the potential to impact the water quality of Oliver, Olin, and Martin lakes, the ability of the soil immediately adjacent to each of these lakes to treat septic effluent has a more direct effect on the lakes’ water quality than the ability of the soil in other areas of the watershed. For example, the soils directly adjacent to the Oliver Lake have a more direct effect on Oliver Lake than the soils in other areas of the watershed. Likewise, the soils directly adjacent to Martin Lake have a more direct effect on the water quality within Martin Lake. Nonetheless, soils throughout the watershed impact water quality within Oliver, Olin, and Martin lakes. A variety of factors can affect a soil’s ability to function as a septic absorption field. Seven soil characteristics are currently used to determine soil suitability for on-site sewage disposal systems: position in the landscape, slope, soil texture, soil structure, soil consistency, depth to limiting layers, and depth to seasonal high water table (Thomas, 1996). The ability of soil to treat effluent (waste discharge) depends on four factors: the amount of accessible soil particle surface area; the chemical properties of the soil particle’s surface; soil conditions like temperature, moisture, and oxygen content; and the types of pollutants present in the effluent (Cogger, 1989).
Oliver, Olin, and Martin lakes Diagnostic Study October 16, 2009 LaGrange County, Indiana
File No.070874.00 Page 17
The amount of accessible soil particle surface area depends both on particle size and porosity. Because they are smaller, clay particles have a greater surface area per unit volume than silt or sand; and therefore, a greater potential for chemical activity. However, soil surfaces only play a role if wastewater can contact them. Soils of high clay content or soils that have been compacted often have few pores that can be penetrated by water and are not suitable for septic systems because they are too impermeable. Additionally, some clay soils swell and expand on contact with water closing the larger pores in the profile. On the other hand, very coarse soils may not offer satisfactory effluent treatment either because the water can travel rapidly through the soil profile. Soils located on sloped land also may have difficulty in treating wastewater due to reduced contact time. Chemical properties of the soil surfaces are also important for wastewater treatment. For example, clay materials have imperfections in their crystal structure which gives them a negative charge along their surfaces. Due to their negative charge, they can bond cations of positive charge to their surfaces. However, many pollutants in wastewater are also negatively charged and are not attracted to the clays. Clays can help remove and inactivate bacteria, viruses, and some organic compounds. Environmental soil conditions influence the microorganism community which ultimately carries out the treatment of wastewater. Factors like temperature, moisture, and oxygen availability influence microbial action. Excess water or ponding saturates soil pores and slows oxygen transfer. The soil may become anaerobic if oxygen is depleted. Decomposition process (and therefore, effluent treatment) becomes less efficient, slower, and less complete if oxygen is not available. Also, some sewage organisms only thrive under anaerobic conditions. Many of the nutrients and pollutants of concern are removed safely if a septic system is sited correctly. Most soils have a large capacity to hold phosphate. On the other hand, nitrate (the end product of nitrogen metabolism in a properly functioning septic system) is very soluble in soil solution and is often leached to the groundwater. Care must be taken in siting the system to avoid well contamination. Nearly all organic matter in wastewater is biodegradable as long as oxygen is present. Pathogens can be both retained and inactivated within the soil as long as conditions are right. Bacteria and viruses are much smaller than other pathogenic organisms associated with wastewater; and therefore, have a much greater potential for movement through the soil. Clay minerals and other soil components may adsorb bacteria and viruses, but retention is not necessarily permanent. During storm flows, bacteria and viruses may become re-suspended in the soil solution and transported throughout the soil profile. Inactivation and destruction of pathogens occurs more rapidly in soils containing oxygen because sewage organisms compete poorly with the natural soil microorganisms, which are obligate aerobes requiring oxygen for life. Sewage organisms live longer under anaerobic conditions without oxygen and at lower soil temperatures because natural soil microbial activity is reduced. Taking into account the various factors described above, the NRCS ranks each soil series in the OOM lakes watershed in terms of its limitations for use as a septic tank absorption field. Each soil series is placed in one of three categories: slightly limited, moderately limited, or severely limited. Use of septic absorption fields in moderately or severely limited soils generally requires special design, planning, and/or maintenance to overcome the limitations and ensure proper function. Figure 10 displays the septic tank suitability of soils throughout the OOM lakes watershed, while Table 6 lists the soils located within the watershed and their associated properties. Soils that are severely limited for use as septic systems cover 4,409 acres (1784.3 ha or 64%) of the watershed. Severely limited soils are spread throughout the watershed, including all Olin and Martin lakes’ shorelines and approximately half of the shoreline of Oliver
Oliver, Olin, and Martin lakes Diagnostic Study October 16, 2009 LaGrange County, Indiana
File No.070874.00 Page 18
Lake. Soils that are moderately limited cover an additional 15% or 1,030 acres (416.8 ha) of the Oliver Lake watershed, and soils that are rated as slightly limited for septic system usage cover an additional 13% or 864 acres (349.7 ha) of the watershed. Soils that are not rated at all, including Oliver, Olin, and Martin lakes, cover the remaining 8% of the watershed.
Figure 10. Soil septic tank suitability within the Oliver, Olin, and Martin lakes watershed.
Oliver, Olin, and Martin lakes Diagnostic Study October 16, 2009 LaGrange County, Indiana
File No.070874.00 Page 19
Table 6. Soil types in the Oliver Lake watershed and the features restrictive to their suitability to serve as a septic tank absorption field.
Soil Unit Soil Name Depth to High Water Table Restrictive Features
Ad Adrian muck +0.5 to 1 feet Severe: ponding BoA, BoB, BoC Boyer loamy sand >6 feet Severe: poor filter
BoD Boyer loamy sand >6 feet Severe: poor filter, slope Bp Brady sandy loam 1 to 3 feet Severe: wetness, poor filter
ChB, ChC Chelsea fine sand >6 feet Severe: poor filter CrA Conover loam 1 to 2 feet Severe: wetness, percs slowly Ed Edwards muck +0.5 to 0.5 feet Severe: ponding, percs slowly Gf Gilford sandy loam +0.5 to 1 feet Severe: ponding, poor filter
Wt Whitaker sandy loam 1 to 3 feet Severe: wetness 2.5 Natural History Geographic location, climate, topography, geology, soils, and other factors play a role in shaping the native floral and faunal communities in a particular area. Various ecologists (Deam, 1921; Petty and Jackson, 1966; Homoya et al., 1985; Omernik and Gallant, 1988) have divided Indiana into several natural regions or ecoregions, each with similar geographic history, climate, topography, and soils. Because the groupings are based on factors that ultimately influence the type of vegetation present in an area, these natural areas or ecoregions tend to support distinctive native floral and faunal communities. The OOM lakes watershed lies within Homoya’s Northern Lakes Natural Region. Similarly, the OOM lakes watershed lies in the southeastern portion of Omernik and Gallant’s Southern Michigan/Northern Indiana Till Plains Ecoregion (Omernik and Gallant, 1988). The OOM lakes watershed also lies within the transition zone between Petty and Jackson’s Oak-Hickory and Beech-Maple Climax Forest Associations (Petty and Jackson, 1966). As a result, the native floral community of the OOM lakes watershed likely consisted of components of neighboring natural areas and ecoregions in addition to components characteristic of the natural area and ecoregion in which it is mapped.
Oliver, Olin, and Martin lakes Diagnostic Study October 16, 2009 LaGrange County, Indiana
File No.070874.00 Page 20
Homoya et al. (1985) noted that prior to European settlement, the region was a mixture of numerous natural community types, including bog, fen, marsh, prairie, sedge meadow, swamp, seep spring, lake, and deciduous forest. The dry to dry-mesic uplands were likely forested with red oak, white oak, black oak, shagbark hickory, and pignut hickory. More mesic areas probably harbored beech, sugar maple, black maple, and tulip poplar. Omernik and Gallant (1988) describe the region as consisting mostly of cropland agriculture, with remnants of natural forest cover. Forests are mainly oak-hickory, dominated by white oak, red oak, black oak, bitternut hickory, shagbark hickory, sugar maple, and beech. Wetter soils support red maple, white oak, American elm, and basswood, and forested wetlands are swamps supporting white ash, red maple, quaking aspen, and black cherry. Petty and Jackson (1966) list pussy-toes, common cinquefoil, wild licorice, tick clover, blue phlox, waterleaf, bloodroot, Joe-pye-weed, woodland asters, goldenrods, wild geranium, and bellwort as common components of the oak-hickory forest understory in the watershed’s region, and rue anemone, jack-in-the-pulpit, spring beauty, cutleaf toothwort, pretty bedstraw, mayapple, false Solomon’s seal, and wild ginger as common components of the beech-maple forest understory. Historically, wet habitat (ponds, swamps, marshes, and bogs) intermingled with the upland habitat throughout the OOM lakes watershed. The hydric soils map indicates that wetland habitat existed throughout the OOM lakes watershed. These wet habitats supported very different vegetative communities than the drier portions of the landscape (Homoya et. al, 1985). Sycamore, American elm, red elm, green ash, silver maple, red maple, cottonwood, hackberry, and honey locust likely dominated the floodplain forests. Swamp communities bordering lakes typically consisted of red maple, silver maple, green ash, American elm, black ash, and yellow birch. Marshes associated with lake communities typically contained swamp loosestrife, cattails, bulrush, marsh fern, marsh cinquefoil, and sedges. Aquatic species within the lake community included spatterdock, water shield, fragrant water lily, pickerel weed, hornwort, wild celery, pondweeds, Virginia arrow arum, and sedges. 2.6 Land Use Just as soils, climate, and geology shape the native communities within the watershed, how the land in a watershed is used can impact the water quality of a waterbody. Different land uses have the potential to contribute different amounts of nutrients, sediment, and toxins to receiving water bodies. For example, Reckhow and Simpson (1980) compiled phosphorus export coefficients (amount of phosphorus lost per unit of land area) for various land uses by examining the rate at which phosphorus loss occurred on various types of land. (The Phosphorus Modeling Section of the report contains more detailed information on this work and its impact on OIiver, Olin, and Martin lakes and their watershed.) Several researchers have also examined the impact of specific urban and suburban land uses on water quality (Bannerman et. al, 1992; Steuer et al., 1997; Waschbusch et al., 2000). Bannerman et al. (1992) and Steuer et al. (1997) found high mean phosphorus concentrations in runoff from residential lawns (2.33 to 2.67 mg/L) and residential streets (0.14 to 1.31 mg/L). These concentrations are well above the threshold at which lakes might begin to experience algae blooms. (Lakes with total phosphorus concentrations greater than 0.03 mg/L will likely experience algae blooms.) Finally, the Center for Watershed Protection has estimated the association of increased levels of impervious surface in a watershed with increased delivery of phosphorus to receiving waterbodies (Caraco and Brown, 2001). Land use directly affects the amount of impervious surface in a watershed. Because of the effect watershed land use has on water quality of the receiving lakes, mapping and understanding a watershed’s land use is critical in directing water quality improvement efforts.
Oliver, Olin, and Martin lakes Diagnostic Study October 16, 2009 LaGrange County, Indiana
File No.070874.00 Page 21
2.6.1 Oliver Lake Watershed Table 7 and Figure 11 present current land use information for the Oliver Lake watershed. (Land use data from the U.S. Geological Survey (USGS) form the basis of Figure 11.) Like many Indiana watersheds, agricultural land use dominates the Oliver Lake watershed, accounting for approximately 76.8% of the watershed. Row crops comprise the greatest percentage of agricultural land use at 58.9%, while pastures or hay vegetate another 17.9%. Most of the agricultural land in the Oliver Lake watershed and throughout LaGrange County (USDA, 2002) is used for growing soybeans and corn. LaGrange County ranks the highest of all 92 state counties for forage (land used for hay, haylage, grass silage, and greenchop) production and sales of donkeys, ponies, mules, burrows, and horses and also cattle sales. County-wide tillage transect data for LaGrange County provide an estimate for the portion of cropland in conservation tillage for the Oliver Lake watershed. In LaGrange County, soybean producers utilize no-till methods on 64% of soybean fields and some form of reduced tillage on 28% of soybean fields (IDNR, 2004b). LaGrange County corn producers used no-till methods on 14% of corn fields and some form of reduced tillage on 24% of corn fields in production (IDNR, 2004a). Overall, LaGrange County ranked 56th for usage of no-till on corn fields and 46th for use of no-till on soybean fields. The percentages of fields on which no-till methods were used in LaGrange County were above the statewide median percentage for soybean production, but below the median percentage for corn production. Land uses other than agriculture account for the remaining 23.2% of the watershed. Natural landscapes, including forests and wetland, cover approximately 22.5% of the watershed. Most of the natural acreage in the watershed is associated with the woody wetland areas around the lakes and along some of the streams. Additional smaller tracts are located in the northeastern and southeastern portions of the watershed. These natural areas consist of small tracts of wooded wetlands or deciduous forest. Open water, including Oliver Lake, Olin, and Martin lakes, several small ponds, and streams and ditches, accounts for another 7.5% of the watershed. The remaining 0.7% of the watershed is occupied by low intensity residential development, high intensity commercial/industrial/transportation, and high intensity residential development. High intensity development only accounts for 0.2% of the land in the Oliver Lake watershed. Much of the residential land lies in one location in the western end of Oliver Lake, and long several of the roads in the northern and eastern portions of the watershed. Table 7. Detailed land use in the Oliver Lake watershed. Land Use Area (acres) Area (hectares) % of Watershed Row Crops 4,038.4 1,634.3 58.9% Pasture/Hay 1,223.9 495.3 17.9% Open Water 513.5 207.8 7.5% Deciduous Forest 507.7 205.5 7.4% Woody Wetlands 446.8 180.8 6.5% Emergent Herbaceous Wetlands 75.2 30.4 1.1% Low Intensity Residential 31.3 12.7 0.5% Evergreen Forest 9.7 3.9 0.1% High Intensity:Commercial/Ind/Trans 4.3 1.7 0.1% High Intensity Residential 3.9 1.6 0.1% Mixed Forest 1.3 0.5 <0.1% Entire Watershed 6,856.0 2,774.5 100.0%
Oliver, Olin, and Martin lakes Diagnostic Study October 16, 2009 LaGrange County, Indiana
File No.070874.00 Page 22
Figure 11. Land use in the Oliver, Olin, and Martin lakes watershed. Impervious surface coverage was calculated by using adapted impervious values for selected land used in Lee and Toonkel (2003), but does not include road surfaces. Impervious surfaces cover approximately 2.0% of the watershed. This estimate of impervious surface coverage is below the threshold (10%) at which the Center for Watershed Protection has found an associated decline in water quality. The land uses contributing to the impervious surface coverage in the Oliver Lake watershed are agricultural (1.4%), residential (0.4%), and commerical (0.3%). 2.6.2 Olin Lake Watershed Land use within the Olin Lake watershed parallels that of the entire Oliver Lake watershed. Agricultural land use dominates the Olin Lake watershed (Table 8; Figure 11). Row crops cover approximately 66.8% of the watershed, while pasture or hay covers an additional 11% of the watershed. Natural land uses cover approximately 21.1% of the watershed. Most of the natural acreage in the watershed is associated with the woody wetland areas and deciduous forests around the lake and drainages. Open water in the form of Olin Lake and its associated streams and ditches accounts for approximately 3.7% of the watershed. The remaining 0.1% of the land in the Olin Lake watershed is used by low intensity residential and high intensity commercial development.
Oliver, Olin, and Martin lakes Diagnostic Study October 16, 2009 LaGrange County, Indiana
File No.070874.00 Page 23
Table 8. Detailed land use in the Olin Lake watershed. Land Use Area (acres) Area (hectares) % of Watershed Row Crops 2,311.0 935.2 66.8% Pasture/Hay 379.9 153.7 11.0% Deciduous Forest 298.5 120.8 8.6% Woody Wetlands 296.4 119.9 8.6% Open Water 129.6 52.4 3.7% Emergent Herbaceous Wetlands 35.3 14.3 1.0% Evergreen Forest 7.9 3.2 0.2% Mixed/Forest 1.3 0.5 <0.1% High Intensity:Commercial/Ind/Trans 1.0 0.4 <0.1% Low Intensity Residential 0.4 .2 <0.1% Entire Watershed 3461.2 1,400.7 100%
2.6.3 Martin Lake Watershed Land use within the Martin Lake watershed also parallels that of the entire Oliver Lake watershed. Agricultural land use dominates the Martin Lake watershed (Table 9; Figure 11). Row crops cover approximately 71.7% of the watershed, while pasture or hay covers an additional 12% of the watershed. Natural land uses cover approximately 16.2% of the watershed. Most of the natural acreage in the watershed is associated with the woody wetland areas and deciduous forests around the lake and its associated streams and ditches. Open water in the form of Martin Lake and its associated streams and ditches accounts for approximately 1% of the watershed. Developed areas such as low intensity residential and high intensity commercial/industrial/transportation account for the remaining 0.1% of the land in the Martin Lake watershed. Table 9. Detailed land use in the Martin Lake watershed. Land Use Area (acres) Area (hectares) % of Watershed Row+ Crops 2,054.4 831.4 71.7% Pasture/Hay 344.2 139.3 12.0% Woody wetlands 318.5 128.8 7.5% Deciduous Forest 185.1 74.9 6.5% Emergent Herbaceous Wetlands 30.6 12.4 1.1% Open Water 29.5 11.9 1.0% Evergreen Forest 3.1 1.3 0.2% High Intensity:Commercial/Ind/Trans 1.0 0.4 <0.1% Mixed Forest 0.6 0.2 <0.1% Low Intensity Residential 0.4 0.2 <0.1% Entire Watershed 2,863.9 1,159.0 100.00%
2.7 Wetlands Because wetlands perform a variety of functions in a healthy ecosystem, they deserve special attention when examining watersheds. Functioning wetlands filter sediments and nutrients in runoff, store water for future release, provide an opportunity for groundwater recharge or discharge, and serve as nesting habitat for waterfowl and spawning sites for fish. By performing
Oliver, Olin, and Martin lakes Diagnostic Study October 16, 2009 LaGrange County, Indiana
File No.070874.00 Page 24
these roles, healthy, functioning wetlands often improve the water quality and biological health of streams and lakes located downstream of the wetlands. The United States Fish and Wildlife Service’s (USFWS) National Wetland Inventory (NWI) Map (Figure 12) shows that wetlands cover approximately 21% of the Oliver Lake watershed. Table 10 presents the acreage of wetlands by type according to the National Wetland Inventory. Oliver, Olin, and Martin lakes account for approximately one-third of this wetland acreage (7.4% of the watershed). Forested wetlands account for another third of the wetland acreage (7.0% of the watershed). Shrub-scrub and herbaceous wetlands cover approximately 6.3% of the watershed. The largest contiguous tracts of wetland habitat lie along the south shore of Oliver Lake, around Olin Lake, along the south shore of Martin Lake, and along Dove Creek and the southern unnamed tributary to Martin Lake. Additional large tracts of wetland lie along Bert Hart Ditch, and in the northeastern and southeastern portions of the watershed, and small tracts are scattered throughout the watershed. Ponds account for the remaining wetland acreage (0.2%).
Figure 12. National wetland inventory wetlands in the Oliver, Olin, and Martin lakes watershed.
Oliver, Olin, and Martin lakes Diagnostic Study October 16, 2009 LaGrange County, Indiana
File No.070874.00 Page 25
Table 10. Acreage and classification of wetland habitat in the Oliver, Olin, and Martin lakes watershed. Wetland Type Area (acres) Area (hectares) Percent of Watershed Lacustrine 504.5 204.2 7.4% Palustrine forested 478.5 193.6 7.0% Palustrine emergent 310.6 125.7 4.5% Palustrine scrub/shrub 119.8 48.5 1.7% Ponds 11.3 4.6 0.2% Total 1424.7 576.6 20.8% Source: National Wetlands Inventory. The USFWS NWI data differ in their estimate of wetland habitat acreage in the watershed from the USGS data presented in Table 7 and Figure 11. The USGS Land Cover Data Set suggests that wetlands cover approximately 7.6% of the OOM lakes watershed and open water covers an additional 7.5% of the watershed (Table 7), while the USFWS NWI data show that approximately 13.2% of the watershed is covered by wetland and 7.6% is covered by open water. The primary difference between the two data sets is the distribution of wetland acreage between forested and emergent habitats. The USGS reports that approximately 446.8 acres of forested wetland and 75.2 acres of emergent wetland exist in the OOM lakes watershed, compared to approximately 598.3 acres of forested and scrub/shrub wetland and 310.6 acres of emergent wetland reported by the USFWS. The differences in reported wetland acreage in the OOM lakes watershed reflect the differences in project goals and methodology used by the different agencies to collect land use data. The U.S. Fish and Wildlife Service estimates an average of 2.6% of the nation’s wetlands were lost annually from 1986 to 1997 (Zinn and Copeland, 2005). The IDNR estimates that approximately 85% of the state’s wetlands have been filled or drained (IDNR, 1996). The greatest loss has occurred in the northern counties of the state such as LaGrange County. The last glacial retreat in these northern counties left level landscapes dotted with wetland and lake complexes. Development of the land in these counties for agricultural purposes altered much of the natural hydrology, eliminating many of the wetlands. Hamilton (1965) estimated that nearly 71% of the wetlands within the Lake Michigan Basin in Indiana have been lost (cited in EarthSource, 1991). Development within the OOM lakes watershed has undoubtedly reduced wetland acreage in the watershed as well. Hydric soils, which formed under wetland conditions, cover nearly the entire length of all of the streams and ditches in the watershed, and are scattered throughout the watershed (Figure 13). Areas mapped in the wettest of hydric soils, such as Houghton muck, Rensselaer loam, and Whitaker sandy loam, have largely remained undeveloped. Overall, hydric soils cover approximately 1,780 acres (720.3 ha or 26%) of the OOM lakes watershed. When compared to the acreage of wetlands mapped by the USFWS NWI (909 acres or 367.9 ha), approximately 51% of wetlands remain in the OOM lakes watershed. Figure 14 displays the FEMA (Federal Emergency Management Agency) floodplain maps. The highlighted areas in Figure 14 show those areas with a 1% annual chance of flooding and a 26% chance of flooding over the life of a 30-year mortgage (FEMA). As shown, the potential for flooding within the OOM lakes watershed appears to be restricted to the immediate areas around the lakes and along a portion of Dove Creek in the northern part of the watershed.
Oliver, Olin, and Martin lakes Diagnostic Study October 16, 2009 LaGrange County, Indiana
File No.070874.00 Page 26
Figure 13. Hydric soils in the Oliver, Olin, and Martin lakes watershed.
Oliver, Olin, and Martin lakes Diagnostic Study October 16, 2009 LaGrange County, Indiana
File No.070874.00 Page 27
Figure 14. FEMA map indicating areas within the one-percent flooding zone. 2.8 Natural Communities and Endangered, Threatened, and Rare Species The Indiana Natural Heritage Data Center database provides information on the presence of endangered, threatened, or rare species; high quality natural communities; and natural areas in Indiana. The Indiana Department of Natural Resources developed the database to assist in documenting the presence of special species and significant natural areas and to serve as a tool for setting management priorities in areas where special species or habitats exist. The database relies on observations from individuals rather than systematic field surveys by the IDNR. Because of this, it does not document every occurrence of special species or habitat. At the same time, the listing of a species or natural area does not guarantee that the listed species is present or that the listed area is in pristine condition. To assist users, the database includes the date that the species or special habitat was last observed in a specific location. Appendix A presents the results from the database search for the OOM lakes watershed. (For additional reference, Appendix B provides a listing of endangered, threatened, and rare species (ETR) documented in LaGrange County.) No federally listed endangered, threatened, and rare species are known to exist in the watershed. The state of Indiana uses the following definitions when listing species: Endangered: Any species whose prospects for survival or recruitment with the state are in
immediate jeopardy and are in danger of disappearing from the state. This includes all
Oliver, Olin, and Martin lakes Diagnostic Study October 16, 2009 LaGrange County, Indiana
File No.070874.00 Page 28
species classified as endangered by the federal government which occur in Indiana. Plants known to occur currently on five or fewer sites in the state are considered endangered.
Threatened: Any species likely to become endangered within the foreseeable future. This includes all species classified as threatened by the federal government which occur in Indiana. Plants known to occur currently on six to ten sites in the state are considered endangered.
Rare: Plants and insects known to occur currently on from eleven to twenty sites. The Indiana Natural Heritage Data Center database contains more than 35 species listings and documents more than five high quality natural communities present within the OOM lakes watershed. This listing including habitats and species identified in the Marsh Wren Nature Preserve and in the Olin Lake Nature Preserve. In total two state endangered birds, the Marsh Wren (Cistothorus palustris) and the Black-crowned Night-heron (Nycticorax nycticorax), were historically located within the watershed. Both birds were last documented in 1986. Additionally, three state endangered reptiles, including Blanding’s turtle (Emydoidea blandingii), the eastern massasauga (Sistrurus catenatus catenatus), and the spotted turtle (Clemmys guttata), were historically present within the OOM lakes watershed. Blanding’s turtles and eastern massasauga were documented as recently as 2002 and 2000, respectively; however, spotted turtles have not been documented in the area since 1954. Two species of special concern, the lake herring or cisco (Coregonus artedi) and the great blue heron (Ardea Herodias) were also historically documented within the watershed. Both sightings occurred relatively recently, with herons documented as soon as 1997 and cisco as recently as 1988. Numerous state endangered, state threatened, and state rare plant species were historically documented in the OOM lakes watershed. These include the state endangered mud sedge (Carex limosa), horse-tail spikerush (Eleocharis equisetoides), prairie white-fringe orchid (Platanthera leucophaea), highbush cranberry (Viburnum opulus var. americanum), american scheuchzeria (Scheuchzeria palustris spp. americana) thinleaf sedge (Carex sparganioides var. cephaloidea), american water-pennywort (Hydrocotyle americana), and northeastern bladderwort (Utricularia resupinata). Additionally, state rare species including rushlike aster (Aster borealis), Robbin’s spikerush (Eleocharis robbinsii), whorled water-milfoil (Myriophyllum verticillatum), red baneberry (Actaea rubra), shining ladies’ tresses (Spiranthes lucida), thinleaf sedge (Carex sparganioides var. cephaloidea), and false asphodel (Tofieldia glutinosa) also occur within the OOM lakes watershed. Two state threatened species the horned bladderwort (Utricularia cornuta) and white-stem pondweed (Potamogeton pralongus) were also historically known in the Olin Lake Nature Preserve. Most of the vascular plant listings occurred from 1914 to 1935; however, whorled watermilfoil was documented as recently as 1985 and was observed during the spring aquatic plant survey completed as part of this project Other records exist for the OOM lakes watershed which document high quality natural communities. These include mesic upland forest, fen, lake, forested swamp, shrub swamp, circumneutral bog, dry upland forest, and marsh. Additionally, LaGrange County supports a variety of endangered, threatened, and rare animals and plants as detailed by the Indiana Natural Heritage database listing for LaGrange County, which was last updated in 2005. The listed animals include four freshwater mussels (slippershell mussel, snuffbox, ellipse, and rayed bean), three amphibians (northern leopard frog, four-toed salamander, and blue-spotted salamander), four reptiles (spotted turtle, Blanding’s turtle, copperbelly water snake, and eastern massasauga), and two fish (cisco and greater redhorse). More than fifty insects, more than twenty-five birds, and six mammals (star-nosed mole, northern river otter, bobcat, least weasel, Indiana bat, and American badger) have been documented in LaGrange County. More than eighty plant species, many of which are hydrophytic (wetland or aquatic species), are also
Oliver, Olin, and Martin lakes Diagnostic Study October 16, 2009 LaGrange County, Indiana
File No.070874.00 Page 29
included in the database for LaGrange County. The county also supports fifteen high quality communities. The IDNR Olin Lake Nature Preserve located on the southwest shoreline of Olin Lake and two other IDNR Nature Preserves in the Martin Lake watersheds are important components of the watershed because they represent a relatively large area within the watershed that are not subject to the same pressures of development, land use changes, or conventional agriculture (Figure 15). Although there are several water quality concerns currently within the largest unit of Olin Nature Preserve (See Section 6 for more information), the Nature Preserve provides habitat and land use diversity to the OOM watershed. Areas adjacent to the nature preserves should be considered top priority acquisition or restoration to increase the effect that the nature preserves provide to the OOM watershed.
Figure 15. Map of the Olin Lake Nature Preserve and other IDNR preserves in the watershed. 2.9 Prior Studies A variety of fisheries studies have been completed within or have included the OOM lakes. These studies have varied from a carp removal experiment in Oliver Lake, the introduction of Chinook salmon, the abundance and distribution of cisco, trout stocking programs, and general fishery management reports. Studies involving water quality have also been completed by the
Oliver, Olin, and Martin lakes Diagnostic Study October 16, 2009 LaGrange County, Indiana
File No.070874.00 Page 30
Indiana Clean Lakes Program (CLP). Table 11 lists the prior studies that have been completed within or involved OOM lakes. Table 11. List of Prior Studies conducted within the OOM chain. Year Organization Topic Study/Report 1950 IDNR Fisheries Carp removal experiment at Oliver Lake
1950 IDNR Fisheries Fish population estimate and creel census of Oliver Lake
1955 IDNR Fisheries Cisco distribution in Indiana lakes 1970-1972 IDNR Fisheries Chinook salmon introduction experiment in the
OOM lakes 1970-1973 IDNR Fisheries Creel census
1973 IDNR Fisheries Distribution and abundance of the cisco in the Elkhart River Watershed
1975 IDNR Fisheries A summary of cisco investigations 1971-1974 1979 IDNR Fisheries Creel census in OOM lakes from 1973-1977 1983 IDNR Fisheries Fish Management Report, Oliver, Olin, Martin Lakes1986 IDNR Fisheries Spot check survey of Olin Lake 1990 IDNR Fisheries Trout Management Report 1990 IDNR Fisheries Creel census
1994 IDNR Fisheries Cisco distribution in Indiana lakes
1993, 2000, 2003,2006
CLP Water Quality Indiana Clean Lakes Program
3.0 STREAM ASSESSMENT 3.1 Stream Assessment Introduction To better understand the transport of nutrients and other pollutants to the lakes of Oliver, Olin, and Martin lakes from their watersheds, this study included an evaluation of the water quality at four sampling sites, Dove Creek (Oliver Lake), Burt Hart Ditch (Oliver Lake), Truman Flint Ditch (Martin Lake), and an unnamed tributary to Martin Lake. The water quality evaluation consisted of the collection of water samples from the streams. These samples were analyzed for an array of physical and chemical parameters and results of the analysis were compared to historical data, state standards (if available), and other known measures of stream water quality. The biological communities of the streams were also assessed to supplement the findings from the physical and chemical parameter analysis. A stream’s biological communities (fish, macroinvertebrates, and periphyton communities) tend to reflect the stream’s long-term water quality. For example, streams that carry significant sediment loads on a regular basis tend to support few or no stoneflies, since stoneflies are sediment-intolerant organisms. Evaluating the biological community characteristics, such as species diversity and composition, helps understand the stream’s water quality over a longer term than can be assessed with the collection of only grab samples. While a stream’s biota serve as a useful means for assessing the stream’s water quality, it is important to remember that water quality is not the only factor that shapes a stream’s biological
Oliver, Olin, and Martin lakes Diagnostic Study October 16, 2009 LaGrange County, Indiana
File No.070874.00 Page 31
community. Habitat quality, energy source, flow regime, and biological pressures (predation, parasitism, competition, etc.) also affect a stream’s biological community composition (Karr et al., 1986). For example, a stream fish community dominated by very tolerant fish does not necessarily mean the water quality is very poor. Lack of appropriate spawning habitat or changes in the stream’s hydrological regime could play a larger role in shaping the stream’s fish community than water quality in some instances. To provide a complete assessment of water quality of the streams, the study included the collection of water chemistry and biological (macroinvertebrate) samples. Water quality samples were collected twice, once during base flow or normal conditions and once following a storm event, at the locations indicated in Figure 16 and Table 12. The biological community was sampled during base flow conditions as required by standard protocol. Sampling occurred in mid-summer to avoid the May and October macroinvertebrate diversity peaks. The in-stream and riparian habitat along all stream reach was also evaluated to help in isolating which factors are responsible for shaping the creek’s biotic communities. The following section outlines the stream sampling methods in greater detail.
Figure 16. Stream sampling locations within the Oliver, Olin, and Martin lakes watershed.
Oliver, Olin, and Martin lakes Diagnostic Study October 16, 2009 LaGrange County, Indiana
File No.070874.00 Page 32
3.2 Stream Assessment Methods 3.2.1 Water Chemistry The water sampling and analytical methods used to assess the streams in the OOM lakes watershed were consistent with those used by the IDNR’s Lake and River Enhancement Program. Stream sites were sampled under base flow conditions in the Olin, Oliver, and Martin watershed (Table 12) on July 23, 2008. The LARE sampling protocol requires assessing water quality of each designated stream site once during base flow and once during storm flow. This is because water quality characteristics change markedly between these two flow regimes. A storm flow sample will be influenced by runoff from the land, which usually contains soil and associated nutrients. A base flow sample represents the ‘usual’ water characteristics of the stream and does not include influences such as overland flow.
Table 12. Location of stream sampling sites.
Site No.
Stream Name Sampling Location
Latitude Longitude
1 Dove Creek CR 455S 41o 34’ 38.105” 85o 24’ 56.555” 2 Burt Hart Ditch CR 150E 41o 34’ 25.787” 85o 23’ 40.752” 3 Truman Flint Ditch Martin north 41° 34’ 10.150” 85° 22’ 32.312” 4 Unnamed Tributary Martin south 41o 33’ 18.507” 85o 22’ 4.825”
Conductivity, temperature, and dissolved oxygen were measured in situ at the stream sampling sites with an YSI Model 85 meter. Stream water velocity was measured using a Marsh-McBirney Flo-Mate current meter. The cross-sectional area of the stream channel at each site was measured and discharge calculated by multiplying water velocity by the cross-sectional area.
In addition, water samples were collected for the following parameters:
+) • total Kjeldahl nitrogen (TKN) • total suspended solids (TSS) • turbidity • E. coli bacteria
These samples were placed in the appropriate bottle (with preservative if needed) and stored in an ice chest until analysis at Indiana University School of Public Affair’s (SPEA) laboratory in Bloomington. SRP samples were filtered in the field through a Whatman GF-C filter. The E. coli bacteria samples were taken to Sherry Laboratories in Warsaw, Indiana for analysis. All sampling techniques and laboratory analytical methods were performed in accordance with procedures in Standard Methods for the Examination of Water and Wastewater, 21st Edition (APHA, 2005). The comprehensive evaluation of streams requires collecting data on a number of different, and sometimes hard-to-understand, water quality parameters. Some of the more important parameters that were analyzed include:
Oliver, Olin, and Martin lakes Diagnostic Study October 16, 2009 LaGrange County, Indiana
File No.070874.00 Page 33
Temperature. Temperature can determine the form, solubility, and toxicity of a broad range of aqueous compounds. Likewise, life associated with the aquatic environment in any location has its species composition and activity regulated by water temperature. Since essentially all aquatic organisms are ‘cold-blooded’ the temperature of the water regulates their metabolism and ability to survive and reproduce effectively (EPA, 1976). The Indiana Administrative Code (327 IAC 2-1-6) sets maximum temperature limits to protect aquatic life for Indiana streams. For example, temperatures during the month of May should not exceed 80 oF (23.7 oC) by more than 3 oF (1.7 oC). June temperatures should not exceed 90 oF (32.2 oC). Dissolved Oxygen (D.O). D.O. is the dissolved gaseous form of oxygen. It is essential for respiration of fish and other aquatic organisms. Fish need at least 3-5 mg/L of D.O. Cold-water fish such as trout generally require higher concentrations of D.O. than warm water fish such as bass or Bluegill. The IAC sets minimum D.O. concentrations at 6 mg/L for cold-water fish. D.O. enters water by diffusion from the atmosphere and as a byproduct of photosynthesis by algae and plants. Excessive algae growth can over-saturate (greater than 100% saturation) the water with D.O. Conversely, dissolved oxygen is consumed by respiration of aquatic organisms, such as fish, and during bacterial decomposition of plant and animal matter. Conductivity. Conductivity is a measure of the ability of an aqueous solution to carry an electric current. This ability depends on the presence of ions: on their total concentration, mobility, and valence (APHA, 2005). During low discharge, conductivity is higher than during storm water runoff because the water moves more slowly across or through ion containing soils and substrates during base flow. Carbonates and other charged particles (ions) dissolve into the slow-moving water, thereby increasing conductivity measurements. Rather than setting a conductivity standard, the IAC sets a standard for dissolved solids (750 mg/L). Multiplying a dissolved solids concentration by a conversion factor of 0.55 to 0.75 µmhos per mg/L of dissolved solids roughly converts a dissolved solids concentration to specific conductance (Allan, 1995). Thus, converting the IAC dissolved solids concentration standard to specific conductance by multiplying 750 mg/L by 0.55 to 0.75 µmhos per mg/L yields a specific conductance range of approximately 1000 to 1360 µmhos. This report presents conductivity measurements at each site in µmhos. pH. The pH of water is a measure of the concentration of acidic ions (specifically H+) present in the water. The pH also determines the form, solubility, and toxicity of a wide range of other aqueous compounds. The IAC establishes a range of 6-9 pH units for the protection of aquatic life. Alkalinity. Alkalinity is a measure of the acid-neutralizing (or buffering) capacity of water. Certain substances, if present in water, like carbonates, bicarbonates, and sulfates can cause the water to resist changes in pH. A lower alkalinity indicates a lower buffering capacity or a decreased ability to resist changes in pH. During base flow conditions, alkalinity is usually high because the water picks up carbonates from the bedrock. Alkalinity measurements are usually lower during storm flow conditions because buffering compounds are diluted by rainwater and the runoff water moves across carbonate-containing bedrock materials so quickly that little carbonate is dissolved to add additional buffering capacity. Turbidity. Turbidity (measured in Nephelometric Turbidity Units) is a measure of particles suspended in the water itself. It is generally related to suspended and colloidal matter such as clay, silt, finely divided organic and inorganic matter, plankton, and other microscopic
Oliver, Olin, and Martin lakes Diagnostic Study October 16, 2009 LaGrange County, Indiana
File No.070874.00 Page 34
organisms. According to the Hoosier Riverwatch, the average turbidity of an Indiana stream is 11 NTU with a typical range of 4.5-17.5 NTU (White, unpublished data). Turbidity measurements >20 NTU have been found to cause undesirable changes in aquatic life (Walker, 1978). Nitrogen. Nitrogen is an essential plant nutrient found in fertilizers, human and animal wastes, yard waste, and the air. About 80% of the air we breathe is nitrogen gas. Nitrogen gas diffuses into water where it can be “fixed”, or converted, by blue-green algae to ammonia for their use. Nitrogen can also enter lakes and streams as inorganic nitrogen and ammonia. Because of this, there is an abundant supply of available nitrogen to aquatic systems. The three common forms of nitrogen are:
Nitrate (NO3-) – Nitrate is an oxidized form of dissolved nitrogen that is converted to
ammonia by algae. It is found in streams and runoff when dissolved oxygen is present, usually in the surface waters. Ammonia applied to farmland is rapidly oxidized or converted to nitrate and usually enters surface and groundwater as nitrate. The Ohio EPA (1999) found that the median nitrate-nitrogen concentration in wadeable streams that support modified warmwater habitat (MWH) was 1.6 mg/L. Modified warmwater habitat was defined as: aquatic life use assigned to streams that have irretrievable, extensive, man-induced modification that preclude attainment of the warmwater habitat use (WWH) designation; such streams are characterized by species that are tolerant of poor chemical quality (fluctuating dissolved oxygen) and habitat conditions (siltation, habitat amplification) that often occur in modified streams (Ohio EPA, 1999). Nitrate concentrations exceeding 10 mg/1 in drinking water are considered hazardous to human health (IAC 2-1-6).
Ammonia (NH4
+) – Ammonia is a form of dissolved nitrogen that is the preferred form for algae use. It is the reduced form of nitrogen and is found in water where dissolved oxygen is lacking. Important sources of ammonia include fertilizers and animal manure. In addition, bacteria produce ammonia as a by-product as they decompose dead plant and animal matter. Both temperature and pH govern the toxicity of ammonia for aquatic life.
Organic Nitrogen (Org N) – Organic nitrogen includes nitrogen found in plant and animal materials. It may be in dissolved or particulate form. In the analytical procedures, total Kjeldahl nitrogen (TKN) was analyzed. Organic nitrogen is TKN minus ammonia.
Phosphorus. Phosphorus is an essential plant nutrient, and the one that most often controls aquatic plant (algae and macrophyte) growth in freshwater. It is found in fertilizers, human and animal wastes, and yard waste. There are few natural sources of phosphorus to streams other than what is attached to soil particles, and there is no atmospheric (vapor) form of phosphorus. For this reason, phosphorus is often a limiting nutrient in aquatic systems. This means that the relative scarcity of phosphorus may limit the ultimate growth and production of algae and rooted aquatic plants. Therefore, management efforts often focus on reducing phosphorus inputs to receiving waterways because: (a) it can be managed and (b) reducing phosphorus can reduce algae production. Two common forms of phosphorus are:
Soluble reactive phosphorus (SRP) – SRP is dissolved phosphorus readily usable by algae. SRP is often found in very low concentrations in phosphorus-limited systems where the phosphorus is tied up in the algae themselves. Because phosphorus is
Oliver, Olin, and Martin lakes Diagnostic Study October 16, 2009 LaGrange County, Indiana
File No.070874.00 Page 35
cycled so rapidly through biota, SRP concentrations as low as 0.005 mg/L are enough to maintain eutrophic or highly productive conditions in lake systems (Correll, 1998). Sources of SRP include fertilizers, animal wastes, and septic systems.
Total phosphorus (TP) – TP includes dissolved and particulate phosphorus. TP concentrations greater than 0.03 mg/L (or 30μg/L) can cause algal blooms in lakes and reservoirs. The Ohio EPA (1999) found that the median TP in wadeable streams that support MWH for fish was 0.28 mg/L.
While the United States Environmental Protection Agency (USEPA) has established some nutrient standards for drinking water safety, it has not established similar nutrient standards for protecting the biological integrity of a stream. The USEPA, in conjunction with the States, is currently working on developing these standards. According to the USEPA (2008), the State of Indiana is in the process of developing numeric water quality standards for total phosphorus, total nitrogen, turbidity, dissolved oxygen, biological communities, and chlorophyll a for lakes and streams by the end of 2010. The USEPA has issued recommendations for numeric nutrient criteria for streams (USEPA, 2000b). While these are not part of the Indiana Administrative Code, they serve as potential target conditions for which watershed managers might aim. The Ohio EPA has also made recommendations for numeric nutrient criteria in streams based on research on Ohio streams (Ohio EPA, 1999). These, too, serve as potential target conditions for those who manage Indiana streams. Other researchers have suggested thresholds for several nutrients in aquatic ecosystems as well (Dodd et al., 1998). Lastly, the IAC requires that all waters of the state have a nitrate concentration of less than 10 mg/L, which is the drinking water standard for the state. Researchers have recommended various thresholds and criteria for nutrients in streams. The USEPA’s recommended targets for nutrient levels in streams are fairly low. The agency recommends a target total phosphorus concentration of 0.076 mg/L in streams (USEPA, 2000b). Dodd et al. (1998) suggest the dividing line between moderately (mesotrophic) and highly (eutrophic) productive streams is a total phosphorus concentration of 0.07 mg/L. The Ohio EPA recommended a total phosphorus concentration of 0.08 mg/L in headwater streams to protect the streams’ aquatic biotic integrity (Ohio EPA, 1999). (This criterion is for streams classified as Warmwater Habitat, or WWH, meaning the stream is capable of supporting a healthy, diverse warmwater fauna. Streams that cannot support a healthy, diverse community of warmwater fauna due to “irretrievable, extensive, man-induced modification” are, as previously mentioned, classified as Modified Warmwater Habitat (MWH) streams and have a different criterion.) The USEPA sets aggressive nitrogen criteria recommendations for streams compared to the Ohio EPA. The USEPA’s recommended criteria for nitrate-nitrogen and total Kjeldahl nitrogen concentrations for streams in Aggregate Nutrient Ecoregion VII are 0.633 mg/L and 0.591 mg/L, respectively (USEPA, 2000b). In contrast, the Ohio EPA suggests using nitrate-nitrogen criteria of 1.0 mg/L in WWH wadeable and headwater streams and MWH headwater streams to protect aquatic life. Dodd et al. (1998) suggests the dividing line between moderately and highly productive streams using nitrate-nitrogen concentrations is approximately 1.5 mg/L. It is important to remember that none of the threshold or recommended concentrations listed above is a state standard for water quality. As previously mentioned, the State of Indiana is developing numeric nutrient criteria for water quality in lakes and streams, which should be available by the end of 2010 (USEPA, 2008). Only time will tell whether the State adopts the USEPA recommendations, uses other recommendations from the OEPA or another state, or
Oliver, Olin, and Martin lakes Diagnostic Study October 16, 2009 LaGrange County, Indiana
File No.070874.00 Page 36
develops Indiana-specific standards. Until there are established state standards, recommended or published criteria values presented here provide a frame of reference for the concentrations found in streams in the OOM lakes watershed. The IAC sets only nitrate-nitrogen and ammonia-nitrogen standards for waterbodies in Indiana. The IAC requires that all waters of the state have a nitrate-nitrogen concentration of less than 10 mg/L, which is the drinking water standard for the state. The IAC standard for ammonia-nitrogen depends upon the water’s pH and temperature, since both can affect ammonia-nitrogen’s toxicity. The 2006 303(d) list of impaired waterbodies listing criteria indicates that the IDEM will include waterbodies with total phosphorus concentrations greater than 0.3 mg/L on subsequent lists of impaired waterbodies (IDEM, 2006). Total Suspended Solids (TSS). A TSS measurement quantifies all particles suspended and dissolved in stream water. Closely related to turbidity, this parameter quantifies sediment particles and other solid compounds typically found in stream water. In general, the concentration of suspended solids is greater during high flow events due to increased overland flow. The increased overland flow erodes and carries more soil and other particulates to the stream. Although the State of Indiana sets no standard for TSS, total dissolved solids should not exceed 750 mg/L. In general, TSS concentrations >80 mg/L have been found to be deleterious to aquatic life (Waters, 1995). E. coli Bacteria. E. coli is one member of a group of bacteria that comprise the Fecal Coliform Bacteria and is used as an indicator organism to identify the potential for the presence of pathogenic organisms in a water sample. Pathogenic organisms can present a threat to human health by causing a variety of serious diseases, including infectious hepatitis, typhoid, gastroenteritis, and other gastrointestinal illnesses. E. coli can come from the feces of any warm-blooded animal. Wildlife, livestock, and/or domestic animal defecation, manure fertilizers, previously contaminated sediments, and failing or improperly sited septic systems are common sources of the bacteria. The IAC sets the maximum standard at 235 colonies/100 ml in any one sample within a 30-day period or a geometric mean of 125 colonies per 100 ml for five samples collected in any 30-day period. A study conducted by students at IU SPEA in the spring of 2000 found average fecal coliform levels of <200 colonies/100 ml in unglaciated, gravel-bottom creeks in the Stephen’s Creek Watershed in Monroe County, Indiana (Klumpp et al., 2000). In general, fecal coliform bacteria have a life expectancy of less than 24 hours. 3.2.2 Macroinvertebrates Macroinvertebrate samples were used to calculate a macroinvertebrate index of biotic integrity (mIBI). Aquatic macroinvertebrates are important indicators of environmental change. The insect community composition can reflect water quality. Research shows that different macroinvertebrate orders and families react differently to pollution sources. Indices of biotic integrity are valuable because aquatic biota integrate cumulative effects of sediment and nutrient pollution (Ohio EPA, 1995) Macroinvertebrates were collected during base flow conditions on July 23, 2008, using the multihabitat approach detailed in the USEPA Rapid Bioassessment Protocols for Use in Wadeable Streams and Rivers, 2nd ed. (Barbour et al., 1999). This method was supplemented by qualitative picks from substrate and by surface netting. Two researchers collected macroinvertebrates for 20 minutes; a third researcher aided in the collection for 10 minutes, for a total of 50 minutes of collection effort. All available habitat types were sampled, which did not include a riffle kick as no riffles were present at the sampled sites. The macroinvertebrate samples were processed using the laboratory processing protocols detailed in the same manual. Organisms were identified to the family level according to McCafferty (1983) and
Oliver, Olin, and Martin lakes Diagnostic Study October 16, 2009 LaGrange County, Indiana
File No.070874.00 Page 37
Peckarsky et al. (1990). The family-level approach was used: 1) to collect data comparable to that collected by IDEM in the state; 2) because it allows for increased organism identification accuracy; 3) because several studies support the adequacy of family-level analysis (Furse et al., 1984, Ferraro and Cole, 1995, Marchant, 1995, Bowman and Bailey, 1997, Waite et al., 2000). Macroinvertebrate data were used to calculate the family-level Hilsenhoff Biotic Index (HBI). Calculation of the HBI involves applying assigned macroinvertebrate family tolerance values to all taxa present that have and assigned HBI tolerance value, multiplying the number of organisms present by their family tolerance value, summing the products, and dividing by the total number of organisms present (Hilsenhoff, 1988). A higher value on the HBI scale indicates greater impairment. In addition to the HBI, macroinvertebrate results were analyzed by applying an adaptation of the IDEM mIBI (IDEM, 1996). mIBI scores allow comparison with data compiled by IDEM for wadeable riffle-pool streams. IDEM developed the classification criteria based on five years of wadeable riffle-pool data collected from throughout Indiana. The data were lognormally distributed for each of the metrics. Each metric’s lognormal distribution was then pentasected with scoring based on five categories using 1.5 times the interquartile range around the geometric mean. Table 13 lists the eight scoring metrics used in this study with classification scores of 0-8. The mean of the eight metrics is the mIBI score. mIBI scores of 0-2 indicate the sampling site is severely impaired, scores of 2-4 indicate the site is moderately impaired, scores of 4-6 indicate the site is slightly impaired, and scores of 6-8 indicate that the site is non-impaired.
Oliver, Olin, and Martin lakes Diagnostic Study October 16, 2009 LaGrange County, Indiana
File No.070874.00 Page 38
Table 13. Benthic macroinvertebrate scoring criteria used by IDEM.
SCORING CRITERIA FOR THE FAMILY LEVEL MACROINVERTEBRATE INDEX OF BIOTIC INTEGRITY(mIBI) USING PENTASECTION AND CENTRAL TENDENCY ON THE LOGARITHMIC TRANSFORMED DATA DISTRIBUTIONS OF THE 1990-1995 RIFFLE KICK SAMPLES
CLASSIFICATION SCORE
0
2
4
6
8
Family Level HBI
>5.63
5.62- 5.06
5.05-4.55
4.54-4.09
<4.08
Number of Taxa
<7
8-10
11-14
15-17
>18
Percent Dominant Taxa
>61.6
61.5-43.9
43.8-31.2
31.1-22.2
<22.1
EPT Index
<2
3
4-5
6-7
>8
EPT Count
<19
20-42
43-91
92-194
>195
EPT Count To Total Number of Individuals
<0.13
0.14-0.29
0.30-0.46
0.47-0.68
>0.69
EPT Count To Chironomid Count
<0.88
0.89-2.55
2.56-5.70
5.71-11.65
>11.66
Chironomid Count
>147
146-55
54-20
19-7
<6
Where: 0-2 = Severely Impaired, 2-4 = Moderately Impaired, 4-6 = Slightly Impaired, 6-8 = Nonimpaired 3.2.3 Stream Habitat Physical habitat was evaluated using the Qualitative Habitat Evaluation Index (QHEI) developed by the Ohio EPA for streams and rivers in Ohio (Rankin 1989, 1995). Various attributes of the habitat are scored based on the overall importance of each to the maintenance of viable, diverse, and functional aquatic faunas. The type(s) and quality of substrates, amount and quality of in-stream cover, channel morphology, extent and quality of riparian vegetation, pool, run, and riffle development and quality, and gradient are some of the metrics used to determine the QHEI score which generally ranges from 20 to 100. Examples of the QHEI data sheet are given in Appendix B. Substrate type(s) and quality are important factors of habitat quality and the QHEI score is partially based on these characteristics. Sites that have greater substrate diversity receive higher scores as they can provide greater habitat diversity for benthic organisms. The quality of substrate refers to the embeddedness of the benthic zone. Small particles of soil and organic matter will settle into small pores and crevices in the stream bottom. Many organisms can
Oliver, Olin, and Martin lakes Diagnostic Study October 16, 2009 LaGrange County, Indiana
File No.070874.00 Page 39
colonize these microhabitats, but high levels of silt in a streambed can result in the loss of habitat within the substrate, thus sites with heavy embeddedness and siltation receive lower QHEI scores for the substrate metric. In-stream cover, another metric of the QHEI, represents the type(s) and quantity of habitat provided within the stream itself. Examples of in-stream cover include woody logs and debris, aquatic and overhanging vegetation and root wads extending from the stream banks. The channel morphology metric evaluates the stream’s physical development with respect to habitat diversity. Pool and riffle development within the stream reach, the channel sinuosity and other factors that represent the stability and direct modification of the site are evaluated to comprise this metric score. A wooded riparian buffer is a vital functional component of riverine ecosystems. It is instrumental in the detention, removal and assimilation of nutrients. Riparian zones govern the quality of goods and services provided by riverine ecosystems (Ohio EPA, 1999). Riparian zone and bank erosion were examined at each site to evaluate the quality of the buffer zone of a stream, the land use within the floodplain that affects inputs to the waterway, and the extent of erosion in the stream, which can reflect insufficient vegetative stabilization of the stream banks. For the purposes of the QHEI, a riparian buffer is a zone that is forest, shrub, swamp, or woody old field vegetation. Typically, weedy, herbaceous vegetation has higher runoff potential than woody components and does not represent an acceptable riparian zone type for the QHEI (Ohio EPA, 1989). Metric 5 of the QHEI evaluates the quality of pool/glide and riffle/run habitats in the stream. These zones in a stream, when present, provide diverse habitat and in turn can increase habitat quality. The depth of pools within a reach and the stability of riffle substrate are some factors that affect the QHEI score in this metric. The final QHEI metric evaluates the topographic gradient in a stream reach. This is calculated using topographic data. The score for this metric is based on the premise that both very low and very high gradients in elevation will have negative effects on habitat quality. Moderate gradients receive the highest score, 10, for this metric. The gradient ranges for scoring take into account the varying influence of gradient with stream size. The QHEI is used to evaluate the characteristics of a stream segment, as opposed to the characteristics of a single sampling site. As such, individual sites may have poorer physical habitat due to a localized disturbance yet still support aquatic communities closely resembling those sampled at adjacent sites with better habitat, provided water quality conditions are similar. QHEI scores from hundreds of segments around Indiana have indicated that values greater than 64 are considered fully supporting of aquatic life use, scores between 51–64 are partially supporting, and scores less than 51 are non-supporting (IDEM, 2002). 3.3 Stream Assessment Results and Discussion 3.3.1 Water Chemistry Physical Concentrations and Characteristics Physical parameter results measured during base and storm flow sampling of the inlet streams of Oliver, Olin, and Martin Lakes (Site 1: Dove Creek, Site 2: Burt Hart Ditch, Site 3: Truman Flint Ditch, Site 4: Unnamed Tributary) are presented in Table 14. Stream discharges measured during base and storm flow conditions for all streams are shown in Figure 17. Storm flow sampling occurred after a 2 inch (5 cm) rainfall event. Site 1 was not sampled at base flow due to inadequate level of flow. Site 3 was not sampled at base flow due to inadequate flow velocity
Oliver, Olin, and Martin lakes Diagnostic Study October 16, 2009 LaGrange County, Indiana
File No.070874.00 Page 40
– although water was present in the ditch it was backed-up from the lake approximately 1000 feet (305 m) upstream from the designated sampling site. Comparison of base and storm flow conditions within a sampling site will be limited to Sites 2 and 4 throughout the remaining portion of the section. Information obtained from Sites 1 and 3 will be used to understand the storm flow conditions of the streams they represent. Table 14. Physical characteristics of the Oliver, Olin, and Martin lakes watershed stream samplings on 7/09/08 (storm flow) and 7/23/08 (base flow).
Figure 17. Discharge measurements during base flow and storm flow sampling of Oliver, Olin, and Martin lakes inlet streams. Dissolved oxygen concentrations in the OOM streams ranged from a high of 10.0 mg/L (96.2 % saturation) in Site 2 during base flow to a low of 2.9 mg/L (31.5% saturation) in Site 1 during storm flow. Oxygen is usually at saturation in flowing water because the turbulence helps equilibrate oxygen concentrations with the atmosphere, resulting in 100% saturation. Supersaturated (>100%) result from intense photosynthesis which, in a stream, comes primarily from periphyton (algae attached to rocks) and from rooted aquatic plants or from hyperaeration
Oliver, Olin, and Martin lakes Diagnostic Study October 16, 2009 LaGrange County, Indiana
File No.070874.00 Page 41
due to drop structures such as impoundments or waterfalls. Undersaturated (<100%) stream water is indicative of excessive oxygen consumption, usually from biological oxygen demand (BOD) or the amount of oxygen consumed by the respiration of stream microorganisms. None of the site sampled displayed optimal oxygen saturation indicating high BOD in all sites. Temperatures in the measured streams were either cooler or comparable during base flow compared to during storm flow (Figure 18). Due to the small size of the sampled streams they are most like fed by groundwater, which explains the lower temperatures during base flow as opposed to storm flow. Groundwater maintains a relatively stable temperature of 52-57° F (11.1-13.9° C) in northern Indiana.
Water Temperature
0
5
10
15
20
25
1 2 3 4
Site
Tem
pera
ture
(o C)
StormBase
Figure 18. Water temperatures measured at Oliver, Olin, and Martin lakes stream sampling sites during storm flow and base flow conditions. Storm flow turbidity varied from site to site with base flow measurements at Site 2 ~7.1 times higher during base flow than during storm flow (7.52 mg/L compared to 54.07 mg/L), while turbidity at Site 4 was ~2.3 times less during base flow as it was during storm flow (5.41 mg/L compared to 12.61 mg/L; Figure 17). The erosive force of storm runoff often washes soil and other particulates from the land into streams, resulting in higher turbidity and NTU concentrations. When we see lower storm flow turbidities, one of several things may be happening: 1) The watershed might be relatively undisturbed, especially in the riparian zone, limiting the availability of erodible materials, or 2) Pollen, phytoplankton, and/or localized disturbances may cause temporary increases in base flow turbidities. Similarly, Nephelometric Turbidity Units (NTU) concentrations usually increase with increased stream flow because of instream scouring and inputs from overland flow from surrounding lands. Sites 2 and 4 displayed the same relationship between timing and NTU. Site 2 had approximately 4.5 times as much material during base flow as compared to storm flow, while Site 4 had about half as much material during base flow as compared to storm flow. The high level of development and agriculture at Site 2 as compared to Site 4 probably explains this opposite relationship.
Oliver, Olin, and Martin lakes Diagnostic Study October 16, 2009 LaGrange County, Indiana
File No.070874.00 Page 42
Total Suspended Solids
0
10
20
30
40
50
60
1 2 3 4
Site
TSS
(mg/
L)
StormBase
Figure 19. Total suspended solids measured at Oliver, Olin, and Martin lakes stream sampling sites during storm flow and base flow conditions. Chemical and Bacterial Characteristics As discussed in Section 3.2.1, there are no state standards for phosphorus and nitrogen concentrations in streams. On the national or regional level, values vary and there is no consensus on a standard value for a particular nutrient. In a recent study of 85 relatively undeveloped basins across the United States (reference basins), the USGS reported the following median concentrations: ammonia (0.020 mg/L), nitrate (0.087 mg/L), soluble reactive phosphorus (0.010 mg/L), and total phosphorus (0.022 mg/L; Clark et al., 2000). These values can be considered reference points of relatively healthy, naturally-functioning streams and watersheds that can be compared to the streams and subwatersheds of the OOM lakes watershed. The State of Indiana does regulate the acceptable E. coli concentration in recreational water bodies at 235 colonies/100 ml. The sampling streams are not suitable for recreation (Site 4 was adjacent to a church and appeared to have a baptism pool excavated); however, we will use this value for the purpose of comparison. The chemical and bacterial characteristics are shown in Table 15. Except for two instances, nutrient concentrations within the OOM streams exceeded these reference basin concentrations with some parameters exceeding them by several orders of magnitude. Below is a more detailed description of individual water quality parameter measured during the study. Most of the data found in Table 15 will be repeated in graphic form as a way to provide a different way to illustrate a pattern.
Oliver, Olin, and Martin lakes Diagnostic Study October 16, 2009 LaGrange County, Indiana
File No.070874.00 Page 43
Table 15. Chemical and bacterial characteristics of the Oliver, Olin, and Martin lakes watershed stream samplings on 7/09/08 (storm flow) and 7/23/08 (base flow).
* Method Detection Limit Alkalinity concentrations were typical of well buffered streams – evidence of the presence of carbonates and other alkalinity-producing materials in the watershed’s bedrock. Alkalinity ranged from 221 to 309 mg/L CaCO3. Values for pH were on the alkaline side of neutrality, ranging from 7.4 to 8.3. The median nitrate concentration of wadeable streams found by the Ohio EPA to support modified warmwater habitat (MWH) is 1.6 mg/L (Ohio EPA, 1999). Although all sites exceed the USGS reference site nutrient loads, Site 1 storm flow and Site 4 base flow are within OEPA criteria (Figure 20). Sites 2 and 3 exceed OEPA criteria by 2-5 times in both flow regimes. During storm flow, Site 3 had the highest nitrate concentrations of the four streams. Heavy agricultural usage upstream from all sites could contribute to the high nitrate concentrations.
Oliver, Olin, and Martin lakes Diagnostic Study October 16, 2009 LaGrange County, Indiana
File No.070874.00 Page 44
Nitrate Concentrations
0123456789
10
1 2 3 4
Site
NO
3 (m
g/L)
Storm
Base
ReferenceBasin
Figure 20. Nitrate concentrations at Oliver, Olin, and Martin lakes stream sampling sites during storm flow and base flow conditions. Small streams are typically well oxygenated because of the turbulent flow; therefore, ammonia is usually oxidized to nitrate. However, the low gradient profile (less turbulence) and high agricultural usage within the watershed suggest that there is a high BOD resulting in higher than expected concentrations of ammonia (Figure 21).
Ammonia Concentrations
0.00
0.05
0.10
0.15
0.20
0.25
0.30
1 2 3 4
Site
NH 3
(mg/
L)
StormBaseReference Basin
Figure 21. Ammonia concentrations at Oliver, Olin, and Martin lakes stream sampling sites during storm flow and base flow conditions.
Oliver, Olin, and Martin lakes Diagnostic Study October 16, 2009 LaGrange County, Indiana
File No.070874.00 Page 45
Typically, storm flow concentrations of Total Kjeldahl Nitrogen (TKN) exceed base flow since runoff liberates significant organic material stored within the stream and in riparian areas adjacent to the stream. This occurred at Site 4; however, the base flow TKN concentration was higher than storm flow concentration at Site 2 (Figure 22). The high base flow TKN concentration at Site 2 could be related to the agricultural activity upstream.
Kjeldahl Nitrogen Concentrations
0.000.200.400.600.801.001.201.401.60
1 2 3 4
Site
TKN
(mg/
L)
StormBaseUSEPA
Figure 22. Total Kjeldahl nitrogren concentrations measured at Oliver, Olin, and Martin lakes stream sampling sites during storm flow and base flow conditions. Reference value of 0.591 mg/L comes from USEPA (2000b) recommendations. Since phosphorus readily adsorbs onto soil particles and organic matter, eroded soil carried by overland flow can contain a significant amount of phosphorus. Consequently, total phosphorus (TP) concentrations typically increase during storm events in disturbed watersheds. This occurred only at Site 4 (Figure 23). The narrow riparian zone and surrounding agricultural land use likely contributed to this. Lower storm flow TP concentrations at Site 2 suggest less availability of this nutrient and possible interception by the vegetated stream riparian zone.
Oliver, Olin, and Martin lakes Diagnostic Study October 16, 2009 LaGrange County, Indiana
File No.070874.00 Page 46
Total Phosphorus Concentrations
0.00
0.05
0.10
0.15
0.20
0.25
1 2 3 4
Site
TP (m
g/L)
StormBaseReference BasinUSEPA & OEPA
Figure 23. Total phosphorus concentrations measured at Oliver, Olin, and Martin lakes stream sampling sites during storm flow and base flow conditions. The reference value of 0.075 mg/L is the average recommendation from the USEPA (2000b) and OEPA (1999). Six samples from the OOM streams exceeded the Indiana state E. coli standard for recreational waterbodies, while two base flow samples were in compliance (Figure 24). The E. coli concentrations ranged from 64 col/100ml at Site 1 (base flow) to 9,200 col/100ml at Site 1 (storm flow). These high E. coli concentrations likely resulted from land use activities associated with livestock and/or inadequate septic systems.
Oliver, Olin, and Martin lakes Diagnostic Study October 16, 2009 LaGrange County, Indiana
File No.070874.00 Page 47
E. coli Concentrations
0
2000
4000
6000
8000
10000
1 2 3 4
Site
E. c
oli (
#/10
0 m
l)
StormBaseIAC Standard
Figure 24. E.coli concentrations measured at Oliver, Olin, and Martin lakes stream sampling sites during storm flow and base flow conditions. Chemical and Sediment Loading While pollutant concentration data provides an understanding of the water quality at a given time and the conditions to which stream biota are subjected, pollutant loading data provides an understanding of how much actual pollutant (mass) is delivered to a downstream waterbody per unit of time. For example, an inlet stream that has high pollutant concentrations does not necessarily contribute the greatest amount of pollutants to its downstream lake. If the inlet stream possesses a very low discharge (i.e. water flow), it likely does not transport as much pollution to the lake as other inlets to the lake that have higher discharge levels might. Thus, is it important to evaluate inlet streams’ pollutant loading rates to fully understand which inlet is contributing the greatest amount of pollutants to a lake. This information is essential to prioritizing watershed management. Table 16 lists the chemical and sediment loading data for the OOM lakes watershed sites. Figures 25 to 30 present mass loading information graphically. Loading rates were typically higher during storm flow than during base flow conditions. This is to be expected as both concentrations and water volume typically increase as overland flow increases.
Oliver, Olin, and Martin lakes Diagnostic Study October 16, 2009 LaGrange County, Indiana
File No.070874.00 Page 48
Table 16. Chemical and sediment load characteristics of the Oliver, Olin, and Martin lakes watershed streams on July 9, 2008 (storm flow) and July 23, 2008 (base flow).
Figure 25. Nitrate loads in the Oliver, Olin, and Martin lakes streams as sampled during storm flow and base flow conditions.
Oliver, Olin, and Martin lakes Diagnostic Study October 16, 2009 LaGrange County, Indiana
File No.070874.00 Page 49
Ammonia Loads
0.000.050.100.150.200.250.300.35
1 2 3 4
Site
Load
(kg/
d)
StormBase
Figure 26. Ammonia loads in the Oliver, Olin, and Martin lakes streams as sampled during storm flow and base flow conditions.
Total Kjeldahl Loads
0.00
2.00
4.00
6.00
8.00
10.00
12.00
1 2 3 4
Site
Load
(kg/
d)
StormBase
Figure 27. Total Kjeldahl nitrogen loads in the Oliver, Olin, and Martin lakes streams as sampled during storm flow and base flow conditions.
Oliver, Olin, and Martin lakes Diagnostic Study October 16, 2009 LaGrange County, Indiana
File No.070874.00 Page 50
Soluble Reactive Phosphorus Loads
0.00
0.10
0.20
0.30
0.40
0.50
1 2 3 4
Site
Load
(kg/
d)
StormBase
Figure 28. Soluble reactive phosphorus loads in the Oliver, Olin, and Martin lakes streams as sampled during storm flow and base flow conditions.
Total Phosphorus Loads
0.00
0.20
0.40
0.60
0.80
1.00
1.20
1 2 3 4
Site
Load
(kg/
d)
StormBase
Figure 29. Total phosphorus loads in the Oliver, Olin, and Martin lakes streams as sampled during storm flow and base flow conditions.
Oliver, Olin, and Martin lakes Diagnostic Study October 16, 2009 LaGrange County, Indiana
File No.070874.00 Page 51
Total Suspended Solids Loads
020406080
100120140160180
1 2 3 4
Site
Load
(kg/
d)
StormBase
Figure 30. Total suspended solids loads in the Oliver, Olin, and Martin lakes streams as sampled during storm flow and base flow conditions. As expressed in Figures 25-30, Site 4 contributes the highest daily load for all sediment and nutrient metrics during storm events followed by Site 1. Sites 2 and 3 appear to be contributing little during storm events. Site 4 (unnamed tributary to Martin Lake) and Site 1 (Dove Creek) have the largest watersheds of all the sampling sites and could account for this increased level of nutrient and sediment loading. 3.3.2 Macroinvertebrates The results of the macroinvertebrate analysis conducted at the OOM lakes stream sampling sites is given in Table 17. Table 16 presents the mIBI scores as well as the individual classification scores for each site. Macroinvertebrates were not collected at Sites 1 and 3 due to lack of an inadequate level of flow. The mIBI scores for Sites 2 and 4 indicate impairment of the macroinvertebrate community. Descriptions of the macroinvertebrate community sampled at each site can be found in the site descriptions in Section 3.3.3.
Oliver, Olin, and Martin lakes Diagnostic Study October 16, 2009 LaGrange County, Indiana
File No.070874.00 Page 52
Table 17. Classification Scores and mIBI Score for each sampling site directly entering Oliver, Olin, and Martin lakes watershed, 7/23/08.
Where: 0-2 = Severely Impaired, 2-4 = Moderately Impaired, 4-6 = Slightly Impaired, 6-8 = Nonimpaired 3.3.3 Stream Habitat Table 18 displays the results of the habitat classification for the OOM lakes stream sampling sites. Following the table is a site-by-site description of particular characteristics that contributed to the evaluation results. The Indiana Department of Environmental Management considers QHEI scores less than 51 indicates poor habitat (IDEM, 2002). Three of the sites fall well below this standard while only Site 4 exceeds it. The silty substrate, human development, and lack of riffle habitat at these stream sites generally resulted in very few QHEI points. Table 18. QHEI Scores for the OOM lakes stream sampling sites, 07/23/08.
Site Substrate Score
Cover Score
Channel Score
Riparian Score
Pool Score
Riffle Score
Gradient Score
Total Score
Maximum Possible
Score 20 20 20 10 12 8 10 100
Site 1 7 12 7 5.5 2.0 0 6 39.5 Site 2 5 10 10 5.5 0 0 8 38.5 Site 3 5 11 5 3.5 5 0 2 31.5 Site 4 12 15 13 7 9 2 8 66
Oliver, Olin, and Martin lakes Diagnostic Study October 16, 2009 LaGrange County, Indiana
File No.070874.00 Page 53
Oliver,Olin, and Martin Stream Sampling Site Descriptions Site 1 - Dove Creek. Row crop agriculture and residential development were the landscape features surrounding the stream site. The stream marked the boundary between two houses south of CR 455. The houses appeared to be observing a 6 - 10 feet (1.8 - 3.0 m) un-mowed buffer consisting of shrubs with some grasses along the creek, but large trees stabilizing the bank were mostly absent. On the north side of the road, the field was planted with corn. Instream cover at the site was sparse, one deep pool was present at the outlet of a drainage culvert under the road but little flow was entering or exiting the pool at that time. There was a great deal of woody debris in the creek, most likely because the creek lacked sufficient discharge to remove it. Bank erosion was moderate. Channelization of the stream channel to create and preserve the property boundaries in the past was apparent, but there was no evidence of recent modification. Consequently, sinuosity and pool and riffle development were low. The prominent substrate at the site was a mixture of sand, silt, and gravel with extensive embeddedness. Site 1 scored poorly within the OOM watershed with a QHEI score of 39.5 out of 100. Site 2 - Burt Hart Ditch. Agricultural fields and residential yards were the prominent land use characteristics at this stream site. The size of the riparian buffer was variable (0-100 or more feet; 0 – 30.5 m), but the upstream extent was not more than 1,000 feet (305 m). Vegetation located within the buffer was a young successional forest composed of trees and shrubs. The stream contained moderate instream cover with a great deal of woody debris. Although undercut banks were present in some places they did not appear to be stable for long periods as bank erosion was high along both banks. The stream site sinuosity was low and riffles and pools were absent. Channelization and bank modifications had occurred downstream from the sampling site where it passed under the road and entered the lake. Channelization had also likely occurred without bank modifications to better define property boundaries. A mixture of sand, silt, and muck were the dominant substrate types. This lack of quality substrate contributed significantly to the low QHEI score of 38.5 out of 100 points. The mIBI for site 2 was a 2.0 indicating that the stream was moderately impaired. Eighty-one percent of all the macroinvertebrates collected were Amphipoda:Gammaridae, which is a family that is moderately to highly tolerant of poor water conditions.
Figure 31. Example of the sampling Site 2, Burt Hart Ditch.
Oliver, Olin, and Martin lakes Diagnostic Study October 16, 2009 LaGrange County, Indiana
File No.070874.00 Page 54
Figure 32. Burt Hart Ditch at sampling Site 2. Site 3 - Truman Flint Ditch. Open pastures and residential land were the prominent land use features surrounding the stream site. The riparian buffer was absent on the right side of the stream and narrow, between 16 and 30 feet (5 and 9 m) on the left side. Vegetation on the right bank was comprised of tall grasses while the left bank was dominated by a steeper slope with trees growing on it. Instream cover, except overhanging grasses, a few shrubs, and poorly stabilized undercut banks was absent. The stream was still channelized and lacked sinuosity, as a result, riffles and runs were also absent. The dominant substrate in the stream was silt and muck with sand present in lower quantities. The channelization, poor cover and substrate, and lack of riffles contributed to the low QHEI score of 31.5 points out of 100. Site 4 - Unnamed Tributary. Urban lawn, row crop agriculture, and forest were the dominant land use features at, upstream, and downstream from the site respectively. Fifty feet of the left side of the stream and 20 feet (6.1 m) of the right side of the stream had been mowed to the water’s edge. Consequently, instream cover in these areas was nearly absent. The deep pool appears to be manmade for use by the adjacent church in baptisms, although this pool is deep, there is no overhanging vegetation shading or otherwise providing cover near the pool. Bank erosion could be observed in the sections where vegetation had been removed. Downstream from the site, was state forest land and the riparian zone were very wide and there was a large amount of woody vegetation. Upstream and downstream from the site showed relatively good sinuosity with decent pool and riffle development. The dominant substrate components were sand and gravel which were moderately embedded. All categories scored fairly well with the exception of riffle and substrate metrics – this resulted in the highest score in the watershed with a QHEI score of 66 out of 100. The mIBI metric for this site was 4.4 which corresponds to a ranking of slightly impaired. The macroinvertebrate community was again dominated (45%) by the pollution tolerant family Amphipoda:Gammaridae. Indicators of good water quality, the
Oliver, Olin, and Martin lakes Diagnostic Study October 16, 2009 LaGrange County, Indiana
File No.070874.00 Page 55
pollution intolerant Ephemeroptera:Baetidae and Trichoptera:Hydropsychidae, in total comprised about 47% of the macroinvertebrate community.
Figure 33. Site 4 - Unnamed Tributary at manmade pool
Figure 34. Site 4 - Unnamed Tributary looking downstream with researcher at sampling site. The Qualitative Habitat Evaluation Index (QHEI) is used as a screening tool for regional variation in habitat quality (Rankin, 1989). The overall assessment of habitat quality for this study of Oliver, Olin, and Martin chain of lakes indicates that, by IDEM’s standards, only one of these streams is capable providing habitat which will support aquatic life. Sites 1-3 lacked key elements of natural, healthy stream habitats, which in turn limits the functionality of these ecological systems. The QHEI evaluations from these sites indicate that the streams are lacking adequate substrate. Stream bottoms are dominated by silty materials that offer little habitat for stream macroinvertebrates. In addition many of the streams are lacking sufficient
Oliver, Olin, and Martin lakes Diagnostic Study October 16, 2009 LaGrange County, Indiana
File No.070874.00 Page 56
pool and riffle development, and generally have poor in stream cover despite its presence in the QHEI. The watersheds of these streams are composed primarily of agricultural fields, with some residential development. This results in a riparian buffer incapable of sufficiently filtering the agricultural runoff. The mIBI scores at Sites 2 (moderately impaired) reflect the poor silty substrate and the mIBI at Site 4 (slightly impaired) reflects the higher quality sand and gravel substrate. Heavy sediment loading is an apparent factor in the degradation of the study sites; Site 2 in particular has accumulated a considerable amount of silt. This sedimentation leads to extensive substrate embeddedness which severely limits habitat diversity within the stream channel by filling in gaps among rocks and gravel that benthic organisms would inhabit. This heavy sediment loading is also reflected in the poor substrate scores of the QHEI evaluations. This, again, is due to the heavy agricultural usage within the watersheds as well as the lack of riparian buffer in most cases. The range of substrate scores was 5 to 12 out of a possible 20, with all but one of the sites scoring below 7 (Table 18). Most of the sites show moderate streambank erosion which can be a source for some of the sediment, however, the surrounding land use most likely plays the dominant role in sediment loading. Watersheds that are dominated by agricultural activity typically contain streams that have had their stream channel morphology greatly manipulated through bank shaping, dredging, and straightening. This puts to risk the integrity of the biological communities. Riffles and pools are important habitats in streams that provide greater habitat diversity and thus, greater macroinvertebrate and fish diversity. The lack of pool development is likely associated with land use alterations, past stream channelization, and the heavy sedimentation. These combined activities interfere with typical sorting of particles that forms both riffles and pools (Allen, 1995). The OOM lakes watershed mIBI scores indicated slight and moderate impairment at the two sites sampled (Table 17). Healthy streams contain a diverse community of both species that are tolerant and intolerant to pollution. Streams which become impaired or polluted will tend to have few intolerant organisms, and will be largely comprised of tolerant species. Within the metrics of the mIBI, the Hilsenhoff Biotic Index (HBI) is calculated to rate the tolerance of the species found. Individual Taxa are assigned values between 0 and 10 with 0 being least tolerant and 10 being the most tolerant (Hillsenhoff, 1988). The HBI scores were 4.5 at both sites indicating that, while not dominated by pollution sensitive species, enough sensitive species can thrive there. Therefore other indices will be more revealing as to the health of the stream. Ephemeroptera, Plecoptera, and Trichoptera (EPT) represent “pollution sensitive” orders, and their presence is often associated with healthy streams. Site 4 supported a total of 44 EPT in two families while Site 2 contained only 1 individual. This difference in EPT species present accounts for the difference in mIBI scores. This general lack of EPT taxa at Site 2 suggests the presence of pollution, most likely the heavy silt load, in its watershed. Along with suitable habitat in which to live, benthic communities also need sufficient water quality. The Ohio EPA found degraded biotic communities to be present when median nitrate-nitrogen concentrations exceeded 3-4 mg/L; base flow data should be used because base flow conditions will represent the residual nutrient concentrations in the stream (Ohio EPA, 1999). This would further explain the degradation of Site 2 vs. 4 since at base flow Site 4 had a nitrate concentration of 1.3 mg/L while Site 2 had a concentration of 6.5 mg/L. According to QHEI and mIBI scores, the northern watershed of the OOM lakes is moderately impaired while the southern watershed (note only 1 stream) is only slightly to moderately impaired. Only Site 2 was supportive of aquatic life by the QHEI standards set by IDEM. All of
Oliver, Olin, and Martin lakes Diagnostic Study October 16, 2009 LaGrange County, Indiana
File No.070874.00 Page 57
the mIBI scores recorded in the streams also indicate slight to moderate impairment based on the macroinvertebrate assemblages. These scores indicate that there is excess sedimentation in the watershed causing QHEI scores to be low. 4.0 LAKE ASSESSMENT 4.1 Morphology A lake’s morphology can play a role in shaping the lake’s biotic communities. For example, the OOM chain is characteristically deep, with steep drop-offs and few shallow areas and would suggest the chain does not support an extensive rooted plant community. Based on Oliver, Olin, and Martin Lake’s water clarity, the littoral zone (or the zone capable of supporting aquatic rooted plants) extends from the shoreline to the point where water depths are approximately 20.5, 19, and 17.4 feet (6.2, 5.8, and 5.3 m) respectively. This depth is determined using the 1 % light level metric or the depth at which only 1% of available surface light penetrates. Using the depth-area curve (Figures 36, 39, and 41) the area able to support aquatic rooted plants within Oliver, Olin, and Martin Lakes is 30, 24.5, and 28.6 % of the lakes surface area, respectively. The size of the littoral zone can have an impact on other biotic communities in a lake such as fish that use the plant community for forage, spawning, cover, and resting habitat. A lake’s morphology can indirectly influence water quality by shaping the human communities around the lake. The shoreline development ratio is a measure of the development potential of a lake. It is calculated by dividing a lake’s shoreline length by the circumference of a circle that has the same area as the lake. A perfectly circular lake with the same area as Oliver Lake (391.9 acres or 158.6 ha) would have a circumference of 14,642.4 feet (4,463 m). Dividing Oliver Lake’s shoreline length (29,200 feet or 8,900.1 m) by 14,642.4 feet (4,463 m) yields a ratio of 2:1, which is relatively common for most lakes. Olin and Martin Lakes have a slightly lower shoreline development ratio, 1.6 and 1.5, respectively, which is considered relatively low. Oliver, Olin, and Martin are relatively round and lack extensive shoreline channeling contrasting those ratios observed on other popular Indiana lakes such as the Barbee Chain and Lake Tippecanoe in Kosciusko County. Given the immense popularity of lakes in northern Indiana, lakes with high shoreline development ratios are often highly developed. Increased development around lakes often leads to decreased water quality. 4.1.1 Oliver Lake Oliver Lake is a medium-sized, deep lake with a surface area of 391.9 acres (158.6 ha), and volume of 15,416 acre-feet (19,014,846 m3). Depth-area and depth-volume curves were prepared for Oliver Lake using a bathymetric map (Figure 35) prepared by the IDNR Division of Water in 1954 (IDNR, 1954). According to the depth-area curve (Figure 36), roughly 78.4 acres (31.7 ha) of the lake is covered by water less than 5 feet (1.5 m) deep, while 172.4 acres (69.8 ha) is covered by water less than 20 feet (8.1 m) deep. This translates into a low shallowness ratio of 0.20 (ratio of area less than 5 feet (1.5 m) deep to total lake area) and a moderate shoalness ratio of 0.44 (ratio of area less than 20 feet (8.1 m) deep to total lake area) (Table 19) as defined by Wagner (1991). Figure 36 shows that below 5 feet (1.5 m) Oliver Lake steadily deepens to the maximum depth of 93 feet (28.3 m). The low slope of the curve from 0 – 5 feet (0-1.5 m) indicates that there are shallows capable of supporting rooted aquatic plants.
Oliver, Olin, and Martin lakes Diagnostic Study October 16, 2009 LaGrange County, Indiana
File No.070874.00 Page 58
Figure 35. Oliver Lake bathymetric map. Source: IDNR, 1956. Table 19. Lake characteristics for Oliver Lake. Characteristic Value Surface Area 391.9 acres (158.6 ha) Volume 15,416 acre-ft (19,014,846 m3) Maximum Depth 93 ft (28.3 m) Mean Depth 40 ft (12.2 m) Shallowness Ratio 0.20 Shoalness Ratio 0.44 Shoreline Length 29,200 ft (8,900.2 m) Shoreline Development Ratio 2.0
Oliver, Olin, and Martin lakes Diagnostic Study October 16, 2009 LaGrange County, Indiana
File No.070874.00 Page 59
0102030405060708090
1000 100 200 300 400
Dep
th (f
t)
Area (acres)
Depth-Area Curve - Oliver Lake
1 % Light Level
Figure 36. Depth-area curve for Oliver Lake Figure 37 shows that volume gradually increases until about 70 feet (21.3 m) where after the curve steepens indicating a greater change in depth per unit volume. Therefore, there is only a very small volume of water deeper than 70 feet (21.3 m) in Oliver Lake.
Figure 37. Depth-volume curve for Oliver Lake 4.1.2 Olin Lake Olin Lake is a small-sized lake with a surface area of 101.4 acres (41 ha), and volume of 3,949 acre-feet (4,870,889.3 m3). Depth-area and depth-volume curves were calculated for Olin Lake
Oliver, Olin, and Martin lakes Diagnostic Study October 16, 2009 LaGrange County, Indiana
File No.070874.00 Page 60
using a bathymetric map (Figure 38) prepared by the IDNR Division of Water in 1954 (IDNR, 1956). According to its depth-area curve (Figure 39), roughly 23.3 acres (9.4 ha) is covered by water less than 5 feet (1.5 m) deep, while 53.7 acres (21.7 ha) is covered by water less than 20 feet (6.1 m) deep. This translates into a low shallowness ratio of 0.23 and a low shoalness ratio of 0.53 (Table 20), as defined by Wagner (1991). Figure 39 shows that below ~7 feet (2.1 m) Olin Lake steadily deepens to its maximum depth of 83 feet (25.3 m). The low slope of the curve from 0 – 7 feet (0-2.1 m) indicates that there are shallows capable of supporting rooted aquatic plants. The relative straightness of the curve indicates that shallow and deep water are relatively proportionate in this lake. For example, there aren’t excessive shallows to support rooted aquatic plants.
Figure 38. Olin and Martin lakes bathymetric map. Source, IDNR, 1956. Table 20. Lake characteristics for Olin Lake. Characteristic Value Surface Area 101.4 acres (41 ha) Volume 3,949 acre-ft (4,870,889.3 m3)Maximum Depth 83 ft (25.3 m) Mean Depth 38 ft (11.6 m) Shallowness Ratio 0.23 Shoalness Ratio 0.53 Shoreline Length 11,625 ft (3,543.3) Shoreline Development Ratio 1.6
Oliver, Olin, and Martin lakes Diagnostic Study October 16, 2009 LaGrange County, Indiana
File No.070874.00 Page 61
01020304050607080
0 10 20 30 40 50 60 70 80 90 100
Dep
th (f
t)
Area (acres)
Depth-Area Curve - Olin Lake
1% Light Level
Figure 39. Depth-area curve for Olin Lake Figure 40 shows that volume gradually increases until about 50-feet (15.2 m) where after the curve steepens indicating a greater change in depth per unit volume. Thus, there is only a very small volume of water deeper than 50 feet (15.2m) in Olin Lake.
01020304050607080
0 500 1000 1500 2000 2500 3000 3500 4000
Dep
th (f
t)
Volume (acre-feet)
Depth-Volume Curve - Olin Lake
1% Light Level
Figure 40. Depth-volume curve for Olin Lake 4.1.3 Martin Lake Martin Lake is a small-sized lake with a surface area of 25.6 acres (10.3 ha), and volume of 885.3 acre-feet (1,091,972.2 m3). Depth-area and depth-volume curves were prepared for
Oliver, Olin, and Martin lakes Diagnostic Study October 16, 2009 LaGrange County, Indiana
File No.070874.00 Page 62
Martin Lake using a bathymetric map (Figure 38) prepared by the IDNR Division of Water in 1954 (IDNR, 1956). According to its depth-area curve (Figure 41), roughly 6.7 acres (2.7 ha) is covered by water less than 5 ft (1.5 m) deep, while 14.3 acres (5.8 ha) is covered by water less than 20 feet (6.1 m) deep. This translates into a low shallowness ratio of 0.26 and a low shoalness ratio of 0.56 (Table 21), as defined by Wagner (1991). Figure 41 shows that between 5 and 45 feet (1.5 and 13.7 m) Martin Lake steadily deepens. Below 45 feet (13.7 m) depth increases more gradually to its maximum depth of 56 feet (17.1 m). The lower slope of the curve from 0 – 5 feet (0-1.5 m) indicates that there are shallows capable of supporting rooted aquatic plants. The sigmoid shape of this curve indicates that the shallow and deep water are disproportionate in this lake and that there is more deep water than shallow water. For example, there aren’t excessive shallows to support rooted aquatic plants.
Figure 41. Depth-area curve for Martin Lake Figure 42 shows that volume gradually increases until about 50 feet (15.2 m) deep where after the curve steepen indicating a greater change in depth per unit volume. Thus, there is only a very small volume of water deeper than 50 feet (15.2 m) in Martin Lake. Table 21. Lake characteristics for Martin Lake. Characteristic Value Surface Area 25.6 acres (10.3 ha) Volume 885.3 acre-feet
(1,091,972.2 m3) Maximum Depth 56 feet (17.1 m) Mean Depth 34 feet (10.4 m) Shallowness Ratio 0.26 Shoalness Ratio 0.56 Shoreline Length 5,100feet (1,554.5 m) Shoreline Development Ratio 1.4
Oliver, Olin, and Martin lakes Diagnostic Study October 16, 2009 LaGrange County, Indiana
File No.070874.00 Page 63
Figure 42. Depth-volume curve for Martin Lake 4.2 Shoreline Development A review of an aerial map from 1938 revealed that there were 15 homes and the Purdue University Limberlost Nature Camp on the north and east shore of Oliver Lake (Grant, 1989). At least until 1938, the shoreline of Olin and Martin lakes were still undeveloped. By 1965, the south shore of Oliver lake was the only remaining undeveloped section of the lake. Eight channels had been dug on the west side of the lake to accommodate 35 additional homes (Grant, 1989). Olin Lake remained undeveloped and Martin Lake had development on the north shore; however, no channels had been created to increase lake access. Between 1965 and 1986, there was little change in the amount of development on Oliver Lake (Grant, 1989). A few homes on the west side of the lake and a campground on a channel had been added. Olin Lake remained undeveloped and continues to be the largest, undeveloped lake in Indiana. Several homes were added along the north shoreline of Martin Lake. A modified shoreline usually accompanies shoreline development. Lake residents may install seawalls, convert native vegetation to turf grass, and modify aquatic vegetation by either removing or treating it, or creating personal beaches. The end result can be a loss of habitat for fish and other aquatic organisms and increased wave energy that creates shoreline erosion and re-suspends sediment in shallow water areas. The shorelines of Oliver, Olin, and Martin lakes were assessed during the diagnostic study to quantify the current level of shoreline development. The shorelines of Oliver, Olin, and Martin Lakes were defined as either natural, modified natural, or modified.
Oliver, Olin, and Martin lakes Diagnostic Study October 16, 2009 LaGrange County, Indiana
File No.070874.00 Page 64
Figure 43. Shoreline development survey results from October 2008. Natural shoreline remains along approximately 54% of the OOM lake’s shoreline (Figure 43). Natural shoreline comprises 35% of Oliver Lake’s shoreline, this being confined to the southern portion and public access channel. Olin Lake as mentioned earlier is entirely undeveloped and comprised of 100% natural shoreline. Fifty-four percent of Martin Lake’s shoreline is natural. Along natural shorelines, trees, emergent vegetation, floating vegetation, and submergent vegetation are present in distinct zones (Figure 44). In these areas, the submergent, floating, emergent, and shoreline canopy layers all remain intact.
Oliver, Olin, and Martin lakes Diagnostic Study October 16, 2009 LaGrange County, Indiana
File No.070874.00 Page 65
Figure 44. Example of the existing natural shoreline along Oliver Lake. Modified shoreline accounts for 23% of the shoreline in OOM lake’s (Figure 43). Oliver Lake accounts for 97% of the modified shoreline in the OOM chain. Modified shoreline in Oliver Lake comprises 35% of the shoreline. Modified shoreline is greatest in Oliver Lake because of the increased level of residential development and creation of channels. Martin Lake accounts for the remaining 3% of modified shoreline. Martin Lake itself is only composed of modified shoreline along approximately 6% of its shores. Along the modified portions of Oliver and Martin Lakes shoreline emergent and floating rooted vegetation has been completely removed from adjacent to the shoreline (Figure 45). This leaves exposed soils or mowed, residential lawns exposed to wave action. In some areas wooden railroad timbers, concrete seawalls, glacial stone, or riprap cover the shoreline.
Figure 45. Example of the existing modified shoreline along Oliver Lake. Modified natural shoreline accounts for 23% of the shoreline in OOM lakes. By percentage of individual lake shoreline Martin Lake has the highest percentage of modified natural shoreline (40%), while Oliver Lake accounts for the greatest overall percentage of modified natural shoreline in OOM lakes (81%). Within Oliver Lake, modified natural shoreline accounts for 30%
Oliver, Olin, and Martin lakes Diagnostic Study October 16, 2009 LaGrange County, Indiana
File No.070874.00 Page 66
of the shoreline. Along modified natural shorelines trees and emergent vegetation have been thinned; however, these areas possess at least a narrow band of emergent plants. These areas are mapped as modified natural shoreline because they still possess at least a small portion of all these strata (submergent, emergent, and floating). Other portions of the shoreline that are also mapped as modified natural include those areas where individuals removed only the portion of the shoreline vegetation required to view or access the lake such as the property depicted in Figure 46.
Figure 46. Example of a modified natural shoreline along Oliver Lake. Note that vegetation was removed in areas required to place the dock for access to the lake. The remaining vegetation along the shoreline acts as a natural buffer. The shoreline surface becomes especially important in and adjacent to shallow portions of Oliver Lake. In areas where concrete seawalls are present, wave energy from wind and boats strike the flat surface and reflect back into the lake. This creates an almost continuous turbulence in the shallow areas of the lake. Where the waves reflect back into the lake and meet incoming waves, the wave height increases resulting in additional in-lake turbulence. This turbulence re-suspends bottom sediments thereby increasing the transfer of nutrients from the sediment-water interface to the water column. Continuous disturbance in shallow areas can also encourage the growth of disturbance-oriented plants. In contrast, shorelines vegetated with emergent or rooted floating vegetation or those areas covered by sand will absorb more of the wave energy created by wind or boats. In these locations, wave energy will dissipate along the shoreline each time a wave meets the shoreline surface. Similarly, stone seawalls or those covered by wood can decrease shallow water turbulence and lakeward wave energy reflection while still providing shoreline stabilization. 4.3 Historical Water Quality 4.3.1 Oliver Lake Historical Water Quality Data The Indiana Department of Natural Resources, Division of Fish and Wildlife, the Indiana State Pollution Control Board, the Indiana Clean Lakes Program (CLP), the LaGrange County Health Department (LCHD), the USEPA, F.X. Browne, and Volunteer Monitors have conducted various water quality tests on Oliver Lake. Table 22 presents some selected water quality parameters for these assessments of Oliver Lake.
Oliver, Olin, and Martin lakes Diagnostic Study October 16, 2009 LaGrange County, Indiana
File No.070874.00 Page 67
Table 22. Summary of historic data for Oliver Lake.
^Water column average; all other values are means of epilimnion and hypolimnion values. *Volunteer monitoring data is the average for that year’s monitoring effort. Appendix C contains all of the raw data represented by these numbers. Based on the data presented in Table 22, water quality in Oliver Lake has remained stable over the past 35 years. Water clarity is relatively good for the region. Since 1972, Secchi disk transparency (a measure of water clarity) has ranged from 4.6 feet (1.4 m) in June 2000 to 23.3 feet (7.1 m) in April 1994. These measurements follow a pattern typically observed in Indiana lakes. Water clarity is generally better during the spring, early summer, and fall than clarity measurements that occur during the middle of the summer and early fall (July to September). This trend is more apparent when individual monthly median and average Secchi disk transparencies are observed (Table 23). The best (highest) monthly averages and median
Oliver, Olin, and Martin lakes Diagnostic Study October 16, 2009 LaGrange County, Indiana
File No.070874.00 Page 68
transparencies occur during April and May (18.5 feet (5.6 m) and 14.5 feet (4.5 m), respectively), while the poorest (lowest) average and median transparencies occur during August (7.6 feet (2.3 m) and 7.6 feet (2.3 m), respectively). Table 23. Median and average transparencies measured in Oliver Lake from 1972 to 2007. Month Average Transparency (feet) Median Transparency (feet) Count April 18.8 18.6 4 May 14.5 14.5 23 June 9.4 9.0 35 July 7.7 7.8 52 August 7.6 7.6 41 September 8.9 8.6 26 October 13.5 13.3 13 Overall 9.6 8.4 194
Overall, water clarity has been variable over the years with a slight trend toward decreasing water clarity. Data collected by a citizen volunteer and other organizations on the lake suggest that clarity has remained relatively stable or declined slightly over the past 35 years (Figure 47). It should be noted that the suggested trend in water clarity may be due more to the lack of early and late season transparency measurements in recent years. Another way to investigate this trend is to look at the monthly Secchi disk measurements over time and see if each particular month has trended towards decreasing water quality. From 1993 through 2007, both July and August Secchi disk measurements have been relatively constant; however, June and September measurements have trended towards decreasing water quality (Figure 48). As detailed above and in Table 23, water clarity is typically best in Oliver Lake during the spring and fall. There were no readings in 2006 for June or September, which may contribute to the suggestion that there is a decline in water quality which may not, in fact, be present.
Oliver, Olin, and Martin lakes Diagnostic Study October 16, 2009 LaGrange County, Indiana
File No.070874.00 Page 69
0.0
5.0
10.0
15.0
20.0
25.0Jan-93 Jan-98 Jan-03 Jan-08
Secc
hi D
epth
(ft)
Time
Oliver Lake Secchi Disk Transparency
Figure 47. Historic Secchi disk transparency data for Oliver Lake. Source: CLP, 1993, 2000, 2003, 2006; F.X. Browne, 1991, Grant, 1989; ISPCB, 1986; Ledet, 1984; Peterson, 1972; USEPA, 1975; Volunteer monitors, 1993-2007.
Figure 48. Secchi disk transparency trends in Oliver Lake from 1993 to 2007 for the months of June through September. Line represents the overall trend of data for each month. Total phosphorus concentrations have generally remained low within Oliver Lake with three notable exceptions. Total phosphorus concentrations ranged from 0.006 mg/L in August 2005
Oliver, Olin, and Martin lakes Diagnostic Study October 16, 2009 LaGrange County, Indiana
File No.070874.00 Page 70
(volunteer monitor) to 0.400 mg/L in July 1972 (ISPCB, 1986). Three of the concentrations measured in total phosphorus samples collected in the previous 35 years are relatively high compared with other total phosphorus concentrations measured in Oliver Lake. All three of these, 0.4 mg/L in 1972 and 0.33 in 1977 (ISPCB, 1986) and 0.083 mg/L in 1975 (Grant, 1989) are water column composite sample rather than separate surface water (epilimnetic) and bottom water (hypolimnetic) samples. Two of the three samples exceeded the median total phosphorus concentration measured in most Indiana lakes (0.17 mg/L). These data appear to be outliers as all other total phosphorus concentrations are relatively low (Figure 49) typically measuring less than 0.05 mg/L.
Oliver Lake Total Phosphorus Concentration
0.00
0.05
0.10
0.15
0.20
0.25
0.30
0.35
0.40
0.45
May-64 May-74 May-84 May-94 May-04
Time
Tota
l Pho
spho
rus
(mg/
L)
Figure 49. Historic total phosphorus concentrations measured in Oliver Lake. Source: CLP, 1993, 2000, 2003, 2006; F.X. Brown, 1991, Grant, 1989; ISPCB, 1986; Ledet, 1984; Peterson, 1972; USEPA, 1975; Volunteer monitors, 1993-2007. The lake’s algae (plankton) density reflects the relatively low nutrient levels typically present in Oliver Lake. Nutrients (nitrogen and phosphorus) promote the growth of algae and/or rooted plant populations. Thus, lakes with high nutrient levels are expected to support dense algae and/or rooted plants. Low chlorophyll a concentrations also reflect the relatively low plankton densities and total phosphorus concentrations found in the lake. None of the chlorophyll a concentrations exceed the median concentration measured in Indiana lakes (12.9 µg/L). Chlorophyll a concentrations range from the detection level (0.02 µg/L) to 5.2 µg/L in May 1975. The lake’s overall trophic index (TSI) scores from 3 in 2000 to 22 in 1993. All of these scores suggest that the lake is oligotrophic to mesotrophic or relatively unproductive to slightly productive. (Please see the following sections for more detailed discussion of lake water quality parameters and trophic state indices.) Oliver Lake Historic Temperature and Dissolved Oxygen Data
Oliver, Olin, and Martin lakes Diagnostic Study October 16, 2009 LaGrange County, Indiana
File No.070874.00 Page 71
Figure 50 displays the temperature profiles recorded during IDNR fisheries surveys, Indiana CLP assessments, and volunteer collected data. All of the temperature profiles show that Oliver Lake was stratified. The developed hypolimnion present during the surveys is very typical of Indiana lakes.
Figure 50. Historical temperature profiles for Oliver Lake. Much of the data presented above suggest that Oliver Lake is only moderately productive and the historical percent oxic results (Table 23) and dissolved oxygen profiles (Figure 51) support these determinations. Dissolved oxygen data indicate that the lake typically possessed dissolved oxygen greater than 1 mg/L in approximately 85% of the water column (Table 23). However, in deep waters, dissolved oxygen declines to less than 1 mg/L. This decline in dissolved oxygen limits the availability of habitat for the lake’s inhabitants and increases the potential for nutrient release from the lake’s bottom sediments. The dissolved oxygen profiles illustrate typical conditions found in Oliver Lake, which is unique to a select set of lakes in Indiana. In these lakes there is a sharp increase in dissolved oxygen in the lake’s metalimnion. This results in a positive-heterograde profile. Positive-heterograde profiles are characterized by a peak in oxygen concentration at a depth below the water surface, such as the peak in the 1983 profile beginning at 15 feet (4.6 m) below the water’s surface. The peak is likely associated with a higher concentration in phytoplankton at that particular depth layer. Called a metalimnetic oxygen maximum, the peak results when the rate of settling plankton slows in the denser waters of the metalimnion. At this depth, the plankton can take advantage of nutrients diffusing from the nutrient-enriched hypolimnion. As the plankton at this depth photosynthesize, they release oxygen into the water column, creating a peak in oxygen at that level. Assessment profiles before 2006 include metalimnetic oxygen maxima, although in all of these cases, the peaks are much smaller than that present during the 1983 assessment. During the most recent assessment in 2006 and from volunteer data provided for 2007 and 2008, a decline in dissolved oxygen precludes the peak observed at 17 feet (5.2 m). This drop in dissolved oxygen represents a negative heterograde profile or a metalimnetic oxygen minimum.
Oliver, Olin, and Martin lakes Diagnostic Study October 16, 2009 LaGrange County, Indiana
Figure 51. Historical dissolved oxygen profiles for Oliver Lake. 4.3.2 Olin Lake Historical Water Quality The Indiana Department of Natural Resources, Division of Fish and Wildlife, the Indiana State Pollution Control Board, the Indiana Clean Lakes Program (CLP), the LaGrange County Health Department (LCHD), the USEPA, F.X. Browne, and Volunteer Monitors have conducted various water quality tests on Olin Lake. Table 24 presents some selected water quality parameters for these assessments of Olin Lake.
Oliver, Olin, and Martin lakes Diagnostic Study October 16, 2009 LaGrange County, Indiana
^Water column average; all other values are means of epilimnion and hypolimnion values. *Volunteer monitoring data is the average for that year’s monitoring effort. Appendix C contains all of the raw data represented by these numbers. Based on the data presented in Table 24, water quality in Olin Lake has remained stable over the past 35 years. Water clarity is relatively good for the region. Since 1972, Secchi disk transparency (a measure of water clarity) has ranged from a minimum of 2.0 feet (0.6 m) in May 2003 to 23.2 feet (7.1 m) in April 2004 (Appendix C). Olin Lake follows a pattern typically observed in Indiana lakes. Water clarity is generally better during the spring, early summer, and fall than clarity measurements that occur during the middle of the summer and early fall (July to September). This trend is more apparent when individual monthly median and average Secchi
Oliver, Olin, and Martin lakes Diagnostic Study October 16, 2009 LaGrange County, Indiana
File No.070874.00 Page 74
disk transparencies are observed (Table 25). The best (highest) monthly average transparencies occur during April and October 20.0 feet (6.1 m) and 14.8 feet (4.5 m), respectively, while the poorest (lowest) average transparencies occur during July (8.2 feet; 2.5 m). Table 25. Median and average transparencies measured in Olin Lake from 1972 to 2007. Month Average Transparency (feet) Median Transparency (feet) Count April 20 21 4 May 11.3 10.3 23 June 9.7 8.9 35 July 8.2 7.8 52 August 8.5 8.1 41 September 10 9.6 27 October 14.8 14.9 13 Overall 9.8 8.7 195
Overall, water clarity has been variable over the years with a slight trend toward decreasing water clarity. Data collected by a citizen volunteer and other organizations on the lake suggest that clarity has remained relatively stable or declined slightly over the past 35 years (Figure 52). It should be noted that the suggested trend in water clarity may be due more to the lack of early and late season transparency measurements in recent years. As with Oliver Lake there is another way to investigate this trend. By looking at the monthly Secchi disk measurements over time, one can see if each particular month has trended towards decreasing water quality. From 1993 through 2007, June, July, and September measurements have trended towards decreasing water quality (Figure 53) while August has remained relatively unchanged (a flat trend line). As detailed above and in Table 25, water clarity is typically best in Olin Lake during the spring and fall. There were no readings for June or September in 2006, which could potentially influence the trend line resulting in a false trend of declining water clarity; however, the Secchi disk measurements for the month of July are also decreasing.
Oliver, Olin, and Martin lakes Diagnostic Study October 16, 2009 LaGrange County, Indiana
File No.070874.00 Page 75
Olin Lake Secchi Disk Transparency
0.0
5.0
10.0
15.0
20.0
25.0Jan-93 Jan-98 Jan-03 Jan-08
Time
Secc
hi D
epth
(ft)
Figure 52. Historic Secchi disk transparency data for Olin Lake.
0.0
5.0
10.0
15.0
20.0
25.01992 1994 1996 1998 2000 2002 2004 2006 2008
Secchi Dep
th (ft)
June July August September June July August September
Figure 53. Secchi disk transparency trends in Olin Lake from 1993 to 2007 for the months of June through September. Line represents the overall trend of data for each month. Total phosphorus concentrations have generally remained low within Olin Lake with one notable exception. Total phosphorus concentrations ranged from 0.003 mg/L in July 2005 (volunteer monitor) to 0.250 mg/L in July 1972 (ISPCB, 1986). One total phosphorus sample collected in the previous 35 years is relatively high compared with other total phosphorus concentrations measured in Olin Lake. The sample, 0.250 mg/L in 1972 is a water column composite sample
Oliver, Olin, and Martin lakes Diagnostic Study October 16, 2009 LaGrange County, Indiana
File No.070874.00 Page 76
rather than separate surface water (epilimnetic) and bottom water (hypolimnetic) samples. This is the only sample that exceeded the median total phosphorus concentration measured in most Indiana lakes (0.17 mg/L). This datum appears to be an outlier as all other total phosphorus concentrations are relatively low (Figure 54) typically measuring less than 0.05 mg/L.
Olin Lake Total Phosphorus Concentration
0.00
0.05
0.10
0.15
0.20
0.25
0.30
May-64 May-74 May-84 May-94 May-04
Time
Tota
l Pho
spho
rus
(mg/
L)
Figure 54. Historic total phosphorus concentrations measured in Olin Lake. The lake’s algae (plankton) density reflects the relatively low nutrient levels typically present in Olin Lake. Nutrients (nitrogen and phosphorus) promote the growth of algae and/or rooted plant populations. Thus, lakes with high nutrient levels are expected to support dense algae and/or rooted plants. Low chlorophyll a concentrations also reflect the relatively low plankton densities and total phosphorus concentrations found in the lake. None of the chlorophyll a concentrations exceed the median concentration measured in Indiana lakes (12.9 µg/L). Chlorophyll a concentrations range from the detection level (0.02 µg/L) to 6.9 µg/L in May 1973. The lake’s overall trophic index (TSI) score ranged from 10 in 1972 to 26 in 2000. All of these scores suggest that the lake is oligotrophic to mesotrophic or relatively unproductive to slightly productive. (Please see the following sections for a more detailed discussion of lake water quality parameters and trophic state indices.) Olin Lake Historic Temperature and Dissolved Oxygen Data Figure 55 displays the temperature profiles recorded during IDNR fisheries surveys, Indiana CLP assessments, and volunteer collected data. All of the temperature profiles show that Olin Lake was stratified. The developed hypolimnion present during the surveys is very typical of Indiana lakes.
Oliver, Olin, and Martin lakes Diagnostic Study October 16, 2009 LaGrange County, Indiana
Figure 55. Historical temperature profiles for Olin Lake. Much of the data presented above suggest that Olin Lake is only moderately productive and the historical percent oxic results (Table 24) and dissolved oxygen profiles (Figure 56) support these determinations. Dissolved oxygen data indicate Olin lake typically possessed dissolved oxygen greater than 1 mg/L in approximately 72% of the water column (Table 24). However, in deep waters, dissolved oxygen declines to less than 1 mg/L. This decline in dissolved oxygen limits the availability of habitat for the lake’s inhabitants and increases the potential for nutrient release from the lake’s bottom sediments. The dissolved oxygen profiles illustrate typical conditions found in Olin Lake, which is unique to a select set of lakes in Indiana. In these lakes there is a sharp increase in dissolved oxygen in the lake’s metalimnion. This results in a positive-heterograde profile. Positive-heterograde profiles are characterized by a peak in oxygen concentration at a depth below the water surface, such as the peak in the 1983 profile beginning at 25 feet (7.6 m) below the water’s surface. The peak is likely associated with a higher concentration of phytoplankton at that particular depth layer. Called a metalimnetic oxygen maximum, the peak results when the rate of settling plankton slows in the denser waters of the metalimnion. At this depth, the plankton can take advantage of nutrients diffusing from the nutrient-enriched hypolimnion. As the plankton at this depth photosynthesize, they release oxygen into the water column, creating a peak in oxygen at that level. Assessment profiles from 1986, 2000, 2003, 2006, and one from July 2008 include metalimnetic oxygen maxima, although in all of these cases, the peaks are much smaller than that present during the 1983 assessment. Volunteer data provided from September 2007 indicates decline in dissolved oxygen precludes the peak observed at 24 feet (7.3 m). This drop in dissolved oxygen represents a negative heterograde profile or a metalimnetic oxygen minimum.
Oliver, Olin, and Martin lakes Diagnostic Study October 16, 2009 LaGrange County, Indiana
Figure 56. Historical dissolved oxygen profiles for Olin Lake. 4.3.3 Martin Lake Historical Water Quality The Indiana Department of Natural Resources, Division of Fish and Wildlife, the Indiana State Pollution Control Board, the Indiana Clean Lakes Program (CLP), the LaGrange County Health Department (LCHD), the USEPA, F.X. Browne, and Volunteer Monitors have conducted various water quality tests on Martin Lake. Table 26 presents some selected water quality parameters for these assessments of Martin Lake.
Oliver, Olin, and Martin lakes Diagnostic Study October 16, 2009 LaGrange County, Indiana
File No.070874.00 Page 79
Table 26. Summary of historic data for Martin Lake.
^Water column average; all other values are means of epilimnion and hypolimnion values. *Volunteer monitoring data is the average for that year’s monitoring effort. Appendix C contains all of the raw data represented by these numbers.
Oliver, Olin, and Martin lakes Diagnostic Study October 16, 2009 LaGrange County, Indiana
File No.070874.00 Page 80
Based on the data presented in Table 26, water quality in Martin Lake has remained stable over the past 35 years. Water clarity is relatively good for the region. Since 1972, Secchi disk transparency (a measure of water clarity) has ranged from 0.0 feet (0.0 m) on several occasions during 1995 and 1996 to 17.1 feet (5.2 m) in May 2001 (Appendix C). Martin Lake follows a pattern typically observed in Indiana lakes. Water clarity is generally better during the spring, early summer, and fall than clarity measurements that occur during the middle of the summer and early fall (July to September). This trend is more apparent when individual monthly median and average Secchi disk transparencies are observed (Table 27). The best (highest) monthly average transparencies occur during April and May [13.3 feet (4.1 m) and 11.8 feet (3.6 m)], respectively, while the poorest (lowest) average transparencies occur during July (8.8 feet; 2.7 m). Table 27. Median and average transparencies measured in Martin Lake from 1972 to 2007. Month Average Transparency (feet) Median Transparency (feet) Count April 13.3 14.2 4 May 11.8 13.5 21 June 10.8 10.5 54 July 8.8 11.0 39 August 10.3 9.0 35 September 9.1 8.9 26 October 9.3 9.8 12 Overall 10.2 10.3 191
Overall, water clarity has been variable over the years. Unlike a recent pattern in both Oliver and Olin lakes, overall water clarity appears to be unchanged since 1993. This pattern is illustrated by data collected by a citizen volunteer and other organizations on the lake and suggests that clarity has remained relatively stable (Figure 57). As detailed above and in Table 27, water clarity is typically best in Martin Lake during the spring and fall.
Martin Lake Secchi Disk Transparency
0.0
2.0
4.0
6.0
8.0
10.0
12.0
14.0
16.0
18.0Jan-93 Jan-98 Jan-03 Jan-08
Time
Secc
hi D
epth
(ft)
Figure 57. Historic Secchi disk transparency data for Martin Lake.
Oliver, Olin, and Martin lakes Diagnostic Study October 16, 2009 LaGrange County, Indiana
File No.070874.00 Page 81
Total phosphorus concentrations have generally remained low within Martin Lake with three notable exceptions. Total phosphorus concentrations ranged from 0.010 mg/L on several occasions (volunteer monitor) to 0.330 mg/L in July 1972 (ISPCB, 1986). Three total phosphorus samples collected in the previous 35 years are relatively high compared with other total phosphorus concentrations measured in Martin Lake. Two of the three samples, 0.330 mg/L in 1972 (ISPCB, 1986) and 0.105 mg/L in 1975 (Grant, 1989) are water column composite samples rather than surface water (epilimnetic) and bottom water (hypolimnetic) samples. The 1972 sample and a sample collected in 1993 by the Clean Lakes Program (0.175 mg/L) are the only two samples that exceeded the median total phosphorus concentration measured in most Indiana lakes (0.17 mg/L). These data appear to be outliers as all other total phosphorus concentrations are relatively low (Figure 58) typically measuring less than 0.10 mg/L with a significant number less than 0.05 mg/L.
Martin Lake Total Phosphorus Concentrations
0.00
0.05
0.10
0.15
0.20
0.25
0.30
0.35
May-64 May-74 May-84 May-94 May-04
Time
Tota
l Pho
spho
rus
(mg/
L)
Figure 58. Historic total phosphorus concentrations measured in Martin Lake. The lake’s algae (plankton) density reflects the relatively low nutrient levels typically present in Martin Lake. Nutrients (nitrogen and phosphorus) promote the growth of algae and/or rooted plant populations. Thus, lakes with high nutrient levels are expected to support dense algae and/or rooted plants. Low chlorophyll a concentrations also reflect the relatively low plankton densities and total phosphorus concentrations found in the lake. Three of the chlorophyll a concentrations (44.1 µg/L in September 1996, 13.1 µg/L in May 2004, and 16.3 µg/L in July 2006) exceeded the median concentration measured in Indiana lakes (12.9 µg/L). Chlorophyll a concentrations range from the detection level (0.02 µg/L) to 44.1 µg/L in September 1996. The lake’s overall trophic index (TSI) score from 14 in 1993 to 35 in 1972. All of these scores suggest that the lake is oligotrophic to mesotrophic or relatively unproductive to slightly productive. (Please see the following sections for more detailed discussion of lake water quality parameters and trophic state indices.)
Oliver, Olin, and Martin lakes Diagnostic Study October 16, 2009 LaGrange County, Indiana
File No.070874.00 Page 82
Martin Lake Historic Temperature and Dissolved Oxygen Data Figure 59 displays the temperature profiles recorded during IDNR fisheries surveys and Indiana CLP assessments. All of the temperature profiles show that Martin Lake was stratified. The developed hypolimnion present during the surveys is very typical of Indiana lakes.
Figure 59. Historical temperature profiles for Martin Lake. Much of the data presented above suggest that Martin Lake is moderately productive and the historical percent oxic results (Table 26) and dissolved oxygen profiles (Figure 60) support these determinations. Dissolved oxygen data indicate the lake typically possessed dissolved oxygen greater than 1 mg/L in approximately 73% of the water column (Table 26). However, in deep waters, dissolved oxygen declines to less than 1 mg/L. This decline in dissolved oxygen limits the availability of habitat for the lake’s inhabitants and increases the potential for nutrient release from the lake’s bottom sediments. The dissolved oxygen profiles illustrate typical conditions found in Martin Lake, which is unique to a select set of lakes in Indiana. In these lakes there is a sharp increase in dissolved oxygen in the lake’s metalimnion. This results in a positive-heterograde profile. Positive-heterograde profiles are characterized by a peak in oxygen concentration at a depth below the water surface, such as the peak in the 1972 profile beginning at 16 feet (4.9 m) below the water’s surface. The peak is likely associated with a higher concentration in phytoplankton at that particular depth layer. Called a metalimnetic oxygen maximum, the peak results when the rate of settling plankton slows in the denser waters of the metalimnion. At this depth, the plankton can take advantage of nutrients diffusing from the nutrient-enriched hypolimnion. As the plankton at this depth photosynthesize, they release oxygen into the water column, creating a peak in oxygen at that level. All assessment profiles include metalimnetic oxygen maxima, although in all of these cases, the peaks are much smaller than that present during the 1972 assessment.
Oliver, Olin, and Martin lakes Diagnostic Study October 16, 2009 LaGrange County, Indiana
Figure 60. Historical dissolved oxygen profiles for Martin Lake. 4.4 Lake Water Quality Assessment 4.4.1 Lake Water Quality Assessment Methods The water sampling and analytical methods used for Olin, Oliver and Martin lakes were consistent with those used in IDEM’s Indiana Clean Lakes Program. Water samples were collected from the three lakes on July 23, 2008 from the surface waters (epilimnion) and from the bottom waters (hypolimnion) at a location over the deepest water of each lake. Chlorophyll was determined only for the epilimnetic sample. Other parameters such as Secchi disk transparency, light transmission, and oxygen saturation are single measurements made in the epilimnion. In addition, dissolved oxygen and temperature were measured at one-meter intervals from the surface to the bottom. A tow to collect plankton was made from the 1% light level to the water surface. Conductivity, temperature, and dissolved oxygen were measured in situ in the lake with an YSI Model 85 meter. In addition, water samples were collected for the following parameters:
+) • total Kjeldahl nitrogen (TKN) • turbidity • plankton • chlorophyll a
These samples were placed in the appropriate bottle (with preservative if needed) and stored in an ice chest until analysis at SPEA’s laboratory in Bloomington. SRP samples were filtered in
Oliver, Olin, and Martin lakes Diagnostic Study October 16, 2009 LaGrange County, Indiana
File No.070874.00 Page 84
the field through a Whatman GF-C filter. The E. coli bacteria samples were taken to Sherry Laboratories in Warsaw, Indiana for analysis.
All sampling techniques and laboratory analytical methods were performed in accordance with procedures in Standard Methods for the Examination of Water and Wastewater, 21th Edition (APHA, 2005). Plankton counts were made using a standard Sedgewick-Rafter counting cell. Fifteen fields per cell were counted. Plankton identifications were made according to: Wehr and Sheath (2003), Prescott (1982), Ward and Whipple (1959) and Whitford and Schumacher (1984). The comprehensive evaluation of lakes requires collecting data on a number of different, and sometimes hard-to-understand, water quality parameters. Some of the more important parameters that we analyze include: Temperature. Temperature can determine the form, solubility, and toxicity of a broad range of aqueous compounds. Likewise, life associated with the aquatic environment in any location has its species composition and activity regulated by water temperature. Since essentially all aquatic organisms are ‘cold-blooded’ the temperature of the water regulates their metabolism and ability to survive and reproduce effectively (EPA, 1976). The Indiana Administrative Code (327 IAC 2-1-6) sets maximum temperature limits to protect aquatic life for Indiana waters. For example, temperatures during the month of May should not exceed 80 oF (23.7 oC) by more than 3 oF (1.7 oC). June temperatures should not exceed 90 oF (32.2 oC). Dissolved Oxygen (D.O). D.O. is the dissolved gaseous form of oxygen. It is essential for respiration of fish and other aquatic organisms. Fish need at least 3-5 mg/L of D.O. Cold-water fish such as trout generally require higher concentrations of D.O. than warm water fish such as bass or Bluegill. The IAC sets minimum D.O. concentrations at 6 mg/L for cold-water fish. D.O. enters water by diffusion from the atmosphere and as a byproduct of photosynthesis by algae and plants. Excessive algae growth can over-saturate (greater than 100% saturation) the water with D.O. Conversely, dissolved oxygen is consumed by respiration of aquatic organisms, such as fish, and during bacterial decomposition of plant and animal matter. Dissolved oxygen can Conductivity. Conductivity is a measure of the ability of an aqueous solution to carry an electric current. This ability depends on the presence of ions: on their total concentration, mobility, and valence (APHA, 2005). During low discharge, conductivity is higher than during storm water runoff because the water moves more slowly across or through ion containing soils and substrates during base flow. Carbonates and other charged particles (ions) dissolve into the slow-moving water, thereby increasing conductivity measurements. pH. The pH of water is a measure of the concentration of acidic ions (specifically H+) present in the water. The pH also determines the form, solubility, and toxicity of a wide range of other aqueous compounds. The IAC establishes a range of 6-9 pH units for the protection of aquatic life. Alkalinity. Alkalinity is a measure of the acid-neutralizing (or buffering) capacity of water. Certain substances, if present in water, like carbonates, bicarbonates, and sulfates can cause the water to resist changes in pH. A lower alkalinity indicates a lower buffering capacity or a decreased ability to resist changes in pH. During base flow conditions, alkalinity is usually high because the water picks up carbonates from the bedrock. Alkalinity measurements are usually lower during storm flow conditions because buffering compounds are diluted by rainwater and
Oliver, Olin, and Martin lakes Diagnostic Study October 16, 2009 LaGrange County, Indiana
File No.070874.00 Page 85
the runoff water moves across carbonate-containing bedrock materials so quickly that little carbonate is dissolved to add additional buffering capacity. Turbidity. Turbidity (measured in Nephelometric Turbidity Units) is a measure of particles suspended in the water itself. It is generally related to suspended and colloidal matter such as clay, silt, finely divided organic and inorganic matter, plankton, and other microscopic organisms. According to the Hoosier Riverwatch, the average turbidity of an Indiana stream is 11 NTU with a typical range of 4.5-17.5 NTU (White, unpublished data). Turbidity measurements >20 NTU have been found to cause undesirable changes in aquatic life (Walker, 1978). Nitrogen. Nitrogen is an essential plant nutrient found in fertilizers, human and animal wastes, yard waste, and the air. About 80% of the air we breathe is nitrogen gas. Nitrogen gas diffuses into water where it can be “fixed”, or converted, by Blue-green algae to ammonia for their use. Nitrogen can also enter lakes and streams as inorganic nitrogen and ammonia. Because of this, there is an abundant supply of available nitrogen to aquatic systems. The three common forms of nitrogen are:
Nitrate (NO3-) – Nitrate is an oxidized form of dissolved nitrogen that is converted to
ammonia by algae. It is found in streams and runoff when dissolved oxygen is present, usually in the surface waters. Ammonia applied to farmland is rapidly oxidized or converted to nitrate and usually enters surface and groundwater as nitrate. The Ohio EPA (1999) found that the median nitrate-nitrogen concentration in wadeable streams that support modified warmwater habitat (MWH) was 1.6 mg/L. Modified warmwater habitat was defined as: aquatic life use assigned to streams that have irretrievable, extensive, man-induced modification that preclude attainment of the warmwater habitat use (WWH) designation; such streams are characterized by species that are tolerant of poor chemical quality (fluctuating dissolved oxygen) and habitat conditions (siltation, habitat amplification) that often occur in modified streams (Ohio EPA, 1999). Nitrate concentrations exceeding 10 mg/1 in drinking water are considered hazardous to human health (Indiana Administrative Code IAC 2-1-6).
Ammonia (NH4
+) – Ammonia is a form of dissolved nitrogen that is the preferred form for algae use. It is the reduced form of nitrogen and is found in water where dissolved oxygen is lacking. Important sources of ammonia include fertilizers and animal manure. In addition, bacteria produce ammonia as a by-product as they decompose dead plant and animal matter. Both temperature and pH govern the toxicity of ammonia for aquatic life.
Organic Nitrogen (Org N) – Organic nitrogen includes nitrogen found in plant and animal materials. It may be in dissolved or particulate form. In the analytical procedures, total Kjeldahl nitrogen (TKN) was analyzed. Organic nitrogen is TKN minus ammonia.
Phosphorus. Phosphorus is an essential plant nutrient, and the one that most often controls aquatic plant (algae and macrophyte) growth in freshwater. It is found in fertilizers, human and animal wastes, and yard waste. There are few natural sources of phosphorus to streams other than what is attached to soil particles, and there is no atmospheric (vapor) form of phosphorus. For this reason, phosphorus is often a limiting nutrient in aquatic systems. This means that the relative scarcity of phosphorus may limit the ultimate growth and production of algae and rooted aquatic plants. Therefore, management efforts often focus on reducing phosphorus
Oliver, Olin, and Martin lakes Diagnostic Study October 16, 2009 LaGrange County, Indiana
File No.070874.00 Page 86
inputs to receiving waterways because: (a) it can be managed and (b) reducing phosphorus can reduce algae production. Two common forms of phosphorus are:
Soluble reactive phosphorus (SRP) – SRP is dissolved phosphorus readily usable by algae. SRP is often found in very low concentrations in phosphorus-limited systems where the phosphorus is tied up in the algae themselves. Because phosphorus is cycled so rapidly through biota, SRP concentrations as low as 0.005 mg/L are enough to maintain eutrophic or highly productive conditions in lake systems (Correll, 1998). Sources of SRP include fertilizers, animal wastes, and septic systems.
Total phosphorus (TP) – TP includes dissolved and particulate phosphorus. TP concentrations greater than 0.03 mg/L (or 30μg/L) can cause algal blooms in lakes and reservoirs. The Ohio EPA (1999) found that the median TP in wadeable streams that support MWH for fish was 0.28 mg/L.
Secchi Disk Transparency. This refers to the depth to which the black & white Secchi disk can be seen in the lake water. Water clarity, as determined by a Secchi disk, is affected by two primary factors: algae and suspended particulate matter. Particulates (for example, soil or dead leaves) may be introduced into the water by either runoff from the land or from sediments already on the bottom of the lake. Many processes may introduce sediments from runoff; examples include erosion from construction sites, agricultural lands, and riverbanks. Bottom sediments may be re-suspended by bottom feeding fish such as carp, or in shallow lakes, by motorboats or strong winds. Light Transmission. Similar to the Secchi disk transparency, this measurement uses a light meter (photocell) to determine the rate at which light transmission is diminished in the upper portion of the lake’s water column. Another important light transmission measurement is determination of the 1% light level. The 1% light level is the water depth to which one percent of the surface light penetrates. This is considered the lower limit of algal growth in lakes and is referred to as the photic zone. Plankton. Plankton are important members of the aquatic food web. The plankton include the algae (microscopic plants) and the zooplankton (tiny shrimp-like animals that eat algae). Determined by filtering water through a net having a very fine mesh (63-micron openings = 63/1000 millimeter). The plankton net is towed up through the lake’s water column from the one percent light level to the surface. Algae are reported as natural units, which records one colonial filament of multiple cells as one natural unit and one cell of a singular alga also as one natural unit. Of the many different algal species present in the water, we are particularly interested in the Blue-green algae. Blue-green algae are those that most often form nuisance blooms and their dominance in lakes may indicate poor water conditions. Chlorophyll a. The plant pigments of algae consist of the chlorophylls (green color) and carotenoids (yellow color). Chlorophyll a is by far the most dominant chlorophyll pigment and occurs in great abundance. Thus, chlorophyll a is often used as a direct estimate of algal biomass.
Oliver, Olin, and Martin lakes Diagnostic Study October 16, 2009 LaGrange County, Indiana
File No.070874.00 Page 87
4.4.2 Lake Water Quality Assessment Results Oliver Lake Results from the Oliver Lake water quality assessment are included in Table 28 and Figure 61. Table 28. Water Quality Characteristics of Oliver Lake, 7/23/2008.
Oliver, Olin, and Martin lakes Diagnostic Study October 16, 2009 LaGrange County, Indiana
File No.070874.00 Page 88
D.O. and Temp Profile - Oliver Lake
0
5
10
15
20
250 5 10 15 20 25 30
D.O. (mg/L), Temp (°C)
Dep
th (m
)
TempD.O.z 1%
Figure 61. Temperature and dissolved oxygen profiles for Oliver Lake on 7/23/2008. Temperature and oxygen profiles for Oliver Lake show that the lake was stratified at the time of sampling (Figure 61). Oliver Lake is supersaturated in the epilimnion (surface waters), with 111.5% dissolved oxygen at 5 feet (1.5 m). Supersaturated dissolved oxygen is usually symptomatic of intense phytoplankton photosynthesis. Below 7 meters (23 feet) there is little oxygen available to support fish, and the lake reaches fully anoxic conditions ([D.O.] < 1.0 mg/L) conditions below 21 meters (69 feet). During thermal stratification, the bottom waters (hypolimnion) of the lake are isolated from the well-mixed epilimnion by temperature-induced density differences. The boundary between these two zones, where temperature changes most rapidly with depth is called the metalimnion. At the time of our sampling, the epilimnion was confined to the upper 4 meters (13 feet) of water. The sharp decline in temperature between 4 (13 feet) and about 12 meters (39 feet) defines the metalimnion or transition zone. The hypolimnion occupied water deeper than 12 meters (39 feet). The 1% light level, which limnologists use to determine the lower limit where photosynthesis can occur, extended to 20.5 feet (~6.3 m). Based on the depth-area curve in Figure 36 approximately 30% [117.6 acres (47.6 ha)] of lake bottom lies above the 1% light level. This represents the area of the lake bottom with sufficient light to support rooted plants. This area is called the littoral zone. Furthermore, based on the depth-volume curve (Figure 37), we see that a volume of greater than 6,764 acre-feet (834 ha-m) of Oliver Lake (44% of total lake volume) lies above the 20.5 foot (6.2 m) 1% light level. This area, referred to as the photic zone, represents the amount of water with sufficient light to support algae growth. Phosphorus and nitrogen are the primary plant nutrients in lakes. Total phosphorous (TP) is a measure of the total phosphorous present in organic and inorganic forms. TP concentrations are relatively low in the epilimnion (0.025 mg/L) of Oliver Lake but are quite high (0.205 mg/L) in the hypolimnion. The lower epilimnion concentration is close to the 0.03 mg/L concentration of TP that is considered high enough to support eutrophic conditions. Soluble reactive phosphorous (SRP) is inorganic phosphorous which is available for biological uptake. SRP concentrations were at or below our detection limits (0.010 mg/L) in the epilimnion and were
Oliver, Olin, and Martin lakes Diagnostic Study October 16, 2009 LaGrange County, Indiana
File No.070874.00 Page 89
higher in the hypolimnion (0.206 mg/L). Higher phosphorus concentrations within the hypolimnion are usually associated with nutrient release from the sediments. Given the concentrations of TP and SRP, all the phosphorus within the hypolimnion of Oliver Lake was in the soluble form when we sampled the lake. Sedimentation of particulates and plankton may also provide a source of phosphorus to the hypolimnion. Nitrate nitrogen (NO3
-) was measured at concentrations of 0.459 mg/L in the epilimnion and 0.210 mg/l in the hypolimnion. Nitrate undergoes a reduction reaction to ammonia (NH4
+) when oxygen is low and ammonia undergoes the reverse reaction when oxygen is high. In the well-oxygenated epilimnion, ammonia concentration is at or below our detection limits (0.018 mg/L) and in the hypolimnion are 0.738 mg/L. The higher hypolimnetic ammonia concentrations indicate that a high biochemical oxygen demand (BOD) is producing the NH4 and the low amount of dissolved oxygen maintains these relatively high ammonia concentrations. Values for pH are within the normal range for Indiana lakes, pH 8.4 for the epilimnion, and pH 7.6 for the hypolimnion. Values of pH for most fresh waters fall between pH 6-9 (Kalff, 2002). The high alkalinity values of 156 and 198 mg/L CaCO3 in the epilimnion and hypolimnion respectively, indicate that Oliver Lake is a well buffered system. Plankton identified and counted in the sample collected from Oliver Lake are shown in Table 29. Fragillaria, a diatom, was the most dominant genus found. Diatoms are associated with a range of water qualities and tend to dominate in the spring and sometimes late fall. Their dominance in Oliver Lake in the middle of summer (when blue-greens usually dominate) is an indicator of good water quality. Blue-green genera comprised 35% of the total plankton abundance. Blue-greens are usually associated with degraded water quality. Blue-green algae are less desirable in lakes because they: 1) may form extremely dense nuisance blooms; 2) may cause taste and odor problems in the water; and 3) are unpalatable as food for many zooplankton grazers.
Oliver, Olin, and Martin lakes Diagnostic Study October 16, 2009 LaGrange County, Indiana
File No.070874.00 Page 90
Table 29. Oliver Lake plankton sample representing the species assemblage on 7/23/2008.
Oliver, Olin, and Martin lakes Diagnostic Study October 16, 2009 LaGrange County, Indiana
File No.070874.00 Page 91
Olin Lake Results from the Olin Lake water quality assessment are included in Table 30 and Figure 62. Table 30. Water Quality Characteristics of Olin Lake, 7/23/2008.
% Water column oxic 65.5% 1 Plankton Density 10,953 N.U./L 2
Blue-Green Dominance 94.9% 10 Chl-a 2 µg/l -
*Method Detection Limit TSI score 23
Oliver, Olin, and Martin lakes Diagnostic Study October 16, 2009 LaGrange County, Indiana
File No.070874.00 Page 92
D.O. and Temp Profile - Olin Lake
0
5
10
15
20
250 5 10 15 20 25 30
D.O. (mg/L), Temp (°C)
Dep
th (m
)
TempD.O.z 1%
Figure 62. Temperature and dissolved oxygen profiles for Olin Lake on 7/23/2008. Temperature and oxygen profiles for Olin Lake show that the lake was stratified at the time of sampling (Figure 62). Olin Lake is supersaturated in the epilimnion (surface waters), with 108% dissolved oxygen at 5 feet (1.5 m). Supersaturated dissolved oxygen is usually symptomatic of intense phytoplankton photosynthesis. Below 8 meters (26 feet) there is little oxygen available to support fish, and the lake reaches fully anoxic conditions ([D.O.] < 1.0 mg/L) below 16-17 meters (52.5-55.8 feet). During thermal stratification, the bottom waters (hypolimnion) of the lake are isolated from the well-mixed epilimnion by temperature-induced density differences. The boundary between these two zones, where temperature changes most rapidly with depth is called the metalimnion. At the time of our sampling, the epilimnion was confined to the upper 3 meters of water. The sharp decline in temperature between approximately 3 and 9 meters (9.8 – 29.5 feet) defines the metalimnion or transition zone. The hypolimnion occupied water deeper than 8-9 meters (29.5 feet). The 1% light level, which limnologists use to determine the lower limit where photosynthesis can occur, extended to 19 feet (~5.8 m). Based on the depth-area curve in Figure 39 approximately 24.5% (24.9 acres) of lake bottom lie above the 1% light level. This represents the area of the lake bottom with sufficient light to support rooted plants. This area is called the littoral zone. Furthermore, based on the depth-volume curve (Figure 40), we see that a volume of greater than 2,176 acre-feet (268 ha-m) of Olin Lake (52.6% of total lake volume) lies above the 19 foot (5.8 m) 1% light level. This area, referred to as the photic zone, represents the amount of water with sufficient light to support algae growth. Phosphorus and nitrogen are the primary plant nutrients in lakes. Total phosphorous (TP) is a measure of the total phosphorous present in organic and inorganic forms. TP concentrations are relatively low in the epilimnion (0.018 mg/L) of Olin Lake but are relatively high (0.333 mg/L) in the hypolimnion. The epilimnetic concentration is well below the 0.03 mg/L concentration of TP that is considered high enough to support eutrophic conditions. Soluble reactive phosphorous (SRP) is inorganic phosphorous which is available for biological uptake. SRP concentrations were at or below our detection limits (0.010 mg/L) in the epilimnion and were
Oliver, Olin, and Martin lakes Diagnostic Study October 16, 2009 LaGrange County, Indiana
File No.070874.00 Page 93
higher in the hypolimnion (0.342 mg/L). Higher phosphorus concentrations within the hypolimnion are usually associated with nutrient release from the sediments. Sedimentation of particulates and plankton also provide a source of phosphorus to the hypolimnion. Nitrate nitrogen (NO3
-) was measured at 0.332 mg/L in the epilimnion and 0.166 mg/l in the hypolimnion. Nitrate undergoes a reduction reaction to ammonia (NH4
+) when oxygen is low and ammonia undergoes the reverse reaction when oxygen is high. In the well-oxygenated epilimnion, ammonia concentrations were relatively low at 0.05 mg/L and in the hypolimnion were 0.690 mg/L. The higher hypolimnetic ammonia concentrations indicate that a high biochemical oxygen demand (BOD) is producing the NH4 and the low amount of dissolved oxygen maintains these relatively high ammonia concentrations. Values for pH are within the normal range for Indiana lakes, pH 8.4 for the epilimnion and pH 7.6 for the hypolimnion. Values of pH for most fresh waters fall between pH 6-9 (Kalff, 2002). The high alkalinity values of 162 and 215 mg/L CaCO3 in the epilimnion and hypolimnion respectively, indicate that Olin Lake is a well buffered system. Plankton identified and counted in the sample collected from Olin Lake are shown in Table 31. Aphanizomenon, a blue-green algae, was the most dominant genera found, and accounted for almost half the plankton density. In addition to this particular blue-green algae, other blue-green genera contributed to the overall plankton dominance by blue-greens of 95%. Blue-greens are usually associated with degraded water quality. Blue-green algae are less desirable in lakes because they: 1) may form extremely dense nuisance blooms; 2) may cause taste and odor problems in the water; and 3) are unpalatable as food for many zooplankton grazers. The dominance of aphanizomenon and other blue-greens is primarily responsible for the higher TSI score in 2008 (Table 30). There is currently no explanation for why blue-green algae were the most dominant algae in Olin Lake, especially considering that Olin Lake has had good water quality in the past. Blue-green algae are dominant in Martin Lake, from which Olin Lake receives water.
Oliver, Olin, and Martin lakes Diagnostic Study October 16, 2009 LaGrange County, Indiana
File No.070874.00 Page 94
Table 31. Olin Lake plankton sample representing the species assemblage on 7/23/2008. Genus ABUNDANCE (#/l)Blue-Green Algae (Cyanophyta) Phormidium 1473 Aphanizomenon 7827 Anabaena 905 Lyngbya 105 Microcystis 63 Oscillatoria 21 Totals 10394 Green Algae (Chlorophyta) Unidentified Green 63 Totals 63 Diatoms (Bacillariophyta) Fragillaria 189 Totals 189 Rotifers (Rotifera) Kellicottia 21 Totals 21 Other Algae Ceratium 274 Totals 274 Zooplankton Nauplii 6 Cyclopoid 2.1 Calanoid 3.9 Daphnia 0.3 Totals 12.3 Total Plankton 10953Blue - Green Dominance 95%
Oliver, Olin, and Martin lakes Diagnostic Study October 16, 2009 LaGrange County, Indiana
File No.070874.00 Page 95
Martin Lake Results from the Martin Lake water quality assessment are included in Table 32 and Figure 63. Table 32. Water Quality Characteristics of Martin Lake, 7/23/2008.
Oliver, Olin, and Martin lakes Diagnostic Study October 16, 2009 LaGrange County, Indiana
File No.070874.00 Page 96
D.O. and Temp Profile - Martin Lake
0
2
4
6
8
10
12
140 5 10 15 20 25 30
D.O. (mg/L), Temp (°C)
Dep
th (m
)
TempD.O.z1%
Figure 63. Temperature and dissolved oxygen profiles for Martin Lake on 7/23/2008. Temperature and oxygen profiles for Martin Lake show that the lake was stratified at the time of sampling (Figure 63). Martin Lake is supersaturated in the epilimnion (surface waters), with 108.3% dissolved oxygen at 5 feet (1.5 m). Supersaturated dissolved oxygen is usually symptomatic of intense phytoplankton photosynthesis. Below 7-8 meters (23-26 feet) there is little oxygen available to support fish, and the lake reaches fully anoxic conditions ([D.O.] < 1.0 mg/L) conditions below 9 meters (29.5 feet). During thermal stratification, the bottom waters (hypolimnion) of the lake are isolated from the well-mixed epilimnion by temperature-induced density differences. The boundary between these two zones, where temperature changes most rapidly with depth is called the metalimnion. At the time of our sampling, the epilimnion was confined to the upper 2 meters (6.6 feet) of water. The sharp decline in temperature between 2 (6.6 feet) and about 8 meters (26.2 feet) defines the metalimnion or transition zone. The hypolimnion occupied water deeper than 8 meters (26.2 feet). The 1% light level, which limnologists use to determine the lower limit where photosynthesis can occur, extended to 17.4 feet (~5.4 m). Based on the depth-area curve in Figure 41 approximately 28.6% [7.31 acres (3.0 ha)] of lake bottom lie above the 1% light level. This represents the area of the lake bottom with sufficient light to support rooted plants. This area is called the littoral zone. Furthermore, based on the depth-volume curve (Figure 42), we see that a volume of greater than 460.9 acre-feet (57 ha-m) of Martin Lake (52% of total lake volume) lie above the 17.4 foot (5.3 m) 1% light level. This area, referred to as the photic zone, represents the amount of water with sufficient light to support algae growth. Phosphorus and nitrogen are the primary plant nutrients in lakes. Total phosphorous (TP) is a measure of the total phosphorous present in organic and inorganic forms. TP concentrations are relatively low in the epilimnion (0.021 mg/L) of Martin Lake but are high (0.046 mg/L) in the hypolimnion. The concentration in the epilimnion is below the 0.03 mg/L concentration of TP that is considered high enough to support eutrophic conditions. Soluble reactive phosphorous (SRP) is inorganic phosphorous which is available for biological uptake. SRP concentrations were at or below our detection limits (0.010 mg/L) in both the epilimnion and hypolimnion.
Oliver, Olin, and Martin lakes Diagnostic Study October 16, 2009 LaGrange County, Indiana
File No.070874.00 Page 97
Nitrate nitrogen (NO3
-) was measured at 0.928 mg/L in the epilimnion and 0.641 mg/l in the hypolimnion. Nitrate undergoes a reduction reaction to ammonia (NH4
+) when oxygen is low and ammonia undergoes the reverse reaction when oxygen is high. In the well-oxygenated epilimnion ammonia concentrations were 0.023 mg/L and in the hypolimnion were much higher at 0.984 mg/L. The higher hypolimnetic ammonia concentrations indicate that a high biochemical oxygen demand (BOD) is producing the NH4 and the low amount of dissolved oxygen maintains these relatively high ammonia concentrations. Values for pH are within the normal range for Indiana lakes, pH 8.4 for the epilimnion and pH 7.6 for the hypolimnion. Values of pH for most fresh waters fall between pH 6-9 (Kalff, 2002). The high alkalinity values of 240 and 281 mg/L CaCO3 in the epilimnion and hypolimnion respectively, indicate that Martin Lake is a well buffered system. Plankton identified and counted in the sample collected from Martin Lake are shown in Table 33. Aphanizomenon, a blue-green algae, was the most dominant genera found, accounting for over half of the total plankton abundance. In addition to this particular blue-green algae, other blue-green genera such as Microcysitis contributed to the overall plankton dominance by blue-greens of 63%. Blue-greens are usually associated with degraded water quality. Blue-green algae are less desirable in lakes because they: 1) may form extremely dense nuisance blooms; 2) may cause taste and odor problems in the water; and 3) are unpalatable as food for many zooplankton grazers. The dominance of aphanizomenon and other blue-greens is primarily responsible for the higher TSI score in 2008 (Table 32).
Oliver, Olin, and Martin lakes Diagnostic Study October 16, 2009 LaGrange County, Indiana
File No.070874.00 Page 98
Table 33. Martin Lake plankton sample representing the species assemblage on 7/23/2008.
Section 4.4.3 Lake Water Quality Assessment Discussion The interpretation of a comprehensive set of water quality data can be quite complicated. Often, attention is directed at the important plant nutrients (phosphorus and nitrogen) and to water transparency (Secchi disk) since dense algal blooms and poor transparency greatly affect the health and use of lakes. But, how much phosphorus or nitrogen is too much or, what level of transparency is too poor? To answer these questions, limnologists must compare data from the lake in question to standards, if they exist, to other lakes, or to criteria that most limnologists agree upon. There are no nutrient standards for Indiana lakes so we must compare the Olin, Oliver, and Martin Lakes (OOM lakes) results with data from other lakes and with generally accepted criteria. Comparison with Vollenweider’s Data Results of studies conducted by Richard Vollenweider in the 1970's are often used as guidelines for evaluating concentrations of water quality parameters. His results are given in the
Oliver, Olin, and Martin lakes Diagnostic Study October 16, 2009 LaGrange County, Indiana
File No.070874.00 Page 99
Table 34 following. Vollenweider relates the concentrations of selected water quality parameters to a lake's trophic state. The trophic state of a lake refers to its overall level of nutrition or biological productivity. Trophic categories include: oligotrophic, mesotrophic, eutrophic and hypereutrophic. Lake conditions characteristic of these trophic states are: Oligotrophic - lack of plant nutrients keep productivity low, lake contains oxygen at all
depths, clear water, deeper lakes can support trout. Mesotrophic - moderate plant productivity, hypolimnion may lack oxygen in summer,
moderately clear water, warm water fisheries only - bass and perch may dominate.
Eutrophic - contains excess nutrients, blue-green algae dominate during summer,
algae scums are probable at times, hypolimnion lacks oxygen in summer, poor transparency, rooted macrophyte problems may be evident.
Hypereutrophic - algal scums dominate in summer, few macrophytes, no oxygen in
hypolimnion, fish kills possible in summer and under winter ice. The units in the table are either milligrams per liter (mg/L) or micrograms per liter (μg/L). One mg/L is equivalent to one part per million (PPM) while one microgram per liter is equivalent to one part per billion (PPB). Remember that these are only guidelines – similar concentrations in your lake may not cause problems if something else is limiting the growth of algae or rooted plants. Table 34. Mean values of some water quality parameters and their relationship to lake production. (after Vollenweider, 1975).
Parameter
Oligotrophic Mesotrophic Eutrophic
Hypereutrophic
Total Phosphorus (mg/L or PPM)
0.008
0.027
0.084
>0.750
Total Nitrogen (mg/L or PPM)
0.661
0.753
1.875
--
Chlorophyll a (μg/L or PPB)
1.7
4.7
14.3
--
Table 35 shows mean concentrations of total phosphorus, total nitrogen, and chlorophyll a for OOM lakes for the 7/23/08 samples. When compared to levels reported by Vollenweider in Table 34 above, the 2008 results were within the eutrophic or mesotrophic ranges for total phosphorus and total nitrogen. Chlorophyll fits between Oligotrophic and Mesotrophic.
Oliver, Olin, and Martin lakes Diagnostic Study October 16, 2009 LaGrange County, Indiana
File No.070874.00 Page 100
Table 35. Summary of arithmetic mean total phosphorus, total nitrogen, Secchi disk transparency, and chlorophyll a results for Oliver, Olin, and Martin Lakes.
Parameter Oliver Olin Martin Total Phosphorus (mg/L or PPM) 0.115 0.175 0.034 Total Nitrogen (mg/L or PPM)1 1.059 1.114 1.647 Secchi disk transparency (ft) 5.24 6.89 11.15 Chlorophyll a (μg/L or PPB) 2.60 2.00 0.89 Sediment phosphorus release factor2 20.6 34.2 1.0
1Total nitrogen is the sum of TKN + NO3 2Hypo SRP concentration/Epi SRP concentration. For example, Olin’s hypolimnetic SRP concentration is 34.2 times that in the epilimnion. This difference is evidence of substantial internal loading of phosphorus. Comparison with Other Indiana Lakes A wide variety of conditions, including geography, morphometry, time of year, and watershed characteristics, can influence the water quality of lakes. Thus, it is difficult to predict and even explain the reasons for the water quality of a given lake. To help place lake data into perspective, consider the following data for 456 Indiana lakes collected during July and August 1994-2004 under the Indiana Clean Lakes Program (Table 36). The set of data summarized in the table represent mean values of epilimnetic and hypolimnetic samples for each of the 456 lakes. Table 36. Water quality characteristics of 456 Indiana lakes sampled from 1994 through 2004 by the Indiana Clean Lakes Program. Medians of epilimnion and hypolimnion means were used.
Secchi Disk (ft)
NO3
(mg/L)
NH4
(mg/L)
TKN
(mg/L)
SRP (mg/L)
TP
(mg/L) Chl a
Plankton
Bl-Green
Dominance (%)
Median 6.9 0.275 0.818 1.66 0.12 0.17 12.9 35,570 53.8 Maximum 32.8 9.4 22.5 27.05 2.84 2.81 380.4 753,170 100 Minimum 0.3 0.01 0.004 0.230 0.01 0.01 0.013 39 0.08 Table 37 compares the median of selected water quality parameters for OOM Lakes to the median value for all Indiana lakes. Oliver and Olin lakes were generally lower or comparable to median state values. The notable exceptions being nitrate levels in Oliver Lake, blue-green algae dominance in Olin Lake, and SRP levels in Olin Lake. Martin Lake values were mixed, some significantly higher and others significantly lower. Table 37. Comparison factors* of median for all Indiana lakes over Olin, Oliver, and Martin lakes for selected water parameters. Lake Secchi
Disk NO3 NH4 TKN SRP Total Phos. Chl a Plankton Blue-green
dominance Oliver 0.76 1.22 0.46 0.44 0.90 0.68 0.20 0.04 0.63 Olin 1.00 0.91 0.45 0.52 1.47 1.03 0.16 0.31 1.76 Martin 1.62 2.85 0.62 0.52 0.08 0.20 0.07 0.80 1.17 *Values >1 indicate that OOM Lake medians are higher than state medians, <1 lower than state medians, and = 1 indicate that values are on par with state medians.
Oliver, Olin, and Martin lakes Diagnostic Study October 16, 2009 LaGrange County, Indiana
File No.070874.00 Page 101
Using a Trophic State Index The large amount of water quality data collected during lake water quality assessments can be confusing to evaluate. Because of this, Indiana and many other states use a trophic state index (TSI) to help evaluate water quality data. A TSI condenses water quality data into a single, numerical index. Different index (or eutrophy) points are assigned for various water quality concentrations. The index total, or TSI, is the sum of individual eutrophy points for a lake. The Indiana TSI. The Indiana TSI (IDEM, 1986) ranges from 0 to 75 total points. The TSI totals are grouped into the following three lake quality classifications:
TSI Total Water Quality Classification 0-15 highest quality (oligotrophic) 16-30 intermediate quality (mesotrophic) 31-45 low quality (eutrophic) 46-60 lowest quality (hypereutrophic)
A rising TSI score for a particular lake from one year to the next indicates that water quality is worsening while a lower TSI score indicates improved conditions. However, natural factors such as climate variation can cause changes in TSI score that do not necessarily indicate a long-term change in lake condition. Parameters and values used to calculate the Indiana TSI are given in Table 38. The Indiana TSI has not been statistically validated. It tends to rely too heavily on algae metrics and it understates trophic state when compared with Carlson’s TSI (Jones and Medrano, 2006). For these reasons, the Carlson TSI may be more appropriate to use in evaluating Indiana lake data. Table 38. The Indiana Trophic State Index Parameter and Range Eutrophy Points I. Total Phosphorus (ppm)
A. At least 0.03 1 B. 0.04 to 0.05 2 C. 0.06 to 0.19 3 D. 0.2 to 0.99 4 E. 1.0 or more 5
II. Soluble Phosphorus (ppm)
A. At least 0.03 1 B. 0.04 to 0.05 2 C. 0.06 to 0.19 3 D. 0.2 to 0.99 4 E. 1.0 or more 5
III. Organic Nitrogen (ppm)
A. At least 0.5 1 B. 0.6 to 0.8 2 C. 0.9 to 1.9 3 D. 2.0 or more 4
Oliver, Olin, and Martin lakes Diagnostic Study October 16, 2009 LaGrange County, Indiana
File No.070874.00 Page 102
IV. Nitrate (ppm) A. At least 0.3 1 B. 0.4 to 0.8 2 C. 0.9 to 1.9 3 D. 2.0 or more 4
V. Ammonia (ppm)
A. At least 0.3 1 B. 0.4 to 0.5 2 C. 0.6 to 0.9 3 D. 1.0 or more 4
VI. Dissolved Oxygen:
Percent Saturation at 5 feet from surface A. 114% or less 0 B. 115% 50 119% 1 C. 120% to 129% 2 D. 130% to 149% 3 E. 150% or more 4
VII. Dissolved Oxygen:
Percent of measured water column with at least 0.1 ppm dissolved oxygen A. 28% or less 4 B. 29% to 49% 3 C. 50% to 65% 2 D. 66% to 75% 1 E. 76% 100% 0
VIII. Light Penetration (Secchi Disk)
A. Five feet or under 6 IX. Light Transmission (Photocell): Percent of light transmission at a depth of 3 feet
A. 0 to 30% 4 B. 31% to 50% 3 C. 51% to 70% 2 D. 71% and up 0
X. Total Plankton per liter of water sampled from a single vertical tow between the 1% light
level and the surface: A. less than 3,000 organisms/L 0 B. 3,000 - 6,000 organisms/L 1 C. 6,001 - 16,000 organisms/L 2 D. 16,001 - 26,000 organisms/L 3 E. 26,001 - 36,000 organisms/L 4 F. 36,001 - 60,000 organisms/L 5 G. 60,001 - 95,000 organisms/L 10 H. 95,001 - 150,000 organisms/L 15 I. 150,001 - 5000,000 organisms/L 20 J. greater than 500,000 organisms/L 25 K. Blue-Green Dominance: additional points 10
Oliver, Olin, and Martin lakes Diagnostic Study October 16, 2009 LaGrange County, Indiana
File No.070874.00 Page 103
Historic Indiana Trophic State Index values calculated for OOM Lakes under the Clean Lakes Program are shown in Table 39. The trophic state of Oliver Lake has varied between 3 and 22, which represents oligotrophic conditions during 2000, 2003, and 2008 and mesotrophic conditions in 1993. The trophic state of Olin Lake has varied between 18 and 26, which represents mesotrophic conditions during all survey years. The trophic state of Martin Lake has varied between 14 and 31, which represents oligotrophic conditions in 1993, mesotrophic conditions in 2000, 2003, and 2008, and eutrophic conditions in 1990. Table 39. Olin, Oliver, and Martin Lakes: Historic Indiana Trophic State Index.
1990 1993 2000 2003 2008Oliver Lake -- 22 3 15 13 Olin Lake -- 19 26 18 23 Martin Lake 31 14 16 21 26
Source: Indiana Department of Environmental Management. “Clean Lakes Program.” 1990-2003 and current study. The Carlson TSI. The most widely used and accepted TSI is one developed by Bob Carlson (1977) called the Carlson TSI. Carlson analyzed summertime total phosphorus, chlorophyll a, and Secchi disk transparency data for numerous lakes and found statistically significant relationships among the three parameters. He developed mathematical equations for these relationships and these form the basis for the Carlson TSI. Using this index, a TSI value can be generated by one of three measurements: Secchi disk transparency, chlorophyll a or total phosphorus (epilimnetic sample). Data for one parameter can also be used to predict a value for another. The TSI values range from 0 to 100. Each major TSI division (10, 20, 30, etc.) represents a doubling in algal biomass (Figure 64). As a further aid in interpreting TSI results, Carlson's scale is divided into four lake productivity categories: oligotrophic (least productive), mesotrophic (moderately productive); eutrophic (very productive) and hypereutrophic (extremely productive). Using Carlson's index, a lake with a summertime Secchi disk depth of 3 feet would have a TSI of 60 points (located in line with the 1 meter). This lake would be in the mesotrophic category. Because the index was constructed using relationships among transparency, chlorophyll, and total phosphorus, a lake having a Secchi disk depth of 3 feet would also be expected to have approximately 20 μg/L chlorophyll and 50 μg/L total phosphorus. Not all lakes have the same relationship between transparency, chlorophyll and total phosphorus as Carlson's lakes do. Other factors such as high values of suspended sediments or heavy predation of algae by zooplankton may keep chlorophyll concentrations lower than might be otherwise expected from the total phosphorus or chlorophyll concentrations. High values of suspended sediments would also make transparency worse than otherwise predicted by Carlson's index. It is also useful to compare the actual trophic state points for a particular lake from one year to the next to detect any trends in changing water quality. While climate and other natural events will cause some variation in water quality over time (possibly 5-10 trophic points), larger point changes may indicate important changes in lake quality.
Oliver, Olin, and Martin lakes Diagnostic Study October 16, 2009 LaGrange County, Indiana
File No.070874.00 Page 104
CARLSON'S TROPHIC STATE INDEX
Figure 64. Carlson’s Trophic State Index with Olin, Oliver, and Martin lakes indicated. When compared to Carlson’s Secchi Disk and Total Phosphorous TSIs all three lakes fell into the mesotrophic category. Carlson’s Chlorophyll-a TSI placed Olin and Oliver lower in the mesotrophic category and placed Martin in the oligotrophic category. 4.4.4 Lake Water Quality Assessment Summary In general, Oliver, Olin, and Martin lakes exhibited good water quality. Total phosphorus concentrations in all three lakes were below or at the median average for Indiana lakes (Table 37). The Indiana Trophic State Index (ITSI) value for Oliver Lake classified the lake as oligotrophic suggesting Oliver Lake has high water quality. This trophic classification is similar to those values determined during previous sampling periods (Table 39). Olin and Martin lakes both were classified as mesotrophic lakes during the current study suggesting the lakes have intermediate water quality. The 2008 ITSI value for Olin Lake is similar to those sampled during the previous sampling events. The 2008 ITSI value for Martin Lake is the second highest ITSI values recorded by the CLP, but is the fourth highest when compared to all historic studies (Table 26). When comparing 2008 ITSI values to Vollenweider (1975) and Carlson TSI values for Oliver, Olin, and Martin Lakes, the Vollenweider and Carlson TSI values were slightly higher, in general. Maintaining lower trophic values in OOM Lakes is important for sustaining the coldwater fishery the chain currently possesses as will be discussed in greater detail in section 4.6. Years of plant and algae production and transport of organic material into OOM Lakes from its watershed have led to a build-up of decaying organic matter in the sediments of OOM Lakes. As bacteria decompose this material, they consume oxygen and leave the bottom waters anoxic (dissolved oxygen concentrations < 1.0 mg/L). Currently, Oliver Lake contains the highest percentage of the water column containing sufficient dissolved oxygen for aquatic life at 74.6% and Martin Lake the lowest at 48.6%. The presence of anoxic conditions has led to internal phosphorus release from Oliver and Olin lakes sediment, which is evident by the high sediment phosphorus release factor listed in Table 35. The sediment phosphorus release factor is the amount of soluble phosphorus (the form of
Oliver, Olin, and Martin lakes Diagnostic Study October 16, 2009 LaGrange County, Indiana
File No.070874.00 Page 105
phosphorus that can be released from the sediments) in the deepwater (hypolimnetic) sample to the surface (epilimnetic) sample. In Oliver and Olin Lakes the ratio is 20.6/1 and 34.2/1, respectively. Martin Lake does not show evidence of internal loading of phosphorous because there are equal concentrations of soluble phosphorus in the hypolimnia and epilimnion. In most lakes in Indiana, phosphorus release from the sediments is an additional and important source of phosphorus to the lake that must be addressed along with watershed practices when designing a management plan to reduce nutrient loading to the lake. This internal loading of phosphorus is another source of phosphorus to these lakes that can promote excessive algae production. Current data suggest that internal loading of phosphorus is a large component of Oliver and Olin lakes phosphorus load. This will be explained in more detail in the Phosphorus Modeling Section (5.0). 4.5 Macrophyte Inventory 4.5.1 Macrophyte Inventory Introduction There are many reasons to conduct an aquatic rooted plant survey as part of a complete assessment of a lake and its watershed. Like other biota in a lake ecosystem (e.g. fish, microscopic plants and animals, etc.), the composition and structure of the lake’s rooted plant community often provide insight into the long term water quality of a lake. While sampling the lake water’s chemistry (dissolved oxygen, nutrient concentrations, etc.) is important, water chemistry sampling offers a single snapshot of the lake’s condition. Because rooted plants live for many years in a lake, the composition and structure of this community reflects the water quality of the lake over a longer term. For example, if one samples the water chemistry of a typically clear lake immediately following a major storm event, the results may suggest that the lake suffers from poor clarity. However, if one examines the same lake and finds that rooted plant species such as northern watermilfoil, white stem pondweed, and large-leaf pondweed, all of which prefer clear water, dominate the plant community, one is more likely to conclude that the lake is typically clear and its current state of turbidity is due to the storm rather than being its inherent nature. The composition and structure of a lake’s rooted plant community also help determine the lake’s fish community composition and structure. Submerged aquatic vegetation provides cover from predators and is a source of forage for many different species of fish (Valley et al., 2004). However, extensive and dense stands of exotic aquatic vegetation can have a negative impact on the fish community. For example, a lake’s bluegill population can become stunted because dense vegetation reduces their foraging ability, resulting in slower growth. Additionally, dense stands reduce predation by largemouth bass and other piscivorous fish on bluegill which results in increased intraspecific competition among both prey and predator species (Olsen et al., 1998). Vegetation removal can have variable results on improving fish growth rates (Cross et al., 1992, Olsen et al., 1998). Conversely, lakes with depauperate plant communities may have difficulty supporting some top predators that require emergent vegetation for spawning. In these and other ways, the lake’s rooted plant community illuminates possible reasons for a lake’s fish community composition and structure. A lake’s rooted plant community impacts the recreational uses of the lake. Swimmers and power boaters desire lakes that are relatively plant-free, at least in certain portions of the lake. In contrast, anglers prefer lakes with adequate rooted plant coverage, since those lakes offer the best fishing opportunity. Before lake users can develop a realistic management plan for a lake, they must understand the existing rooted plant community and how to manage that community. This understanding is necessary to achieve the recreational goals lake users may have for a given lake.
Oliver, Olin, and Martin lakes Diagnostic Study October 16, 2009 LaGrange County, Indiana
File No.070874.00 Page 106
For the reasons outlined above, as well as several others, JFNew conducted a general macrophyte (rooted plant) survey on Oliver, Olin, and Martin Lakes as part of the overall lake and watershed diagnostic study. Before detailing the results of the macrophyte survey, it may be useful to outline the conditions under which lakes may support macrophyte growth. Additionally, an understanding of the roles that macrophytes play in a healthy, functioning lake ecosystem is necessary for lake users to manage the lake’s macrophyte community. The following paragraphs provide some of this information. Conditions for Growth Like terrestrial vegetation, aquatic vegetation has several habitat requirements that need to be satisfied in order for the plants to grow or thrive. Aquatic plants depend on sunlight as an energy source. The amount of sunlight available to plants decreases with depth of water as algae, sediment, and other suspended particles block light penetration. Consequently, most aquatic plants are limited to maximum water depths of approximately 10-15 feet (3-4.5 m), but some species, such as Eurasian watermilfoil, have a greater tolerance for lower light levels and can grow in water deeper than 32 feet (10 m) (Aikens et al., 1979). Hydrostatic pressure rather than light often limits plant growth at deeper water depth (15-20 feet or 4.5-6 m). Water clarity affects the ability of sunlight to reach plants, even those rooted in shallow water. Lakes with clearer water have an increased potential for plant growth. Oliver, Olin, and Martin lakes possess better water clarity than the average Indiana lake. The Secchi disk depth measured in Oliver, Olin, and Martin lakes during the spring plant survey was 14.5 feet (4.4 m), 10.0 feet (3.0 m), and 11.5 feet (3.5 m), respectively. During the summer survey, Secchi disk depth decreased slightly to less than 10 feet (3 m) in each of the lakes. As a general rule of thumb, rooted plant growth is restricted to the portion of the lake where water depth is less than or equal to 2 to 3 times the lake’s Secchi disk depth. This did not hold true for each of the lakes during the spring survey because root plants were not observed deeper than 12 feet (3.7 m). Water clarity or light is not limiting aquatic plant growth. During the summer survey, water clarity decreases; however, rooted plant depth increased to a maximum of 18 feet (5.5 m) in Oliver and 17 feet (5.2 m) in Martin. Aquatic plants also require a steady source of nutrients for survival. Many aquatic macrophytes differ from microscopic algae (which are also plants) in their uptake of nutrients. Aquatic macrophytes receive most of their nutrients from the sediments via their root systems rather than directly utilizing nutrients in the surrounding water column. Some competition with algae for nutrients in the water column does occur. The amount of nutrients taken from the water column varies for each macrophyte species. Because macrophytes obtain most of their nutrients from the sediments, lakes which receive high watershed inputs of nutrients to the water column will not necessarily have aquatic macrophyte problems. A lake’s substrate and the forces acting on the substrate also affect a lake’s ability to support aquatic vegetation. Lakes with mucky, organic, nutrient-rich substrates have an increased potential for plant growth compared to lakes with gravelly, rocky substrates. Sandy substrates that contain sufficient organic material typically support healthy aquatic plant communities. Lakes that have significant wave action that disturb the bottom sediments have decreased ability to support plants. Disturbance of bottom sediment may decrease water clarity, limiting light penetration, or may affect the availability of nutrients for the macrophytes. Wave action may also create significant shearing forces prohibiting plant growth altogether. Boating activity may affect macrophyte growth in conflicting ways. Rooted plant growth may be limited if boating activity regularly disturbs bottom sediments. Alternatively, boating activity in
Oliver, Olin, and Martin lakes Diagnostic Study October 16, 2009 LaGrange County, Indiana
File No.070874.00 Page 107
rooted plant stands of species that can reproduce vegetatively, such as Eurasian watermilfoil or coontail, may increase macrophyte density rather than decrease it. Herbicide treatment can also affect the presence and distribution of aquatic macrophytes within a lake. As species or areas are selectively treated, the density and diversity of plants present within those locations can, and typically do change. For example, continuing to treat a specific plant bed which contains Eurasian watermilfoil can result in the disappearance of Eurasian watermilfoil and the resurgence of a variety of native species. It should be noted, however, that non-native plants can regrow in these locations just as easily as native plants. Ecosystem Roles Aquatic plants are a beneficial and necessary part of healthy lakes. Plants stabilize shorelines holding bank soil with their roots. The vegetation also serves to dissipate wave energy further protecting shorelines from erosion. Plants play a role in a lake’s nutrient cycle by up-taking nutrients from the sediments. Like their terrestrial counterparts, aquatic macrophytes produce oxygen which is utilized by the lake’s fauna. Plants also produce flowers and unique leaf patterns that are aesthetically attractive. Emergent and submergent plants provide important habitat for fish, insects, reptiles, amphibians, waterfowl, shorebirds, and small mammals. Fish utilize aquatic vegetation for cover from predators and for spawning and rearing grounds. Different species depend upon different percent coverages of these plants for successful spawning, rearing, and protection for predators. For example, bluegill require an area to be approximately 15-30% covered with aquatic plants for successful survival, while northern pike achieve success in areas where rooted plants cover 80% or more of the area (Borman et al., 1997). Aquatic vegetation also serves as substrate for aquatic insects, the primary diet of insectivorous fish. Waterfowl and shorebirds depend on aquatic vegetation for nesting and brooding areas. Numerous waterfowl were observed utilizing Oliver, Olin, and Martin lakes as habitat during the macrophyte survey. Aquatic plants such as pondweed, coontail, duckweed, watermilfoil, and arrowhead, also provide a food source to waterfowl. Duckweed in particular has been noted for its high protein content and consequently has served as feed for livestock. Turtles and snakes utilize emergent vegetation as basking sites. Amphibians rely on the emergent vegetation zones as primary habitat. 4.5.2 Macrophyte Inventory Methods JFNew surveyed Oliver, Olin, and Martin Lakes on May 29 and August 6, 2008 according to the Indiana Department of Natural Resources sampling protocols (IDNR, 2007). JFNew examined the entire littoral zone of the lake during each of the assessments. Aquatic plant community surveys and exotic species mapping occurred on May 29, 2008. The entire littoral zone was surveyed during this assessment. As defined in the DNR protocol, the lake’s littoral zone was estimated to be approximately three times the lake’s Secchi disk depth. This estimate approximates the 1% light level, or the level at which light penetration into the water column is sufficient to support plant growth. JFNew completed two Tier II surveys within each of the lakes on May 29 and August 6, 2008. Surveys were completed using the Tier II survey protocol updated by the IDNR LARE staff in May 2007 (IDNR, 2007). The survey protocol generally follows previous Tier II protocols and requires that the sampling points be stratified over the entire depth of the lake’s littoral zone. Total points sampled per stratum were determined as follows:
Oliver, Olin, and Martin lakes Diagnostic Study October 16, 2009 LaGrange County, Indiana
File No.070874.00 Page 108
1. Appendix D of the IDNR protocol was consulted to determine the number of points to be sampled. This determination was based on the lake size (surface area) and trophic status.
2. Table 3 of the IDNR protocol was referenced as an indicator of the number of sample points per stratum. Table 40 in this report lists the sampling strategy for the Oliver, Olin, and Martin Lakes.
Stratum refers to depth at which plants were observed. Dominance presented in subsequent tables was calculated by the IDNR protocol. The rake score frequency per species scale presented in subsequent tables provides a measure of the frequency of a species. The percentage of plants found within a frequency measure indicates the frequency of plants found over all the sampling points. Table 40. Tier II sampling strategy for Oliver, Olin, and Martin lakes using the 2007 Tier II protocol.
Lake Size Trophic Status Number of Points Stratification of Points
4.5.3 Macrophyte Inventory Results A spring Tier II survey and a summer Tier II survey were completed on all three lakes (Oliver, Olin, and Martin). All surveys were conducted in 2008 by JFNew. The survey schedule for all lakes is detailed in Table 41. Northeastern bladderwort (Utricularia resupinata) was collected in Oliver Lake during the 2008 summer Tier II survey (Figure 65). Identification was verified by Mitch Alix of Purdue University North Central. Prior to a collection of this species in summer 2008 by Mitch Alix in Bass Lake, northeastern bladderwort was thought to be extirpated from Indiana; to our knowledge, the collection in Oliver Lake represents only the second known location for this species in Indiana. A collection was submitted to Morton Arboretum (SAN #595), and a rare plant form was submitted to Mike Homoya of IDNR – Division of Nature Preserves to document the population. No other threatened or rare aquatic plant species were collected during the surveys. Table 41. Survey schedule of Tier II surveys. Survey Date Spring Tier II and community survey May 29, 2008 Summer Tier II and community survey August 6, 2008
Oliver, Olin, and Martin lakes Diagnostic Study October 16, 2009 LaGrange County, Indiana
File No.070874.00 Page 109
Figure 65. Northeastern bladderwort locations identified within Oliver, Olin, and Martin lakes during the August 6, 2008 assessments. 4.5.4 Exotic Species Mapping Exotic species locations are detailed in Figure 66. Additional plant community information is discussed in detail in the following sections.
Oliver, Olin, and Martin lakes Diagnostic Study October 16, 2009 LaGrange County, Indiana
File No.070874.00 Page 110
Figure 66. Dense curly-leaf pondweed and Eurasian watermilfoil locations identified within Oliver, Olin, and Martin Lakes during the 2008 assessments. A few areas were mapped as containing moderately dense Eurasian watermilfoil or curly-leaf pondweed growth during the spring survey (Figure 66). However, most of these areas were sparsely vegetated during the summer assessment. Declines in water clarity, increased runoff from the watershed, and denser algal growth likely limited the plant community density and diversity during the summer plant survey. Most of the Eurasian watermilfoil beds located in Oliver Lake were identified along the steep shelves where the depth of the lake increases quite rapidly. A few Eurasian watermilfoil beds were located along the shoreline and in almost every private channel. Curly-leaf pondweed was identified, along with Eurasian watermilfoil, in one large bed on the northwest corner of the lake by the inlet from Dove Creek and in most of the channels as well. Most of the locations of Eurasian watermilfoil and curly-leaf pondweed in Olin and Martin Lakes were along the shoreline in shallow areas (less than 10 feet). Although chara dominated the aquatic plant community within Oliver Lake during the spring survey, several other species were also identified (Table 42). Thirteen of these species are submergent species and are in Table 42 below. Seventeen emergent or rooted floating species were identified during the survey including two exotic species: purple loosestrife and reed canary grass. During the summer survey, seventeen submergent species were observed including those listed in the table as well as water star grass, southern naiad, spiny naiad, northeastern bladderwort, and eel grass. Robbins’ pondweed and flat-stem pondweed were the
Oliver, Olin, and Martin lakes Diagnostic Study October 16, 2009 LaGrange County, Indiana
File No.070874.00 Page 111
only two species identified in the spring survey, but not during the summer survey. Despite the increased diversity, the density of the plant community was almost the same as that observed during the spring survey. Overall, the plant diversity and density is very good in Oliver Lake. Transparency decreased from the spring to summer survey, but it did not seem to have a drastic impact on plant growth in the lake. Table 42. Aquatic plant species observed in Oliver Lake during the spring and summer surveys completed May 29 and August 6, 2008. Scientific Name Common Name Stratum Spring Summer Ceratophyllum demersum Coontail Submergent X X Chara species Chara species Submergent X X Decodon verticillatus Whirled loosestrife Emergent X X Eleocharis erythropoda Bald spikerush Emergent X X Eleocharis palustris Creeping spikerush Emergent X X Elodea canadensis Common water weed Submergent X X Filamentous algae Filamentous algae Algae X X Heteranthera dubia Water star grass Submergent X Iris virginica Blue-flag iris Emergent X X Lemna minor Common duckweed Floating X X Lythrum salicaria Purple loosestrife Emergent X X Myriophyllum exalbescens Northern water milfoil Submergent X X Myriophyllum heterophyllum Variable-leaf watermilfoil Submergent X X Myriophyllum spicatum Eurasian watermilfoil Submergent X X Najas guadalupensis Southern naiad Submergent X Najas marina Spiny naiad Submergent X Nuphar advena Spatterdock Floating X X Nuphar variegatum Yellow water lily Floating X X Phalaris arundinacea Reed canary grass Emergent X X Polygonum lapathifolium Willow-weed Emergent X X Pontederia cordata Pickerel weed Emergent X X Potamogeton amplifolius Large-leaf pondweed Submergent X X Potamogeton crispus Curly leaf pondweed Submergent X X Potamogeton gramineus Grassy pondweed Submergent X X Potamogeton illinoensis Illinois pondweed Submergent X X Potamogeton praelongus White-stem pondweed Submergent X X Potamogeton robinsii Robbins' pondweed Submergent X Potamogeton zosteriformis Flat-stem pondweed Submergent X Sagittaria latifolia Common arrowhead Emergent X X Scirpus acutus Hard-stem bulrush Emergent X X Scirpus pungens Chairmaker's rush Emergent X X Sparganium eurycarpum Giant bur-reed Emergent X X Stuckenia pectinatus Sago pondweed Submergent X X Typha angustifolia Narrow leafed cattail Emergent X X Typha latifolia Broad leafed cattail Emergent X X Typha x glauca Blue cattail Emergent X X Utricularia resupinata* Northeastern bladderwort Submergent X Vallisneria americana Eel grass Submergent X Wolffia columbiana Water meal Floating X X
*State extirpated species The plant species in Olin Lake that occurs in greatest abundance is Illinois pondweed. Fifteen submergent species were identified in Olin Lake during the spring survey. These species are listed in Table 43 below. Like Oliver Lake, Olin Lake possessed few areas that were mapped as
Oliver, Olin, and Martin lakes Diagnostic Study October 16, 2009 LaGrange County, Indiana
File No.070874.00 Page 112
having dense Eurasian watermilfoil communities during the spring assessment. Also, like Oliver Lake, Olin Lake’s transparency decreased from the spring to summer survey, but it did not seem to have a negative impact on aquatic plant growth. There were fewer plants identified during the summer survey, but there were three species identified during the summer survey that were not found during the spring survey. See Table 43 for these species. Table 43. Aquatic plant species observed in Olin Lake during the spring and summer surveys completed May 29 and August 6, 2008. Scientific Name Common Name Stratum Spring Summer Ceratophyllum demersum Coontail Submergent X X Chara species Chara species Submergent X X Decodon verticillatus Whirled loosestrife Emergent X X Filamentous algae Filamentous algae Algae X Heteranthera dubia Water star grass Submergent X Myriophyllum heterophyllum Variable-leaf watermilfoil Submergent X Myriophyllum spicatum Eurasian watermilfoil Submergent X X Najas marina Spiny naiad Submergent X Nuphar advena Spatterdock Floating X X Nuphar variegatum Yellow water lily Floating X X Phalarus arundinacea Reed canary grass Emergent X X Pontederia cordata Pickerel weed Emergent X X Potamogeton amplifolius Large-leaf pondweed Submergent X Potamogeton crispus Curly leaf pondweed Submergent X Potamogeton gramineus Grassy pondweed Submergent X X Potamogeton illinoensis Illinois pondweed Submergent X X Stuckenia pectinatus Sago pondweed Submergent X X Potamogeton praelongus White-stem pondweed Submergent X X Potamogeton robinsii Robbins' pondweed Submergent X Potamogeton zosteriformis Flat-stem pondweed Submergent X Scirpus acutus Hard-stem bulrush Emergent X X Scirpus pungens Chairmaker's rush Emergent X X Sparganium eurycarpum Giant bur-reed Emergent X X Typha angustifolia Narrow leafed cattail Emergent X X Typha x glauca Blue cattail Emergent X X Typha latifolia Broad leafed cattail Emergent X X Valisneria americana Eel grass Submergent X Wolffia columbiana Water meal Floating X
Unlike Oliver and Olin lakes, the main plant species occurring in Martin Lake is Eurasian watermilfoil. Other plant species present in high abundance and frequency include: coontail, Illinois pondweed, and sago pondweed. Several problem areas are located throughout the lake, but considering the small surface area of Martin Lake many of these areas are less than one acre in size. Eurasian watermilfoil is present in dense patches throughout Martin Lake; however, no particular pattern is apparent in the growth of this species. Only those areas deemed as heavy boating areas where Eurasian watermilfoil is a nuisance or could easily or rapidly spread to other portions of Martin Lake or downstream to Olin or Oliver Lakes should be considered for aquatic herbicide treatment at this time.
Oliver, Olin, and Martin lakes Diagnostic Study October 16, 2009 LaGrange County, Indiana
File No.070874.00 Page 113
Table 44. Aquatic plant species observed in Martin Lake during the spring and summer surveys completed May 29 and August 6, 2008. Scientific Name Common Name Stratum Spring Summer Agrostis alba palustris Bent grass Emergent X X Asclepias incarnata Swamp milkweed Emergent X X Ceratophyllum demersum Coontail Submergent X X Chara species Chara species Submergent X Decodon verticillatus Whirled loosestrife Emergent X X Eleocharis erythropoda Bald spikerush Emergent X X Eleocharis palustris Creeping spikerush Emergent X X Elodea canadensis Common water weed Submergent X Equisetum arvense Field horsetail Emergent X X Filamentous algae Filamentous algae Algae X X Heteranthera dubia Water star grass Submergent X X Iris virginica Blue-flag iris Emergent X X Leersia oryzoides Rice cut grass Emergent X X Lemna minor Common duckweed Floating X X Myriophyllum exalbescens Northern water milfoil Submergent X Myriophyllum heterophyllum Variable-leaf watermilfoil Submergent X Myriophyllum spicatum Eurasian watermilfoil Submergent X X Najas guadalupensis Southern naiad Submergent X Najas marina Spiny naiad Submergent X Nuphar advena Spatterdock Floating X X Nuphar variegatum Yellow water lily Floating X X Numphaea tuberosa White water lily Floating X X Phalarus arundinacea Reed canary grass Emergent X X Phragmites australis Common reed Emergent X X Polygonum amphibium stipulaceum Water knotweed Emergent X X Polygonum hydropiperoides Smartweed Emergent X X Pontederia cordata Pickerel weed Emergent X X Potamogeton amplifolius Large-leaf pondweed Submergent X X Potamogeton crispus Curly leaf pondweed Submergent X Potamogeton illinoensis Illinois pondweed Submergent X X Potamogeton pectinatus Sago pondweed Submergent X X Potamogeton praelongus White-stem pondweed Submergent X Sagittaria latifolia Common arrowhead Emergent X X Scirpus acutus Hard-stem bulrush Emergent X X Scirpus fluviatilis River bulrush Emergent X X Scirpus pungens Chairmaker's rush Emergent X X Sparganium eurycarpum Giant bur-reed Emergent X X Spirodela polyrhiza Large duckweed Floating X X Typha angustifolia Narrow leafed cattail Emergent X X Typha x glauca Blue cattail Emergent X X Typha latifolia Broad leafed cattail Emergent X X
Overall, plant growth within Oliver, Olin, and Martin lakes is relatively dense in the spring, and even more so in the summer survey. Aquatic plants generally cover much of the shoreline of Olin and Martin Lakes. Growth is typically limited in Oliver Lake by the width of available substrate located within the littoral zone. Oliver Lake possesses a narrow shelf upon which plants can grow. Plants typically colonize all available surfaces early in the spring and grow to peak densities in June or July. Although densities usually decline as water quality becomes poorer, Oliver, Olin, and Martin Lakes all showed an increase in the most dominant species in each lake. This may be due to the low density of algae so aquatic plants within the lakes are not
Oliver, Olin, and Martin lakes Diagnostic Study October 16, 2009 LaGrange County, Indiana
File No.070874.00 Page 114
shaded out and are therefore able to photosynthesize. When shading out does occur, plants drop out of the water column and densities become much more sparse. All other submergent plant densities either declined slightly or not at all from the spring to summer surveys. During 2008, the water clarity declined during the summer but did not reach the poor levels commonly observed within surrounding lakes during the summer months. 4.5.5 Spring Tier II The Tier II surveys occurred on Oliver, Olin, and Martin Lakes on May 29 and August 6, 2008. Figure 67 shows the locations where points were sampled within all three lakes. Figures 68 and 69 identify locations of the exotic species, Eurasian watermilfoil and curly-leaf pondweed, found during the spring Tier II sampling events. Raw data and survey results for each lake are included in Appendix D.
Figure 67. Locations sampled during the Oliver, Olin, and Martin Lakes Tier II survey which occurred on May 29, 2008.
Oliver, Olin, and Martin lakes Diagnostic Study October 16, 2009 LaGrange County, Indiana
File No.070874.00 Page 115
Figure 68. Eurasian watermilfoil locations in Oliver, Olin, and Martin Lakes as sampled during the Tier II surveys which occurred on May 29, 2008.
Oliver, Olin, and Martin lakes Diagnostic Study October 16, 2009 LaGrange County, Indiana
File No.070874.00 Page 116
Figure 69. Curly-leaf pondweed locations in Oliver, Olin, and Martin Lakes as sampled during the Tier II surveys which occurred on May 29, 2008. Oliver Lake JFNew conducted the Tier II survey on Oliver Lake on May 29, 2008. Transparency was measured at the deepest spot in the lake using a Secchi disk prior to the sampling event. Transparency was observed at 14.5 feet (4.4 m) at the time of the survey. Based on the survey protocol, plants were sampled to a depth of 20 feet (6.1 m). However, plants were only present to a maximum depth of 12 feet (3.7 m). Even though plants were not identified below 12 feet (3.7 m) future surveys should continue to sample to 20 feet (6.1 m) to observe changes in water clarity. Seventy sites were randomly selected within the littoral zone based on the stratification indicated in the protocol. Results of the sampling are listed in Table 45 and Appendix D.
Oliver, Olin, and Martin lakes Diagnostic Study October 16, 2009 LaGrange County, Indiana
File No.070874.00 Page 117
Table 45. Oliver Lake spring Tier II survey metrics and data as collected May 29, 2008. Occurrence and abundance of submersed aquatic plants in Oliver Lake.
County: LaGrange Sites with plants: 42 Mean species/site: 1.33Date: 5/29/2008 Sites with native plants: 41 Standard error (ms/s): 0.16
Secchi (ft): 14.5 Number of species: 12 Mean native species/site: 1.13Maximum plant
depth (ft): 12 Number of native species: 10 Standard error (mns/s): 0.13
Trophic status: Mesotrophic Maximum species/site: 4 Species diversity: 0.88Total sites: 70 Native species diversity: 0.86
All depths (0-20 feet) Frequency of Occurrence
Rake score frequency per species Plant
Dominance Scientific Name Common Name 0 1 3 5 Chara species Chara species 25.71 74.29 24.29 1.43 0.00 5.71 Potamogeton illinoensis Illinois pondweed 21.43 78.57 20.00 1.43 0.00 4.86
Filamentous algae Filamentous algae 10.00 Chara dominated the plant community throughout the littoral zone and in the 0-5 feet (0-1.5 m) stratum. Chara was identified at 26% of sites surveyed throughout Oliver Lake. It was also the most frequently identified plant species in the 0-5 feet (0-1.5 m) stratum where it was observed at 56% of sites. Grassy pondweed and variable-leaf pondweed were also dominant in the 0-5 foot (0-1.5 m) stratum with a frequency of 24% each. Eurasian watermilfoil and coontail were frequent in the 0-5 feet (0-1.5 m) stratum as well with a frequency of 20% of the surveyed sites. Illinois pondweed and sago pondweed dominated the plant community in the 5-10 feet (1.5-3 m) strata, both with a frequency of 32%, and coontail was identified at 21% of the surveyed sites. Eurasian watermilfoil and Robbins’ pondweed were also frequent in the 5-10 feet (1.5-3 m) stratum, present at 26% of the surveyed sites. Illinois pondweed was the only species identified in the 10-15 feet (1.5-3 m) stratum, present at 8% of the survey sites. All other plant species were present in low abundance. Filamentous algae were identified at 10% of the surveyed sites in Oliver Lake. Olin Lake The Tier II survey on Olin Lake was conducted on May 29, 2008. Transparency was measured at the deepest spot in the lake using a Secchi disk prior to the sampling event. Transparency
Oliver, Olin, and Martin lakes Diagnostic Study October 16, 2009 LaGrange County, Indiana
File No.070874.00 Page 118
was found to be 10 feet (3 m) at the time the survey was conducted. Based on the survey protocol, plants were sampled to a depth of 20 feet (6.1 m). However, plants were only present to a maximum depth of 12 feet (3.7 m). Fifty sites were randomly selected within the littoral zone based on the stratification indicated in the protocol. Results of the sampling are listed in Table 46 and Appendix D. Table 46. Olin Lake spring Tier II survey metrics and data as collected May 29, 2008. Occurrence and abundance of submersed aquatic plants in Olin Lake.
County: LaGrange Sites with plants: 20 Mean species/site: 0.86Date: 5/29/2008 Sites with native plants: 20 Standard error (ms/s): 0.17
Secchi (ft): 10 Number of species: 11 Mean native species/site: 0.74Maximum plant
depth (ft): 12 Number of native species: 9 Standard error (mns/s): 0.16
Trophic status: Mesotrophic Maximum species/site: 4 Species diversity: 0.84Total sites: 50 Native species diversity: 0.80
All depths (0-20 feet) Frequency of Occurrence
Rake score frequency per species Plant
Dominance Scientific Name Common Name 0 1 3 5 Potamogeton illinoensis Illinois pondweed 24.00 76.00 24.00 0.00 0.00 4.80
Chara species Chara species 18.00 82.00 18.00 0.00 0.00 3.60 Myriophyllum spicatum Eurasian watermilfoil 10.00 90.00 8.00 0.00 2.00 3.60
Filamentous algae Filamentous algae 6.00 Illinois pondweed was the most frequent plant species present in Olin Lake. Illinois pondweed was identified at 24% of sites sampled throughout the lake and at 50% of sites in the 0-5 foot (0-1.5 m) stratum and at 29% of sites in the 5-10 feet (0-1.5 m) stratum. Illinois pondweed was also more dominant (4.8) than other species present in the lake. Ten other species were identified during the Tier II survey; however, these species were present in relatively low density and frequency. Chara occurred at 18% of the surveyed sites, Eurasian watermilfoil and grassy pondweed occurred at 10% of the surveyed sites, sago pondweed occurred at 8%, and coontail occurred at 6% of the surveyed sites. Curly-leaf pondweed, flat-stem pondweed, Robbins’ pondweed, large-leaf pondwwed and variable-leaf watermilfoil all occurred at 2% of the sites with a dominance of 0.4. In the 0-5 feet stratum (0-1.5 m), chara occurred at the same frequency (50% of sites; see Appendix B for complete results) as Illinois pondweed. However, chara was only present at 7% of the sites in the 5-10 feet (0-1.5 m) stratum. Grassy pondweed and sago pondweed occurred at 25% of sites in the 0-5 feet (0-1.5 m) stratum and maintained a
Oliver, Olin, and Martin lakes Diagnostic Study October 16, 2009 LaGrange County, Indiana
File No.070874.00 Page 119
dominance of 5. Eurasian watermilfoil was present at 12.5% of the sites in the 0-5 feet (0-1.5 m) stratum and curly-leaf pondweed occurred at only 6% of the sites. Eurasian watermilfoil and variable-leaf watermilfoil were the only species present in the 10-15 feet (3-4.6 m) stratum, both occurred at 8% of the surveyed sites. Filamentous algae occurred at 6% of the surveyed sites overall. Martin Lake The Tier II survey on Martin Lake was conducted May 29, 2008. Transparency was measured at the deepest spot in the lake using a Secchi disk prior to the sampling and was found to be 11.5 feet (3.5 m). Based on the survey protocol, plants were sampled to a depth of 20 feet (6.1 m). Plants were present to a depth of 12 feet (3.7 m). Thirty sites were randomly selected throughout the littoral zone based on the stratification indicated in the protocol. Results of the sampling are listed in Table 47 and Appendix D. Table 47. Martin Lake spring Tier II survey metrics and data as collected May 29, 2008. Occurrence and abundance of submersed aquatic plants in Martin Lake.
County: LaGrange Sites with plants: 17 Mean species/site: 1.03Date: 5/29/2008 Sites with native plants: 15 Standard error (ms/s): 0.21
Secchi (ft): 11.5 Number of species: 6 Mean native species/site: 0.67Maximum plant depth
(ft): 12 Number of native species: 4 Standard error (mns/s): 0.15
Trophic status: Mesotrophic Maximum species/site: 4 Species diversity: 0.77Total sites: 30 Native species diversity: 0.71
All depths (0-20 feet) Frequency of Occurrence
Rake score frequency per species Plant
Dominance Scientific Name Common Name 0 1 3 5 Myriophyllum spicatum
Filamentous algae Filamentous algae 10.00 Eurasian watermilfoil was the most dominant plant species in Martin Lake with a site frequency of 33%. Illinois pondweed was also present in high abundance throughout the lake (27%). In the 0-5 feet (0-1.5 m) stratum, Eurasian watermilfoil and sago pondweed were the most frequent species with a frequency of 56% each (Appendix D). Illinois pondweed and coontail were also very frequent in the 0-5 feet (0-1.5 m) stratum, present at 44% and 33% of surveyed sites, respectively. Curly-leaf pondweed and large-leaf pondweed were both found at only 11% of the surveyed sites in the 0-5 feet (0-1.5 m) stratum. All of these species except Eurasian watermilfoil, Illinois pondweed, and large-leaf pondweed occurred at less sites and lower density in the 5-10 feet (1.5-3 m) stratum. Coontail was the only species present in the 10-15 feet (3-4.6 m) stratum with a frequency of 13%. Eurasian watermilfoil had the highest frequency overall (33%); in the 0-5 feet (1.5-3 m) stratum (56%), and 5-10 feet (1.5-3 m) stratum (56%). However, Eurasian watermilfoil was absent from the 10-15 foot (3-4.6 m) stratum. Filamentous algae were present at 10% of the surveyed sites.
Oliver, Olin, and Martin lakes Diagnostic Study October 16, 2009 LaGrange County, Indiana
File No.070874.00 Page 120
4.5.6 Summer Tier II The Tier II surveys occurred on Oliver, Olin, and Martin lakes on August 6, 2008. Figure 70 shows the locations where points were sampled within all three lakes. Figure 71 identifies locations of the exotic species, Eurasian watermilfoil, found during the Tier II sampling events. Raw data and survey results for each lake are included in Appendix D.
Figure 70. Locations sampled during the Oliver, Olin, and Martin Lakes summer Tier II survey which occurred on August 6, 2008.
Oliver, Olin, and Martin lakes Diagnostic Study October 16, 2009 LaGrange County, Indiana
File No.070874.00 Page 121
Figure 71. Eurasian watermilfoil locations in Oliver, Olin, and Martin Lakes as sampled during the summer Tier II survey which occurred on August 6, 2008. Oliver Lake JFNew conducted the Tier II survey on Oliver Lake on August 6, 2008. Transparency was measured at the deepest spot in the lake using a Secchi disk prior to the sampling event. Transparency was observed at 6.5 feet (2 m) at the time of the survey. Based on the survey protocol, plants were sampled to a depth of 20 feet (6.1 m). However, plants were only present to a maximum depth of 18 feet (5.5 m). Seventy sites were randomly selected within the littoral zone based on the stratification indicated in the protocol. Results of the sampling are listed in Table 48 and Appendix D.
Oliver, Olin, and Martin lakes Diagnostic Study October 16, 2009 LaGrange County, Indiana
File No.070874.00 Page 122
Table 48. Oliver Lake summer Tier II survey metrics and data as collected August 6, 2008. Occurrence and abundance of submersed aquatic plants in Oliver Lake.
County: LaGrange Sites with plants: 42 Mean species/site: 1.27Date: 8/6/2008 Sites with native plants: 41 Standard error (ms/s): 0.17
Secchi (ft): 6.5 Number of species: 15 Mean native species/site: 1.21Maximum plant
depth (ft): 18 Number of native species: 14 Standard error (mns/s): 0.16
Trophic status: Mesotrophic Maximum species/site: 5 Species diversity: 0.88Total sites: 70 Native species diversity: 0.87
All depths (0-20 feet) Frequency of Occurrence
Rake score frequency per species Plant
DominanceScientific Name Common Name 0 1 3 5 Chara species Chara species 27.14 72.86 27.14 0.00 0.00 5.43 Potamogeton illinoiensis Illinois pondweed 22.86 77.14 22.86 0.00 0.00 4.57
Heteranthera dubia Water star grass 1.43 98.57 1.43 0.00 0.00 0.29 Filamentous algae Filamentous algae 2.86
Chara dominated the plant community throughout the littoral zone and within the 0-5 feet stratum (0-1.5 m). Chara was identified at 27% of sites surveyed throughout Oliver Lake. It was also the most frequently identified plant species in the 0-5 feet (0-1.5 m) stratum where it was observed at 65% of sites. Chara was also present in the 5-10 feet (1.5-3 m) stratum, at 27% of the surveyed sites, but was not the most dominant species in this stratum. Illinois pondweed was present at 36% of the surveyed sites in the 5-10 feet (1.5-3 m) stratum. Variable-leaf pondweed, grassy pondweed, and sago pondweed were also very frequent in the 0-5 foot stratum, identified at 40%, 35%, and 20% of surveyed sites, respectively. All of these species decreased in frequency in the 5-10 foot (1.5-3 m) stratum, except for Illinois pondweed (36%). White-stem pondweed also increased in frequency from the 0-5 (5%) to 5-10 (27%) feet (0-1.5 m; 1.5-3 m) strata. Eurasian watermilfoil was identified at only 6% of the surveyed sites. Eurasian watermilfoil was present at 5% of the surveyed sites in the 0-5 feet (0-1.5 m) stratum, 9% of the sites in the 5-10 feet (1.5-3 m) stratum, and 11% of the sites in the 15-20 feet (4.6-6.1 m) stratum. This species was not present in the 10-15 feet (3-4.6 m) stratum. All other plant species were present in low abundance.
Oliver, Olin, and Martin lakes Diagnostic Study October 16, 2009 LaGrange County, Indiana
File No.070874.00 Page 123
Olin Lake The summer Tier II survey on Olin Lake was conducted on August 6, 2008. Transparency was measured at the deepest spot in the lake using a Secchi disk prior to the sampling event. Transparency was found to be 5 feet (1.5 m) at the time the survey was conducted. Based on the survey protocol, plants were sampled to a depth of 20 feet (6.1 m). However, plants were only present to a maximum depth of 12 feet (3.7 m). Fifty sites were randomly selected within the littoral zone based on the stratification indicated in the protocol. Results of the sampling are listed in Table 49 and Appendix D. Table 49. Olin Lake summer Tier II survey metrics and data as collected August 6, 2008. Occurrence and abundance of submersed aquatic plants in Olin Lake.
County: LaGrange Sites with plants: 28 Mean species/site: 1.1Date: 8/6/2008 Sites with native plants: 28 Standard error (ms/s): 0.17
Secchi (ft): 5 Number of species: 9 Mean native species/site: 1.02Maximum plant depth
(ft): 12 Number of native species: 8 Standard error (mns/s): 0.16
Trophic status: Mesotrophic Maximum species/site: 5 Species diversity: 0.80Total sites: 50 Native species diversity: 0.77
All depths (0-15') Frequency of Occurrence
Rake score frequency per species Plant
Dominance Scientific Name Common Name 0 1 3 5 Potamogeton illinoiensis Illinois pondweed 40.00 60.00 40.00 0.00 0.00 8.00
Najas marina Spiny naiad 4.00 96.00 4.00 0.00 0.00 0.80 Vallisneria americana Eel grass 2.00 98.00 0.00 2.00 0.00 1.20 Heteranthera dubia Water star grass 2.00 98.00 2.00 0.00 0.00 0.40
Similar to the spring survey, Illinois pondweed was the most frequent plant species in Olin Lake during the summer survey identified at 40% of the overall surveyed sites. All other species identified during the Tier II survey were present in relatively low density and frequency. Illinois pondweed was the most frequent species in the 0-5 feet (0-1.5 m) stratum identified at 65% of the surveyed sites. Sago pondweed, grassy pondweed, and chara were also relatively frequent in the 0-5 feet (0-1.5 m) stratum identified at 40%, 35%, and 25% of the surveyed sites, respectively (Appendix D). Illinois pondweed was also the most frequent species identified in the 5-10 feet (1.5-3 m) stratum, identified at 54% of the surveyed sites. Coontail was identified at 23% of the surveyed sites in the 5-10 feet (1.5-3 m) stratum, but the other species found in this stratum were identified at only 8% of the surveyed sites. None of these species were present in the 10-15 feet (3-4.6 m) stratum where only coontail occurred. No species were identified in the 15-20 feet (4.6-6.1 m) stratum during the summer Tier II survey.
Oliver, Olin, and Martin lakes Diagnostic Study October 16, 2009 LaGrange County, Indiana
File No.070874.00 Page 124
Martin Lake The Tier II survey on Martin Lake was conducted August 6, 2008. Transparency was measured at the deepest spot in the lake using a Secchi disk prior to the sampling and was found to be 7.5 feet (2.3 m). Based on the survey protocol, plants were sampled to a depth of 20 feet (6.1 m). Plants were present to a depth of 17 feet (5.2 m). Thirty sites were randomly selected throughout the littoral zone based on the stratification indicated in the protocol. Results of the sampling are listed in Table 50 and Appendix D. Table 50. Martin Lake summer Tier II survey metrics and data as collected August 6, 2008. Occurrence and abundance of submersed aquatic plants in Martin Lake.
County: LaGrange Sites with plants: 25 Mean species/site: 1.66Date: 8/6/2008 Sites with native plants: 18 Standard error (ms/s): 0.26
Secchi (ft): 7.5 Number of species: 10 Mean native species/site: 1.09Maximum plant depth
(ft): 17 Number of native species: 9 Standard error (mns/s): 0.23
Trophic status: Mesotrophic Maximum species/site: 6 Species diversity: 0.80Total sites: 32 Native species diversity: 0.81
All depths (0-20') Frequency of Occurrence
Rake score frequency per species Plant
Dominance Scientific Name Common Name 0 1 3 5 Myriophyllum spicatum Eurasian watermilfoil 56.25 43.75 50.00 3.13 3.13 15.00
Najas marina Spiny naiad 3.13 96.88 3.13 0.00 0.00 0.63 Chara species Chara species 3.13 96.88 3.13 0.00 0.00 0.63
Eurasian watermilfoil was the most dominant plant species in Martin Lake with a site frequency of 56%. Coontail, Illinois pondweed, and sago pondweed were also present in high abundance throughout the lake. In the 0-5 feet (0-1.5 m) stratum, Eurasian watermilfoil was the most dominant plant with a frequency of 86%. Illinois pondweed, sago pondweed, and coontail were also the most frequent and abundant species identified in the 0-5 feet (0-1.5 m) strata with frequencies of 86%, 57%, and 43%, respectively (Appendix D). In the 5-10 feet (1.5-3 m) stratum, coontail was observed at 50% of sites, while Illinois pondweed, sago pondweed, and common water weed were present at nearly 17% of sites. In the 10-15 feet (3-4.6 m) stratum, Eurasian watermilfoil dominated the community occurring at 33% of sites, while sago pondweed, southern naiad, common water weed, and coontail were all present at only 11% of the surveyed sites. No other species were identified in this stratum. Eurasian watermilfoil was the only species present in the 15-20 feet (4.6-6.1 m) stratum and was identified at 25% of the surveyed sites. Filamentous algae, while present at 10% of the surveyed sites in the spring were not present at any of the surveyed sites during the summer survey.
Oliver, Olin, and Martin lakes Diagnostic Study October 16, 2009 LaGrange County, Indiana
File No.070874.00 Page 125
Oliver, Olin, and the summer survey on Martin lakes possessed greater numbers of species and greater numbers of native species than northern Indiana lakes surveyed by Pearson (2004; Table 51). Martin possessed fewer species and native species during the spring survey than the average determined by Pearson (2004). In addition, all three lakes had poorer rake diversity and native rake diversity than the lakes surveyed by Pearson (2004). The summer survey on Martin Lake was the only survey to result in higher species richness than Pearson’s averages. All three lakes possessed lower native species richness than Pearson’s average. Overall, all three lakes contained higher site species diversity and site species native diversity than the lakes surveyed by Pearson (2004). Table 51. A comparison of the aquatic plant communities in Oliver, Olin, and Martin Lakes to the average values for plant community metrics found by Pearson (2004) in his survey of 21 northern Indiana lakes. Bolding indicates that the value exceeds Pearson average.
Metric Oliver Olin Martin Indiana Average5/29/08 8/6/08 5/29/08 8/6/08 5/29/08 8/6/08
Number of species 12 15 11 9 6 10 8Number of native 10 14 9 8 4 9 7 Rake Diversity (SDI) 0.16 0.17 0.17 0.17 0.21 0.26 0.62 Native Rake Diversity 0.13 0.16 0.16 0.16 0.15 0.23 0.5 Species Richness 1.33 1.27 0.86 1.10 1.03 1.66 1.61 Native Species 1.13 1.21 0.74 1.02 0.67 1.09 1.33 Site Species Diversity 0.88 0.88 0.84 0.80 0.77 0.80 0.66 Site Species native 0.86 0.87 0.80 0.77 0.71 0.81 0.56
4.5.7 Macrophyte Inventory Discussion Considering the number of spatial variables that impact the plant community such as boat-traffic and changes in nutrient availability or temporal variables such as climatic conditions, we cannot easily summarize the cause and effect for changes in the plant communities within Oliver, Olin, and Martin Lakes. Still, general trends emerge from the data that are useful for the purpose of management decisions. Table 52 details changes in the site frequency and dominance of Eurasian watermilfoil and curly-leaf pondweed in 2008 within Oliver, Olin, and Martin Lakes. Since we do not have any previous survey information for Oliver, Olin, or Martin lakes we can only compare the spring and summer results to each other. Multiple years of aquatic macrophyte surveys are needed to accurately determine whether the water quality may be changing with time.
Oliver, Olin, and Martin lakes Diagnostic Study October 16, 2009 LaGrange County, Indiana
File No.070874.00 Page 126
Table 52. Variation in site frequency and dominance of Eurasian watermilfoil and curly-leaf pondweed within Oliver, Olin, and Martin Lakes during all assessments.
Lake Date Eurasian watermilfoil Curly-leaf pondweed Site Frequency
Dominance Index
Site Frequency
Dominance Index
Oliver Lake 5/29/08 14.3 6.9 5.7 2.3 8/6/08 5.7 1.1 0 0
Martin Lake 5/29/08 33.3 10.7 3.3 0.7 8/6/08 56.3 15.0 0 0
These data serve as a baseline by which future variations in the plant community can be compared. Additionally, these data should allow for some determination of future changes in the plant community due to herbicide treatment or other factors (i.e. climate). With this limited data set, we can provide only a limited assessment of the plant communities in Oliver, Olin, and Martin lakes. The only other aquatic plant observations in Oliver, Olin, and Martin lakes was made in 1983 during the fisheries survey. The fish management report for Oliver Lake in 1983 identifies a watermilfoil species, coontail, curly-leaf pondweed, and chara. Aquatic vegetation was abundant near the Dove Creek inlet at the time of the survey. The survey completed in 1983 on Olin Lake identified only two aquatic plant species; a watermilfoil species and chara. Aquatic vegetation was observed as being extremely scarce at the time of the survey. Martin Lake’s aquatic vegetation was limited to a narrow band around the entire shoreline at the time of the survey. Aquatic vegetation in the lake included a watermilfoil species, curly-leaf pondweed, coontail, chara, and American pondweed. Soft rush was observed in all three lakes during these surveys, but from observations made during the 2008 surveys it was likely not the only emergent species found in the lakes. Into the Future Changes in a lake’s rooted plant communities over time can illustrate unseen chemical changes in the lake. Unfortunately, there are limited data detailing Oliver, Olin, and Martin lakes’ historical rooted plant community, which limits a comparison to the current data. In the past, IDNR fisheries biologists conducted cursory vegetation surveys as a part of their general fisheries surveys. As mentioned in the previous paragraph, historical data are rather sparse; however, it is important to note that as early as 1983, curly-leaf pondweed and a watermifoil species were present in the lakes. The current presence of these species is not a new introduction into the OOM lakes chain. The decline in density or distribution of high quality species may indicate a change in water quality. There is little evidence at this time to suggest that Oliver, Olin, and Martin lakes’ water quality may be declining when looking at the plant community. The plant community reflects what is found when looking at other metrics of water quality such as ITSI. Nonetheless, the aquatic plant community may be the first indicator of declining water quality. Aquatic plant species that should be monitored in the OOM lakes chain to determine if the plant community is signaling a larger change in water quality include large-leaf pondweed, grassy pondweed, and flat-stem pondweed. Davis and Brinson (1980) suggest these pondweeds are fairly sensitive to increasing eutrophication. All of these species rate low on Davis and Brinson’s survival index.
Oliver, Olin, and Martin lakes Diagnostic Study October 16, 2009 LaGrange County, Indiana
File No.070874.00 Page 127
(A low rating is associated with an inability to survive as the lake environment changes.) A decline or loss of these species from the three lakes might indicate an increase in eutrophication. Nuisance and Exotic Plants Although they have not yet reached the levels observed on many other regional lakes, several nuisance and/or exotic aquatic plant species grow in Oliver, Olin, and Martin lakes. As nuisance species, these species will continue to proliferate if unmanaged, so data collected during the plant survey will be outdated quickly and should not be used to precisely locate nuisance species individuals or stands. (Additionally, it is likely that the watershed supports many terrestrial nuisance plant species, but this discussion will focus on the aquatic nuisance species.) The plant survey revealed the presence of two submergent, aggressive exotics: Eurasian watermilfoil (Figure 72) and curly-leaf pondweed (Figure 73). It also supports two emergent exotic plant species: purple loosestrife (Figure 74) and reed canary grass (Figure 75). As exotic invasive species, these species have the potential to proliferate if left unmanaged. Private channels where exotic invasive species are abundant may not be eligible for state funding for treatment, but should be considered priorities by the OMLCIA to prevent the continued spread into other parts of the lakes.
Figure 74. Purple loosestrife (Lythrum salicaria) and Figure 75 Reed canary grass (Phalaris arundinacea). The presence of Eurasian watermilfoil in Oliver, Olin, and Martin lakes is of concern, but it is not uncommon for lakes in the region. Eurasian watermilfoil is an aggressive, non-native species common in northern Indiana lakes. It often grows in dense mats excluding the establishment of other plants. For example, once the plant reaches the water’s surface, it will continue growing horizontally across the water’s surface. This growth pattern has the potential to shade other submergent species preventing their growth and establishment. In addition, Eurasian watermilfoil does not provide the same habitat potential for aquatic fauna as many native
Oliver, Olin, and Martin lakes Diagnostic Study October 16, 2009 LaGrange County, Indiana
File No.070874.00 Page 128
pondweeds. Its leaflets serve as poor substrate for aquatic insect larva, the primary food source of many panfish. Depending upon water chemistry, curly-leaf pondweed can be more or less aggressive than Eurasian watermilfoil. Its presence in the lakes is a concern. Like many exotic invasive species, curly-leaf pondweed gains a competitive advantage over native submergent species by sprouting early in the year. The species can do this because it is more tolerant of cooler water temperature than many of the native submergent species. Curly-leaf pondweed experiences a die back during early to mid summer. This die back can degrade water quality by releasing nutrients into the water column and increasing the biological oxygen demand. Purple loosestrife is an aggressive, exotic species introduced into this country from Eurasia for use as an ornamental garden plant. Like Eurasian watermilfoil, purple loosestrife has the potential to dominate habitats, in this case wetland and shoreline communities, excluding native plants. The stiff, woody composition of purple loosestrife makes it a poor food source substitute for many of the native emergent species it replaces. In addition, the loss of diversity that occurs as purple loosestrife takes over plant communities lowers the wetland and shoreline habitat quality for waterfowl, fishes, and aquatic insects. Like purple loosestrife, reed canary grass is native to Eurasia. Farmers used (and many likely still use) the species for erosion control along ditch banks or as marsh hay. The species escaped via ditches and has spread to many of the wetlands in the area. Swink and Wilhelm (1994) indicate that reed canary grass commonly occurs at the toe of the upland slope around a wetland. Reed canary grass was often observed above the ordinary high water mark around the lakes. Like other nuisance species, reed canary grass forms a monoculture mat excluding native wetland/shoreline plants. This limits a wetland’s or shoreline’s diversity ultimately impacting the habitat’s function and value to wildlife. Although it was not identified in Oliver, Olin, and Martin lakes during the aquatic plant survey, another exotic, invasive species, hydrilla, was identified for the first time in Indiana at Lake Manitou in Fulton County. Hydrilla is a submergent plant that resembles common waterweed. However, hydrilla can tolerate lower light levels and higher nutrient concentrations than most native aquatic species. Because of its special adaptations, hydrilla can live in deeper water and photosynthesize earlier in the morning than other aquatic species. Because of these factors, hydrilla is often present long before it becomes readily apparent. It often grows quickly below the water and becomes obvious only after out-competing other species and forming a monoculture. Dense mats of hydrilla often cause pH imbalances and temperature and DO fluctuations. This allows it to out-compete other aquatic-plant species and can cause imbalances in the fish community. The presence of Eurasian watermilfoil, curly-leaf pondweed, and other exotics is typical in northern Indiana lakes. Of the lakes surveyed by aquatic control consultants and IDNR fisheries biologists, nearly every lake supported at least one exotic species (White, 1998a). In fact, White (1998a) notes the absence of exotics in only seven lakes in the 15 northern counties in Indiana. These 15 counties include all of the counties in northeastern Indiana where most of Indiana’s natural lakes are located. Of the northern lakes receiving permission to treat aquatic plants in 1998, Eurasian watermilfoil was listed as the primary target in those permits (White, 1998b). Despite the ubiquitous presence of nuisance species, lakeshore property owners and watershed stakeholders should continue management efforts to limit nuisance species populations. Management options are discussed in the Management section of this report.
Oliver, Olin, and Martin lakes Diagnostic Study October 16, 2009 LaGrange County, Indiana
File No.070874.00 Page 129
4.6 Fisheries The Oliver, Olin, and Martin chain of lakes is different from most Indiana fisheries because it is managed for coldwater species, such as trout. Trout require good water quality, cool water temperatures generally ≤ 65 F (18.5° C), and dissolved oxygen (D.O.) concentrations ≥ 4.0 ppm (Gulish, 1972). Lakes with these characteristics are usually deep and generally unproductive, which would be an adequate description of the OOM chain. Water column profiles measuring temperature and D.O. concentrations taken during a number of different studies on the OOM chain have shown there is a sufficient area of the water column that can support trout throughout the year. Because the OOM chain is managed for coldwater species most of the studies conducted in the OOM chain involve trout or other coldwater species such as the cisco. Cisco are a member of the Salmonidae (Salmon) family and require the same high water quality and cool, well oxygenated water as trout. Frey (1955) suggested cisco require water temperatures ≤ 68 F (20° C) and D.O. concentrations ≥ 3 ppm to survive. Historic studies on the OOM chain include a carp removal experiment in Oliver Lake and population estimate and creel census in 1950, general survey on each of the lakes in 1983, trout based surveys in 1979, 1986, 1990, a chinook salmon introduction effort 1970-1973, and cisco focused assessments in 1955, 1974, and 1994. Little effort has been made to evaluate the abundance of warm water species such as bluegill and largemouth bass due to the relatively unproductive characteristics of the OOM chain. For a complete list of fish species collected during the different surveys refer to Appendix E. The OOM chain has never historically or will ever support an abundance of warmwater fish species. A creel survey (angler catch survey) by Koza and Ledet (1990) concluded the harvest of warm water species, such as bluegill and largemouth bass, was half the average of other lakes in Indiana and found this to be consistent with previous creel surveys. The reason warmwater species in the OOM chain exist in low abundances is due to the morphological and chemical characteristics of the lakes. OOM are deep, marl lakes with small littoral zones and few available nutrients. The percentage of the overall lake area of Oliver, Olin, and Martin Lakes defined as littoral zone ranges from 24.5 to 30%. The littoral zone of a lake extends from the shore out to the water depth where aquatic plants no longer are able to grow, which is determined using the 1% light level (minimum depth at which photosynthesis can no longer occur) parameter. The littoral zone is important because it offers refugia and habitat for many species of fish in addition to spawning habitat and can be important in breaking up wave energy necessary to minimize shoreline erosion. Many warmwater species, such as bluegill and largemouth bass inhabit this area most of the year. The OOM chain offers minimal littoral area which limits the abundance of warmwater species. Trout do not naturally occur in the OOM chain and are maintained through stocking efforts. Trout were first stocked in the OOM chain in 1948 (Koza and Ledet 1994). Rainbow trout, brown trout and lake trout have all been stocked in the OOM chain. Brown trout were stocked in the late 1960’s and the mid 1970’s to early 1980’s. IDNR last stocked brown trout in 1983. Since 2000, brown trout have been stocked annually by the Northeast Indiana Trout Association, according to Buck Toenges, an Oliver Lake resident. Usually 500 to 1,000, 8 to 10 inch (20.3 to 25.4 cm) brown trout are stocked in April. Neil Ledget, Indiana District 2 fisheries biologist, reports brown trout are stocked at two fish per acre while, rainbow trout are stocked at 10 fish per acre in the OOM chain annually. Lake trout were stocked once in Oliver Lake in 1979. Chinook salmon were also stocked in the OOM chain in October 1970. Seventeen-thousand fingerling chinook salmon were stocked in Oliver and Olin Lakes, 15,000 and 2,000, respectively. Assessments were conducted from 1970-1972 to determine the success of the stocking. A chinook fishery was never established despite adequate water quality parameters
Oliver, Olin, and Martin lakes Diagnostic Study October 16, 2009 LaGrange County, Indiana
File No.070874.00 Page 130
and available forage base. Over the three year sampling period, only a total of 11 chinook salmon were collected, seven in Oliver Lake and four in Olin Lake. The OOM chain was the only lake other than Lake Michigan in Indiana that was known to support a population of rainbow smelt. Fishermen who caught rainbow smelt on Lake Michigan are believed to have introduced them into the OOM chain, but the exact date of introduction is unknown. A study done by Frey (1955) investigating the distribution of cisco in Indiana was the first to document an abundant rainbow smelt population. Rainbow smelt were suggested as a reason for the success of the trout stocking program in OOM chain because they provided a good forage base for the trout; however, 1986 was the last documented collection of rainbow smelt in the OOM chain. The introduction of trout into the OOM chain may have contributed to the collapse of the rainbow smelt population. The forage demand of lake trout, brown trout, and rainbow trout may have been too great on the rainbow smelt population. The 1983 general fisheries survey of Oliver Lake (Ledet, 1984) noted lake trout were utilizing rainbow smelt as forage and examined several trout stomachs that contained smelt up to 9 in (22.9 cm). Personal correspondence with Buck Toenges, an Oliver Lake resident, said many fishermen reported rainbow smelt in harvested lake trout stomachs. The exact reasons for the collapse of the rainbow smelt population are not known. Ciscoes, once abundant in the OOM chain, are currently thought to be extirpated from the fishery based on a survey conducted by Koza (1994). Based on a study done from 1971-1974 by Gulish (1975), Koza (1994) sampled 21 of the 41 lakes in Indiana historically known to have cisco populations from 1990 through 1993. Forty-one of the 45 lakes sampled by Gulish (1975) were taken from a previous study done by Frey (1955). Gulish (1975) reported 23 of the 45 lakes sampled contained cisco and listed each lakes cisco populations as abundant, moderate or rare. Ten of the 23 lakes were listed as abundant. The OOM chain accounted for three of the ten. Koza (1994) collected cisco from 11 of the 21 lakes sampled. Of those, cisco were found to be common in six, rare in five, probably extirpated in five, and extirpated in six. No cisco were collected from the OOM chain despite an abundance of suitable cisco habitat measured by Koza (1994). Koza (1994) did not explore why the cisco population collapsed in the OOM chain. Gulish (1975), however made some suggestions for the decline in cisco populations he observed during his study in the early seventies. Effects of eutrophication such as increased decomposition in the cooler, deeper, well-oxygenated regions of lakes results in the loss of cisco habitat and is suggested as the most serious threat to cisco populations (Gulish, 1975). From historical D.O. and temperature profiles (Figures 48, 49, 53, 54, 57, 58) of Oliver, Olin, and Martin Lakes it does not appear that loss of cisco habitat contributed to the collapse of the species because there has consistently been a well defined cisco layer. In addition, cisco are known to periodically have very low reproductive success some years resulting in very low recruitment. A number of reproductively unsuccessful years could be devastating to a cisco population. While it is well known that cisco periodically experience very low reproductive success, the reason for this is unknown. The stocking of brown trout from 1974-1983 could account for the decrease in the cisco population as the cisco population decreased significantly during this time. It is possible the presence of a non-native top predator (brown trout) into the OOM fishery could have reduced the cisco population to levels were predation rates were higher than reproductive rates. Additionally, introduced species such as the alewife in Lake Ontario and Lake Michigan and smelt and bloaters in western Lake Superior were suggested to have contributed to the decline of cisco population because they competed with cisco for food. Rainbow smelt did occur in the OOM chain; however, it would seem unlikely they contributed to the collapse of the cicso population because the two species coexisted for so many years. The factor or factors, which resulted in the collapse of the once
Oliver, Olin, and Martin lakes Diagnostic Study October 16, 2009 LaGrange County, Indiana
File No.070874.00 Page 131
abundant cisco population in the OOM chain, are not known at this time. Given the overall loss or decrease of cisco populations in northern Indiana lakes, there may be factors that are operating at a larger scale such as regional water quality changes and global climate change that influenced the loss of cisco rather than factors at the lake-specific watershed scale. Results of a creel survey by IDNR in 1990 on the OOM chain determined bluegill (65.3%) was the most abundant species harvested by number followed by rainbow trout (21.8%), and largemouth bass (7.9%; Koza and Ledet 1990). By weight, rainbow trout (48.5%), bluegill (29.9%), and largemouth bass (17.4%) dominated the catch. The number of bluegill harvested per acre was 14.4 and for largemouth bass was 1.7. These harvest rates are approximately one half or less of the statewide average for the two species. These harvest rates were similar to those observed during other creel surveys on the OOM chain. Total fishing pressure during the 1990 creel survey was 39 hours per acre. Generally, fishing pressure less than 50 hours per acre is considered low. Bass (28.6%), trout (27%), and bluegill (16.7%) were the most pursued fish species by anglers. Results of the creel indicate the harvest of warmwater species has remained similar to those recorded in earlier surveys and that interest in and harvest of trout has increased in OOM since the beginning of the trout stocking program. Maintaining good water quality in the OOM chain is essential for the continued success of the trout fishery. Any actions taken to reduce the amount of nutrients reaching the lakes would be beneficial to this fishery. Additionally, effects of global climate change on water temperatures could have a potential impact on the OOM fishery. Increases in water temperatures could reduce the area available for trout occupancy. For specific information regarding water quality refer to sections 4.3 and 4.4. 4.7 Lake Use A public meeting was held October 4, 2008 to discuss aquatic plant survey results and to distribute a lake use survey to lake residents to fill out regarding their concerns about the lake. (Appendix F contains detailed results from the user survey.) Figure 76 details the responses of users in regard to perceived problems in Oliver, Olin, and Martin lakes. Twenty-two lake users responded to the survey this year. The main concern of OOM lake users are pier/funneling problems in the lakes (46%). Concerns about the need for dredging in the lakes are an issue for 36% of lake users, while 27% of lake users think the OOM lakes have too many aquatic plants and too many personal watercrafts. Overuse by non-residents (23%) is also of concern to OOM lake users. 18% of lake users think that there are too many boats in the lakes and that there are fish population problems. Only 9% of lake users think there is too much fishing and the water quality is poor within the lakes. Fourteen lake users who submitted a survey made specific comments about the problems concerning the lakes. Those comments are included with the detailed results in Appendix F. Lake users who commented specifically about the aquatic plant issues in the lakes noted that most of the issues are around piers and in private channels where boaters drag the plants from the channels into the lake. We noticed during our surveys that most of the channels in Oliver Lake had dense beds of Eurasian watermilfoil in and at the mouth of the channels. Individuals who responded to the survey were also asked to note what their primary use of the lake is. The majority of people who responded to the survey use the OOM lakes for swimming and boating (100%). Ninety-one percent of individuals use the lake for fishing. Only 5% of lake users use the lake for irrigation purposes, while 14% of lake users responded with “other” activities as their primary use on the OOM lakes. The public access site for Oliver Lake is located on the northwest side of the lake off of County Road 450 South, east of Dove Creek.
Oliver, Olin, and Martin lakes Diagnostic Study October 16, 2009 LaGrange County, Indiana
File No.070874.00 Page 132
Overall, the use of the OOM lakes is for high and low-speed recreation and swimming. As such, the public does not prioritize specific areas for high or low-impact recreation. Furthermore, those areas specified in the survey comments should be prioritized as treatment areas if they are populated by Eurasian watermilfoil or curly-leaf pondweed.
Figure 76. Perceived problems from Oliver, Olin, and Martin lake users. 5.0 MODELING 5.1 Water Budget Inputs of water to Olin, Oliver and Martin lakes are limited to: 1. direct precipitation to the lake 2. discharge from the inlet streams 3. sheet runoff from land immediately adjacent to the lake 4. groundwater Water leaves the lake system from: 1. discharge from the individual lakes’ outlet channel 2. evaporation 3. groundwater There are no discharge gages in the watershed to measure water inputs and the limited scope of this study did not allow us to determine quantitatively annual water inputs or outputs. Therefore we must estimate the water budget for lakes from other records.
• Direct precipitation to the lakes can be calculated from mean annual precipitation falling
Oliver, Olin, and Martin lakes Diagnostic Study October 16, 2009 LaGrange County, Indiana
File No.070874.00 Page 133
directly on the lakes’ surface. • Runoff from the lakes’ watershed can be estimated by applying runoff coefficients. A
runoff coefficient refers to the percentage of precipitation that occurs as surface runoff, as opposed to that which soaks into the ground. Runoff coefficients may be estimated by comparing discharge from a nearby gaged watershed of similar land and topographic features, to the total amount of precipitation falling on that watershed. The nearest gaged watershed is a U.S.G.S. gaging station on the Elkhart River at Cosperville, Indiana (USGS, 2008). The 44-year (1973–2007) mean annual discharge from this watershed is 137 cfs (cubic feet per second). With a mean annual precipitation for LaGrange County of 37 inches (Clark, 1980), this means that on average, 35.4 % of the rainfall falling on this watershed runs off on the land surface.
• There exist no groundwater records for the lake so we must assume that groundwater inputs equal outputs.
• We can estimate evaporation losses by applying evaporation rate data to the lakes. Evaporation rates are determined at six sites around Indiana by the National Oceanic and Atmospheric Administration (NOAA). The nearest site to the study lakes is located in Wanatah (Porter County), Indiana. Annual evaporation from a ‘standard pan’ at the Wanatah site averaged 41.8 inches per year between 2003-2005 (NOAA 2005). Because evaporation from the standard pan overestimates evaporation from a lake by about 30%, we correct the evaporation rate by this percentage, which yields an estimated evaporation rate from the lake surface of 29.3 inches per year. Multiplying this rate times the surface area of each lake yields an estimated volume of evaporative water loss from the study lakes.
The water budgets for Olin, Oliver, and Martin lakes, based on the assumptions discussed above, are shown in Tables 53 - 55, summarized in Table 56, and illustrated in Figure 77. For example, when we divide the volume of water flowing out of Olin Lake by the lake’s volume, we get a hydraulic residence time of 1.05 years (383 days). This means that on average, water entering the lake stays in the lake for 383 days before it leaves. Of the three lakes, Oliver Lake had the longest hydraulic residence time (1.94 years) and Martin Lake had the shortest (0.28 years). In a study of 95 north temperate lakes in the U.S., the mean hydraulic residence time for the lakes was 2.12 years (Reckhow, 1979). The short hydraulic residence time for Martin Lake is due to its large watershed compared to its small lake area. There are more than 110 acres of watershed land draining into each acre of Martin Lake. Most glacial lakes have a watershed area to lake surface area ratio of around 10:1. Martin Lake’s ratio is more typical of reservoirs, where the watershed area to reservoir surface area typically ranges between 100:1 and 300:1 (Vant, 1987).
Table 53. Water Budget Calculations for Olin Lake.
Watershed Olin Lake Direct Watershed size (ac) 457 Total Watershed Size (ac) 3546 Mean Watershed Runoff (ac-ft/yr) 499 Lake Volume (ac-ft) 3949
Oliver, Olin, and Martin lakes Diagnostic Study October 16, 2009 LaGrange County, Indiana
File No.070874.00 Page 134
Mean annual Q (cfs) 137 Mean annual Q (ac-ft/yr) 99183 Mean ppt (in/yr) 37 Mean watershed ppt (ac-ft/yr) 280213 Watershed C 0.354 Pan evaporation (in/yr) 28.05 Pan evaporation coefficient 0.70 Lake Surface Area (acres) 101 Estimated lake evaporation (ac-ft) 165 Direct precipitation to lake (ac-ft) 311 = input data = output data Water Budget Summary Direct precipitation to lake (ac-ft) 311 Runoff from watershed (ac-ft) 499 Discharge from Martin Lake (ac-ft) 3126 Evaporation (ac-ft) 165 TOTAL LAKE OUTPUT (ac-ft) 3771 Hydraulic Residence Time (yr) 1.05 Total Watershed Area:Lake Area 35.1
Table 54. Water Budget Calculations for Oliver Lake.
Watershed Oliver Lake Direct Watershed Size (ac) 3317 Total Watershed Size 6863 Mean Watershed Runoff (ac-ft/yr) 3620 Lake Volume (ac-ft) 15416
Closest gaged stream Elkhart R. @ Cosperville
Stream watershed (mi2) 142 Stream watershed (acres) 90880 Mean annual Q (cfs) 137 Mean annual Q (ac-ft/yr) 99183 Mean ppt (in/yr) 37 Mean watershed ppt (ac-ft/yr) 280213 Watershed C 0.354 Pan evaporation (in/yr) 28.05 Pan evaporation coefficient 0.70 Lake Surface Area (acres) 392 Estimated lake evaporation (ac-ft) 641 Direct precipitation to lake (ac-ft) 1209
Oliver, Olin, and Martin lakes Diagnostic Study October 16, 2009 LaGrange County, Indiana
File No.070874.00 Page 135
= input data = output data Water Budget Summary Direct precipitation to lake (ac-ft) 1209 Runoff from watershed (ac-ft) 3620 Discharge from Olin Lake (ac-ft) 3771 Evaporation (ac-ft) 641 TOTAL LAKE OUTPUT (ac-ft) 7959 Hydraulic Residence Time (yr) 1.94 Total Watershed Area:Lake Area 17.5
Table 55. Water Budget Calculations for Martin Lake.
Watershed Martin Lake Watershed size (ac) 2831 Mean Watershed Runoff (ac-ft/yr) 3089 Lake Volume (ac-ft) 885
Closest gaged stream Elkhart R. @ Cosperville
Stream watershed (mi2) 142 Stream watershed (acres) 90880 Mean annual Q (cfs) 137 Mean annual Q (ac-ft/yr) 99183 Mean ppt (in/yr) 37 Mean watershed ppt (ac-ft/yr) 280213 Watershed C 0.354 Pan evaporation (in/yr) 28.05 Pan evaporation coefficient 0.70 Lake Surface Area (acres) 26 Estimated lake evaporation (ac-ft) 42 Direct precipitation to lake (ac-ft) 79 = input data = output data Water Budget Summary Direct precipitation to lake (ac-ft) 79 Runoff from watershed (ac-ft) 3089 Evaporation (ac-ft) 42 TOTAL LAKE OUTPUT (ac-ft) 3126 Hydraulic Residence Time (yr) 0.28 Watershed Area:Lake Area 110.6
Oliver, Olin, and Martin lakes Diagnostic Study October 16, 2009 LaGrange County, Indiana
File No.070874.00 Page 136
Table 56. Water Budget Summaries for Olin, Oliver, and Martin lakes. LAKE VOLUME (V,
in acre-ft)
DISCHARGE (Q) (in acre-feet per yr)
RESIDENCE TIME (V/Q) (in years)
Watershed Area: Lake Area (rounded)
Olin 3949 3771 1.05 35:1 Oliver 15416 7959 1.94 18:1 Martin 885 3126 0.28 111:1
Figure 77 illustrates the relationships of the various water budget components (direct precipitation, evaporation, runoff, and lake discharge) among the four lakes. Oliver Lake has the largest amount of runoff [3,620 acre-feet (447 ha-m)] because its direct watershed is so large. Martin Lake has an estimated 3,089 acre-feet (381 ha-m) of direct runoff, much of which flows into Olin Lake and then into Oliver. A total of 7,959 acre-feet (982 ha-m) of water is discharged from the three-lake system through the Oliver Lake outlet annually, on average.
Oliver, Olin, and Martin lakes Diagnostic Study October 16, 2009 LaGrange County, Indiana
File No.070874.00 Page 137
KEY Lake Discharge Evaporation
Precipitation Land Runoff
**all units are acre-feet
Figure 77. Water Budget Flow Chart for the Olin, Oliver and Martin Watershed. 5.2 Phosphorus Budget Since phosphorus is the limiting nutrient in Olin, Oliver and Martin lakes, we have used a phosphorus model to estimate the dynamics of this important nutrient. With its role as the limiting nutrient, phosphorus should be the target of management activities to lower the biological productivity of these lakes. The limited scope of this LARE study did not allow us to determine phosphorus inputs and outputs outright. Therefore, we have used a standard phosphorus model to estimate the phosphorus budget. Reckhow et al. (1979) compiled phosphorus loss rates from various land use activities as determined by a number of different studies, and from this, they calculated phosphorus export coefficients for various land uses. We used mid-range estimates of these phosphorus export coefficient values for all watershed land uses (Table 57). Phosphorus export coefficients are expressed as kilograms of phosphorus lost per hectare of land per year. The export coefficient for a particular land use was multiplied by the area of land in that land use
Olin
3771 3126
Oliver
Martin
42 79
3089
499
3620
165 311
641 1209
7959
Oliver, Olin, and Martin lakes Diagnostic Study October 16, 2009 LaGrange County, Indiana
File No.070874.00 Page 138
category to derive an estimate of annual phosphorus export (as kg/year) for each land use (Table 57). Table 57. Phosphorus Export Coefficients (units are kg/hectare except the septic category, which are kg/capita-yr).
Estimate Range Agriculture Forest Precipitation Urban Septic
Source: Reckhow and Simpson (1980) We estimated direct phosphorus input via precipitation to the lakes by multiplying mean annual precipitation in LaGrange County (0.9 m/yr) times the surface area of the lake times a typical phosphorus concentration in Indiana precipitation (0.03 mg/L). For septic system inputs, we multiplied the number of permanent homes on the lake times an average of 3 residents per home to calculate per capita years. Olin Lake has no shoreline septic systems whereas both Oliver and Martin have septic systems serving shoreline homes that could leach phosphorus and other contaminants into the lake. For both of these lakes, we assumed that all homes on septic were occupied year-round. We used a mid-range phosphorus export of 0.5 kg/capita-yr and a soil retention coefficient of 0.75 (this assumes that the drain field retains 75% of the phosphorus applied to it).
The results, shown in Table 58, yielded an estimated 1,835 kg (4045 lbs) of phosphorus loading to Oliver Lake from its watershed, septic systems, from precipitation, and from the Olin Lake outlet annually. Total phosphorus loading to Olin and Martin lakes was estimated to be 250.6 kg/yr (553 lbs/yr) and 877.1 kg/yr (1933 lbs/yr), respectively. Fifty-two percent of Olin Lake’s total phosphorus loading annually is estimated to be from the Martin Lake outlet. The greatest estimated source of phosphorus loading to Oliver Lake is from the Olin Lake inlet – nearly 50% of total watershed loading. Row crop agriculture contributes 28.5% of total watershed loading and is the greatest source of phosphorus loading from Oliver Lake’s immediate watershed. Row crops were estimated to be the greatest direct watershed source of phosphorus loading to Olin (34.4%) and Martin (80.9%) lakes. Table 58. Estimated External Phosphorus Loads (kg/yr) from Various Sources.
Watershed
Watershed Runoff
Precip.
Septic
From Lakes Upstream
TOTAL
Olin1 108.5 11.1 0 131.0a 250.6 Oliver2 815.9 42.9 64.5 911.7b 1835.0 Martin 866.8 2.9 7.5 NA 877.1
aDischarge from Martin Lake bDischarge from Olin Lake
We can examine the relationships among the primary parameters that affect a lake’s phosphorus concentration by using a phosphorus-loading model such as the widely used Vollenweider (1975) model. Vollenweider’s empirical model says that the concentration of phosphorus ([P]) in a lake is proportional to the areal phosphorus loading (L, in g/m2 lake area - year), and inversely proportional to the product of mean depth ( z ) and hydraulic flushing rate (ρ) plus a constant (10):
Oliver, Olin, and Martin lakes Diagnostic Study October 16, 2009 LaGrange County, Indiana
File No.070874.00 Page 139
L [P] = 10+ ρz
During our July 23, 2008 sampling of Oliver Lake, the mean volume weighted phosphorus concentration in the lake was 0.131 mg/L. Now it is useful to ask the question, “How much phosphorus loading from all sources is required to yield a mean phosphorus concentration of 0.131 mg/L in Oliver Lake?” By plugging this mean concentration along with the mean depth and flushing rate into Vollenweider’s phosphorus loading model and solving for L, we get an areal phosphorus loading rate (mass of phosphorus per unit area of lake) of 2.127 g/m2-yr. This means that in order to get a mean phosphorus concentration of 0.131 mg/L in Oliver Lake, a total of 2.127 grams of phosphorus must be delivered to each square meter of lake surface area per year.
Total phosphorus loading (LT) is composed of external phosphorus loading (LE) from outside the lake (watershed, septics, and precipitation) and internal phosphorus loading (LI). Since LT = 2.127 g/m2-yr and LE = 1.157 g/m2-yr (estimated from the watershed loading in Table 59), then internal phosphorus loading (LI) equals 0.970 g/m2-yr. Thus, internal loading accounts for about 46% of total phosphorus loading to Oliver Lake.
How reasonable is this conclusion that internal phosphorus loading accounts for 46% of total phosphorus loading to Oliver Lake? Where does this internal phosphorus come from? There is evidence in Oliver Lake that soluble phosphorus is being released from the sediments during periods of anoxia. For example, the concentration of soluble phosphorus in Oliver’s hypolimnion on 7/23/08 was 20.6 times higher than concentrations in the epilimnion (0.206 mg/L vs. 0.010 mg/L). The source of this hypolimnetic total phosphorus is primarily internal loading in most lakes. This internal loading can be a major source of phosphorus in many productive lakes. Our modeled estimate of 45.6% of annual phosphorus loading originating from internal sources is expected, given the large difference between summertime epilimnetic and hypolimnetic phosphorus concentrations.
Likewise, we ran the Vollenweider phosphorus loading model for Olin and Martin lakes. Results for all three lakes are included in Table 59. Note that total loading to Olin Lake includes phosphorus in the discharge from the Martin Lake outlet and total phosphorus loading to Oliver Lake includes phosphorus in the discharge from Olin Lake. For purposes of modeling, we assumed that 100% of the phosphorus discharged from these lakes was delivered to the downstream lake. It is likely that some small amount was utilized by stream biota and processes before it reached Olin and then Oliver Lake. There are no reliable ways to calculate this. Table 59. Areal Phosphorus Loading Rates Determined from Models
1estimated from Vollenweider’s lake response model 2estimated from Reckhow’s phosphorus export model and precipitation estimates 3includes phosphorus discharge from Olin Lake 4includes phosphorus discharge from Martin Lake
Oliver, Olin, and Martin lakes Diagnostic Study October 16, 2009 LaGrange County, Indiana
File No.070874.00 Page 140
From these data, we see an apparent anomaly with Martin Lake. The phosphorus export model estimated much more phosphorus delivered to Martin Lake (8.33 g/m2-yr) than is accounted for by the phosphorus concentration in the lake (1.608 g/m2-yr), hence the negative value for internal loading. Where did all of this excess phosphorus go? The sediments of most lakes serve as sinks for nutrients, particulates, and other materials that settle down out of the water column due to gravity. In lakes where this happens, we often see significant rates of internal phosphorus release. We don’t see this in Martin Lake, at least not on 7/23/08 when we collected the water samples. On the day we sampled, the hypolimnetic soluble phosphorus concentration was the same as the epilimnetic soluble phosphorus concentration (0.010 mg/L). This suggests no internal phosphorus loading. In past years’ data for Martin Lake, we see little evidence of internal phosphorus loading either (Table 60). Another possibility is that given the rapid hydraulic flushing rate (nearly 4 lake volumes per year) for Martin Lake, much of this excess phosphorus likely gets washed into Olin Lake, especially during storm events. However, our 7/23/08 sampling date did not closely follow a storm event so we measured only “normal” concentrations of phosphorus in Martin Lake. We suspect that storm event sampling on Martin Lake would yield different results. Table 60. Little Evidence of Internal Phosphorus Loading in Martin Lake Date Epilimnetic SRP (mg/L) Hypolimnetic SRP (mg/L) 7/19/93 0.003 0.005 7/11/00 0.008 0.015 7/07/03 0.010 0.010 7/23/08 0.010 0.010 The significance of areal phosphorus loading rates is better illustrated in Figure 78 in which areal phosphorus loading is plotted against the product of mean depth times flushing rate. Overlain on this graph is a curve, based on Vollenweider’s model, which represent an acceptable loading rate that yields a phosphorus concentration in lake water of 30 μg/L (0.03 mg/L). The areal phosphorus loading rate for each lake is well above the acceptable line.
This figure can also be used to evaluate management needs. For example, areal phosphorus loading to Oliver Lake would have to be reduced from 2.13 g/m2-yr to 0.49 g/m2-yr (the downward vertical intercept with the line) to yield a mean lake water concentration of 0.030 mg/L. This represents a reduction in areal phosphorus loading of 1.64 g/m2-yr to the lake (77.2%), which is equivalent to a total phosphorus mass loading reduction of 2,604 kg P/yr (5741 lbs P/yr). Similar calculations are shown in Table 61 for the other lakes.
Table 61. Phosphorus Reduction Required to Achieve Acceptable Phosphorus Loading Rate and a Mean Lake Concentration of 0.03 mg/L. Lake Current Total Areal P
Loading (g/m2-yr) Acceptable Areal P Loading (g/m2-yr)
Reduction Needed (kg P/yr and %)
Olin 4.19 0.64 1450 (84.7) Oliver 2.13 0.49 2604 (77.2)
Martin 8.34 1.41 729 (430.7)
Oliver, Olin, and Martin lakes Diagnostic Study October 16, 2009 LaGrange County, Indiana
File No.070874.00 Page 141
Figure 78. Phosphorus loadings to Olin, Oliver and Martin lakes compared to acceptable loadings determined from Vollenweider’s model. The dark line represents the upper limit for acceptable loading. Eliminating internal phosphorus loading alone will not meet the reduction needed to achieve acceptable phosphorus loading rates to these lakes. A significant reduction in watershed phosphorus loading will be required to reduce the trophic state of Olin, Oliver and Martin lakes. 6.0 MANAGEMENT The preceding sections of this report detailing historic and current condition of Oliver, Olin, and Martin lakes indicate that the lakes possess good water quality in comparison to other lakes in the region and throughout the state. Oliver Lake has good water clarity in the spring with a Secchi disk depth of 14.5 feet (4.4 m), but it declines during the summer survey to 6.5 feet (2.0 m). Olin Lake also has good water clarity in the spring, with a Secchi disk depth of 10 feet (3.0 m), but declines to 5 feet (1.5 m) in the summer. Martin Lake follows the same trend with a Secchi disk depth of 11.5 feet (3.5 m) in the spring and 7.5 feet (2.3 m) in the summer. Each lake’s total phosphorus concentration place the lake in the mesotrophic category based on Carlson’s TSI. The lakes’ chlorophyll a concentration, Indiana TSI score, and Secchi disk depth suggest all three lakes are either mesotrophic or slightly oligotrophic, in nature. Each lake has a healthy biological community that is an indication of long-term good water quality. Oliver Lake supports a moderately diverse submergent plant community including eight pondweed species, northern watermilfoil, variable-leaf watermilfoil, and chara. Additionally, the state listed species, northeastern bladderwort, was also present in Oliver Lake during the 2008 assessment. These species are all indicators of good water quality and are found in several places throughout the lake. Olin Lake also contains a moderately diverse submergent plant community including seven pondweed species, variable-leaf watermilfoil, spiny naiad, eel grass, and water star grass. Martin Lake contains less than a dozen submergent plant species, which include the native species coontail, Illinois pondweed, sago pondweed, large-leaf pondweed,
Oliver, Olin, and Martin lakes Diagnostic Study October 16, 2009 LaGrange County, Indiana
File No.070874.00 Page 142
common water weed, southern naiad, white-stem pondweed, chara, and spiny naiad. Oliver and Olin lakes represent unique inland fisheries in Indiana. Oliver, Olin, and Martin lakes historically exhibited good water quality and recent samplings indicate that water quality remains good. Although by most of the trophic classifications, the lakes are oligotrophic to mesotrophic, the trend may not continue in the future without continued watershed management. There is some evidence that the internal loading of phosphorus in Oliver and Olin lakes represents a significant potential for algal growth under the right conditions. Compounded with external phosphorus loading from the watershed and the lakes could turn eutrophic and have issues such as nuisance algal blooms and large areas of the water column that become anoxic. As discussed in Section 5 (Modeling), external phosphorus loading from the watershed needs be reduced in conjunction with a reduction in internal phosphorus loading. Given the bathymetry of each of the lakes, it may be easier to reduce external loading through proper watershed management than to reduce internal loading through dredging or alum treatments. Detailed below are areas of management both within the watersheds and within the lakes that can be used to address future concerns. 6.1 Public Outreach during the Diagnostic Study Three public meetings were held during the process of the study. One occurred at the beginning of the study (April 26, 2008) to introduce the project and identify concerns of the 14 attendees at the meeting. Questions included topics on water clarity/quality, fishing, recreation, and sedimentation. A second meeting attended by 28 people was held on October 4, 2008 and was used to review the results of the aquatic plant survey. After reviewing the plant survey results, a discussion followed where land residents identified their concerns over beginning an aquatic plant treatment program and its effect on the lake, how to control invasive species like purple loosestrife, and a willingness to use the Association’s website as an outreach tool for aquatic plant education. As part of the aquatic plant survey, a lake user survey was distributed among lake residents. Results of the lake use survey can be found in Section 4.7 and Appendix F. A final public meeting was held June 20, 2009 to discuss the results of the diagnostic study. Over 30 people were in attendance and a discussion followed about the future management actions including pursuing funding for feasibility studies for water quality improvement projects and developing an aquatic plant management plan. Information including meetings notes and attendant lists can be found in Appendix F at the back of the lake survey results. The Association maintains a website and appears to be a good mechanism for distributing information about the lakes and watershed. At each public meeting, comments were made by attendees for requesting additional information to be put on the website and that they used it to learn about events and other things around the lake. Information handouts, training events, meeting dates, and lake updates could be posted on the website. 6.2 Historic Watershed Management A tour of the present day watershed conditions reveals evidence that there have been attempts in the past to actively manage the Oliver, Olin, and Martin lakes watershed. During the development of the diagnostic study, a watershed tour was performed by JFNew staff. (The results will be discussed more specifically in Section 6.2). There were a minimum of five locations where existing structures had been installed to slow runoff or reduce sedimentation. Examples of these include concrete drop structures to reduce erosion or grassed waterways to filter stormwater runoff. Based on the condition and materials used for these projects, they were
Oliver, Olin, and Martin lakes Diagnostic Study October 16, 2009 LaGrange County, Indiana
File No.070874.00 Page 143
constructed several decades ago, likely by the LaGrange County Soil and Water Conservation District or the Indiana Soil Conservation Service. 6.3 Watershed Management JFNew completed a tour of the watershed on April 4, 2008. The majority of the tour was conducted by driving the watershed roads and stopping and walking in areas of interest including the IDNR Nature Preserve adjacent to Olin Lake. The tour resulted in the identification of 23 potential watershed management projects ranging from simple grassed filter strips to wetland creation (Figure 79). Table 62 and the proceeding subsections illustrate how the OOM lakes watershed can be managed to maintain and improve water quality. A more detailed description of each site including location and suggested watershed management action can be found in Appendix G.
Figure 79. Areas in the OOM lakes watershed that would benefit from watershed management technique installation.
Oliver, Olin, and Martin lakes Diagnostic Study October 16, 2009 LaGrange County, Indiana
File No.070874.00 Page 144
Table 62. Results of the OOM lakes watershed tour conducted April 4, 2008. Site
Number Watershed-
Subwatershed Description Management Area
Water Quality Issue
1 Martin -Truman Flint Ditch
Pasture adjacent to ditch with a narrow buffer. Could use a wider buffer.
Agricultural practices
Nutrients, sediment
2 Martin -Truman Flint Ditch
Potential wetland restoration site Wetland
restoration
Nutrients, sediment,
stream channels
3 Martin -Truman Flint Ditch
Gravel from road is entering stream. Pave road or create filtration swales
Erosion control Sediment
4
Martin -Truman Flint Ditch
Encourage no-till practice or grassed waterway. Ditch stabilization on south side of the road.
Agricultural practices,
Stream channel management
Sediment
5 Martin -Truman Flint Ditch
Stabilize ditch banks. Stream channel management Sediment
6
Martin -Truman Flint Ditch
Remove two berms that are adjacent to the ditch to allow for greater access to floodplain.
Stream channel management Sediment
7 Martin - Unnamed Trib
Replace failed SCS drop structure.
Agricultural practices Sediment
8 Martin - Unnamed Trib
Reconstruct existing grassed waterways
Agricultural practices Sediment
9 Martin - Direct Drainage
Create a treatment swale for runoff from a pasture before stormwater enters ditch.
Agricultural practices Nutrients
10 Martin - Direct Drainage
Create two small wetlands to treat stormwater runoff from adjacent pasture.
Wetland restoration Nutrients
11 Olin - Direct Drainage
Stabilize eroding ravine in IDNR Nature Preserve
Stream channel management Sediment
12 Olin - Direct Drainage
Stabilize eroding ravine in IDNR Nature Preserve
Stream channel management Sediment
13 Oliver - Unnamed Trib
Repair existing SCS drop structure and reconstruct grassed waterway.
Agricultural practices Sediment
14
Oliver - Unnamed Trib
Extend an existing tile line to CR 450 S and develop alternative watering station for cattle.
Agricultural practices Nutrients
15 Oliver - Bert Hart Ditch
Restore natural channels between road crossing and Oliver Lake.
Stream channel management Sediment
16 Oliver - Direct Drainage
Develop a wide buffer or consider placing field in CRP.
Agricultural practices Sediment
17 Oliver - Direct Drainage
Create a wetland filter on the north side of CR 450 S.
Wetland restoration Nutrients
18
Oliver - Direct Drainage
Install erosion control on eroding embankments at old sand mining operation. Erosion control Sediment
Oliver, Olin, and Martin lakes Diagnostic Study October 16, 2009 LaGrange County, Indiana
File No.070874.00 Page 145
Site Number
Watershed-Subwatershed Description Management
Area Water Quality
Issue
19 Oliver - Dove Creek Control grade in roadside ditch. Restore a channel.
Stream channel management Sediment
20 Oliver - Dove Creek Extend buffers along an east-
west ditch adjacent to a no-till field.
Agricultural practices Sediment
21 Oliver - Dove Creek Repair existing SCS drop structure.
Agricultural practices Sediment
22 Oliver - Dove Creek Repair an existing tile riser
and tile outlet that has been damaged by livestock.
Agricultural practices Sediment
23 Oliver - Dove Creek Develop a comprehensive
nutrient management plan with farmer.
Agricultural practices Nutrients
6.3.1 Stream Channel Management Most streams today in an agriculturally-dominated landscape like the OOM lakes watershed have been and are currently altered. Drainage management and land cover conversion results in streams that have increased grade, restricted access to adjacent floodplains, and increased sediment loads. The end result is streams with a reduction in their capacity to perform natural functions that provide aquatic habitat and promote water quality within the stream and to downstream aquatic resources. Typically, the most common issues related to streams are eroding banks, loss or degradation of habitat, and increases in the amount of water being conveyed during storm events. Sediment that is derived from the watershed and carried by streams or sediment resulting from bank erosion can be detrimental to the OOM lakes chain. It has the potential to impair the lakes via several mechanisms. Of greatest concern to the residents is the impact sediment can have on the lake’s water clarity. Sediment from actively eroding stream channels contributes to this problem. The sediment also reduces lake depth, which can affect swimming and other recreational uses of the lake. Lastly, nutrients attached to sediment that reaches the lake can promote algae and rooted plant growth, which in turn can impact recreational use of the lake. To reduce the impact of sediment on the streams and drainages of the OOM lakes watershed, as well as the lakes themselves, a multi-pronged approach is required. The first prong is watershed management to reduce the amount of sediment entering streams from the watershed and/or reduce the volume and velocity of stormwater for any given precipitation event. This can be accomplished by Conservation Reserve Program enrollment, wetland restoration, conservation tillage, and other alternative stormwater management. Each topic is covered in greater detail in the proceeding sections. The second prong is to reduce sediment derived from actively eroding streambanks by directly stabilizing the banks, restoring the channel, increasing access to the floodplain, or reducing stream gradient. There are six locations identified in the watershed tour where one or more of the approaches listed above would address a water quality issue. 6.3.2 Conservation Reserve Program Some landowners in the OOM lakes watershed are currently enrolled in the Conservation Reserve Program (CRP), but increased participation in the program would benefit the lake’s health. The CRP is a cost-share program designed to encourage landowners to remove a portion of their land from agriculture and establish vegetation on the land in an effort to reduce
Oliver, Olin, and Martin lakes Diagnostic Study October 16, 2009 LaGrange County, Indiana
File No.070874.00 Page 146
soil erosion, improve water quality, and enhance wildlife habitat. The CRP targets highly erodible land or land considered to be environmentally sensitive. The CRP provides funding for a wide array of conservation techniques including set-asides, filter strips (herbaceous), riparian buffer strips (woody), grassed waterways, and windbreaks. These techniques are particularly appropriate along surface drainages; however, they do not account for pollutants transported to the lake via subsurface drainage tiles. Land that is removed from agricultural production and planted with herbaceous or woody vegetation benefits the health of aquatic ecosystems located down gradient of that property in a variety of ways. Woody and/or herbaceous vegetation on CRP land stabilizes the soil on the property, preventing its release off site. Vegetation on CRP land can also filter any runoff reaching it. More importantly, land set aside and planted to prairie or a multi-layer community (i.e. herbaceous, shrub, and tree layers) can help restore a watershed’s natural hydrology. Rainwater infiltrates into the soil more readily on land covered with grasses and trees compared to land supporting row crops. This reduces the erosive potential of rain and decreases the volume of runoff. Multi-layer vegetative communities intercept rainwater at different levels, further reducing the erosive potential of rain and volume of runoff. Given the ecological benefits that land enrolled in CRP provides, it is not surprising that removing land from production and planting it with vegetation has a positive impact on water quality. In a review of Indiana lakes sampled from 1989 to 1993 for the Indiana Clean Lakes Program, Jones (1996) showed that lakes within ecoregions reporting higher percentages of cropland in CRP had lower mean trophic state index (TSI) scores. A lower TSI score is indicative of lower productivity and better water quality. Areas mapped in a highly erodible soil unit and utilized for agricultural production are good candidates for enrollment in CRP. Evidence of existing grassed filter strips or pipe drop structures indicate at least some motivation of property owners to participate in programs like CRP. Further, there may be other areas in the watershed that were not observable from the road during the windshield tour that may warrant consideration for enrollment in CRP. 6.3.3 Conservation Tillage Removing land from agricultural production is not always feasible. Conservation tillage methods should be utilized on highly erodible agricultural land where removing land from production is not an option. Conservation tillage refers to several different tillage methods or systems that leave at least 30% of the soil covered with crop residue after planting (Holdren et al., 2001). Tillage methods encompassed by the phrase “conservation tillage” include no-till, mulch-till, and ridge-till. The crop residue that remains on the landscape helps reduce soil erosion and runoff water volume. Several researchers have demonstrated the benefits of conservation tillage in reducing pollutant loading to streams and lakes. A comprehensive comparison of tillage systems showed that no-till results in 70% less herbicide runoff, 93% less erosion, and 69% less water runoff volume when compared to conventional tillage (Conservation Technology Information Center, 2000). Reductions in pesticide loading have also been reported (Olem and Flock, 1990). In his review of Indiana lakes, Jones (1996) documented lower mean lake trophic state index scores in ecoregions with higher percentages of conservation tillage. A lower TSI score is indicative of lower productivity and better water quality. Although an evaluation of the exact percentage of watershed crop land on which producers were utilizing conservation tillage methods was beyond the scope of this study, use of
Oliver, Olin, and Martin lakes Diagnostic Study October 16, 2009 LaGrange County, Indiana
File No.070874.00 Page 147
conservation tillage on some of the agricultural land was noted during the windshield tour of the watershed. County-wide estimates from tillage transect data may serve as a reasonable estimate of the amount of crop land on which producers are utilizing conservation tillage methods in the OOM lakes watershed. County-wide tillage transect data for LaGrange County provides an estimate for the portion of cropland in conservation tillage for the OOM lakes watershed. In LaGrange County, soybean producers utilize no-till methods on 64% of soybean fields and some form of reduced tillage on 92% of soybean fields (IDNR, 2004b). LaGrange County corn producers used no-till methods on 14% of corn fields and some form of reduced tillage on 38% of corn fields in production (IDNR, 2004a). The percentages of fields on which no-till methods were used in LaGrange County were above the statewide median percentages for soybean production, but below the state average for corn production. Continued use of conservation tillage, particularly no-till conservation tillage, is recommended in the OOM lakes watershed. The areas targeted for CRP implementation noted above should be farmed using no-till methods if they are not already doing so and removal of the land from production is not a feasible option. 6.3.4 Wetland Restoration Visual observation and historical records indicate at least a portion of the OOM lakes watershed has been altered to increase its drainage capacity. Riser tiles in low spots on the landscape and tile outlets along the waterways in the OOM lakes watershed confirm the fact that the landscape has been hydrologically altered. This hydrological alteration and subsequent loss of wetlands has implications for the watershed’s water quality. Wetlands serve a vital role storing water and recharging the groundwater. When wetlands are drained with tiles, the stormwater reaching these wetlands is directed immediately to nearby ditches and streams. This increases the peak flow velocities and volumes in the ditch. The increase in flow velocities and volumes can in turn lead to increased stream bed and bank erosion, ultimately increasing sediment delivery to downstream water bodies. Wetlands also serve as nutrient sinks at times. The loss of wetlands can increase pollutant loads reaching nearby streams and downstream waterbodies. Restoring wetlands in the OOM lakes watershed could return many of the functions that were lost when these wetlands were drained. Figure 79 shows the locations where wetland restoration is recommended. While other areas of the watershed could be restored to wetland conditions, the areas shown in Figure 79 were selected because they are areas where the restoration would have a targeted and direct impact on water quality. Current research suggests that the installation of wetlands can remove more than 80% of sediment and approximately 45% of nutrients (Metropolitan Washington Council of Governments, 1992; Claytor and Schueler, 1996; and Winer, 2000). 6.3.5 Manure Management Nutrient management has been the focus of agricultural research in many parts of the country. Studies have shown that every year about 15% of the applied nitrogen, 68% of the residual nitrogen in the non-root zone layer of the soil, and 20% of the residual nitrogen in the root zone layer are leached to the groundwater (Yadav, 1997). To address this concern, the Penn State Cooperative Extension Service designed a nutrient management plan based on: 1) crop yield goals; 2) soil type; 3) methods of manure and commercial fertilizer application; 4) nitrogen concentrations in soils; 5) nitrogen concentrations in manure to be used for fertilizer; and 6) crop rotations (Hall and Risser, 1993). With this plan in place: 1) fertilizer application as manure and commercial fertilizer decreased 33% from 22,700 lbs/year to 15,175 lbs/year; 2) nitrogen loads in groundwater decreased 30% from 292 lbs of nitrogen per 1,000,000 gallons of groundwater
Oliver, Olin, and Martin lakes Diagnostic Study October 16, 2009 LaGrange County, Indiana
File No.070874.00 Page 148
to 203 lbs per 1,000,000 gallons; and 3) the load of nitrogen discharged in groundwater was reduced by 11,000 lbs for the site over a three-year period (70 lbs/ac/yr). In special areas of environmental concern, such as fields that border streams and other waterbodies, fertilizer setbacks should be utilized. Setbacks are strips or borders where fertilizer is either not applied or applied in smaller quantities. Fertilizers should not be applied directly next to streams and certainly not in them. According to the LaGrange County Purdue Cooperative Extension Agency, fertilizer setbacks are accomplished with filter strips; most farmers are conscientious of application near tile drains and open ditch areas. Farmers are typically extremely aware of fertilizer application near streams and drainage tiles. Producers on highly erodible land in some areas of concern tend to be more conscientious with respect to fertilizer application; many of these producers are diligently following their production plans and continue to maintain highly erodible field in hay or wheat and avoid tilling these fields in the fall. Though not a nutrient, E. coli bacteria contamination of waterways is an indirect effect of applying animal waste as fertilizer. E. coli and other bacteria from the intestinal tracts of warm blooded animals can cause gastroenteritis in humans and pets. Symptoms of gastroenteritis include: nausea, vomiting, stomachache, diarrhea, headache, and fever. Due to high E. coli counts, about 81% of the assessed waters in Indiana did not support “full body contact recreation” in 1994-1995 (IDEM, 1995). Of over 800 samples collected in the St. Joseph River (Ft. Wayne) in northern Indiana during 1996-1997, the average of all samples was 2,000 colonies/100 ml, or about 16 times the maximum allowable level (Frankenberger, 2001). Samples collected near 19 USGS gauging stations in the St. Joseph River (South Bend) Watershed during 2002 contained E. coli concentrations of 7-4,600 colonies/100 ml. The USGS determined that 33-95% of these colonies were to be pathogenic strains (O157:H7) of E. coli (Duris et al., 2003). During the present study, all of streams sampled in the OOM lakes watershed were in violation during either the base or the storm flow sampling of the Indiana state standard; concentrations ranged from 64-9,200 colonies/100 ml (Table 15). To prevent manure from entering tiles, ditches, and streams, producers can: 1) apply manure at optimal times for plant uptake; 2) apply manure when potential for plant uptake is high and runoff is low; 3) inject or incorporate manure to reduce runoff potential; 4) use filter strips; and 5) use setbacks from surface inlets to tile lines. 6.3.6 Sewer System Connection/Septic System Replacement The LaGrange County Regional Sewer District operates a sewer system that treats wastewater from all residences adjacent to Oliver and Martin Lake's shoreline. Other residents throughout the watershed utilize septic systems. Using Figure 20, areas that have limited capacity for septic systems should be monitored. If the opportunity presents itself, the OMLCIA should encourage property owners to update their systems. Property owners cannot be forced to upgrade or modify systems or hook on to the Regional Sewer District lines. At this time, the OMLCIA should work with the LaGrange County Health Department to determine if there are any additional actions that the OMCLIA can take or if there is any assistance that they may offer to the Health Department to monitor septic system functioning within the OOM lakes watershed. 6.3.7 Individual Property Management Individual property owners can take several actions to maintain or improve Oliver and Martin lakes existing water quality. First, shoreline landowners should seriously consider re-landscaping lakeside properties to protect their lake. Many of the homes on Oliver and Martin lakes have maintained turf grass lawns that extend to the lake’s edge. Runoff from residential lawns can be very high in phosphorus. In a study on residential areas in Madison, Wisconsin, Bannerman et al. (1992) found extremely high total phosphorus concentrations in stormwater
Oliver, Olin, and Martin lakes Diagnostic Study October 16, 2009 LaGrange County, Indiana
File No.070874.00 Page 149
samples from residential lawns. The average phosphorus concentration of runoff water from residential lawns was nearly 100 times the concentration at which algae blooms are expected in lake water. While some dilution occurs as runoff water enters the lake, this source of phosphorus is not insignificant. Other researchers have found similarly high total phosphorus concentrations in lawn runoff water (Steuer et al., 1997). The ideal way to re-landscape a shoreline is to replant as much of the shoreline as possible with native shoreline species. Rushes, sedges, pickerel weed, arrowhead, and blue-flag iris are all common species native to northeastern lake margins. These species provide an aesthetically attractive, low profile community that will not interfere with views of the lake. Plantings can even occur in front of existing seawalls. Bulrushes and taller emergents are recommended for this. On drier areas, a variety of upland forbs and grasses that do not have the same fertilizer/pesticide maintenance requirements as turf grass may be planted to provide additional filtering of any runoff. Plantings can be arranged so that access to a pier or a portion of the lakefront still exists, but runoff from the property to the lake is minimized. Thus, the lake’s overall health improves without interfering with recreational uses of the lake. Henderson et al. (1998) illustrate a variety of landscaping options to achieve water quality and access goals. Appendix H contains a list of potential species that could be planted at the lake’s shoreline and further inland to restore the shoreline. Restoring Oliver and Martin lakes’ shoreline by planting areas with native vegetation will return the functions the shoreline once provided the lakes. In addition to filtering runoff, well-vegetated shorelines are less likely to erode, reducing sediment loading to the lakes, and provide cover for young warmwater fish species and their food resources, which may be limited in the OOM lakes chain. Well-vegetated shorelines also discourage Canada geese, which may not be considered at nuisance levels at Oliver and Martin lakes at this point in time. However, evidence of their presence and its potential impact on nutrient and pathogen levels is readily apparent on docks and lawns around the lake. Canada geese prefer maintained lawns because any predators are clearly visible in lawn areas. Native vegetation is higher in profile than maintained lawns and has the potential to hide predators, increasing the risk for the geese. Wire fences or string lines do little to discourage geese, since these devices do not obscure geese sight line and geese learn to jump wire fences. Additionally, unlike concrete or other hard seawalls, vegetated shorelines dampen wave energy, reducing or even eliminating the “rebound” effect seen with hard seawalls. Waves that rebound off hard seawalls continue to stir the lake’s bottom sediments, reducing water clarity and impairing the lake’s aesthetic appeal. (Residents might also consider replacing or refacing concrete seawalls with glacial stone to reduce the “rebound” effect.) Purple loosestrife and reed canary grass were identified in several locations along both lakes’ shoreline and in adjacent lawns. Both of these species are introduced from Eurasia and spread rapidly through prolific seed production, vegetative growth, and cultivation. Without individual control, both species can spread along the lakeshore inhibiting boat mooring and individual access to the lake. (See the Macrophyte Discussion for more information on these plants.) Landowners should replace these plants with native species that provide equal or better quality aesthetics and are more useful to birds, butterflies, and other wildlife as habitat and a food source. Reed canary grass should be replaced with switch grass, Indian grass, or even big blue stem depending on the landowner’s desired landscaping (Figure 80). Rose mallow, swamp blazing star, swamp milkweed, cardinal flower, blue-flag iris, or blue lobelia all offer more habitat and aesthetic variety than that offered by purple loosestrife (Figure 81). A mixture of these species will also allow for colorful blooms throughout the growing season.
Oliver, Olin, and Martin lakes Diagnostic Study October 16, 2009 LaGrange County, Indiana
File No.070874.00 Page 150
Figure 80. Switch grass (left), big bluestem (center), and Indian grass (right) are some of the grass species suggested for shoreline planting along Oliver and Martin lakes.
Figure 81. Some of the forbs suggested for shoreline planting along Oliver and Martin lakes are swamp blazing star (top left), swamp milkweed (top right and with bumblebee top center), cardinal flower (bottom left), blue-flag iris (bottom center), and blue lobelia (bottom right). In addition to re-landscaping lakefront property, all lake and watershed property owners should reduce or eliminate the use of fertilizers and pesticides. These lawn and landscape-care products are a source of nutrients and toxins to the lake. Landowners typically apply more fertilizer to lawns and landscaped areas than necessary to achieve the desired results. Plants can only utilize a given amount of nutrients. Nutrients not absorbed by the plants or soil can run into the lake either directly from those residents’ lawns along the lake’s shoreline or indirectly via storm drains. This simply fertilizes the rooted plants and algae in the lake. At the very minimum,
Oliver, Olin, and Martin lakes Diagnostic Study October 16, 2009 LaGrange County, Indiana
File No.070874.00 Page 151
landowners should follow dosing recommendations on product labels and avoid fertilizer/pesticide use within 10 feet of hard surfaces such as roads, driveways, and sidewalks and within 10 to 15 feet of the water’s edge. Wherever possible, natural landscapes should be encouraged to reduce pesticide and fertilizer use. If a landowner considers fertilizer use necessary, the landowner should apply phosphorus-free fertilizers. Most fertilizers contain both nitrogen and phosphorus. However, the soil usually contains enough natural phosphorus to allow for plant growth. As a consequence, fertilizers with only nitrogen work as well as those with both nutrients. The excess phosphorus that cannot be absorbed by the grass or plants can enter the lake, either directly or via storm drains. Landowners can have their soil tested to ensure that their property does indeed have sufficient phosphorus and no additional phosphorus needs to be added. The Purdue University Extension or a local supplier can usually provide information on soil testing. Shoreline landowners should also avoid depositing lawn waste such as leaves and grass clippings in Oliver and Martin lakes or their tributaries as this adds to the nutrient base of the lake. Pet and other animal waste that enters the lake also contributes nutrients and pathogens to it. All of these substances require oxygen to decompose. This increases the oxygen demand on the lake. Yard, pet, and animal waste should be placed in residents’ solid waste containers to be taken to the landfill rather than leaving the waste on the lawn or piers to decompose. Each lake property owner should investigate local drains from roads, parking areas, driveways, and roof tops. Resident surveys conducted on other northern Indiana lakes have indicated that many lakeside houses have local drains of some sort on their properties (JFNew, 2002). These drains contribute to sediment and nutrient loading and thermal pollution of the lake. Where possible, alternatives to piping the water directly to the lakes should be considered. Alternatives include French drains (gravel filled trenches), wetland filters, catch basins, and native plant overland swales. Residents might also consider the use of rain gardens or rain barrels to treat stormwater on individual lots. Individuals should take steps to prevent unnecessary pollutant release from their property. With regard to car maintenance, property owners should clean any automotive fluid (oil, antifreeze, etc.) spills immediately. Driveways and street fronts should be kept clean and free of sediment. Regular hardscape cleaning would help reduce sediment and sediment-attached nutrient loading to the waterbodies in the watershed. Street cleaning would also reduce the loading of heavy metals and other toxicants associated with automobile use. Residents should avoid sweeping driveway silt and debris into storm drains. Rather, any sediment or debris collected during cleaning should be deposited in a solid waste container. 6.3.8 Residential and Commercial Development Erosion Control There are relatively few active residential developments currently in progress in the OOM lakes watershed. Active construction sites are a common source of sediment to nearby waterways. Sediment loss from active construction sites can be several orders of magnitude greater than sediment loss from a completed subdivision or agricultural field. Use of appropriate erosion control management techniques on active construction sites is necessary to reduce pollutant loading to nearby waterbodies. While current regulations may not have required the use of silt fencing on this site (under new regulations, anyone planning to disturb more than an acre of land must file an erosion control plan with the State), the use of erosion control practices would certainly reduce the amount of sediment reaching OOM lakes from development sites. The use of common erosion control practices are strongly recommended regardless of whether they are required by the State.
Oliver, Olin, and Martin lakes Diagnostic Study October 16, 2009 LaGrange County, Indiana
File No.070874.00 Page 152
6.3.9 Additional Treatment of Stormwater Runoff All hardscapes within the OOM lakes watershed are sources of urban pollutants. The urban landscape can contribute more pollutants to nearby waterbodies than some agricultural landscapes. The U.S. Environmental Protection Agency’s National Urban Runoff Program (USEPA, 1983) results suggest that pollutant runoff rates, including nutrients and suspended solids, will increase as land is converted from agricultural fields to urban landscapes. Reckhow and Simpson (1980) found similar results in their review of studies of nutrient export rates from various landscapes. Bannerman et al. (1992) reported that streets and parking lots release significant amounts of stormwater contaminants. Given the potential for water pollution from typical urban landscapes, watershed stakeholders must also focus on urban watershed management. The potential for installing stormwater Best Management Practices (BMPs) that promote infiltration should also be investigated. For instance, infiltration and treatment swales can be installed at Sites 3 and 9 from the watershed tour to address water quality issues. Filtration trenches, sand filters, and biofilters (a variation of sand filters that are planted with native vegetation to allow additional nutrient uptake) provide good treatment for stormwater pollutants. Research (Winer, 2000) suggests these infiltration BMPs are particularly good for treating pollutants of concern in the OOM lakes watershed. These BMPs also promote infiltration of stormwater rather than storing it and discharging it at a later time. This simulates the natural hydrology of the watershed by recharging the groundwater with at least a portion of the stormwater rather than sending the whole volume downstream. Unfortunately, these BMPs can be costly and difficult to maintain, factors that should be balanced with the benefits derived from these BMPs. 6.4 In-Lake Management 6.4.1 Aquatic Plant Management Development of an aquatic plant management plan is also a recommended in-lake management step for Oliver, Olin, and Martin lakes. Like a recreational use management plan, an aquatic plant management plan takes into account the lake’s current and historical ecological condition as well as the recreational desires of the lake’s user groups. The following is a list of recommendations that should form the foundation of any aquatic plant management plan for Oliver, Olin, and Martin lakes. Lake users should remember that rooted plants are a vital part of a healthy functioning lake ecosystem; complete eradication of rooted plants is neither desirable nor feasible. A good aquatic plant management plan will reflect these facts.
1. Oliver, Olin, and Martin lakes’ rooted plant diversity and plant species should be protected (Figure 82). The lakes support good rooted plant diversity and this undoubtedly plays a role in supporting their healthy fishery. Management techniques that are not species specific, such as contact herbicides or large scale harvesting, should be avoided to ensure the protection of the community.
Oliver, Olin, and Martin lakes Diagnostic Study October 16, 2009 LaGrange County, Indiana
File No.070874.00 Page 153
Figure 82. Example of Oliver Lake’s rooted plant community. 2. Oliver and Martin lake residents should take steps to protect the lake’s shoreline
vegetation. Exotic species like purple loosestrife and reed canary grass are present in landscaping adjacent to the lake. Removal of these species and restoration of the shoreline would protect many of the functions provided by healthy riparian areas. A more detailed discussion of shoreline functions and restoration techniques was provided above in the Individual Property Management Section.
3. Oliver and Martin lake residents should investigate spot treatment options for areas
where aquatic plants are especially dense or occur in nuisance stands. Specific areas include the dense Eurasian watermilfoil beds around Oliver and Olin, especially in the private channels in Oliver Lake, and along most of the shoreline in Martin Lake. Spot treatment within these areas will likely improve travel through these areas and increase individual resident’s ability to utilize their shoreline. Treatment history indicates that Eurasian watermilfoil reaches nuisance levels in various locations within Martin Lake. However, at the time of the current survey, curly-leaf pondweed was found in low density throughout the lake, while Eurasian watermilfoil was identified along most of the shoreline. Curly-leaf pondweed typically reaches its greatest density early in the growing season; therefore, its lack of dominance at the time of the assessment is not surprising. If individual residents in these areas feel that the amount of plant growth in front of their property is limiting the recreational potential of the lake, these residents might consider management techniques such as hand harvesting of plant material, spot treatment of aquatic vegetation, or the use of bottom covers. Please be aware that permits may be required for these activities. Residents should consult with the IDNR
Oliver, Olin, and Martin lakes Diagnostic Study October 16, 2009 LaGrange County, Indiana
File No.070874.00 Page 154
Division of Fish and Wildlife before implementing any of these management methods. If hand harvesting is utilized as a treatment method, residents need to remove the plant material from the lake rather than allowing it to remain in the lake, float to other areas, and re-root. Additionally, if plants are removed from the lake by hand, plants should not be left along the shoreline or piled on adjacent sea walls. The nutrients from the plants return to the water through decomposition and decay. This is an additional source of nutrient loading to the lake. An educational program highlighting the benefits a healthy plant community, including emergent species, might help residents make informed decisions on balancing their desire for relatively plant-free water in front of their property with the desire for a healthy, productive fish community in the lakes.
Figure 83. Example of the density of Eurasian watermilfoil along the shoreline of Martin Lake.
4. Residents should take action to educate themselves on Eurasian watermilfoil, hydrilla,
and other invasive aquatic plants (Figure 83). Given the unique fisheries resource that the lakes present, residents should be especially diligent in educating all users, including visiting users, regarding the threat of Eurasian watermilfoil and other invasive aquatic plants to the OOM lakes and other area lakes. These exotic invasive species offer poor habitat to the lake’s biota and often interfere with recreational uses of a lake. Creating an inspection or boat washing facility would likely be the best option for reducing the infestation of the lake with Eurasian watermilfoil or other invasives. Furthermore, lake users should also educate themselves on both native and non-native plant species. The Stop the Hitchhikers! (www.protectyourwaters.net) campaign offers great resources on preventing the spread of exotic and/or invasive species. Taking precautionary measures
Oliver, Olin, and Martin lakes Diagnostic Study October 16, 2009 LaGrange County, Indiana
File No.070874.00 Page 155
such as ensuring that all plant material is removed from boat propellers following their use prevents the spread of these and other invasive species. Lake users should also refrain from boating through stands of Eurasian watermilfoil in other lakes. Pieces of the plant as small as one inch in length that are cut by a boat propeller as it moves through a stand of Eurasian watermilfoil or hydrilla can sprout and establish a new plant. Signage at the public boat ramp informing visitors of these best management practices would also be useful. It is important to note that IDNR approval is required to post any signs at the public boat ramp.
A good aquatic plant management plan includes a variety of management techniques applicable to different parts of a lake depending on the lake’s water quality, the characteristics of the plant community in different parts of the lake, and lake users’ goals for different parts of the lake. Many aquatic plant management techniques, including chemical control, harvesting, and biological control, require a permit form the IDNR. Depending on the size and location of the treatment area, even individual residents may need a permit to conduct a treatment. Residents should contact the IDNR Division of Fish and Wildlife before conducting any treatment. The following paragraphs describe some aquatic plant management techniques that may be applicable to Oliver, Olin, and Martin lakes, given their specific ecological condition. Chemical Control Herbicides are the most traditional means of controlling aquatic vegetation. No recorded herbicide control occurred within Olin or Martin lakes (LaGrange County) in 2008. Herbicides have been used in the past on Oliver Lake to treat small areas of Eurasian watermilfoil in the lake. However, it is likely that some residents may have conducted their own spot treatments around piers, swimming areas, and in private channels. It is important for residents to remember that any chemical herbicide treatment program should always be developed with the help of a certified applicator who is familiar with the water chemistry of the target lake. In addition, application of a chemical herbicide may require a permit from the IDNR, depending on the size and location of the treatment area. Information on permit requirements is available from the IDNR Division of Fish and Wildlife or conservation officers. Herbicides vary in their specificity to given plants, method of application, residence time in the water, and the use restrictions for the water during and after treatments. Herbicides (and algaecides; chara is an algae) that are non-specific and require whole lake applications to work are generally not recommended. These herbicides, also called contact herbicides, are only effective for controlling submergent vegetation on the short term. Such herbicides can kill non-target plants and sometimes even fish species in a lake. Rather, selective or systemic herbicides (triclopyr, fluoridone, etc.) are recommended for effective control of Eurasian watermilfoil. Fluoridone is typically recommended for whole lake treatment of Eurasian watermilfoil due to the lower tolerance of Eurasian watermilfoil to Fluoridone compared with other aquatic plant species. Costs of an herbicide treatment vary from lake to lake depending upon the type of plant species present in the lake, the size of the lake, access availability to the lake, the water chemistry of the lake, and other factors. Typically in northern Indiana, costs for treatment range from $300 to $400 per acre or $750 to $1000 per hectare (Nate Long, Aquatic Control, personal communication). A whole lake treatment does not need to be the top priority for the OMLCIA at this point; however, if Eurasian watermilfoil increases, it might become an option. While providing a short-term fix to the nuisances caused by aquatic vegetation, chemical control is not a lake restoration technique. Herbicide and algaecide treatments do not address the reasons why there is an aquatic plant problem, and treatments need to be repeated each year
Oliver, Olin, and Martin lakes Diagnostic Study October 16, 2009 LaGrange County, Indiana
File No.070874.00 Page 156
to obtain the desired control. In addition, some studies have shown that long-term use of copper sulfate (algaecide) has negatively impacted some lake ecosystems. Such impacts include an increase in sediment toxicity, increased tolerance of some algae species, including some blue-green (nuisance) species, to copper sulfate, increased internal cycling of nutrients, and some negative impacts on fish and other members of the food chain (Hanson and Stefan, 1984 cited in Olem and Flock, 1990). Chemical treatment should be used with caution on Oliver, Olin, and Martin lakes since treated plants are often left to decay in the water. This will contribute nutrients to the lake’s water column. Additionally, plants left to decay in the water column will consume oxygen. The in-lake sampling conducted during this study showed that Oliver and Olin lakes possessed relatively low nutrient concentrations compared to many Indiana lakes, while Martin possessed relatively high nutrient concentrations. Nonetheless, as evidenced during the plant survey, all of the lakes total phosphorus concentrations are high enough to support filamentous algae and, based on the water chemistry samples collected during the previous in-lake assessments, the lake may also experience algal blooms. The plankton community present in Oliver, Olin, and Martin lakes further iterates this issue in that the community is dominated by blue-green algae. Furthermore, the blue-green algae that comprised the largest portion of the plankton community have been known to cause taste, odor, and toxicity problems in other lakes. Chemical treatment is likely the best way to control growth and spread of Eurasian watermilfoil in Oliver, Olin, and Martin lakes. Mechanical Harvesting Harvesting involves the physical removal of vegetation from lakes. Harvesting should also be viewed as a short-term management strategy. Like chemical control, harvesting needs to be repeated yearly and sometimes several times within the same year. (Some carry-over from the previous year has occurred in certain lakes.) Despite this, harvesting is often an attractive management technique because it can provide lake users with immediate access to areas and activities that have been affected by excessive plant growth. Mechanical harvesting is also beneficial in situations where removal of plant biomass will improve a lake’s water chemistry. (Chemical control leaves dead plant biomass in the lake to decay and consume valuable oxygen.) Macrophyte response to harvesting often depends upon the species of plant and particular way in which the management technique is performed. Pondweeds, which rely on sexual reproduction for propagation, can be managed successfully through harvesting. However, many harvested plants, especially Eurasian watermilfoil, can re-root or reproduce vegetatively from the cut pieces left in the water. Plants harvested several times during the growing season, especially late in the season, often grow more slowly the following season (Cooke et al., 1993). Harvesting plants at their roots is usually more effective than harvesting higher up on their stems (Olem and Flock, 1990). This is especially true with Eurasian watermilfoil and curly-leaf pondweed. Benefits are also derived if the cut plants and the nutrients they contain are removed from the lake. Harvested vegetation that is cut and left in the lake ultimately decomposes, contributing nutrients and consuming oxygen. Hand harvesting is recommended in small areas where human uses are hampered by extensive growths (docks, piers, beaches, boat ramps). Landowners can remove up to 625 ft2 (58 m2) of vegetation in their frontage without an aquatic plant control permit. In these small areas, plants can be efficiently cut and removed from the lake with hand cutters such as the Aqua Weed Cutter (Figure 84). In less than one hour every 2-3 weeks, a homeowner can harvest ‘weeds’ from along docks and piers. Depending on the model, hand-harvesting equipment for smaller areas cost from $50 to $1500 (McComas, 1993). To reduce the cost, several homeowners can
Oliver, Olin, and Martin lakes Diagnostic Study October 16, 2009 LaGrange County, Indiana
File No.070874.00 Page 157
invest together in such a cutter. Alternatively, a lake association may purchase one for its members. This sharing has worked on other Indiana lakes with aquatic plant problems. Use of a hand harvester is more efficient and quick-acting, and less toxic for small areas than spot herbicide treatments.
Figure 84. An aquatic weed cutter designed to cut emergent weeds along the edge of ponds. It has a 48” cutting width, uses heavy-duty stainless steel blades, can be sharpened, and comes with an attached 20’ rope and blade covers. Biological Control Biological control involves the use of one species to control another species. Often when a plant species that is native to another part of the world is introduced to a new region with suitable habitat, it grows rapidly because its native predators have not been introduced to the new region along with the plant species. This is the case with some of the common pest plants in northeast Indiana such as Eurasian watermilfoil and purple loosestrife. Neither of these species is native to Indiana, yet both exist in and around LaGrange County. Researchers have studied the ability of various insect species to control both Eurasian watermilfoil and purple loosestrife. Cooke et al. (1993) points to four different species that may reduce Eurasian watermilfoil infestations: Triaenodes tarda, a caddisfly, Cricotopus myriophylii, a midge, Acentria nivea, a moth and Litodactylus leucogaster, a weevil. Recent research efforts have focused on the potential for Euhrychiopsis lecontei, a native weevil, to control Eurasian watermilfoil. Purple loosestrife biocontrol researchers have examined the potential for three insects, Gallerucella calmariensis, G. pusilla, and Hylobius transversovittatus, to control the plant. While the population of purple loosestrife on Oliver, Olin, and Martin lakes is relatively small and therefore may not be suitable for biological control efforts, it may be worthwhile for lake residents to understand the common biocontrol mechanisms for this species should the situation on the lake change. Likewise, as Eurasian watermilfoil is present in all three lakes, residents should be cognizant of infestation issues and biocontrol mechanisms for Eurasian watermilfoil. Therefore, treatment options for the plant are discussed below merely as reference material for use in case of future infestation. Residents should also be aware that under new regulations an IDNR permit is required for the implementation of a biological control program on a lake. Eurasian Watermilfoil Euhrychiopsis lecontei has been implicated in a reduction of Eurasian watermilfoil in several Northeastern and Midwestern lakes (USEPA, 1997). E. lecontei weevils reduce milfoil biomass by two means: one, both adult and larval stages of the weevil eat different portions of the plant and two, tunneling by weevil larvae cause the plant to lose buoyancy and collapse, limiting its ability to reach sunlight. The weevils’ actions also cut off the flow of carbohydrates to the plant’s root crowns impairing the plant’s ability to store carbohydrates for over wintering (Madsen,
Oliver, Olin, and Martin lakes Diagnostic Study October 16, 2009 LaGrange County, Indiana
File No.070874.00 Page 158
2000). Techniques for rearing and releasing the weevil in lakes have been developed and under appropriate conditions, use of the weevil has produced good results in reducing Eurasian watermilfoil. A nine-year study of nine southeastern Wisconsin lakes suggested that weevil activity might have contributed to Eurasian watermilfoil declines in the lakes (Helsel et al, 1999). Cost effectiveness and environmental safety are among the advantages to using the weevil rather than traditional herbicides in controlling Eurasian watermilfoil (Christina Brant, EnviroScience, personal communication). Cost advantages include the weevil’s low maintenance and long-term effectiveness versus the annual application of an herbicide. In addition, use of the weevil does not have use restrictions that are required with some chemical herbicides. Use of the weevil has a few drawbacks. The most important one to note is that reductions in Eurasian watermilfoil are seen over the course of several years in contrast to the immediate response seen with traditional herbicides. Therefore, lake residents need to be patient. Additionally, the weevils require natural shorelines for over-wintering. Oliver, Olin and Martin lakes are somewhat unique in that they still have a significant amount of natural shoreline. The Indiana Department of Natural Resources released E. lecontei weevils in three Indiana lakes to evaluate the effectiveness of utilizing the weevils to control Eurasian watermilfoil in Indiana lakes. The results of this study were inconclusive (Scribailo and Alix, 2003), and the IDNR considers the use of the weevils on Indiana lakes an unproven technique and only experimental (Rich, 2005). If future infestation of Eurasian watermilfoil should occur, Pretty Lake residents should take the lack of proven usefulness in Indiana lakes into consideration before attempting treatment of the lake’s Eurasian watermilfoil with the E. lecontei weevils. Purple Loosestrife Biological control may also be possible for inhibiting the growth and spread of the emergent purple loosestrife. Like Eurasian watermilfoil, purple loosestrife is an aggressive non-native species. Once purple loosestrife becomes established in an area, the species will readily spread and take over the shallow water and moist soil environment, excluding many of the native species which are more valuable to wildlife. Conventional control methods including mowing, herbicide applications, and prescribed burning have been unsuccessful in controlling purple loosestrife. Some control has been achieved through the use of several insects. A pilot project in Ontario, Canada reported a decrease of 95% of the purple loosestrife population from the pretreatment population (Cornell Cooperative Extension, 1996). Four different insects were utilized to achieve this control. These insects have been identified as natural predators of purple loosestrife in its native habitat. Two of the insects specialize on the leaves, defoliating a plant (Gallerucella calmariensis and G. pusilla), one specializes on the flower, while one eats the roots of the plant (Hylobius transversovittatus). Insect releases in Indiana to date have had mixed results. After six years, the loosestrife of Fish Lake in LaPorte County is showing signs of deterioration. Like biological control of Eurasian watermilfoil, use of purple loosestrife predators offers a cost-effective means for achieving long-term control of the plant. Complete eradication of the plant cannot be achieved through use of a biological control. Insect (predator) populations will follow the plant (prey) populations. As the population of the plant decreases, so will the population of the insect since their food source is decreasing.
Oliver, Olin, and Martin lakes Diagnostic Study October 16, 2009 LaGrange County, Indiana
File No.070874.00 Page 159
Bottom Covers Bottom shading by covering bottom sediments with fiberglass or plastic sheeting materials provides a physical barrier to macrophyte growth. Buoyancy and permeability are key characteristics of the various sheeting materials. Buoyant materials (polyethylene and polypropylene) are generally more difficult to apply and must be weighted down. Unfortunately, sand or gravel anchors used to hold buoyant materials in place can act as substrate for new macrophyte growth. Any bottom cover materials placed on the lake bottom must be permeable to allow gases to escape from the sediments; gas escape holes must be cut in impermeable liners. Commercially available sheets made of fiberglass-coated screen, coated polypropylene, and synthetic rubber are non-buoyant and allow gases to escape, but cost more (up to $66,000 per acre or $163,000 per hectare for materials, Cooke and Kennedy, 1989). Indiana regulations specifically prohibit the use of bottom covering material as a base for beaches. Due to the prohibitive cost of the sheeting materials, sediment covering is recommended for only small portions of lakes, such as around docks, beaches, or boat mooring areas. This technique may be ineffective in areas of high sedimentation, since sediment accumulated on the sheeting material provides a substrate for macrophyte growth. The IDNR requires a permit for any permanent structure on the lake bottom, including anchored sheeting. Preventive Measures Preventive measures are necessary to curb the spread of nuisance aquatic vegetation. Although milfoil is thought to ‘hitchhike’ on the feet and feathers of waterfowl as they move from infected to uninfected waters, the greatest threat of spreading this invasive plant is humans. Plant fragments snag on boat motors and trailers as boats are hauled out of lakes (Figure 85). Milfoil, for example, can survive for up to a week in this state; it can then infect a milfoil-free lake when the boat and trailer are launched next. It is important to educate boaters to clean their boats and trailers of all plant fragments each time they retrieve them from a lake. The Stop the Hitchhikers! campaign offers information on the prevention of spreading exotic invasive species. Visit their website at for more information: www.protectyourwaters.net
Figure 85. Locations where aquatic macrophytes are often found on boats and trailers. Educational programs are effective ways to manage and prevent the spread of aquatic nuisance species (ANS) such as Eurasian watermilfoil, zebra mussels, and others. Of particular help are signs at boat launch ramps asking boaters to check their boats and trailers both before launching and after retrieval. All plants should be removed and disposed of in refuse containers where they cannot make their way back into the lake. The Illinois-Indiana Sea Grant Program has examples of boat ramp signs and other educational materials that can be used at the lakes. Eurasian watermilfoil is present in OOM lakes chain and other area lakes; therefore, educational programs and lake signage will help prevent the spread of this nuisance species into other parts of the lake or into other area lakes. Non-resident anglers and other visitors will use their boats in other lakes in addition to Oliver, Olin, and Martin lakes, potentially spreading Eurasian watermilfoil to uninfested lakes. Signs addressing any best management practices to prevent
Oliver, Olin, and Martin lakes Diagnostic Study October 16, 2009 LaGrange County, Indiana
File No.070874.00 Page 160
the spread of nuisance aquatic species will ultimately help protect all lakes as new nuisance (often non-native) species are finding their way to Indiana lakes all the time. 6.4.2 Dredging Sediment removal by dredging removes phosphorus enriched sediments from lake bottoms, thereby reducing the likelihood of phosphorus release from the sediments. Dredging also deepens lakes for recreational purposes and limits the growth area for rooted macrophytes. Because this technique is capital-intensive, it can only be justified in small lakes or in lakes where the sediment-bound phosphorus is limited to a small, identifiable area. Dredging is not effective in lakes where additional sediment loading cannot be controlled. Sediment removal might be justified in a seepage lake, where watershed controls are not applicable. Furthermore, the use of dredging as a plant control technique may not be completely effective considering that dredged areas may be recolonized by nuisance exotic species. A potentially troublesome consequence of dredging is the resuspension of sediments during the dredging operation and the possible release of toxic substances bound loosely to sediments. Because of this, sediment cores must be analyzed prior to dredging to determine sediment composition. Such an analysis would also provide a profile of phosphorus concentrations with depth in the sediments. If phosphorus concentrations do not decline with depth, dredging for phosphorus control would not be effective since phosphorus could continue to be released from the sediments. Cost must be carefully evaluated before dredging operations occur. In deep lakes, the cost of dredging can be prohibitive. In small lakes, it may be easier and more cost-effective to dewater the lake and remove sediments with excavation equipment and trucks. Perhaps the most economically and logistically prohibitive part of a dredging operation is disposal of the removed sediments. Sediment disposal must be investigated before the decision to dredge can be made. Dredging costs range from $1.00 to $1.25 per square foot (Jeff Krevda and Steve Tennant, personal communication). This estimate excludes any administrative costs associated with dredging, which often is an additional 20-30% of the dredging fee. Any dredging activities in a freshwater public lake will require permits from the Corps of Engineers, the Indiana Department of Environmental Management, and Indiana Department of Natural Resources, further increasing the cost of dredging. Dredging should not be the first priority to resolve nutrient problems in Oliver, Olin, and Martin lakes. After the association addresses sediment and nutrient loading issues within the watershed, a sediment removal plan should be completed. Under the Lake and River Enhancement sediment removal program, applicants have to complete a sediment removal plan in order to qualify for funding. Lake and River Enhancement program staff indicate that lake associations that have targeted watershed issues to reduce sediment and nutrient loading will receive higher priority for sediment removal funding. After addressing these issues, completing a sediment removal plan would be the ideal avenue for understanding dredging needs on the lakes. JFNew completed a sediment survey for the OOM chain on October 30 and 31. Sediment depth was measured at seven different locations: Dove Creek inlet to Oliver Lake (Site 1), an area on the west shore of Oliver Lake where shoreline erosion is occurring (Site 2), the channel connecting Oliver and Olin Lakes (Site 3) an unnamed tributary on the east side of Oliver Lake (Site 4), inlet to Olin Lake from the channel connecting Olin and Martin Lakes (Site 5), outlet of Martin Lake (Site 6), and Truman Flint Ditch inlet to Martin Lake (Site 7) (Figure 86). The sediment survey was conducted from a boat and sediment depth estimated using a PVC pipe.
Oliver, Olin, and Martin lakes Diagnostic Study October 16, 2009 LaGrange County, Indiana
File No.070874.00 Page 161
Sediment depth was determined by first measuring water depth with the PVC pipe, then the pipe was pushed into the lake bottom until the pipe could no longer be advanced with moderate force. Sediment depth was defined as the total length (water depth + distance pushed into lake bottom) minus water depth. At each site, sediment depths were taken until either sediment accumulation appeared to stop or water depth was too great (generally > 6 feet; 1.8 m). All survey points were recorded with a GPS. The purpose of the sediment survey was to document if sediment was accumulating at points of interest within the lakes, such as lake inlets, and if so, to what degree. Large amounts of accumulated sediment would suggest a lake has a sediment and nutrient loading problem. Increased sediment and nutrient loading into a lake can have a negative effect on water quality, quality of aquatic habitat, and general recreational use of the lake.
Figure 86. Aerial view of the seven sites sampled during the sediment survey. Site 1 is located in the northwest corner of Oliver Lake and is the Dove Creek inlet (Figure 87). The area is a channelized area with abundant aquatic vegetation, and an average water depth and sediment depth of 2.5 feet (0.8 m) (Table 63). The sediment was a mixture of organic material built up from aquatic vegetation die-offs, and soft clay. Water depth limited the distance into the lake sediment sampling could be completed. Site 1 had the second highest average sediment depth (Table 63). Sediment loading appears to be occurring at Site 1; however, the channel is still navigable by boat.
Oliver, Olin, and Martin lakes Diagnostic Study October 16, 2009 LaGrange County, Indiana
File No.070874.00 Page 162
Figure 87. Distribution of sediment survey sampling points with corresponding water and sediment depths at Site 1. Raw data can be found in Appendix I.
Oliver, Olin, and Martin lakes Diagnostic Study October 16, 2009 LaGrange County, Indiana
File No.070874.00 Page 163
Site 2 is located off the west shore of Oliver Lake where shoreline erosion is occurring (Figure 88; Figure 89). Active erosion is evident as the shoreline vegetation has exposed root mats. The site is located along undeveloped shoreline and erosion appears to be a result of wave action despite the presence of a bulrush bed just out from the shore and abundant shoreline vegetation. Site 2 had an average water depth of 2.3 feet (.7 m) and an average sediment depth of 1.8 feet (0.5 m) (Table 63). Sediment was composed of marl. Site 2 had the third highest average sediment depth. Sediment loading appears to be occurring at Site 2. Currently, sediment accumulation does not appear to be limiting aquatic habitat quality or recreational use.
Figure 88. Shoreline erosion occurring at Site 2 on the west side of Oliver Lake.
Oliver, Olin, and Martin lakes Diagnostic Study October 16, 2009 LaGrange County, Indiana
File No.070874.00 Page 164
Figure 89. Distribution of sediment survey sampling points with corresponding water and sediment depths at Site 2 where shoreline erosion is occurring on the west shore of Oliver Lake. Raw data can be found in Appendix I.
Oliver, Olin, and Martin lakes Diagnostic Study October 16, 2009 LaGrange County, Indiana
File No.070874.00 Page 165
Site 3 is a small channel connecting Oliver and Olin Lakes (Figure 86; Figure 90). The channel has all natural shoreline, an average water depth of 2.8 feet (0.9 m) and an average sediment depth of 0.2 feet (0.1 m) (Table 63). Site 3 had the lowest average sediment depth. Sediment loading is not an issue at this location.
Figure 90. Distribution of sediment survey sampling points with corresponding water and sediment depths in the channel connecting Olin and Oliver Lake Site 3. Raw data can be found in Appendix I.
Oliver, Olin, and Martin lakes Diagnostic Study October 16, 2009 LaGrange County, Indiana
File No.070874.00 Page 166
Site 4 is the inlet of an unnamed tributary on the eastside of Oliver Lake (Figure 86; Figure 91). The inlet is a small, narrow channel lined by sheet pile and contains some aquatic vegetation. Site 4 had an average water depth of 1.1 feet (0.3 m) and an average sediment depth of 0.3 feet (0.1 m) (Table 63). Site 4 had the second lowest average sediment depth. Sediment loading is not an issue at this location.
Figure 91. Distribution of sediment survey sampling points with corresponding water and sediment depths at unnamed tributary to Oliver Lake, Site 4. Raw data can be found in Appendix I.
Oliver, Olin, and Martin lakes Diagnostic Study October 16, 2009 LaGrange County, Indiana
File No.070874.00 Page 167
Site 5 is the inlet to Olin Lake from the channel that connects Martin Lake and Olin Lake (Figure 86; Figure 92). The channel is undeveloped natural shoreline with well vegetated banks. Within the channel is a mixture of floating, emergent and submergent aquatic plants and is navigable by boat. Site 5 had an average water depth of 2.9 feet (.9 m) and an average sediment depth of 1.7 feet (0.5 m) (Table 63). The sediment was a combination of organic and clay material. Site 5 had the fourth highest sediment depth average. Currently, accumulated sediment does not appear to be a problem as it does not limit the quality of aquatic habitat or recreational use.
Figure 92. Distribution of sediment survey sampling points with corresponding water and sediment depths at inlet to Olin Lake Site 5. Raw data can be found in Appendix I.
Oliver, Olin, and Martin lakes Diagnostic Study October 16, 2009 LaGrange County, Indiana
File No.070874.00 Page 168
Site 6 is the outlet of Martin Lake (Figure 86; Figure 93) which flows into channel connecting to Olin Lake. Characteristics of Site 6 are similar to those listed for Site 5. Site 5 had an average water depth of 3.0 feet (0.9 m) and an average sediment depth of 0.8 feet (0.3 m) (Table 63). Site 6 had the fifeeth highest sediment depth. While some sediment accumulation has occurred it appears to not be an area of concern.
Figure 93. Distribution of sediment survey sampling points with corresponding water and sediment depths at Martin Lake Site 6. Raw data can be found in Appendix I.
Oliver, Olin, and Martin lakes Diagnostic Study October 16, 2009 LaGrange County, Indiana
File No.070874.00 Page 169
Site 7 is the Truman Flint Ditch inlet to Martin Lake (Figure 86; Figure 94). Site 7 had an average water depth of 2.2 feet (0.8 m) and an average sediment depth of 5.6 feet (1.7 m) (Table 63). Site 7 had the highest average sediment depth, exceeding the next highest average by just over three feet. Such a high average sediment depth would indicate a significant amount of sediment and nutrients are carried into Martin Lake by Truman Flint Ditch. In a 1983 general fisheries survey of Martin Lake by IDNR (Ledet, 1984), noted that Martin Lake becomes very turbid in the spring and identified the source as Truman Flint Ditch. Ledet (1984) suggested the sediment and nutrient loading from Truman Flint Ditch will contribute significantly to the deterioration of the lakes water quality. Reducing the amount of sediment being carried to Martin Lake via Truman Flint Ditch through erosion control projects within the watershed rather than dredging is the recommended action. However, the area should be the first area targeted for dredging, if a project is proposed in the OOM chain of lakes.
Figure 94. Aerial view of Site 7 at Martin Lake showing sampling points and corresponding water and sediment depths. Raw data can be found in Appendix I.
Oliver, Olin, and Martin lakes Diagnostic Study October 16, 2009 LaGrange County, Indiana
File No.070874.00 Page 170
Table 63. Average water and sediment depth for each site sampled during the sediment survey.
Site Location Average
water depth
Average sediment
depth 1 Dove Creek inlet 2.5 2.5
2 Oliver Lake Westside
shoreline erosion 2.3 1.8
3 Channel connecting
Oliver and Olin Lakes 2.8 0.2
4 Inlet of Unnamed
tributary to Oliver Lake 1.1 0.3
5 Inlet to Olin Lake from
Martin Lake 2.9 1.7
6 Martin Lake outlet 3.0 0.8
7 Truman Flint Ditch inlet
Martin Lake 2.2 5.6
Dredging is not recommended at this time for any of the seven sites surveyed despite the presence of sediment loading at sites 1, 2, 5, and 7. All sites sampled do not indicate that sediment accumulation is limiting the recreational quality of the OOM chain or the quality of aquatic habitat. Action within the watershed to reduce erosion should be completed before dredging is explored. Reducing sediment inputs to Dove Creek and Truman Flint Ditch should be a priority. 6.4.4 Water Quality Monitoring The Indiana Clean Lakes Volunteer Monitoring Program trains and equips citizen volunteers to measure Secchi disk transparency, water color, total phosphorus, and chlorophyll a in Indiana lakes. Citizen volunteers monitor over 115 lakes for transparency and 40 lakes for phosphorus and chlorophyll. Volunteers also have access to temperature and oxygen meters to track changes in these parameters throughout the year. Data collected by volunteers helps elucidate any trends in water quality and provides more timely information with which lake management decisions can be made. Oliver, Olin and Martin lakes has participated in this program in the past and should continue providing a citizen volunteer. Participation in the Indiana Clean Lakes Volunteer Monitoring Program is highly recommended. 7.0 RECOMMENDATIONS As noted in the previous sections, Oliver, Olin, and Martin lakes currently possess good water quality. However, this trend may not continue indefinitely. Results from the modeling and lake and stream assessments indicate that current pollutant; particularly phosphorus, nitrate, organic matter, and bacteria concentrations and loads are of concern for the lakes’ long-term health. Given Oliver, Olin, and Martin lakes’ specific characteristics, both in-lake and watershed management is recommended to maintain the lakes’ good water quality. Oliver and Olin lakes’ low watershed area to lake area ratio suggests actions taken along the shoreline can have a significant impact of the lake’s health. Thus, management of near shore streams and individual residential properties should be prioritized. Oliver and Olin have relatively long hydraulic
Oliver, Olin, and Martin lakes Diagnostic Study October 16, 2009 LaGrange County, Indiana
File No.070874.00 Page 171
residence times. In-lake management that can affect nutrient cycling should also receive a high priority. Watershed management techniques to reduce nutrient, sediment, and bacterial loading from the watershed are important, especially in the Martin Lake watershed. The following list summarizes the recommendations for maintaining and improving Oliver, Olin, and Martin lakes’ chemical, biological, and physical condition. Each of the following recommendations should be implemented and will help maintain the lakes’ good water quality. The list is prioritized based on the current ecological conditions of the lakes and their watersheds. These conditions may change as land and lake use change requiring a change in the order of prioritization. Watershed stakeholders may also wish to prioritize these management recommendations differently to accommodate specific needs or desired uses of the lake. It is important for watershed stakeholders to know that action need not be taken in this order. Some of the smaller, less expensive recommendations, such as the individual property owner recommendations, may be implemented while funds are being raised to implement some of the larger projects. (Appendix J provides a list of possible funding sources to implement recommended projects.) Many of the larger projects will require feasibility studies to ensure landowner willingness to participate in the project and regulatory approval of the project. 1. Implement agricultural best management practices such as restoring existing failed structures, installing and increasing stream buffer width, and repairing and installing grassed waterways. These practices previously worked to protect water quality in the lakes; however, each structure and practice has a limited lifetime, especially if the practices are not maintained. Implementing standard conservation practices in the agricultural lands through the help of the local NRCS office should have a high probability of success to protect water quality because the NRCS can provide financial and technical assistance to landowners. It is recommended that the lake association meet with local NRCS representatives to develop a list of landowners and practices to pursue. 2. Stabilize the eroding ravines on the IDNR’s Olin Lake Nature Preserve to reduce sediment and nutrient loading to Olin and Oliver lakes. This project has a high probability of success to protect water quality because the project is located on property owned and managed by the Department of Natural Resources. The lake association should meet with the property manager to request that the stabilization of the ravines become a management priority. The IDNR may likely have access to maintenance funding or be able to provide resources to complete the work. 3. Implement individual property owner management techniques. These apply to all watershed property owners rather than simply those who live immediately adjacent to Oliver and Martin lakes.
a. Reduce the frequency and amount of fertilizer and herbicide/pesticide used for lawn care.
b. Use only phosphorus-free fertilizer. (This means that the middle number on the fertilizer package listing the nutrient ratio, nitrogen:phosphorus:potassium is 0.)
c. Consider re-landscaping lawn edges, particularly those along the watershed’s lakes and streams, to include species that are capable of filtering runoff water better than turf grass.
d. Consider planting native emergent vegetation along shorelines or in front of existing seawalls to provide fish and invertebrate habitat and dampen wave energy. Additionally, consider replacing or refacing concrete seawalls with glacial stone seawalls.
e. Keep organic debris like lawn clippings, leaves, and animal waste out of the water.
Oliver, Olin, and Martin lakes Diagnostic Study October 16, 2009 LaGrange County, Indiana
File No.070874.00 Page 172
f. Examine all drains that lead from roads, driveways, or rooftops to the watershed’s lakes and/or streams; consider alternate routes for these drains that would filter pollutants before they reach the water. Stabilize bare drainage ditches with vegetation where possible or rock where flow rates are too high for vegetation.
g. Obey no-wake zones. h. Clean boat propellers after lake use and refrain from dumping bait buckets into the
lake to prevent the spread of exotic species. Although individual watershed management is one of the top priorities to protect and improve the water quality of the OOM lakes, it is also one of the most difficult to accomplish because it relies on individuals making conscious decisions about their actions, which sometimes may be different from how they currently operate. Each of the practices outlined above require very little to no additional cost to implement. The biggest step is to continue existing good practices and change behaviors that are not positively affecting water quality. The lake association could sponsor “individual watershed management” workshops, provide information at meetings and through the website, and develop demonstration projects to provide education and outreach for the community. There are several grant programs that can provide funding for demonstration programs (Appendix J) and the local SWCD may be able to provide training materials and programs for watershed management. 4. Manage the Eurasian watermilfoil present in the lakes and private channels to prevent its spread and protect the diverse, native submergent rooted plant community. Ensure buoy placement limits boat traffic through Eurasian watermilfoil hot spots until these areas can be treated. This successfulness of this recommendation relies on educating lake users and residents on what they can do to prevent the spread of exotic species. The lake association can offer information at their website and discuss it on a regular basis at association meetings. Lake residents should also provide one-on-one education to neighbors and other users when they observe actions that encourage the spread of exotic species such as Eurasian watermilfoil. 5. Restore wetland habitat within the OOM lakes watershed where feasible. Figure 79 shows areas that are good candidates for wetland restoration. This recommendation has a low probability of success because it relies on willing landowners to convert the existing land use to wetland habitat. If accomplished, the benefits to the lakes and watershed are tremendously high because of the important functions that wetlands play in the watershed including the hydrologic cycle and sediment and nutrient retention. Potential funding sources are described in Appendix J and likely include federal programs through the U.S. Department of Agriculture’s Farm Bill and state programs like the LARE program. 6. Monitor and improve erosion control techniques on residential and commercial development sites throughout the watershed. Development has been somewhat limited around Oliver and Martin lakes when compared to other lakes in northern Indiana; however, there is always a potential for this to change in the future. Bring areas of concern to the attention of the appropriate authorities such as the LaGrange County SWCD. This recommendation can be successful if residents are aware of proper erosion control techniques for both their own projects and for others around the lake. As with other recommendations, ultimate success depends on educating lake and watershed residents. 7. Pursue opportunities to connect residential properties adjacent to drainage ditches to the existing sewer system. The probability of success for this recommendation is fairly low because it will require additional costs at the individual property owner level. The lake association should target residents with areas that located in areas with soils that are limited for septic systems.
Oliver, Olin, and Martin lakes Diagnostic Study October 16, 2009 LaGrange County, Indiana
File No.070874.00 Page 173
One motivating factor for property owners may be the reduction in maintenance and hassle of a septic system versus the function of a sewer system. 8. Increase usage of the Conservation Reserve Program in the OOM lakes watershed particularly on land mapped in highly erodible soils. This recommendation is similar to Recommendation No. 1 in that there is an existing structure for willing landowners to enroll agricultural land into a conservation program through the government programs and agencies. They would be financially compensated for their enrollment during the lifetime of their participation in the program. The overall probability of successfully increasing the amount of highly erodible land in conservation programs is fairly low; however, low commodity prices, increased input costs, and farm transitions (younger family members taking over the management of the properties) may provide motivation for a increasing enrollment. The lake association should work with local NRCS representatives to continue to pursue enrollment opportunities within the watershed. 9. Stabilize or restore stream channels or drainages within the OOM lakes watershed (outside of the Olin Lake Nature Preserve) to reduce sediment and nutrient loading to all three lakes. The probability of success for these practices is fairly high, if willing landowners are identified. The largest hurdle is identifying landowners that are willing to participate by providing the use of their property for projects. Funding opportunities are detailed in Appendix J and likely will include the LARE program and IDEM’s 319 program. 10. Continue active volunteer monitoring through the Indiana Clean Lakes Program volunteer monitoring program. Oliver, Olin, and Martin lakes have participated in the past and continue to participate in the volunteer program currently; continued participation in this program is recommended. Volunteer monitoring is easy and does not take much time. The CLP staff provides the training and equipment needed to participate in the program. The data collected by the volunteer monitor will be extremely useful in tracking long-term trends in the lake water quality and measuring the success of any restoration measures implemented in the watershed. 8.0 LITERATURE CITED Aikens, S.A. P.R. Newroth, and I. Wile. 1979. The biology of Canadian weeds, 34 Myriophyllum
spicatum. L. Can. J. Plant Sci. 59:201-215. Allan, J. D. 1995. Stream Ecology: structure and function of running waters. Chapman and
Hall, London. APHA. 2005. Standard Methods for the examination of water and wastewater. 21st Edition.
American Public Health Association, Washington D.C. Bannerman, R.T., D.W. Owens, R.B. Dodds, and N.J. Hornewer. 1993. Sources of Pollutants in
Wisconsin Stormwater. Wat. Sci. Tech. 28: 241-359. Barbour, M.T., J. Gerritsen, B.D. Snyder, and J.B. Stribling. 1999. Rapid Bioassessment
Protocols for Use in Wadeable Streams and Rivers: Periphyton, Benthic Macroinvertebrates, and Fish. 2nd Edition. U.S. Environmental Protection Agency, Office of Water. Washington, D.C. EPA 841-B99-002.
Borman, S., R. Korth, and J. Temte. 1997. Through the Looking Glass: A Field Guide to
Oliver, Olin, and Martin lakes Diagnostic Study October 16, 2009 LaGrange County, Indiana
File No.070874.00 Page 174
Bowman, M.F. and R.C. Bailey. 1997. Does taxonomic resolution affect the multivariate
description of the structure of freshwater benthic macroinvertebrate communities? Can. J. of Fisheries and Aquatic Sciences. 54:1802-1807.
Braun, E.R. 1979. Caldwell Lake, Kosciusko County: lake survey report 1979. Indiana
Department of Natural Resources, Indianapolis, Indiana. Brown, S.E. and H. Jones 1999, Glacial terrains of the Stroh 7.5-minute quadrangle: Indiana
Geological Survey Open-File Study 99-12. Brown, S.E., A.H. Fleming, H. Jones, T.L. Schrader, 1998, Glacial terrains of the Mongo,
Wolcottville, and the Indiana part of the Burr Oak 7.5 minute quadrangles, LaGrange and Noble Counties, Indiana: Indiana Geological Survey Open-File Study 98-06
Caraco, D. and T. Brown. 2001. Managing Phosphorus Inputs into Lakes II: Crafting and
Accurate Phosphorus Budget for Your Lake. Wat. Prot. Techniques. 3(4):782-790. Carlson, R.E. 1977. A trophic state index for lakes. Limnology and Oceanography, 22(2):361-
369. Clark, G.D. (Ed.) 1980. The Indiana Water Resource – Availability, Uses, and Needs. Governor’s Water Resource Study Commission, Indiana Department of Natural Resources, Indianapolis. Clark, G.M., D.K. Mueller and M.A. Mast. 2000. Nutrient concentrations and yields in
undeveloped stream basins of the United States. J. Am. Water Resour. Assoc., 36(4):849-860.
Claytor, R. A. and T.R. Schueler. 1996. Design of Stormwater Filter Systems. Center for
Watershed Protection, Ellicott City, Maryland. CLP. 1993. File data. School of Public and Environmental Affairs, Indiana University,
Bloomington, Indiana. CLP. 2000. File data. School of Public and Environmental Affairs, Indiana University,
Bloomington, Indiana. CLP. 2003. File data. School of Public and Environmental Affairs, Indiana University,
Bloomington, Indiana. CLP. 2006. File data. School of Public and Environmental Affairs, Indiana University,
Bloomington, Indiana. Cogger, C.G. 1989. Septic System Waste Treatment in Soils. Washington State University
Cooperative Extension Department. EB1475. Conservation Technology Information Center. No date. Conservation Buffer Facts. [web page]
http://www.ctic.purdue.edu/core4/buffer/bufferfact.html [Accessed March 3, 2000].
Oliver, Olin, and Martin lakes Diagnostic Study October 16, 2009 LaGrange County, Indiana
File No.070874.00 Page 175
Cooke, G.D. and R.H. Kennedy. 1981. Precipitation and Inactivation of Phosphorus as a Lake Restoration Technique. EPA-600/3-81-012. Corvallis Environmental Research Laboratory, U.S. EPA, Corvallis, Oregon.
Cooke, G.D., E.B. Welch, S.A. Peterson and P.R. Newroth. 1993. Restoration and
Management of Lakes and Reservoirs, Second Edition. Lewis Publishers, Boca Raton. Cornell Cooperative Extension. 1996. Video- “Restoring the Balance: Biological Control of
Purple Loosestrife”. Cornell University Media Services, Ithaca, New York. Correll, David L. 1998. The role of phosphorus in the eutrophication of receiving waters: a
review. J. Environ. Qual., 27(2):261-266. Cross, T. K., M. C. McInherny, and R. A. Davis. 1992. Macrophyte removal to enhance bluegill,
largemouth bass and northern pike populations. Section of Technical Services Investigational Report 415. Minnesota Department of Natural Resources, Division of Fish and Game, St. Paul, MN.
Deam, C.C. 1921. Trees of Indiana. Department of Conservation. Indianapolis, Indiana. DeLorme. 1998. Indiana Atlas and Gazetteer. Dodd, W. K., J.R. Jones, and E. B. Welch. 1998. Suggested classification of stream trophic
state: Distributions of temperate stream types by chlorophyll, total nitrogen, and phosphorus. Wat. Res. 32:1455-1462.
Duris, J.W., S.K. Haack, H.W. Reeves, and J.L. Kiesler. 2003. Pathogenic Escherichia coli from
agricultural watersheds in Michigan and Indiana. In: Proceedings: American Water Resources Association Spring Specialty Conference 2003, Agricultural Hydrology and Water Quality, May 2003, Kansas City, Missouri.
EarthSource. 1991. Big Long Lake, Lake of the Woods, McClish Lake, Pretty Lake…A study for
their improvement, restoration and protection. Prepared for Big Long Lake Association, Lake of the Woods/McClish Lake Association, Pretty Lake Association, Indiana Department of Natural Resources, T-by-2000 Program, Indianapolis, Indiana.
FEMA. http://www.fema.gov/ Ferraro, S.P. and F.A. Cole. 1995. Taxonomic level sufficient for assessing pollution impacts in
Southern California Bight macrobenthos- revisited. Env. Tox. and Chem. 14:1021-1040. Frankenberger, J. 2001. E. coli and Indiana Lakes and Streams. Safe Water for the Future [web
page] http://www.ecn.purdue.edu/SafeWater/watershed.ecoli.html. [Accessed October 2, 2001].
Frey, D.G. 1955. Distributional ecology of the cisco, Coregonus artedii, in Indiana. Invest.
Indiana Lakes and Streams, 4:177-228. Furse et al. 1984. The influence of seasonal and taxonomic factors on the ordination and
classification of running water sites in Great Britain and on the prediction of their macroinvertebrate communities. Freshwater Biology. 14:257-280.
Oliver, Olin, and Martin lakes Diagnostic Study October 16, 2009 LaGrange County, Indiana
File No.070874.00 Page 176
F. X. Browne. 1992. Feasibility studies of ten LaGrange County lakes. Prepared for The South
Central LaGrange County Water Quality Commission, Indiana Department of Natural Resources, Indiana Lake Enhancement Program, Indianapolis, Indiana.
Grant, W. 1989. A preliminary investigation of twenty-four lakes in Lagrange County, Indiana.
Indiana Department of Natural Resources, T-by-2000 Program, Indianapolis, Indiana. Gulish, W.J. 1971. Chinook Salmon Introduction in Oliver and Olin Lakes, LaGrange County;
Progress Report 1970. Indiana Department of Natural Resources, Division of Fish and Wildlife. Indianapolis, Indiana.
Gulish, W.J. 1972. Chinook Salmon Introduction in Oliver and Olin Lakes, LaGrange County;
Progress Report 1970-71. Indiana Department of Natural Resources, Division of Fish and Wildlife. Indianapolis, Indiana.
Gulish, W.J. 1973. Results of a Chinook Salmon Introduction in Oliver and Olin Lakes. Indiana
Department of Natural Resources, Division of Fish and Wildlife. Indianapolis, Indiana. Gulish, W.J. 1974. Revised Creel Census for the Oliver Lake Chain, LaGrange County 1973.
Indiana Department of Natural Resources, Division of Fish and Wildlife. Indianapolis, Indiana.
Gulish, W. J. 1975. A summary of Indiana cisco investigations, 1971-1974. Indiana Department
of Natural Resources. 30 pp Gutschick, R.C. 1966. Bedrock Geology. In: Linsey, A.A. (ed.) Natural Features of Indiana.
Indiana Academy of Science, Indiana State Library, Indianapolis, Indiana, p. 1-20. Hamilton, M. 1965. Wetlands of northern Indiana. Indiana Department of Natural Resources,
Division of Fish and Wildlife, Indianapolis, Indiana. Hanson, M.J. and H.G. Stefan. 1984. Side effects of 58 year of copper sulfate treatment of the
Fairmont Lakes, Minnesota. Water Res. Bull. 20:889-900. Helsel, D.R., S.A. Nichols and R.S. Wakeman. 1999. Impact of aquatic plant management
methods on Eurasian watermilfoil populations in southeast Wisconsin. J. Lake and Reserv. Mgmt., 15(2): 159-167.
Henderson, C.L, C. J. Dindorf, and F.J. Rozumalski. 1998. Landscaping for Wildlife and Water
Quality. Minnesota Department of Natural Resources, St. Paul, Minnesota. Hillis. 1980. Soil Survey of Lagrange County, Indiana. USDA Soil Conservation Service and
Purdue Agricultural Experiment Station. Hilsenhoff, William L. 1988. Rapid field assessment of organic pollution with a family-level
biotic index. J. N. Am. Benthol. Soc. 7(1):65-68.
Oliver, Olin, and Martin lakes Diagnostic Study October 16, 2009 LaGrange County, Indiana
File No.070874.00 Page 177
Holdren, C., W. Jones, and J. Taggart. 2001. Managing Lakes and Reservoirs. EPA 841B-01-006. Prepared by North American Lakes Management Society and Terrene Institute for the U.S. Environmental Protection Agency, Washington, D.C.
Homoya, M.A., B.D. Abrell, J.R. Aldrich, and T.W. Post. 1985. The natural regions of Indiana.
Indiana Academy of Science. Vol. 94. Indiana Natural Heritage Program. Indiana Department of Natural Resources, Indianapolis, Indiana.
Indiana Department of Environmental Management. 1986. Indiana Lake Classification System
and Management Plan. Indiana Department of Environmental Management, Indianapolis. Indiana Department of Environmental Management. 1995. Indiana Water Quality Report.
Department of Environmental Management, Indianapolis, Indiana. IDEM. 1996. Scoring criteria for the family level macroinvertebrate Index of
Biotic Integrity (mIBI). Biological Studies Section, Indianapolis. IDEM. 2002. Indiana Integrated Water Quality Monitoring and Assessment Report.Indiana
Department of Environmental Management Office of Water Quality, Indianapolis, IN. Indiana Department of Natural Resources. 1956. Oliver, Olin, and Martin lakes, LaGrange
County bathymetric map. Indiana Department of Natural Resources, Division of Water, Indianapolis, Indiana.
Indiana Department of Natural Resources. 1996. Indiana Wetlands Conservation Plan.
Indianapolis, Indiana. Indiana Department of Natural Resources. 2004a. Indiana conservation tillage
initiative.[webpage].http://www.agry.purdue.edu/swq/images/transectcounty.pdf [Accessed January 7, 2006]
Indiana Department of Natural Resources. 2004b. Lagrange County 2004 Cropland Tillage
Data. [web page] Division of Soil Conservation. http://www.in.gov/isda/publications/tillagereports/lagrange.html [Accessed July 7, 2006] Indiana Department of Natural Resources. 2006. Tier I aquatic vegetation survey protocol.
Indianapolis, Indiana. Indiana State Pollution Control Board. 1986. Indiana Lake Classification System and
Management Plan. Indiana Stream Pollution Control Board, Indianapolis, Indiana. JFNew. 2002. Bass Lake Diagnostic Study, Stark County, Indiana. For the Indiana Department
of Natural Resources, Division of Soil Conservation, Lake and River Enhancement Program, Indianapolis, Indiana. Loose-leaf publication.
Jones, W.W. and S. Medrano. 2006. Indiana Lake Water Quality Assessment Report For 1999
– 2003. Indiana Clean Lakes Program, Indiana Department of Environmental Management, Indianapolis, IN.
Oliver, Olin, and Martin lakes Diagnostic Study October 16, 2009 LaGrange County, Indiana
File No.070874.00 Page 178
Karr, J.R., K.D. Fausch, P.L. Angermeier, P.R. Yant, and I.J. Schlosser. 1986. Assessing biological integrity in running waters: a method and its rationale. Illinois Natural History Survey Special Publication 5, Urbana, Illinois. 28 pg.
Klumpp, J., M. McIntosh, and E. Wilkerson. 2000. An overview of Upper Stephen’s Creek, Monroe County, Indiana. School of Public and Environmental AffairsStream Ecology Report, Indiana University, Bloomington.
Department of Natural Resources, Division of Fish and Wildlife. Indianapolis, Indiana. Ledet, N.D. 1984a. Oliver Lake, LaGrange County: Fish management Report 1983. Indiana
Department of Natural Resources. Indianapolis, Indiana. Ledet, N.D. 1984b. Martin Lake, LaGrange County: Fish Management Report Indiana
Department of Natural Resources, Division of Fish and Wildlife. Indianapolis, Indiana. Ledet, N.D. 1984c. Olin Lake, LaGrange County: Fish Management Report Indiana Department
of Natural Resources, Division of Fish and Wildlife.Indianapolis, Indiana. Ledet, N.D. 1986. Olin Lake, LaGrange County: Spot Check Survey 1986. Indiana Department
of Natural Resources, Division of Fish and Wildlife. Indianapolis, Indiana. Ledet, N.D. and L.A. Koza 1990. Oliver Lake Chain, LaGrange County: A Survey of Fish
Harvest at the Oliver Lake Chain 1990. Indiana Department of Natural Resources, Division of Fish and Wildlife. Indianapolis, Indiana.
Lee, A. and J. Toonkel. 2003. Urban Stream Impact Protocol: A methodology for assessing
water quality and source determination. Carnegie Mellon University, Pittsburgh, Pennsylvania.
Madsen, J.D. 2000. Advantages and disadvantages of aquatic plant management. LakeLine,
20(1):22-34. Marchant, R.L. et al. 1995. Influence of sample quantification and taxonomic resolution on the
ordination of macroinvertebrate communities from running waters in Victoria, Australia. Marine and Freshwater Research. 46:501-506.
McCaffety, P. W. 1998. Aquatic entomology: The fisherman’s and ecologists’ illustrated guide to
insects and their relatives. Jones and Bartlett, Sudbury, Massachusetts. McComas, S. 1993. Lake Smarts. The Terrene Institute, Washington, D. C. 215 pp. Metropolitan Washington Council of Governments. 1992. Design of Stormwater Wetland
Systems: Guidance for Creating Diverse and Effective Stormwater Wetland Systems in the Mid-Atlantic Region. Anacostia Restoration Team, Department of Environmental Programs, Metropolitan Washington Council of Governments, Washington, D.C.
National Climatic Data Center. 1976. Climatography of the United States. No.60. National Wetlands Inventory. U.S. Fish and Wildlife Service, National Wetlands Inventory.
[webpage] http://www.fws.gov/wetlands/
Oliver, Olin, and Martin lakes Diagnostic Study October 16, 2009 LaGrange County, Indiana
File No.070874.00 Page 179
NOAA. 2005. Climatological Data Annual Summary, Indiana. Volume 110, Number 13.
National Oceanic and Atmospheric Administration, National Climate Data Center, Ashville, NC.
Ohio EPA. 1989. Qualitative habitat evaluation index manual. Division of Water Quality
Planning and Assessment, Columbus, Ohio. Ohio EPA. 1995. Biological and water quality study of Little Miami River and selected
tributaries, Clarke, Greene, Montgomery, Warren, Clermont, and Hamilton Counties, Ohio. Volume 1. OEPA Tech. Rept. No. MAS/1994-12-11. Ohio EPA, Division of Surface Water, Monitoring and Assessment Section, Columbus, Ohio.
Ohio EPA. 1999. Association between nutrients, habitat, and the aquatic biota in Ohio rivers
and streams. Ohio EPA Technical Bulletin MAS/1999-1-1, Columbus, Ohio. Olem, H. and G. Flock, eds. 1990. Lake and Reservoir restoration guidance manual. 2nd
edition. EPA 440/4-90-006. Prepared by NALMS for USEPA, Washington, D.C. Olsen, M. H., S. R. Carpenter, P. Cunningham, S. Gafny, B. R. Herwig, N. P. Nibbelink, T.
Pellett, C. Storlie, A. S. Trebitz, and K. A. Wilson. 1998. Managing macrophytes to improve fish growth: a multi-lake experiment. Fisheries 23:6-12.
Omernik, J.M. and A.L. Gallant. 1988. Ecoregions of the Upper Midwest States. U. S.
Environmental Protection Agency, Corvallis, Oregon. EPA/600/3-88/037. Peckarsky, B. L., and M. A. Penton. 1990. Effects of enclosures on stream microhabitat and
invertebrate community structure. J. N. Am. Benthol. Soc. 9:249-261. Peterson, R. 1972a. Martin Lake, LaGrange County: Water Chemistry Record. Indiana
Department of Natural Resources, Division of Fish and Wildlife, Indianapolis, Indiana. Peterson, R. 1972b. Oliver Lake, LaGrange County: Water Chemistry Record. Indiana
Department of Natural Resources, Division of Fish and Wildlife. Indianapolis, Indiana. Peterson, R. 1972c. Olin Lake, LaGrange County: Water Chemistry Record. Indiana
Department of Natural Resources, Division of Fish and Wildlife. Indianapolis, Indiana. Petty, R.O. and M.T. Jackson. 1966. Plant communities. In: Lindsey, A.A. (ed.) Natural Features
of Indiana. Indiana Academy of Science, Indiana State Library, Indianapolis, Indiana, p. 264-296.
Prescott, G.W. 1982. Algae of the Western Great Lakes Area. Otto Koeltz Science Publishers,
West Germany. Purdue Applied Meteorology Group. 2008.Indiana State Climate Office. [webpage].
http://www.agry.purdue.edu/climate/ Rankin, E.T. 1989. The qualitative habitat evaluation index (QHEI): rationale, methods, and
application. Division of Water Quality Planning and Assessment, Columbus, Ohio.
Oliver, Olin, and Martin lakes Diagnostic Study October 16, 2009 LaGrange County, Indiana
File No.070874.00 Page 180
Rankin, E.T. 1995. Habitat indices in water resource quality assessment, in W.S. Davis and T. Simon (eds.). Biological Assessment and Criteria: Tools for Risk-based Planning and Decision Making. CRC Press/Lewis Publishers, Ann Arbor, Michigan.
Reckhow, K.H. 1979. Quantitative Techniques for the Assessment of Lake Quality. Report No.
EPA-440/5-79-015. U.S. Environmental Protection Agency,Office of Water Planning and Standards, Washington, D.C.
Reckhow, K.H. and J.T. Simpson. 1980. A procedure using modeling and error analysis for the
prediction of lake phosphorus concentration from land use information. Can. J. Fish. Aquat. Sci., 37:1439-1448.
Rich, C.F. 2005. Correspondence with JFNew regarding the Four Lakes Diagnostic Study dated
June 17, 2005. Schneider, A.F. 1966. Physiography. In: Lindsey, A.A. (ed.) Natural Features of Indiana. Indiana
Academy of Science, Indiana State Library, Indianapolis, Indiana, p. 40-56. Scribailo, R.W. and M.S. Alix. 2003. Final report on the weevil release study for Indiana lakes.
Indiana Department of Natural Resources, Division of Soil Conservation, Indianapolis, Indiana.
Steuer. J., W. Selbig. N. Hornewer, and J. Prey. 1997. Sources of contamination in an urban
basin in Marquette, Michigan and analysis of concentrations, loads, and data quality. USGS Water Quality Resources Investigation Report 97-4242. Wisconsin DNR and USEPA.
Swink, F. and G. Wilhelm. 1994. Plants of the Chicago region. 4th Edition. Indianapolis:
Indiana Academy of Science. Thomas, J.A. 1996. Soil Characteristics of “Buttermilk Ridge” Wabash Moraine, Wells County
Indiana. Notes for the IU/PU (Ft. Wayne) Soils Course: Characteristics of Fine-Grained Soils and Glacial Deposits in Northeastern Indiana for On-Site Wastewater Disposal Systems.
United States Department of Agriculture. 2002. 2002 Census of Agriculture County Profile:
Lagrange County, Indiana. [web page] U.S. Census of Agriculture. http://www.nass.usda.gov/census/census02/profiles/in/cp18183.PDF [Accessed July 7, 2006]
United States Environmental Protection Agency. 1983. Results of the Nationwide Urban Runoff
Project. Washingotn, DC, Volume I: Final Report. Water Planning Division, NTIS PB#84-185554.
United States Environmental Protection Agency. 1976. Quality Criteria for Water. U.S.
Environmental Protection Agency, Washington, D.C. United States Environmental Protection Agency. 1997. Use of aquatic weevils to contro la
nuisance weed in Lake Bomoseen, Vermont. Watershed Protection: Clean Lakes Case Study. U.S. Environmental Protection Agency, Office of Water, Washington, D.C. EPA 841-F-97-002.
Oliver, Olin, and Martin lakes Diagnostic Study October 16, 2009 LaGrange County, Indiana
File No.070874.00 Page 181
United States Environmental Protection Agency. 2000b. Ambient Water Quality Criteria Recommendations Information Supporting the Development of State and Tribal Nutrient Criteria Rivers and Streams in Nutrient Ecoregion VI. United States Environmental Protection Agency, Office of Water, Washington, D.C. EPA 822-B-00-018.
United States Environmental Protection Agency. 2008. State Adoption of Numeric Nutrient
Standards (1998-2008). United States Environmental Protection Agency, Office of Water, Washington, D.C. EPA-821-F-08-007.
United States Geological Survey. 2008. Data obtained for a U.S.G.S. gaging station on the
Elkhart River at North Manchester, Indiana. http://in.water.usgs.gov/ Valley, R. D., T. K. Cross, and P. Radomski. 2004. The role of submersed aquatic vegetation
as habitat for fish in Minnesota lakes, including implications of non-native plant invasions and their management. Special Publication 160. Minnesota Department of Natural Resources, Division of Fish and Wildlife, St. Paul, MN.
Vant, W.N. (Ed.). 1987. Lake manager’s handbook: a guide to undertaking and understanding
investigations into lake ecosystems, so as to assess management options for lakes. Water Quality Centre, Ministry of Works and Development, Wellington, New Zealand.
Vollenweider, R.A. 1975. Input-output models with special reference to the phosphorus loading
concept in limnology. Schweiz Z. Hydrol, 37(1):53-84. Waite, I.R. et al. 2000. Comparing strengths of geographic and nongeographic classifications
of stream benthic macroinvertebrates in the Mid-Atlantic Highlands, USA. J. N. Am. Benthol. Soc. 19(3):429-441.
Walker, R.D. 1978. Task force on Agricultural Nonpoint Sources of Pollution Subcommittee on soil Erosion and Sedimentation. Illinois Institute for Environmental Qaulity, 72pp.
Ward, H.B. and G.C. Whipple. 1959. Freshwater Biology, Second Edition. W.T. Edmondson, editor. John Wiley & Sons, Inc., New York.
Waschbusch, R., W. Selbig, and R. Bannerman. 2000. Sources of Phosphorus in Stormwater
and Street Dirt from Two Urban Residential Basins in Madison, Wisconsin, 1994-1995. Proceedings from National Conference of Tools for Urban Water Resource management and Protection, Chicago, Illinois.
Waters, T.F. 1995. Sediment in Streams: Sources, Biological Effects, and Control. American
Fisheries Society Monograph 7. Bethesda, Maryland, 251pp. Wayne, W.J. 1966. Ice and land: a review of the tertiary and Pleistocene history of Indiana. In:
Lindsey, A.A. (ed.) Natural Features of Indiana. Indiana Academy of Science, Indiana State Library, Indianapolis, Indiana, p. 21-39.
Wehr, J.D. and R.G. Sheath. 2003. Freshwater ALgae of North America, Ecology and
Classification. Academic Press, San Diego. Whitford, L.A. and G.J. Schumacher. 1984. A Manual of Fresh-Water Algae. Sparks Press,
Raleigh, North Carolina.
Oliver, Olin, and Martin lakes Diagnostic Study October 16, 2009 LaGrange County, Indiana
File No.070874.00 Page 182
White, G.M. 1998a. Exotic plant species in Indiana Lakes. Report prepared for the
Nonindigenous Aquatic Species Database, USGS, Gainesville, Florida. Indiana Department of Natural Resources, Division of Soil Conservation, Indianapolis, Indiana.
White, G.M. 1998b. Factors affecting and estimated cost of aquatic plant control in Indiana
Lakes. Indiana Department of Natural Resources, Division of Soil Conservation, Indianapolis, Indiana.
Winer, R.R. 2000. National Pollutant Removal Database for Stormwater Treatment Practices:
2nd Edition. Center for Watershed Protection, Ellicott City, Maryland. Wohlschlag, D.E. and S.D. Gerking. 1950. “Investigations of Indiana Lakes and Streams.” 3 (11) :389-434, 1950. Yadav, S.N. 1997. Formulation and estimation of nitrate-nitrogen leaching from corn cultivation.
J. Environ. Qual. 26:808-814. Zinn, J.A. and C. Copeland. 2005. Wetland Issues. Congressional Research Service, CRS Brief
for Congress. Order Code 1B97014.
APPENDIX A
ENDANGERED, THREATENED, AND RARE SPECIES LIST
OLIVER, OLIN, AND MARTIN LAKES DIAGNOSTIC STUDY
LAGRANGE COUNTY, INDIANA
APPENDIX B
QHEI AND MACROINVERTEBRATE DATA
OLIVER, OLIN, AND MARTIN LAKES DIAGNOSTIC STUDY LAGRANGE COUNTY, INDIANA
APPENDIX C
VOLUNTEER LAKE WATER QUALITY MONITORING DATA
OLIVER, OLIN, AND MARTIN LAKES DIAGNOSTIC STUDY LAGRANGE COUNTY, INDIANA
APPENDIX D
TIER II AQUATIC PLANT SURVEY DATA SPRING AND SUMMER ASSESSMENTS
OLIVER, OLIN, AND MARTIN LAKES DIAGNOSTIC STUDY LAGRANGE COUNTY, INDIANA
Number of Species 34*indicates species is no longer stocked**indicates species is currently stocked^indicates species is no longer present in fishery
Historic Fisheries Studies Conducted in the OOM ChainSurvey year Type of Study (focus) Source
1947 Creel survey and fish population estimates Gerking, 19501970-1973 Results of chinook salmon stocking efforts Gulish, 1973
1974Revised findings of creel census during 1971-1973 Gulish, 1974
1971-1972Study of historically known cisco populations in the Elkhart River Watershed, Indiana Gulish, 1973
1971-1975Statewide assessment of historic cisco populations in Indiana Gulish, 1975
1973-1977 Creel census used to estimate total harvest Peterson, 1979
1983 General fisheries survey of Martin Lake Ledet, 19841983 General fisheries survey of Oliver Lake Ledet, 19841983 General fisheries survey of Olin Lake Ledet, 1984
1986Spot check survey in Olin Lake to assess the 1985 & 1986 rainbow trout stocking Ledet, 1986
1990 1990 Olin Lake trout management repot Hudson, 1991
1990 Creel survey of fish harvest in the OOM chain Koza and Ledet, 1991
1994Status of cisco abundance, habitat, and harvest in Northern Indiana lakes Koza, 1995
APPENDIX F
2008 LAKE USE SURVEY
OLIVER, OLIN, AND MARTIN LAKES DIAGNOSTIC STUDY LAGRANGE COUNTY, INDIANA
Lake Use Survey Results: October 4, 2008 22 Respondents
Lake Name: Oliver, Olin, and Martin Lakes Are you a lake property owner? Yes 100% No 0% Are you currently a member of your lake association? Yes 91% No 5% How many years have you been at the lake? <2 yrs 0% 2 – 5 yrs 9% 5-10 yrs 9% > 10 years 73% How do you use the lake (mark all that apply) 100% Swimming 4.6% Irrigation 100% Boating 0.0% Drinking water 90.9% Fishing 13.6% Other Do you have aquatic plants at your shoreline in nuisance quantities? Yes 36.4% No 63.6% Do you currently participate in a weed control project on the lake? Yes 27.3% No 72.7% Does aquatic vegetation interfere with your use or enjoyment of the lake? Yes 40.9% No 54.6% Does the level of vegetation in the lake affect your property values? Yes 27.3% No 77.3% Are you in favor of continuing efforts to control vegetation on the lake? Yes 95.5% No 0% Are you aware that the LARE funds will only apply to work controlling invasive exotic species, and more work may need to be privately funded? Yes 68.2% No 31.8% Mark any of these you think are problems on your lake: 18.2% Too many boats access the lake 27.3% Use of jet skis on the lake 9.1% Too much fishing 18.2% Fish population problem 36.4% Dredging needed 22.7% Overuse by nonresidents 27.3% Too many aquatic plants 0% Not enough aquatic plants 9.1% Poor water quality 45.5% Pier/funneling problem Please add any comments: Comments from the lake use survey are in this appendix as well.
CommentI have lived on the west side of Oliver Lake since 1986 and have seen the weed population increase in the lake. There is a weed out in front of our house that I found this year that was never there before and it is prickly. Weed's are so thick about 7 houses down that it kills the motor of the resident's pontoon and they can't get out of the area into the lake. Too many boats and jet skis on the lake really are not a problem. People will complain about the jet skis but they are not excessive, just loud. I did a count of boats on the lake the summer of 2007 and it was not excessive. There are also areas that need dredging, but that can wait until we take care of the more pressing issue to make the lake better. Controlling of the weeds should be a priority, otherwise the quality of the lake will deteriorate and people will not enjoy going into the water.People drag the weeds on their motor and dump them elsewhere in the lake which populates the invasive weeds. The other concern we have is about the amount of animal waste and bacteria coming into the lake from channels and creeks. We really would like to know if that is happening. In your study, are these being monitoried or checked for bacteria? Geese in large quantities are also a health hazard. I rope off my property every summer because they come up on the grass and dispose their droppings all over the place to the point I can hardly walk on the grass. Although we do not yet have zebra mussels, that is a concern.Oliver Lake, along with Olin and Martin lakes offer a pristine environment for the lakes' resident and visitors. The weed issue is that a recent study showed the presence of some of the more invasive plants and I would be in support of these types of plants if it is possible.problem in both the channel and Dove Creek and the mouth of the channel. Very bad in summer monthsNot necessarily too much fishing, but too many bass boats with too much horse power. Too manyplants (exotics) in some locations. Note enough in others due to concrete seawalls. Weed control needs in channelRegarding Pier/Funneling problem our assocation has filed an appeal against a recent IDNR decision to approve 54 boat slips on piers at a proposed development called Oliver Lake Resort Cooperative, with a rather large pier section to extend out into the lakeWithout some serious dredging on our channel, it will cease to exist at our end.Several boaters not following boating safety laws particularly going too fast after sundownThe DNR keeps putting trout in the lake and that has, in my opinion, ruined the pan fish fishingWe would like additional information on the current weed control measures, if any. We own a home on a channel and currently pay for weed control privately. David & Jill Heller 262-639-9733; [email protected] think they are putting in way too many trout - hurting the bluegill & perch populations; Dredging needed very badly in the public access channel; nonresidents are a problem when they don't follow rules (ski after sundown, jetskis at full speed and trash in the lake) this could be done by some homeowners, but I hope note; poor water quality only when geese herds come in; pier funning this could become a problem with a new campsite which is in the process of wanting to build a hugh pier in the best fish beds on the lakeOliver Lake resort will result in too many boats on the lake if plans I am aware of are allowed.Dredging is needed in the channel to the public boat ramp an the accesses to lakes Olin and Martin. I believe the current lake level is too high. The beach our family enjoyed for 60+ years has been 8 or 9" under water most of the last decade. Either hte current or historic gage pole is/was inaccurate. David & Carol Williams; [email protected] would just like to control the weeds around my pier. I would like to swim from my pier and don't because of the weeds. Also, this year we noticed the channel between Olan & Martin is harder to navagiate because of trees being down.New construction and development is a deteriment to the lake and is contributing to high taxes.
APPENDIX G
2008 WATERSHED TOUR SUMMARY AND RESULTS
OLIVER, OLIN, AND MARTIN LAKES DIAGNOSTIC STUDY LAGRANGE COUNTY, INDIANA
Oliver, Olin, Martin Lake Watershed Tour April 4, 2008: John Richardson-Tom Estrem Modified by Mark Pranckus – Winter 2009 (Number in parentheses is site number that corresponds to site number in Section 6 Management Section of report)
1) Took Photo facing NE off 700 S. Rd at small feed lot. No recommendations 2) Good quality existing wetland on west side of road 3) No till field (as are most on this tour). 4) Gravel pit operation on east side of 450 road (Horstman Enterprises) took photo. 5) 550 S. is a gravel road but no roadside ditches present so may not be an issue. 6) East side of 400 E. is a horse pasture adjacent to small tributary. Took 3 photos
facing SW to NW. Less then 5 feet of buffer adjacent to stream. Ditch flows south along west side of road and then west through pasture. NEED BUFFER. (Site 1)
7) Forested wetland adjacent to road for a ways, trash bags in wetland CLEAN UP TRASH
8) One photo facing SW of f550S. at potential wetland restoration site adjacent to wet woodlot at upper end of drainage. Road is gravel. RESTORE WETLAND. (Site 2)
9) Took photo facing N. then S. off 550 S road at stream crossing. Sand bottom stream. Gravel road has 300-400 feet of slope on each side of stream with evidence of sediment from road running into stream. PAVE ROAD OR DEVELOP FILTRATION SWALES ON ROAD EDGES. (Site 3)
10) Photos taken facing N. then S. at field erosion on N. side and ditch on south side (Field runoff enters 24-36 inch culvert under road via surface flow, 6-inch clay tile and a 14-inch CMP (likely tied to additional clay tile). Additional photos taken of eroding ditch banks on S. side of 550 facing east, south, then southwest. Another photo taken facing northeast at field erosion again, which extends at least 600 feet into field. Field was tilled last fall. NEED NO TILL or GRASSED WATERWAY ON NORTH SIDE, DITCH BANK STABILZATION ON SOUTH SIDE TO #11. (Site 4)
11) Ditch on S. side of 550 turns south at this point approximately 300 feet west of #10. The banks are steep and wooded (looking south) and appear stable (40 foot wooded buffer. Photos taken facing west then south. Erosion at corner of ditch only estimated at a six foot drop off. STABILIZE DITCH BANK as per #10. (Site 5)
12) Stopped at church on corner of St. Rd. 9 and 600 S. Took photos off SR 9 bridge facing west then east (lawn), then a zoomed in photo facing west again. Berm in floodplain 30-50 feet west of bridge constricts stream during flood on west side. REMOVE BERM. About 300 feet west on 600 S. the same stream crosses 600 flowing northwesterly. Took photo facing south then north off 600 S. Road. A berm (similar to the previous one above) exists approximately 75 feet south of 600 S. and is severely eroding as the stream turns northward and undercuts a 10-
15 foot high bank. The berm restricts the floodway. REMOVE second BERM. (Site 6)
13) Photo taken facing west of f200 E. at pasture, currently not in use and in fair shape with no bare spots. Drainage tile flows from NE across 200 E through this pastures low areas and outlets before 450 S. (Discussed in #19 below).
14) Photo facing down and north from 500 S. at top end of drainage. Photo is of an old SCS concrete drop structure. The surface and tile runoff now bypass the structure in an erosional gully around the west side that has been filled with riprap. Photo facing south at nice wetland buffered receiving stream, Another photo of riprap. (Site 7)
15) Next drainage flowing south across 500 S. from no-till field on north to residential lots on south. Channel through yards is entrenched and has some minor erosion issues (photo). While on the north side is another SCS concrete control structure (3 photos). Two unmaintained grass waterways in field to north meet and then no grassed waterway exists to carry water to structure at edge of road (about 100 feet). RECONSTRUCT GRASS WATERWAYS ON NORTH SIDE. (Site 8)
16) At corner of Martin Lake access Road (200 E) and 500 S. a new drain tile has recently been laid with an outlet to the wetland on the east side of the road. A drainage swale was dredged through the wetland to get water to a culvert draining under 200 E. to the tributary on the west side of the road. Photo taken of horse pasture and outlet of new drain to east. CREATE TREATMENT SWALE FOR PASTURE RUNOFF. (Site 9)
17) Photo facing north from Martin Lake Drive at south side of horse pasture and then south towards lake across vacant lot. Pasture runoff containing animal waste only has about 100 feet of maintained grass to flow through before reaching the lake. BUILD RAIN GARDEN OR TREATMEN WETLAND FOR RUNOFF. 100 feet east of this is another open drain tile in the same vacant lot, photo taken facing south then north. ANOTHER TREATMENT CELL. (Site 10)
18) No till field from east drains through evulsed grass waterway and around another old SCS structure at edge of road. REPAIR CONTROL STRUCTURE –RECONSTRUCT GRASSED WATERWAY. Photo facing west then east. Some erosion on west side with confined flow through bean field (minimum till) but this field could also use a grassed waterway. 2 photos facing east, one of structure one of grassed waterway. (Site 13)
19) Two photos taken north of 450S. just west of 200 E. This is the south end of the same pasture described in #13 above. The area just north of the road is used as a livestock watering area/. There is a worn path from the feeding station to the open water area. The approximately 10-inch diameter tile daylights approximately 30 feet north of the culvert under 450 S. Rd. and creates a wetland – Pond area for watering the cattle. EXTEND TILE TO ROAD, DEVELOP ALT. WATERING STATION. (Site 14)
20) Photo facing SW of 450 S. at tributary to Oliver Lake. DEVELOP WIDE BUFFER OR PUT ENTIRE CROP FIELD IN CRP. (Site 16)
21) First crossing of drainage from east to west into Oliver Lake under 150 E. Photos taken facing east then west. Second crossing under 150 (further south) photos were taken facing east then west again. Tin sheetpile walls line both sides of
ditch. DEVELOP/RESTORE NATURAL CHANNELS between road and lake. (Site 15)
22) Two photos taken of drainage across 450 S. Road to Oliver Lake of grass lot and culvert under road. Photo facing south with rock walls adjacent to stream. WETLAND FILTER ON NORTH SIDE. (Site 17)
23) 100 East is a gravel road. Photo facing east at drainage headwaters flowing west at 100 E. then another photo facing north along 100 E. to another channel. CHECK DAMS IN CHANNEL along 100 East Road, RESTORATION OF CHANNEL EAST OF ROAD for 200 feet. (Site 19)
24) Main tributary (#23 flows into this) flowing east to west under 100 E. Road. Photos taken facing west then east then south at tributary. Main stem very flat (no apparent flow) with adjacent shrub or grass buffer. Pasture on SW corner. Field adjacent is no-till, pasture on SW corner. Extend BUFFERS on east-west ditch. (Site 20)
25) Photo facing S. off 350 S. at wooded wetland area being impacted by filling or ditching activities (may be a reportable ACOE violation).
26) Photo facing south side at tile riser. Drainage from north through a recently plowed field (former pasture or hay). Recent runoff has eroded a swale into the drop structure at edge of road. Drain tile flows directly to lake. Three photos facing north including photos of the old slotted drop structure that has been bypassed. Adjacent to the drop structure is a 12-inch CMP facing the field but it is also elevated 6-12 inches above the eroded gully created by the flow. FIX DROP STRUCTURE INLET. (Site 21)
27) Photo of a 10-inch diameter orange riser bypassed by surface water flowing to a 12-14-inch diameter CMP under road. Animal trampling around CMP indicates this area is being used to access water by livestock. FIX INLET STRUCTURE. (Site 22)
28) Cattle Pasture on SE corner of 00 and 300 S. Photo facing SE from intersection. Could build wetland in center of pasture- but probably should encourage the development of a NUTRIENT MANGEMENT PLAN. (Site 23)
29) Photo facing east then west of drainage crossing at 00 EW - No project ideas 30) Facing south of 150 E. Rd. old sand mining operation has left bare banks, runoff
from here to east into Martin Lake. EROSION CONTROL on embankments. (Site 18)
31) New campground adjacent to landing on historically filled wetlands. “Oliver Lake Resort”. Watch for issues with pet waste and contaminant runoff.
32) Olin Lake Nature Preserve –walking tour. Many photos taken of tributary drainage from adjacent crop field toward Olin Lake through woods (1st one encountered when walking south from trailhead). Stream originates at broken of tiles (8” diameter clay and 6” diameter concrete) and flows east about 800 feet to lake. Headcuts begin at toe of slope and have worked their way up the valley about 600 feet with major slope rejuvenation occurring at old walkway crossing (Crossing recently moved upstream about 50 feet). Someone has attempted some grade controls or check dams to stop the incision but may have made some serious mistakes in the design or implementation as the stream blew out the banks around what remains of the structures (wood stakes and metal T-posts).
IMPLEMENT GRADE CONTROLS in drainage path (resore slopes with Jute and live staking. Ample cuttings are available on site to reinforce any grade controls created. (Site 12)
33) Olin Lake Nature Preserve - walking tour. Many more photos taken of major erosion created by incision of intermittent stream originating at 10-inch CMP. One section is 30 feet long with a 15 foot high slough and an additional 30 feet with a 6-8 foot high slough. GRADE CONTROLS. (Site 11)
Example photos of watershed tour results
APPENDIX H
POTENTIAL SHORELINE BUFFER SPECIES
OLIVER, OLIN, AND MARTIN LAKES DIAGNOSTIC STUDY LAGRANGE COUNTY, INDIANA
Appendix H. Potential shoreline buffer species.
Common Name Botanical Name Approximate Location* Arrow Arum Peltandra virginica Shallow water/water’s edge Big Blue Stem Andropogon gerardii Varies/broad range Black-Eyed Susan Rudbeckia hirta Drier soils Blue Flag Iris Iris virginica shrevei Shallow water/water’s edge Blue Joint Grass Calamagrostis canadensis Wet to mesic soils Bottle Gentian Gentiana andrewsii Mesic to dry soils Butterfly Milkweed Asclepias tuberosa Mesic to dry soils Chairmakers rush Scirpus pungens Shallow water/water’s edge Common Bur Reed Sparganium eurycarpum Shallow water/water’s edge Compass Plant Silphium laciniatum Varies/broad range Cream Wild Indigo Baptisia leucophaea Mesic to dry soils Culver's Root Veronicastrum virginianum Varies/broad range Cup Plant Silphium perfoliatum Wet to mesic soils Early Goldenrod Solidago juncea Wet to mesic soils False Dragonhead Physostegia virginiana Wet to mesic soils Goats Rue Tephrosia virginiana Varies/broad range Golden Alexanders Zizia aurea Wet to mesic soils Great Blue Lobelia Lobelia siphilitica Wet soils Halberd-leaved Rose Mallow Hibiscus laevis Shallow water/water’s edge Hard-stemmed Bulrush Scirpus acutus Shallow water/water’s edge Heart-Leaved Meadow Parsnip Zizia aptera Mesic to dry soils Heath Aster Aster ericoides Wet to mesic soils Illinois Sensitive Plant Desmanthus illinoensis Mesic to dry soils Illinois Tick Trefoil Desmodium illinoiense Varies/broad range Indian Grass Sorghastrum nutans Varies/broad range Ironweed Vernonia altissima Wet to mesic soils Little Blue Stem Andropogon scoparius Varies/broad range Marsh Blazing Star Liatris spicata Wet to mesic soils New England Aster Aster novae-angliae Wet to mesic soils New Jersey Tea Ceanothus americanus Varies/broad range Old-Field Goldenrod Solidago nemoralis Mesic to dry soils Partridge Pea Cassia fasciculata Varies/broad range Pickerel Weed Pontederia cordata Shallow water/water’s edge Prairie Bergamot Monarda fistulosa Varies/broad range Prairie Cinquefoil Potentilla arguta Mesic to dry soils Prairie Cord Grass Spartina pectinata Wet to mesic soils Prairie Coreopsis Coreopsis palmata Mesic to dry soils Prairie Dock Silphium terebinthinaceum Varies/broad range Prairie Switch Grass Panicum virgatum Varies/broad range Prairie Wild Rye Elymus canadensis Varies/broad range Purple Coneflower Echinacea purpurea Mesic to dry soils Rattlesnake Master Eryngium yuccifolium Varies/broad range Rosin Weed Silphium integrifolium Varies/broad range Rough Blazing Star Liatris aspera Mesic to dry soils Round-Head Bush Clover Lespedeza capitata Varies/broad range
Common Name Botanical Name Approximate Location* Rushes Juncus spp. Depends upon the species Saw-Tooth Sunflower Helianthus grosseserratus Wet to mesic soils Sedges Carex spp. Depends upon the species Showy Goldenrod Solidago speciosa Mesic to dry soils Side Oats Grama Bouteloua curtipendula Mesic to dry soils Sky-Blue Aster Aster azureus Mesic to dry soils Smooth Aster Aster laevis Mesic to dry soils Sneezeweed Helenium autumnale Wet to mesic soils Softsem Bulrush Scirpus validus creber Shallow water/water’s edge Spider-Wort Tradescantia ohiensis Wet to mesic soils Stiff Goldenrod Solidago rigida Varies/broad range Swamp Loosestrife Decodon verticillatus Shallow water/water’s edge Swamp Rose Mallow Hibiscus palustris Shallow water/water’s edge Sweet Black-Eyed Susan Rudbeckia subtomentosa Wet to mesic soils Sweet Flag Acorus calamus Shallow water/water’s edge Tall Coreopsis Coreopsis tripteris Wet to mesic soils Thimbleweed Anemone cylindrica Mesic to dry soils Virginia Mountain Mint Pycnanthemum virginianum Varies/broad range White Wild Indigo Baptisia leucantha Varies/broad range Wild Lupine Lupinus perennis Mesic to dry soils Wild Quinine Parthenium integrifolium Varies/broad range Wrinkled Goldenrod Solidago rugosa Wet to mesic soils Yellow Coneflower Ratibida pinnata Varies/broad range
* These approximate locations are very general. Each species can have specific site conditions requirements (i.e. sun exposure, soil type, soil moisture). Consequently, site inspection should occur before determining an exact species list for a given site.
APPENDIX I
SEDIMENT SAMPLING DATA
OLIVER, OLIN, AND MARTIN LAKES DIAGNOSTIC STUDY LAGRANGE COUNTY, INDIANA
Sediment sampling at Oliver, Olin, and Martin lakes
Site Number Lake (Area) Point IDWater Depth
Total Depth
Sediment Depth
1 Oliver (Dove Creek) 0 2.3 4.6 2.31 Oliver (Dove Creek) 1 2.5 5.0 2.51 Oliver (Dove Creek) 2 2.0 5.5 3.51 Oliver (Dove Creek) 3 2.3 5.1 2.81 Oliver (Dove Creek) 4 2.1 4.3 2.21 Oliver (Dove Creek) 5 1.5 4.5 3.01 Oliver (Dove Creek) 6 2.0 4.7 2.71 Oliver (Dove Creek) 7 2.0 5.0 3.01 Oliver (Dove Creek) 8 3.0 7.5 4.51 Oliver (Dove Creek) 9 3.0 6.2 3.21 Oliver (Dove Creek) 10 2.7 7.2 4.51 Oliver (Dove Creek) 11 3.0 6.8 3.81 Oliver (Dove Creek) 12 1.5 5.0 3.51 Oliver (Dove Creek) 13 2.0 7.0 5.01 Oliver (Dove Creek) 14 2.2 5.5 3.31 Oliver (Dove Creek) 15 1.5 6.0 4.51 Oliver (Dove Creek) 16 2.5 5.7 3.21 Oliver (Dove Creek) 17 1.5 2.6 1.11 Oliver (Dove Creek) 18 2.0 5.8 3.81 Oliver (Dove Creek) 18 2.0 5.8 3.81 Oliver (Dove Creek) 19 2.5 5.7 3.21 Oliver (Dove Creek) 20 1.5 6.5 5.01 Oliver (Dove Creek) 21 3.0 6.5 3.51 Oliver (Dove Creek) 22 2.5 6.0 3.51 Oliver (Dove Creek) 23 2.4 5.7 3.31 Oliver (Dove Creek) 24 2.5 5.9 3.41 Oliver (Dove Creek) 25 2.5 3.3 0.81 Oliver (Dove Creek) 26 2.0 2.5 0.51 Oliver (Dove Creek) 27 2.0 2.5 0.51 Oliver (Dove Creek) 28 1.7 2.0 0.31 Oliver (Dove Creek) 29 3.5 4.5 1.01 Oliver (Dove Creek) 30 1.5 2.5 1.01 Oliver (Dove Creek) 31 0.8 1.1 0.31 Oliver (Dove Creek) 32 2.7 6.0 3.31 Oliver (Dove Creek) 33 2.7 6.0 3.31 Oliver (Dove Creek) 34 3.0 4.5 1.51 Oliver (Dove Creek) 35 3.5 4.5 1.01 Oliver (Dove Creek) 36 3.4 4.1 0.71 Oliver (Dove Creek) 37 2.8 3.3 0.51 Oliver (Dove Creek) 38 3.3 5.3 2.01 Oliver (Dove Creek) 39 3.3 5.5 2.21 Oliver (Dove Creek) 40 3.7 7.5 3.81 Oliver (Dove Creek) 41 4.5 8.5 4.01 Oliver (Dove Creek) 42 5.0 8.5 3.51 Oliver (Dove Creek) 43 4.0 4.5 0.5
Sediment sampling at Oliver, Olin, and Martin lakes
Site Number Lake (Area) Point IDWater Depth
Total Depth
Sediment Depth
1 Oliver (Dove Creek) 44 4.5 8.5 4.01 Oliver (Dove Creek) 45 5.0 9.5 4.51 Oliver (Dove Creek) 46 5.5 7.5 2.02 Oliver Lake 47 2.0 2.5 0.52 Oliver Lake 48 2.1 5.0 2.92 Oliver Lake 49 2.0 4.8 2.82 Oliver Lake 50 2.3 3.3 1.02 Oliver Lake 51 1.4 2.8 1.42 Oliver Lake 52 1.2 1.4 0.22 Oliver Lake 53 1.4 2.3 0.92 Oliver Lake 54 1.5 4.3 2.82 Oliver Lake 55 1.2 1.6 0.42 Oliver Lake 56 3.5 5.2 1.72 Oliver Lake 57 3.2 7.5 4.32 Oliver Lake 58 3.5 7.2 3.72 Oliver Lake 59 2.0 2.5 0.52 Oliver Lake 60 3.5 8.5 5.02 Oliver Lake 61 3.5 6.5 3.02 Oliver Lake 62 2.3 6.0 3.72 Oliver Lake 62 2.3 6.0 3.72 Oliver Lake 63 1.8 3.0 1.22 Oliver Lake 64 1.8 2.2 0.42 Oliver Lake 65 2.0 2.8 0.82 Oliver Lake 66 4.0 7.0 3.02 Oliver Lake 67 4.2 6.0 1.82 Oliver Lake 68 2.0 2.5 0.52 Oliver Lake 69 2.0 2.8 0.82 Oliver Lake 70 2.3 3.5 1.22 Oliver Lake 71 4.0 6.2 2.22 Oliver Lake 72 2.5 5.5 3.02 Oliver Lake 73 2.0 2.5 0.52 Oliver Lake 74 1.1 3.2 2.13 Olin (Outlet to Oliver) 75 3.5 4.0 0.53 Olin (Outlet to Oliver) 76 2.7 2.7 0.03 Olin (Outlet to Oliver) 77 2.7 2.9 0.23 Olin (Outlet to Oliver) 78 3.2 3.2 0.03 Olin (Outlet to Oliver) 79 2.7 2.7 0.03 Olin (Outlet to Oliver) 80 2.0 3.0 1.03 Olin (Outlet to Oliver) 81 3.2 3.2 0.03 Olin (Outlet to Oliver) 82 2.4 2.4 0.03 Olin (Outlet to Oliver) 83 2.5 2.5 0.04 Oliver (Bert Hart Ditch) 84 0.5 1.5 1.04 Oliver (Bert Hart Ditch) 85 1.8 1.8 0.04 Oliver (Bert Hart Ditch) 86 2.0 2.1 0.14 Oliver (Bert Hart Ditch) 87 1.3 1.5 0.2
Sediment sampling at Oliver, Olin, and Martin lakes
Site Number Lake (Area) Point IDWater Depth
Total Depth
Sediment Depth
4 Oliver (Bert Hart Ditch) 88 0.8 1.1 0.34 Oliver (Bert Hart Ditch) 89 0.6 1.7 1.14 Oliver (Bert Hart Ditch) 90 0.9 2.1 1.24 Oliver (Bert Hart Ditch) 91 1.2 2.4 1.24 Oliver (Bert Hart Ditch) 92 1.0 1.4 0.44 Oliver (Bert Hart Ditch) 93 0.8 1.3 0.54 Oliver (Bert Hart Ditch) 94 1.1 1.1 0.04 Oliver (Bert Hart Ditch) 95 1.0 1.0 0.04 Oliver (Bert Hart Ditch) 96 0.9 0.9 0.04 Oliver (Bert Hart Ditch) 97 0.9 1.0 0.14 Oliver (Bert Hart Ditch) 98 1.0 1.3 0.34 Oliver (Bert Hart Ditch) 99 1.0 1.0 0.04 Oliver (Bert Hart Ditch) 100 1.0 1.2 0.24 Oliver (Bert Hart Ditch) 101 1.0 1.1 0.14 Oliver (Bert Hart Ditch) 102 1.0 1.0 0.04 Oliver (Bert Hart Ditch) 103 1.0 1.0 0.04 Oliver (Bert Hart Ditch) 104 1.0 1.2 0.24 Oliver (Bert Hart Ditch) 105 1.0 1.5 0.54 Oliver (Bert Hart Ditch) 106 1.0 1.6 0.64 Oliver (Bert Hart Ditch) 106 1.0 1.6 0.64 Oliver (Bert Hart Ditch) 107 1.0 1.1 0.14 Oliver (Bert Hart Ditch) 108 1.0 1.2 0.24 Oliver (Bert Hart Ditch) 109 1.2 1.3 0.14 Oliver (Bert Hart Ditch) 110 1.2 1.3 0.14 Oliver (Bert Hart Ditch) 111 1.0 1.3 0.34 Oliver (Bert Hart Ditch) 112 1.1 1.2 0.14 Oliver (Bert Hart Ditch) 113 1.2 1.3 0.14 Oliver (Bert Hart Ditch) 114 1.2 1.2 0.07 Martin (Inlet) 115 1.0 1.4 0.47 Martin (Inlet) 116 0.6 6.1 5.57 Martin (Inlet) 117 1.1 8.0 6.97 Martin (Inlet) 118 2.5 8.6 6.17 Martin (Inlet) 119 1.5 7.4 5.97 Martin (Inlet) 120 2.5 8.1 5.67 Martin (Inlet) 121 2.1 10.0 7.97 Martin (Inlet) 122 3.3 10.0 6.77 Martin (Inlet) 123 1.0 8.0 7.07 Martin (Inlet) 124 2.1 6.0 3.97 Martin (Inlet) 125 3.2 5.0 1.87 Martin (Inlet) 126 3.9 10.0 6.17 Martin (Inlet) 127 2.0 10.0 8.07 Martin (Inlet) 128 3.5 10.0 6.56 Martin (Outlet to Olin) 129 2.5 5.8 3.36 Martin (Outlet to Olin) 130 2.9 3.0 0.16 Martin (Outlet to Olin) 131 2.8 3.5 0.7
Sediment sampling at Oliver, Olin, and Martin lakes
Site Number Lake (Area) Point IDWater Depth
Total Depth
Sediment Depth
6 Martin (Outlet to Olin) 132 1.5 2.0 0.56 Martin (Outlet to Olin) 133 2.7 2.8 0.16 Martin (Outlet to Olin) 134 2.8 3.0 0.26 Martin (Outlet to Olin) 135 3.4 3.7 0.36 Martin (Outlet to Olin) 136 3.1 4.1 1.06 Martin (Outlet to Olin) 137 4.0 5.3 1.36 Martin (Outlet to Olin) 138 4.0 5.2 1.26 Martin (Outlet to Olin) 139 5.8 6.7 0.96 Martin (Outlet to Olin) 140 0.8 0.8 0.05 Olin (Inlet from Martin) 141 3.1 3.6 0.55 Olin (Inlet from Martin) 142 2.3 3.5 1.25 Olin (Inlet from Martin) 143 2.5 3.9 1.45 Olin (Inlet from Martin) 144 3.1 4.0 0.95 Olin (Inlet from Martin) 145 3.0 5.0 2.05 Olin (Inlet from Martin) 146 3.2 5.2 2.05 Olin (Inlet from Martin) 147 2.8 5.1 2.35 Olin (Inlet from Martin) 148 3.0 5.0 2.05 Olin (Inlet from Martin) 149 3.0 5.7 2.75 Olin (Inlet from Martin) 150 1.9 4.1 2.25 Olin (Inlet from Martin) 150 1.9 4.1 2.25 Olin (Inlet from Martin) 151 3.0 5.8 2.85 Olin (Inlet from Martin) 152 2.9 3.4 0.55 Olin (Inlet from Martin) 153 3.0 4.2 1.25 Olin (Inlet from Martin) 154 3.0 4.5 1.55 Olin (Inlet from Martin) 155 3.0 4.9 1.95 Olin (Inlet from Martin) 156 3.0 4.5 1.5
Oliver, Olin, and Martin lakes sediment samplingTotal Area Sampled
Site No. Area (ac)1 0.772 0.573 0.014 0.145 0.046 0.047 0.02
APPENDIX J
POTENTIAL FUNDING SOURCES
OLIVER, OLIN, AND MARTIN LAKES DIAGNOSTIC STUDY LAGRANGE COUNTY, INDIANA
Appendix I. Potential Funding Sources. There are several cost-share grants available from both state and federal government agencies specific to watershed management. Community groups and/or Soil and Water Conservation Districts can apply for the majority of these grants. The main goal of these grants and other funding sources is to improve water quality though the use of specific BMPs. As public awareness shifts towards watershed management, these grants will become more and more competitive. Therefore, any association interested in improving water quality through the use of grants must become active soon. Once an association is recognized as a “watershed management activist” it will become easier to obtain these funds repeatedly. The following are some of the possible major funding sources available to lake and watershed associations for watershed management. Lake and River Enhancement Program (LARE) LARE is administered by the Indiana Department of Natural Resources, Division of Fish and Wildlife. The program’s main goals are to control sediment and nutrient inputs to lakes and streams and prevent or reverse degradation from these inputs through the implementation of corrective measures. Under present policy, the LARE program may fund lake and watershed specific construction actions up to $100,000 for a single project or $300,000 for all projects on a lake or stream. The LARE program also provides a maximum of $100,000 for the removal of sediment from a particular site on a lake and a cumulative total of $300,000 for all sediment removal projects on a lake. An approved sediment removal plan must be on file with the LARE office for projects to receive sediment removal funding. The LARE program will provide $100,000 for a one-time whole lake treatment to control aggressive, invasive aquatic plants. A cumulative total of $20,000 over a three year period may be obtained for additional spot treatment following the whole lake treatment. Additionally, aquatic plant management grants are available for up to $20,000 per year per lake for spot treatment when whole lake treatment is not appropriate. As with the sediment removal funding, an approved aquatic plant management plan must be on file with the LARE office for the lake association to receive funding. All approved projects require a 10 to 25% cash or in-kind match, depending on the project. LARE also has a “watershed land treatment” component that can provide grants to SWCDs for multi-year projects. The funds are available on a cost-sharing basis with landowners who implement various BMPs. All of the LARE programs are recommended as a project funding source for the Pretty Lake watershed. More information about the LARE program can be found at http://www.in.gov/dnr/fishwild/lare/. Clean Water Act Section 319 Nonpoint Source Pollution Management Grant The 319 Grant Program is administered by the Indiana Department of Environmental Management (IDEM), Office of Water Management, Watershed Management Section. 319 is a federal grant made available by the Environmental Protection Agency (EPA). 319 grants fund projects that target nonpoint source water pollution. Nonpoint source pollution (NPS) refers to pollution originating from general sources rather than specific discharge points (Olem and Flock, 1990). Sediment, animal and human waste, nutrients, pesticides, and other chemicals resulting from land use activities such as
mining, farming, logging, construction, and septic fields are considered NPS pollution. According to the EPA, NPS pollution is the number one contributor to water pollution in the United States. To qualify for funding, the water body must meet specific criteria such as being listed in the state’s 305(b) report as a high priority water body or be identified by a diagnostic study as being impacted by NPS pollution. Funds can be requested for up to $300,000 for individual projects. There is a 25% cash or in-kind match requirement. To qualify for implementation projects, there must be a watershed management plan for the receiving waterbody. This plan must meet all of the current 319 requirements. This diagnostic study serves as an excellent foundation for developing a watershed management plan since it satisfies several, but not all, of the 319 requirements for a watershed management plan. More information about the Section 319 program can be obtained from http://www.in.gov/idem/water/planbr/wsm/319main.html. Section 104(b)(3) NPDES Related State Program Grants Section 104(b)(3) of the Clean Water Act gives authority to a grant program called the National Pollutant Discharge Elimination System (NPDES) Related State Program Grants. These grants provide money for developing, implementing, and demonstrating new concepts or requirements that will improve the effectiveness of the NPDES permit program that regulates point source discharges of water pollution. Projects that qualify for Section 104(b)(3) grants involve water pollution sources and activities regulated by the NPDES program. The awarded amount can vary by project and there is a required 5% match. For more information on Section 104(b)(3) grants, please see the IDEM website at: http://www.in.gov/idem/water/planbr/wsm/104main.html. Section 205(j) Water Quality Management Planning Grants Funds allocated by Section 205(j) of the Clean Water Act are granted for water quality management planning and design. Grants are given to municipal governments, county governments, regional planning commissions, and other public organizations for researching point and non-point source pollution problems and developing plans to deal with the problems. According to the IDEM Office of Water Quality website: “The Section 205(j) program provides for projects that gather and map information on non-point and point source water pollution, develop recommendations for increasing the involvement of environmental and civic organizations in watershed planning and implementation activities, and implement watershed management plans. No match is required. For more information on and 205(j) grants, please see the IDEM website at: http://www.in.gov/idem/water/planbr/wsm/205jmain.html. Other Federal Grant Programs The USDA and EPA award research and project initiation grants through the U.S. National Research Initiative Competitive Grants Program and the Agriculture in Concert with the Environment Program. Watershed Protection and Flood Prevention Program The Watershed Protection and Flood Prevention Program is funded by the U.S. Department of Agriculture and is administered by the Natural Resources Conservation
Service. Funding targets a variety of watershed activities including watershed protection, flood prevention, erosion and sediment control, water supply, water quality, fish and wildlife habitat enhancement, wetlands creation and restoration, and public recreation in small watersheds (250,000 or fewer acres). The program covers 100% of flood prevention construction costs or 50% of construction costs for agricultural water management, recreational, or fish and wildlife projects.
Conservation Reserve Program The Conservation Reserve Program (CRP) is funded by the USDA and administered by the Farm Service Agency (FSA). CRP is a voluntary, competitive program designed to encourage farmers to establish vegetation on their property in an effort to decrease erosion, improve water quality, or enhance wildlife habitat. The program targets farmed areas that have a high potential for degrading water quality under traditional agricultural practices or areas that might make good wildlife habitat if they were not farmed. Such areas include highly erodible land, riparian zones, and farmed wetlands. Currently, the program offers continuous sign-up for practices like grassed waterways and filter strips. Participants in the program receive cost share assistance for any plantings or construction as well as annual payments for any land set aside. Wetlands Reserve Program The Wetlands Reserve Program (WRP) is funded by the USDA and is administered by the NRCS. WRP is a subsection of the Conservation Reserve Program. This voluntary program provides funding for the restoration of wetlands on agricultural land. To qualify for the program, land must be restorable and suitable for wildlife benefits. This includes farmed wetlands, prior converted cropland, farmed wet pasture, farmland that has become a wetland as a result of flooding, riparian areas which link protected wetlands, and the land adjacent to protected wetlands that contribute to wetland functions and values. Landowners may place permanent or 30-year easements on land in the program. Landowners receive payment for these easement agreements. Restoration cost-share funds are also available. No match is required. Grassland Reserve Program The Grassland Reserve Program (GRP) is funded by the USDA and is administered by the NRCS. GRP is a voluntary program that provides funding the restoration or improvement of natural grasslands, rangelands, prairies or pastures. To qualify for the program the land must consist of at least a 40 acre contiguous tract of land, be restorable, and provide water quality or wildlife benefit. Landowners may enroll land in the Grassland Reserve Program for 10, 15, 20, or 30 years or enter their land into a 30-year permanent easement. Landowners receive payment of up to 75% of the annual grazing value. Restoration cost-share funds of up to 75% for restored or 90% for virgin grasslands are also available. Community Forestry Grant Program The U.S. Forest Service through the Indiana Department of Natural Resources Division of Forestry provides three forms of funding for communities under the Community Forestry Grant Program. Urban Forest Conservation Grants (UFCG) are designed to help communities develop long term programs to manage their urban forests. UFCG funds are provided to communities to improve and protect trees and other natural resources; projects that target program development, planning, and education are emphasized. Local municipalities, not-for-profit organizations, and state agencies can apply for $2,000-20,000 annually. The second type of Community Forestry Grant Program, the Arbor Day Grant Program, funds activities which promote Arbor Day efforts and the planting and care of urban trees. $500-1000 grants are generally
awarded. The Tree Steward Program is an educational training program that involves six training sessions of three hours each. The program can be offered in any county in Indiana and covers a variety of tree care and planting topics. Generally, $500-1000 is available to assist communities in starting a county or regional Tree Steward Program. Each of these grants requires an equal match. Forest Land Enhancement Program (FLEP) FLEP replaces the former Forestry Incentive Program. It provides financial, technical, and educational assistance to the Indiana Department of Natural Resources Division of Forestry to assist private landowners in forestry management. Projects are designed to enhance timber production, fish and wildlife habitat, soil and water quality, wetland and recreational resources, and aesthetic value. FLEP projects include implementation of practices to protect and restore forest lands, control invasive species, and preserve aesthetic quality. Projects may also include reforestation, afforestation, or agroforestry practices. The IDNR Division of Forestry has not determined how they will implement this program; however, their website indicates that they are working to determine their implementation and funding procedures. More information can be found at http://www.in.gov/dnr/forestry. Wildlife Habitat Incentive Program The Wildlife Habitat Incentive Program (WHIP) is funded by the USDA and administered by the NRCS. This program provides support to landowners to develop and improve wildlife habitat on private lands. Support includes technical assistance as well cost sharing payments. Those lands already enrolled in WRP are not eligible for WHIP. The match is 25%. Environmental Quality Incentives Program The Environmental Quality Incentives Program (EQIP) is a voluntary program designed to provide assistance to producers to establish conservation practices in target areas where significant natural resource concerns exist. Eligible land includes cropland, rangeland, pasture, and forestland, and preference is given to applications which propose BMP installation that benefits wildlife. EQIP offers cost-share and technical assistance on tracts that are not eligible for continuous CRP enrollment. Certain BMPs receive up to 75% cost-share. In return, the producer agrees to withhold the land from production for five years. Practices that typically benefit wildlife include: grassed waterways, grass filter strips, conservation cover, tree planting, pasture and hay planting, and field borders. Best fertilizer and pesticide management practices, innovative approaches to enhance environmental investments like carbon sequestration or market-based credit trading, and groundwater and surface water conservation are also eligible for EQIP cost-share. Small Watershed Rehabilitation Program The Small Watershed Rehabilitation Program provides funding for rehabilitation of aging small watershed impoundments that have been constructed within the last 50 years. This program is newly funded through the 2002 Farm Bill and is currently under
development. More information regarding this and other Farm Bill programs can be found at http://www.usda.gov/farmbill. Farmland Protection Program The Farmland Protection Program (FPP) provides funds to help purchase development rights in order to keep productive farmland in use. The goals of FPP are: to protect valuable, prime farmland from unruly urbanization and development; to preserve farmland for future generations; to support a way of life for rural communities; and to protect farmland for long-term food security. Debt for Nature Debt for Nature is a voluntary program that allows certain FSA borrowers to enter into 10-year, 30-year, or 50-year contracts to cancel a portion of their FSA debts in exchange for devoting eligible acreage to conservation, recreation, or wildlife practices. Eligible acreage includes: wetlands, highly erodible lands, streams and their riparian areas, endangered species or significant wildlife habitat, land in 100-year floodplains, areas of high water quality or scenic value, aquifer recharge zones, areas containing soil not suited for cultivation, and areas adjacent to or within administered conservation areas. Partners for Fish and Wildlife Program The Partners for Fish and Wildlife Program (PFWP) is funded and administered by the U.S. Department of the Interior through the U.S. Fish and Wildlife Service. The program provides technical and financial assistance to landowners interested in improving native habitat for fish and wildlife on their land. The program focuses on restoring wetlands, native grasslands, streams, riparian areas, and other habitats to natural conditions. The program requires a 10-year cooperative agreement and a 1:1 match. North American Wetland Conservation Act Grant Program The North American Wetland Conservation Act Grant Program (NAWCA) is funded and administered by the U.S. Department of Interior. This program provides support for projects that involve long-term conservation of wetland ecosystems and their inhabitants including waterfowl, migratory birds, fish, and other wildlife. The match for this program is on a 1:1 basis. National Fish and Wildlife Foundation (NFWF) The National Fish and Wildlife Foundation is administered by the U.S. Department of the Interior. The program promotes healthy fish and wildlife populations and supports efforts to invest in conservation and sustainable use of natural resources. The NFWF targets six priority areas which are wetland conservation, conservation education, fisheries, neotropical migratory bird conservation, conservation policy, and wildlife and habitat. The program requires a minimum of a 1:1 match. More information can be found at http://www.nfwf.org/about.htm. Bring Back the Natives Grant Program
Bring Back the Natives Grant Program (BBNG) is a NFWF program that provides funds to restore damaged or degraded riverine habitats and the associated native aquatic species. Generally, BBNP supports on the ground habitat restoration projects that benefit native aquatic species within their historic range. Funding is jointly provided by a variety of federal organizations including the U.S. Fish and Wildlife Service, Bureau of Land Management, and U.S. Department of Agriculture and the National Fish and Wildlife Foundation. Typical projects include those that revise land management practices to remove the cause of habitat degradation, provide multiple specie benefit, include multiple project partners, and are innovative solutions that assist in the development of new technology. A 1:1 match is required; however, a 2:1 match is preferred. More information can be obtained from http://www.nfwf.org. Native Plant Conservation Initiative The Native Plant Conservation Initiative (NPCI) supplies funding for projects that protect, enhance, or restore native plant communities on public or private land. This NFWF program typically funds projects that protect and restore of natural resources, inform and educate the surrounding community, and assess current resources. The program provides nearly $450,000 in funding opportunities annually awarding grants ranging from $10,000-50,000 each. A 1:1 match is required for this grant. More information can be found at http://www.nfwf.org/programs/grant_apply.htm. Freshwater Mussel Fund The National Fish and Wildlife Foundation and the U.S. Fish and Wildlife Service fund the Freshwater Mussel Fund which provides funds to protect and enhance freshwater mussel resources. The program provides $100,000 in funding to approximately 5-10 applicants annually. More information can be found at http://www.nfwf.org/programs/grant_apply.htm. Non-Profit Conservation Advocacy Group Grants Various non-profit conservation advocacy groups provide funding for projects and land purchases that involve resource conservation. Ducks Unlimited and Pheasants Forever are two such organizations that dedicate millions of dollars per year to projects that promote and/or create wildlife habitat. U.S. Environmental Protection Agency Environmental Education Program The USEPA Environmental Education Program provides funding for state agencies, non-profit groups, schools, and universities to support environmental education programs and projects. The program grants nearly $200,000 for projects throughout Illinois, Indiana, Michigan, Minnesota, Wisconsin, and Ohio. More information is available at http://www.epa.gov/region5/ened/grants.html. Core 4 Conservation Alliance Grants Core 4 provides funding for public/private partnerships working toward Better Soil, Cleaner Water, Greater Profits and a Brighter Future. Partnerships must consist of agricultural producers or citizens teaming with government representatives, academic
institutions, local associations, or area businesses. CTIC provides grants of up to $2,500 to facilitate organizational or business plan development, assist with listserve or website development, share alliance successes through CTIC publications and other national media outlets, provide Core 4 Conservation promotional materials, and develop speakers list for local and regional use. More information on Core 4 Conservation Alliance grants can be found at http://www.ctic.purdue.edu/CTIC/GrantApplication.pdf. Indianapolis Power and Light Company (IPALCO) Golden Eagle Environmental Grant The IPALCO Golden Eagle Grant awards grants of up to $10,000 to projects that seek improve, preserve, and protect the environment and natural resources in the state of Indiana. The award is granted to approximately 10 environmental education or restoration projects each year. Deadline for funding is typically in January. More information is available at http://www.ipalco.com/ABOUTIPALCO/Environment/Golden_Eagle.html Nina Mason Pulliam Charitable Trust (NMPCT) The NMPCT awards various dollar amounts to projects that help people in need, protect the environment, and enrich community life. Prioritization is given to projects in the greater Phoenix, AZ and Indianapolis, IN areas, with secondary priority being assigned to projects throughout Arizona and Indiana. The trust awarded nearly $20,000,000 in funds in the year 2000. More information is available at www.nmpct.org