IDA Document D-5279 January 2015 O&M Cost Modeling for the Department of Defense Brian G. Gladstone, Project Leader Brandon R. Gould Karen L. Johnson Log: H 14-000973 INSTITUTE FOR DEFENSE ANALYSES 4850 Mark Center Drive Alexandria, Virginia 22311-1882 INSTITUTE FOR DEFENSE ANALYSES Approved for public release; distribution is unlimited.
Transcript
IDA Document D-5279
January 2015
O&M Cost Modeling for the Department of Defense
Brian G. Gladstone, Project LeaderBrandon R. GouldKaren L. Johnson
Log: H 14-000973
INSTITUTE FOR DEFENSE ANALYSES4850 Mark Center Drive
Alexandria, Virginia 22311-1882
I N S T I T U T E F O R D E F E N S E A N A L Y S E S
Approved for public release;distribution is unlimited.
About this PublicationThis work was conducted by the Institute for Defense Analyses (IDA) under contract DASW01-04-C-0003, Task AO-7-3688, “O&M Cost Modeling for the Department of Defense,” for the Director, Acquisition Resources and Analysis. The views, opinions, and findings should not be construed as representing the official position of either the Department of Defense or the sponsoring organization.
AcknowledgmentsThank you to Daniel L. Cuda and R. Royce Kneece for performing technical review of this document.
This material may be reproduced by or for the U.S. Government pursuant to the copyright license under the clause at DFARS 252.227-7013 (a)(16) [June 2013].
IDA Document D-5279
O&M Cost Modeling for the Department of Defense
Brian G. Gladstone, Project LeaderBrandon R. GouldKaren L. Johnson
I N S T I T U T E F O R D E F E N S E A N A L Y S E S
Executive Summary
The Office of the Under Secretary of Defense for Acquisition, Technology and Logistics (OUSD(AT&L)) asked the Institute for Defense Analyses (IDA) to evaluate and update their Operations and Maintenance (O&M) cost model. They also requested that IDA develop and provide an automated tool, based on their original cost model, to generate future O&M cost estimates. This report presents the cost model’s O&M cost estimates over the Future Years Defense Program (FYDP) based on the Fiscal Year (FY) 2015 President’s Budget (PB15) and compares those projections to the Military Services’ and the Department of Defense (DoD) PB15 submissions. We do not extensively discuss the automated tool provided to AT&L, which was delivered under separate cover.
During the course of this research, IDA made improvements to the legacy cost model maintained by OUSD(AT&L), which included changes to estimation methodologies and force distribution variables that are discussed in subsequent slides and the appendixes. These changes result in O&M models with stronger statistical measures, and, by extension, logical projections of future O&M costs. Despite these O&M model improvements, it is important to note that the validity of O&M forecasts in this document still assumes that the historical relationships between O&M cost, military end strength, and global posture are maintained into the future.
In the aggregate, these improved O&M cost model forecasts1 are consistently higher than DoD O&M funding requests in PB15.2 The top-level DoD O&M cost model forecasts that DoD will spend at least ~$200 billion more O&M funding than PB15 requests during FY 2015–FY 2019. This difference increases to ~$425 billion if Overseas Contingency Operations (OCO) requests and placeholders are not received by the Department. O&M models for the Services forecast that the Services will spend at least ~$100 billion more O&M funding than PB15 requests during FY 2015–FY 2019. This difference increases to ~$285 billion if OCO requests and placeholders are not received by the Services. These results indicate that there may be significant risk in DoD’s FY 2015–FY 2019 O&M funding requests. Historically, shortfalls in O&M funding are covered by shifting resources from the Department’s investment accounts or reductions in operational readiness.
1 Models assume end strength from PB15 and expected global posture (discussed later). 2 DoD’s and the Office of Management and Budget’s (OMB) O&M OCO requests and placeholders have
been added to the base budget request.
Contents
1. O&M Cost Modeling for the Department of Defense .................................................1 2. Background ..................................................................................................................3 3. O&M Model Methodology ..........................................................................................5 4. Baseline DoD Future End Strength Distribution .......................................................11 5. Total DoD O&M Projection Comparison .................................................................13 6. Combined Services O&M Projection Comparison ...................................................15 7. Service Level Buildup O&M Projection Comparison ...............................................17 8. Summary O&M Model Results .................................................................................19 9. Conclusions ...............................................................................................................21 Appendix A. Summary Statistics for Model Variables .................................................. A-1 Appendix B. Calculation of Force Distribution Variables ...............................................B-1 Appendix C. Service-Specific O&M Projections ............................................................C-1 References ....................................................................................................................... D-1 Abbreviations ................................................................................................................... E-1
1. O&M Cost Modeling for the Department of Defense
O&M Cost Modeling for the Department of Defense
Project AO-7-3688
5 May 2014
Project Leader: Mr. Brian GladstoneTeam: Mr. Brandon Gould & Ms. Karen Johnson
This document is an annotated version of a briefing prepared by the Institute for Defense Analyses (IDA) for the Office of the Under Secretary of Defense for Acquisition, Technology and Logistics (OUSD(AT&L)). The briefing was delivered to the sponsor, the OUSD(AT&L) office in Acquisition Resources and Analysis (ARA), on May 6, 2014. It presents Operations and Maintenance (O&M) cost estimates for the DoD and the Services as well as a cost model to evaluate future O&M costs. In addition to this report, an automated tool for generating future O&M cost estimates was delivered to ARA under separate cover.
2. Background
Background
Operations and maintenance (O&M) funds: operating forces, central logistics, departmental management, force installations, central training, command and intelligence, communications and information infrastructure, acquisition infrastructure, defense health program, and other benefit programs
O&M is approximately 40 percent of the DoD topline (and its percentage is increasing)
DoD/Services have a spotty record of projecting O&M in the Future Years Defense Program (FYDP)
In 2006, OSD-AT&L developed a statistical model to explain historical O&M expenditures and evaluate the realism of projected O&M budgets This model has a better track record of projecting top-level O&M
expenditures in the FYDP than DoD/Service projections (including budget year projections)
10 September 2014 2
The OUSD(AT&L) asked IDA to evaluate and update a model for projecting future O&M expenditures and develop an automated O&M estimating tool for use by AT&L staff. O&M expenditures are of particular interest to OUSD(AT&L) because they are a large and growing component of the DoD topline. In the President’s Budget for fiscal year 2015 (PB15), O&M expenditures are the single largest funding title, accounting for 45 percent of the total DoD budget in Fiscal Year (FY) 2014. This is up from 40 percent of the DoD topline throughout much of the 2000s.
O&M funding supports a wide variety of day-to-day activities, such as individual and military unit training, equipment maintenance, base operations and facilities sustainment, personnel acquisition and management, and certain administrative and Service-wide activities. Despite the size and importance of the O&M account, expenditures were consistently greater than cost projections during the past two decades of Future Years Defense Program (FYDP) submissions. This behavior results in risk to military readiness, continuity of core DoD activities, and investment programs (i.e.,
procurement and research, development, test and evaluation (RDT&E)), since all of these accounts have been historical “bill-payers” for O&M shortfalls when DoD budgets are decreasing and supplemental funding is scarce.
Recently, O&M shortfalls have been corrected in supplemental budget requests. During Operation Enduring Freedom (OEF), Operation Iraqi Freedom (OIF), and its successor Operation New Dawn (OND), supplemental funding for Overseas Contingency Operations (OCO) has funded a significant percentage of total O&M expenditures. As these contingency operations come to a close, and military personnel return to the United States, the availability of OCO or other supplemental funding is uncertain. Additionally, recent fiscal pressures on the DoD topline, and the federal government, constrain budgetary flexibility. These current conditions necessitate accurate DoD base budget O&M cost estimates to ensure military readiness, continuity of core DoD activities, and minimal disruptions to investment programs.
In 2006, OUSD(AT&L) developed O&M cost models that use military end strength and global posture (as proxies for operations tempo (OPTEMPO)) to estimate Service and DoD O&M costs. Historically, this model’s FYDP O&M estimates were more accurate than Service and DoD FYDP cost projections in predicting O&M expenditures over the FYDP.
3. O&M Model Methodology
O&M Model Methodology• Total O&M can be predicted using:
• Calculated O&M growth factor per active military end strength• US end strength (excluding Guard and Reserve)• End strength at permanent bases (NATO-Japan/Korea, etc.)• Deployed end strength
• FYDP expenditures were calculated using the following • Future end strength by Service from PB 2015• Anticipated global end strength distribution from public sources• Other hypothetical end strength levels and global end strength distribution scenarios
• The O&M model has:• Used Green Book Deflators• Estimated variable coefficients simultaneously• Evaluated multiple time periods & variable specifications
• Equations presented have the “best” statistical fit with data, are consistent with other results/tests, and have been selected based on historical prediction ability
1977-2013: O&M(K$)=1.033y *(55.9*C + 50.4*O + 126.3*D)M = Total Active ManpowerC = Manpower in US + TerritoriesO = Manpower in NATO countries + Japan + KoreaD = Manpower Deployed = M – ( C + O); y = Year index = future year – 1976
Growth coefficient Cost per personnel coefficients
*Manpower data taken from DMDC databaseNote: some versions of the model consolidate end strength variables into inside US (C) vs. outside US (O+D) or total force levels (C+O+D)
The equations used for prediction of top-level DoD O&M have the following form
Strategic-level inputs
The O&M model described in the slide above, as well as its AT&L predecessors, estimates O&M expenditures based upon two types of variables: an O&M per person growth factor and the end strength/global posture of the active duty military. Both end strength and global posture variables serve as OPTEMPO proxies since they respond to the demands on the military in a similar manner. For most Service O&M cost estimates, and the top-level DoD O&M estimate, these variables statistically explain more than 90 percent of the historical variability in O&M expenditures since the 1970s (shown later).
The O&M per active duty military end strength growth factor is the first component of the O&M model. Surprisingly, the long-run average macroscopic DoD growth factor has been relatively stable at about 3.5 percent per year per active duty end strength, when global posture is also considered (see regression results on page 13). Substantial annual historical O&M cost changes are mathematically explained by this real-growth factor; however, the underlying causes of this growth are complex. Example components of this
cost growth factor may include changes in: (1) military technology (old versus new); (2) military benefits; (3) military readiness; (4) DoD business practices; (5) external markets; (6) accounting and budgeting practices; (7) the cost or amount of equipment per active duty military end strength; and (8) changing military practices (i.e., conversion to an all-volunteer force, use of contractors in lieu of military personnel (e.g., contractor logistics support), etc.). Perceived real O&M growth per active duty military end strength can also be the result of errors in proscribed inflation indexes.
In addition, this growth can arise from “beneficial” and “detrimental” changes to military operations, investments, personnel, and more. For example, manpower reductions resulting from a more efficient military (perhaps due to more complex and expensive equipment) can cause the O&M rate (O&M cost/military end strength) to increase because military manpower (end strength) is shrinking in the denominator of this factor and the cost of the more complex equipment (which usually have greater O&M costs) is increasing in the numerator. However, this O&M cost growth may be offset by total cost savings elsewhere (such as in Military Personnel (MILPERS)), and may be considered “beneficial” to the Department. Conversely, O&M cost growth due to maintenance costs for aging facilities and equipment, new more expensive equipment (that does not have an impact on end strength), or other reasons may be considered “detrimental” by some. This report does not evaluate benefits or harms that accrue from increasing or decreasing O&M expenditures per man. Nor does it evaluate the relative magnitudes of beneficial versus detrimental O&M cost changes; it does not indicate whether the level of past, present, or future O&M funding was optimal for the DoD. Further investigations could examine these underlying causes and impacts in depth, but such analysis is beyond the scope of this paper.
Active duty military end strength and global posture variables are the second component of the O&M model. End strength, global posture, and OPTEMPO are all logically likely to change as a result of major military conflicts and tensions and are expected to be O&M cost drivers. In fact, the timing of actual O&M increases and decreases during 1962–2014 correlates well with wartime and peacetime, respectively (not shown). Each of these variables is also expected to cause an enterprise-wide effect on O&M costs. Although top-level measurements of end strength and global posture correlate with major military conflicts, aggregate OPTEMPO is significantly more difficult to measure at macroscopic levels over time.1 In addition, end strength and global posture are strategic input variables to DoD’s plans that are recorded, tracked, and predicted. They are measureable at any time and are not subjective.
1 Although there are measures of OPTEMPO available at lower levels (e.g., flight hours, steaming hours, fuel consumption, etc.), they are difficult to aggregate to the top levels for modeling purposes.
Although the general concept of estimating O&M with end strength and global posture variables remains from 2006, the composition of the variables has evolved. Previous versions of the O&M model estimate O&M using a growth factor and one of the following:
• End strength in the United States and end strength abroad
This paper’s version of the model uses three force distribution and end strength variables: (1) active duty military end strength in the United States, (2) active duty military end strength in permanent overseas bases (which include North Atlantic Treaty Organization (NATO) countries, Japan, and Korea), and (3) other active duty end strength deployed outside of the United States or permanent overseas bases. The mathematical descriptions of these variables can be found in Appendix B.
These force global distribution variables are selected because OPTEMPO, which is responsible for a large portion of O&M costs/person, should be different, on average, for each category. For instance, the enterprise-wide O&M cost per person of troops stationed in the United States and overseas bases should be less than for deployed forces because OPTEMPO is lower, and logistics and supporting infrastructure (headquarters, bases, etc.) are defined and less demanding. It is unknown whether US O&M cost per person is greater than permanent overseas base O&M cost per person, because the impact of host-nation support is not clear. Each of these hypotheses is generally supported by model estimates of O&M per-person cost coefficients (shown in the slide on page 5). It should be noted that the US O&M cost per person and the permanent overseas bases O&M cost per person coefficients are not statistically different from one another (their 95 percent confidence intervals overlap and their coefficients are similar).
Historical actual data for force global posture is available from Defense Manpower Data Center (DMDC) to develop the O&M models. Because DMDC does not provide global posture forecasts over the FYDP, force global posture estimates during 2015–2019 used in this paper are derived from publicly available sources, including statements by DoD officials, budget or planning documentation, and accounts in the news media.2 The
2 Forecasts of global posture are largely driven by changes in deployments in Afghanistan and Kuwait as well as troop movements from foreign overseas bases in Germany. Citations for these shifts are below. During the course of our research, we monitored publicly available sources. • Afghanistan: David Greene, Sean Carberry, and Tom Bowman, Afghans Want U.S. to Clarify
Troop Level Post 2014, NPR (April 5, 2013). During the course of the research, multiple publicly available sources predicted a commitment of roughly 10,000 troops to Afghanistan after the current drawdown. After the research team produced and delivered its final projections (shown in this briefing), the Obama administration announced a formal plan for the removal of troops from Afghanistan, which involved lower troop commitments than previously anticipated and used for
O&M cost model uses these data sources to produce logical estimates of future O&M costs. In addition, hypothetical end strength and force distribution scenarios during 2015–2019 are model inputs, used to perform “what if” O&M cost estimates. For instance, the lowest number of military deployments in recent times occurred in 1997. Using the end strength and global posture from 1997 as a model input to each year of the FYDP predicts a possible lower bound O&M cost estimate, and assumes that DoD behaviors, active military end strength, and worldwide distribution are similar to 1997 in the future.
The O&M models selected for this briefing are displayed on Slides 9–12 (pages 13 through 19). Numerous versions of the O&M model are evaluated in this paper, some of which are located in Appendix C. We selected models that had logical coefficients, promising descriptive statistics, and appeared to make robust forecasts over time.
The first model characteristic we evaluate is the length and duration of the O&M cost modeling time period. A cost modeling methodology is developed by systematically running multiple regressions using data from different historical time periods, comprising varying numbers of years. The 1977–2013 time period is selected because it is the era of the all-volunteer force, requires fewer data adjustments and standardizations than earlier time periods, and is robust in its forecasts.
Different force distribution variables are also evaluated including:
• “United States” and “abroad (two variables)
• “Deployed” and “non-deployed” (two variables)
• “Ashore” and “afloat” (two variables)
• Total DoD end strength (one variable)
It should be stressed that the O&M models described do not predict an optimal level of DoD or Service O&M funding. These O&M models forecast the Services’ and DoD’s likely O&M spending based on the relationship of historical O&M costs to historical global posture, active duty military head count, and O&M growth/person. These historical time periods include times of O&M funding abundance and times of suboptimal O&M funding practices (e.g., the hollow force era after Vietnam and the
projections. By the end of 2014, the administration’s plan calls for 9,800 troops in Afghanistan, falling to about 5,000 by 2016, and to a “normal embassy presence” thereafter. “DoD News,” U.S. Department of Defense, Claudette Roulo, “Hagel: Post-2014 Troop Level to Protect Afghan Progress,” American Forces Press Service (May 29, 2014), http://www.defense.gov/news /newsarticle.aspx?id=122362.
• Germany: Kristina Wong, “Army Lays Out Plans to Remove 80,000 Soldiers; Base Communities Brace for Impacts,” Washington Times (Jun. 25, 2013); Andrew Feickert, Army Drawdown and Restructuring: Background and Issues for Congress (Washington, DC: Congressional Research Service, March 5, 2013).
• Kuwait: Feickert, Army Drawdown and Restructuring.
“procurement holiday” era after the Cold War). In addition, these O&M models do not consider factors such as readiness and other variables that may change (e.g., Active Duty to Guard and Reserve ratios, changing readiness levels, new equipment, or concepts of operations). Thus, judgment that considers “real time” knowledge of DoD’s future plans must be used when interpreting, using, or modifying O&M estimates.
These O&M cost models are useful as starting points to evaluate official or proposed FYDP base-budgets or wartime O&M projections under various force structure and global posture scenarios. If there are significant differences between the O&M projections derived from these cost models and DoD’s or the Services’ estimates, it is useful to question assumptions to gain an understanding of why the future O&M/person relationships are expected to be different from the historical O&M/person relationships.
This paper evaluates whether future DoD or Service O&M cost projections, given a specified level of active duty military end strength and global posture (as a proxy for OPTEMPO), are consistent with expectations based on history.
Total 1,382,345 1,323,301 1,307,200 1,280,700 1,256,500 1,236,800 1,227,000
• Changes in end strength levels from PB 2015:• Army: reduction from 532,043 to 420,000 through 2019 • Navy: reduction from 323,951 to 315,718 through 2019• Marine Corps: reduction from 195,657 to 174,000 through 2019• Air Force: reduction from 330,694 to 303,852 through 2019
• Alternative scenario shifts “deployed” end strength in excess of the minimum historical deployment level (which occurred in 1997) to the U.S. for all future years
• End strength total from PB 15
• Force distribution from public sources
The slide above shows DoD FY 2013–FY 2019 end strength and global posture estimates that are used to project O&M during the FYDP in this paper. Adjustments are made to DMDC total end strength data because they are not consistent with total military end strength reported in PB15. Specifically, DMDC’s 2013 percentage of total end strength in the “United States,” “Permanent Overseas Bases,” and “Deployed” categories are applied to the historical 2013 total military end strength reported in PB15. Because DMDC has not yet reported global posture information for 2014, the ratios from 2013 were applied to the 2014 total end strength reported in PB15. The number of troops in the “United States,” “Permanent Overseas Bases,” and “Deployed” categories are then adjusted based on expectations reported in publicly available sources. End strength reductions projected in PB15 and the return of forces from Afghanistan to the United States constitute most of the change to future end strength projections. These same end
strength and global posture adjustments are applied to each of the four Services (data not shown). The expected Service end strength changes reported in PB15 are also shown in this slide.
As described previously, forecasts of O&M costs throughout the FYDP are also generated using 1997 end strength and global posture (~35,000 troops deployed) actuals. This develops “lower bound” O&M cost forecasts that are consistent with recent historical relationships between O&M, end strength, and global posture (and thus OPTEMPO).
The automated O&M model enables analysts to develop models and perform their own “what if” analyses by choosing regression eras and providing end strength/global posture forecasts.
5. Total DoD O&M Projection Comparison
Total DoD O&M Projection Comparison(includes Defense-wide O&M)
• Model predicts a $232 B shortfall in O&M budget starting in 2014 ($426 B w/out OCO)• Shifting deployed forces to United States reduces shortfall to $100 B (including OCO)• More than half of the shortfall is attributable to Defense-wide O&M
Model ($B) FY13 Delta FY14 Delta FY15 Delta FY16 Delta FY17 Delta FY18 Delta FY 19 Delta FY14-19 Total Delta
Three Variable Actual PB 2015 Projected Three Variable with Force Shift
Model Projected O&M
Actual O&M
Base O&M+OCO
O&M withmax shift
The graph on this slide shows actual top-level DoD O&M (solid green line) costs from 1977 through 2013 in billions of BY 2015 dollars, along with the model’s cost estimate (solid red line). DoD PB15 (dashed green line) and model forecasts (again displayed as a solid red line) are shown for the FYDP ending in 2019. FYDP estimates are based on expected global posture from adjusted DMDC data (described previously) and PB15 total end strength.
The “lower bound” O&M cost forecast (dotted red line), which is consistent with recent historical relationships between O&M, end strength, and global posture in 1997 (which had the minimum number of deployments in recent times), is also shown.
Actual DoD O&M cost and modeled O&M cost during 1977–2013 are similar; however, both the baseline O&M cost model and the “lower bound” O&M cost model
are higher than PB15 O&M requests (including OCO) in the FYDP.3 The O&M model forecasts that O&M will cost $232 billion more than PB15 requests (with expected OCO)4 over the FYDP; excluding DoD’s expected OCO increases this difference to $426 billion. The lower-bound estimate is $100 billion more than DoD’s PB15 request (including OCO).
In the slide on the previous page, much of the difference in O&M estimates during the FYDP is attributable to defense-wide O&M, which is difficult to model using end strength and global posture variables. The slide on page 15 depicts a model that removes defense-wide O&M and re-estimates O&M expenditures from 1977 through the FYDP.
3 The PB15 O&M request falls outside of the 90 percent confidence interval of the regression model based on historical data (data not shown).
4 Expected OCO is taken from the PB15 Green Book. The Green Book provides a DoD OCO placeholder for 2015 to reflect its anticipated OCO request. For other years of the FYDP, the model uses the Office of Management and Budget (OMB) Outyear OCO Placeholder cited in the Green Book. Since IDA produced and briefed its final projections (presented here), the Department has released its actual OCO funding request for FY 2015. Operation and Maintenance Programs (O-1) Revolving and Management Funds (RF-1): Budget Amendment to the Fiscal Year 2015 President’s Budget Request for Overseas Contingency Operations, Office of the Under Secretary of Defense (Comptroller) (Jun. 2014). This requests a lower amount of O&M OCO for FY15 than used in the projections in this briefing. As such, an update using the actual O&M OCO request would yield higher shortfalls than those presented here.
The graph on this slide shows that historical actuals and model-calculated O&M (both excluding Defense-wide O&M) track reasonably well. In the FYDP, model forecasts of Service-only O&M are $113 billion larger than Service-only O&M in PB15 (with requested OCO added). This increases to $285 billion if OCO is removed from expected Service-only O&M. In the alternative scenario, deployments fall to a minimum historical level, and the model projects O&M costs $33 billion lower than those contained in PB15 (with requested OCO). It should be emphasized, however, that the alternative scenario is inconsistent with publicly available information on DoD’s future end strength and global posture.
7. Service Level Buildup O&M Projection Comparison
Army Projected Navy ProjectedMarine Corps Projected Air Force ProjectedDOD less Defensewide Projected DOD less Defensewide PB 15
• IDA’s projections for the Services aggregate to levels consistent with top-level history and projections• Army, Air Force, and Marine Corps individually project shortfalls against O&M in PB15• Shifting deployed forces to United States eliminates shortfall ($27 B surplus) (inc. OCO)
This slide depicts O&M model estimates from each individual Service-specific O&M cost model that was generated for this paper (colored areas). These estimates were generated using historical and PB15 projected military end strength data by Service and estimates of each Service’s global posture from publicly available sources, cited previously. In addition, the O&M model estimates from the combined Services model (discussed on the previous slide, and excluding Defense wide) is shown with a red line. The solid green line represents actual combined-service O&M expenditures and requests over the FYDP from PB15.
The sum of O&M cost estimates from individual Service cost models are very close to the projection from the combined Services O&M model for the entire time period evaluated. Both estimating methodologies are larger than PB15 combined Service O&M requests by over $100 billion in the FYDP, and both modeling methodologies project
surpluses of ~$30 billion in the “lower bound” scenario. Thus, the models remain consistent.
The table on the slide on page 17 documents PB15 O&M requests, corresponding O&M cost model projections, and the difference between them. Three of the four Services’ (Army, Marine Corps, and Air Force) PB15 O&M requests are lower than the corresponding Service-specific O&M model projections. Only the Navy PB15 O&M request is larger than the O&M model forecasts, but, in practice, this surplus would be retained by the Navy and not used to offset the shortfalls of the other Services. Individual Service-specific model projections can be found in Appendix C.
8. Summary O&M Model Results
Summary O&M Model Results
All models assume the historical relationship between O&M, end strength, and global posture are maintained
O&M cost model projects O&M will exceed PB 2015 FYDP by $232 B BY2015 (including OCO) Defense-wide O&M is responsible for a large portion of this shortfall
Difficult to model
O&M shortfall for the Services alone is ~$110-130 B (including OCO)
The Army, Marine Corps, and Air Force PB 15 O&M projections are less than the O&M model predicts by ~ $70, $20, and $55B, respectively
The Navy PB 15 O&M projections is ~$15 B larger than the O&M model predicts
Shifting forces from deployed locations to the US (to replicate 1997 deployment levels) reduces total O&M shortfalls (including OCO) by ~$120 B
This slide summarizes this paper’s O&M cost projections using PB15 data. Estimates are generated at the DoD level, the combined Service level, and for the individual Services. Except for the Navy, the O&M forecasts in this paper are significantly higher than those reported during the FYDP in PB15. The top-level DoD O&M model in this paper predicts that DoD will spend ~$230 billion more on O&M than is in the PB15 FYDP. Much of this difference (~50 percent) is attributable to Defense-wide O&M, which is difficult to model. Removing Defense-wide O&M from total DoD O&M reduces the projected shortfall over the FYDP by nearly half, to $110–$130 billion.
We also generated O&M cost models for each of the Services individually. The Army, the Marine Corps, and the Air Force FYDP O&M levels are lower than the O&M model predictions by $70 billion, $20 billion, and $55 billion, respectively. In contrast, the Navy cost model in this paper estimates lower O&M costs than the Navy FYDP O&M level by ~$15 billion. When aggregated (with the Navy overage canceling part of the shortfalls of the other Components), combined individual O&M cost model
projections for each of the four Services are consistent with a single cost model that evaluates total DoD O&M, excluding Defense-wide O&M.
What-if analyses demonstrate that bringing most of the deployed troops back to the United States (1997 deployment levels) would decrease the difference in DoD O&M at top level by more than half. Such an aggressive redeployment scenario would also eliminate shortfalls in the combined Services cost model and reduce the shortfalls in the individual Service models. These projections, of course, include projected future OCO under the current PB15 estimates, which may not materialize if overseas military commitments shrink to historically low levels.
9. Conclusions
Summary of Updated Projections
O&M model predicts currently requested O&M funding will not cover likely expenditures Three of four Service models predict O&M shortfalls when estimated
individually Defense-wide O&M is driven by a different set of variables
Fewer deployments can reduce but not eliminate shortfalls (assuming OCO funding will still be available)
Are these results consistent with underlying assumptions of O&M budget requests?
8 September 2014 13
The O&M models in this paper indicate that requested O&M funding in the FYDP is less than historical relationships would suggest. This is true both at the top level of DoD and for three of the four individual Services. These trends will likely continue even if the military reduces its deployments quickly. Only at historically minimal levels of deployments, far different from the current global posture, do O&M levels requested by DoD match model-projected O&M costs. We do not have a robust model to make a projection of future O&M expenditures for Defense-wide O&M.
The estimating methodology discussed in this paper could allow OUSD(AT&L) analysts to evaluate O&M costs using just a few strategic variables. In addition, it enables “what if” analyses with respect to military end strength and global posture. O&M models and their projections can elucidate inconsistent cost-driving assumptions, and help to highlight them for discussion and analysis in the budget process.
Appendix A. Summary Statistics for Model Variables
* Growth rate coefficient t-statistics are taken from logarithmic estimation form** Defensewide O&M is difficult to model. Force distribution coefficients are not statistically significant.
Exponential growth rate creates large shortfall ($291 B). Linear growth rate projects $64 B shortfall.
This slide summarizes the descriptive statistics of the O&M models presented in this briefing. Coefficients for all of the variables are statistically significant at the 95 percent confidence level, as represented by t-statistics over a value of ~2.0. Furthermore, coefficients for all variables are positive and consistently demonstrate that deployed troops result in a higher enterprise O&M/troop cost than either the US-based troops or the Permanent overseas based troops, as expected. Defense-wide and Marine Corps models differ from the other models presented. The Marine Corps’ force distribution variable for “Permanent Overseas Bases” did not register as statistically significant in the Marine Corps model, so it was combined with the “Deployed” variable to form an “abroad” variable. Force end strength and global posture variables were not statistically significant in the Defense-wide O&M cost models. The Defense-wide O&M model excludes all force distribution variables and projects O&M solely on the basis of an O&M real growth
factor. Since we did not have confidence in this Defense-wide O&M model and its forecasts, we excluded Defense-wide O&M from the models presented on pages 15 and 17 of this annotated briefing.
Appendix B. Calculation of Force Distribution Variables
This appendix provides the methodology we used to calculate historical force distribution variables. The original data source for all force distribution variables is the set of DMDC quarterly reports on Active Duty Military Personnel by Service by Region/Country.1 DMDC maintains historical archives of these reports dating back to 1962. These reports provide a snapshot of Active Duty military end strength distribution on a particular date by Service, area, and country. These snapshots may not always correspond to budget documentation or alternative distribution measures due to differences in authorizations and execution of military forces and the timing of the DMDC reports.
The DMDC reports have three separate sections describing end strength distributions: “By-Country Locations,” “Summary Locations,” and “Contingency Deployments.” Each of these sections was used in a different way to calculate force distribution variables.
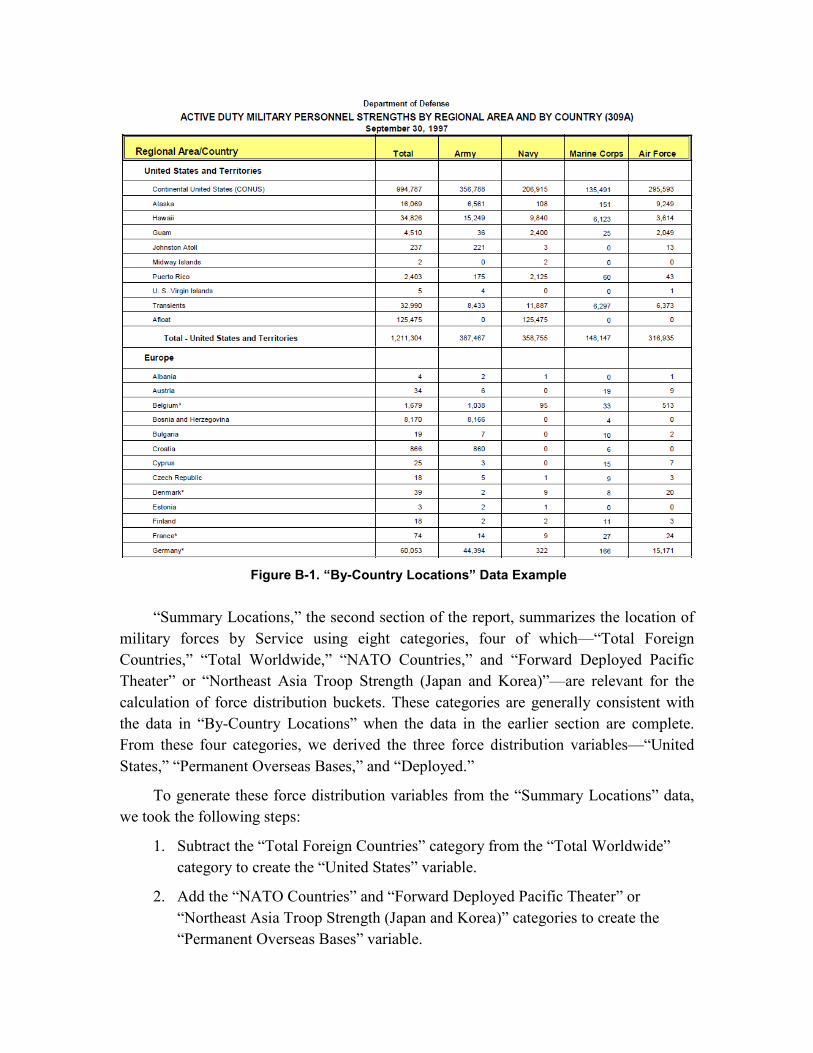
“By-Country Locations,” the first (and longest) section of the reports, lists end strength by each country and region (i.e., Europe, Former Soviet Union, East Asia and Pacific, North Africa/Near East/South Asia, Sub-Saharan Africa, Western Hemisphere). Figure B-1 shows an example of data from this section. This section has several inconsistencies over time. For example, starting in 2009, this section ceased to report the Republic of Korea (which is categorized as a “Permanent Overseas Base”) as a separate entry. Furthermore, starting with OEF and OIF, distributions of end strength deployed on a contingency operation are not reported in the country of deployment’s data, but are instead reported as a separate table. This departed from previous practices. Because of these inconsistencies, this section was not used, except to validate and adjust end strength data.
1 These are available at https://www.dmdc.osd.mil/appj/dwp/reports.do?category=reports&subCat =milActDutReg. The Active Duty Military Personnel by Service by Region/Country data only include Reserve Component personnel who have been activated (presumably for a deployment). Hence, some amount of the “Deployed” variable contains activated Reservists, while very little of the “United States” or “Permanent Overseas Bases” variables do. Although treatment of Reservists is one way in which the historical DMDC data differ from projections of Active Component end strength in the PB15 FYDP, activation of Reservists for deployments—in addition to Active Component deployments—provides an appropriate proxy for historical OPTEMPO.
Figure B-1. “By-Country Locations” Data Example
“Summary Locations,” the second section of the report, summarizes the location of
military forces by Service using eight categories, four of which—“Total Foreign Countries,” “Total Worldwide,” “NATO Countries,” and “Forward Deployed Pacific Theater” or “Northeast Asia Troop Strength (Japan and Korea)”—are relevant for the calculation of force distribution buckets. These categories are generally consistent with the data in “By-Country Locations” when the data in the earlier section are complete. From these four categories, we derived the three force distribution variables—“United States,” “Permanent Overseas Bases,” and “Deployed.”
To generate these force distribution variables from the “Summary Locations” data, we took the following steps:
1. Subtract the “Total Foreign Countries” category from the “Total Worldwide” category to create the “United States” variable.
2. Add the “NATO Countries” and “Forward Deployed Pacific Theater” or “Northeast Asia Troop Strength (Japan and Korea)” categories to create the “Permanent Overseas Bases” variable.
3. Subtract the “Permanent Overseas Bases” variable from the “Total Foreign Countries” category to create the “Deployed” variable.
After these steps, we made a series of adjustments in the three variables. The most important adjustment involves the “Permanent Overseas Bases” category. Prior to 1997, the category “Northeast Asia Troop Strength (Japan and Korea)” included only forces based on land in Japan and Korea. Beginning in 1997, this category was replaced with the “Forward Deployed Pacific Theater” category, which includes forces other than those based on land in Japan and Korea. DMDC neither provides the calculation steps for this category nor separately reports military end strength in Korea after 2009. We adjusted the pre-1997 “Northeast Asia Troop Strength (Japan and Korea)” category to include the end strength captured in the post-1996 “Forward Deployed Pacific Theater” category. Figure B-2 and Figure B-3 show the change in categories (and the difference in end strength that results) from 1996 to 1997.
Figure B-2. “Summary Locations” Section, 1977-1996 format (1996)
Figure B-3. “Summary Locations” Section, 1997-current format (1997)
We adjusted the “Northeast Asia Troop Strength (Japan and Korea)” category by
adding the total “Afloat” end strength in the East Asia and Pacific region to the “Northeast Asia Troop Strength (Japan and Korea)” category for greater consistency with post-1996 “Forward Deployed Pacific Theater” data. This change mostly affects the Navy and Marine Corps end strength distributions. This adjusted number, plus the
“NATO Countries” category, forms the “Permanent Foreign Bases” bucket for 1977–1996.2
Another major adjustment dealt with the treatment of forces deployed to OEF, OIF, and OND contingency operations. “Contingency Deployments,” the third section of the report, deals with end strength deployed in contingency operations and became a part of the DMDC reports starting in 2003. Prior to 2003, forces deployed on contingency operations were accounted for in the country of their deployment. After the creation of this section, forces deployed on contingency operations were accounted in the location they deployed from (typically the United States or a permanent overseas base) rather than the location they deployed to. Data in this section prompted adjustments of the “United States,” “Permanent Overseas Bases,” and “Deployed” variables after 2003. Figure B-4 shows an example of data in this section in 2003, and Figure B-5 shows similar data following a slight adjustment in the category starting in 2005.
Figure B-4. DMDC Reporting of Contingency Operations in 2003
2 IDA also made more minor adjustments for consistent treatment of US-controlled foreign locations such as the Panama Canal Zone and Guantanamo Bay, Cuba.
Figure B-5. DMDC Reporting of Contingency Operation Deployments in 2005
End strength deployed on contingency operations unquestionably belongs in the
“Deployed” variable rather than in the “United States” or “Permanent Overseas Bases” variables. To properly allocate this end strength, we made the following adjustments:
1. Identify all end strength that deployed from a named country other than the United States (see Figure B-5);
2. Deduct the end strength deployed from NATO member countries, Japan, and Korea from that year’s “Permanent Overseas Bases” variable, and add that end strength to the “Deployed” variable;
3. Deduct the end strength deployed from other countries (not the United States) from the “Deployed” variable and add it to the “Deployed” variable (no net change in the variable);
4. Deduct the remaining end strength (i.e., the total end strength deployed on contingency operations minus the end strength adjusted in steps (2) and (3)) from the “United States” variable and add it to the “Deployed” variable.
This series of adjustments produces the final versions of the “United States,” “Permanent Overseas Bases,” and “Deployed” force distribution variables for the O&M model.
Three Variable Actual PB 2015 Projected Three Variable with Force Shift
Total Army O&M PB 15 Projections
Predicted
Actual O&M
• Model projects a $68.8 B shortfall in O&M funding starting in 2015• Shifting deployed forces to United States reduces shortfall to $37.7 B (inc. OCO)
Base O&M+OCO
O&M withmax shift
Model ($B) FY13 Delta FY14 Delta FY15 Delta FY16 Delta FY17 Delta FY18 Delta FY 19 Delta FY14-19 Total Delta
Actual Army O&M cost and modeled O&M cost during 1977–2013 are similar; however, both the baseline O&M cost model and the “lower bound” O&M cost model are higher than PB15 O&M requests (including OCO) in the FYDP. The O&M model forecasts that O&M will cost $67 billion more than PB15 requests (with expected OCO) over the FYDP; excluding DoD’s expected OCO increases this difference to $181 billion. The lower-bound estimate is $38 billion more than DoD’s PB15 request.
Actual Navy O&M cost and modeled O&M cost during 1977–2013 are similar, despite a weaker statistical relationship than models for the other Services; however, estimates for both the baseline O&M cost model and the “lower bound” O&M cost model are lower than PB15 O&M requests (including OCO) in the FYDP. The O&M model forecasts that O&M will cost $14 billion less than PB15 requests (with expected OCO) over the FYDP; excluding DoD’s expected OCO results in O&M costs $7 billion above the PB15 request. The lower-bound estimate is $39 billion less than DoD’s PB15 request.
Two Variable Actual PB 2015 Projected Two Variable with Force Shift
Total Marine Corps O&M PB 15 Projections
• Model projects a $18.8 B shortfall in O&M funding starting in 2014• Shifting deployed forces to United States reduces shortfall to $12.6 B (inc. OCO)
Base O&M+OCO
Predicted
Actual O&M
Model ($B) FY13 Delta FY14 Delta FY15 Delta FY16 Delta FY17 Delta FY18 Delta FY 19 Delta FY14-19 Total Delta
Actual Marine Corps O&M cost and modeled O&M cost during 1977–2013 are similar; however, both the baseline O&M cost model and the “lower bound” O&M cost model are higher than PB15 O&M requests (including OCO) in the FYDP. The O&M model forecasts that O&M will cost $19 billion more than PB15 requests (with expected OCO) over the FYDP; excluding DoD’s expected OCO increases this difference to $24 billion. The lower-bound estimate is $14 billion more than DoD’s PB15 request.
Actual Air Force O&M cost and modeled O&M cost during 1977–2013 are similar; however, both the baseline O&M cost model and the “lower bound” O&M cost model are higher than PB15 O&M requests (including OCO) in the FYDP. The O&M model forecasts that O&M will cost $54 billion more than PB15 requests (with expected OCO) over the FYDP; excluding DoD’s expected OCO increases this difference to $83 billion. The lower-bound estimate is $13 billion more than DoD’s PB15 request.
Defense-wide O&M proved difficult to model using end strength and global posture data, since such variables are not statistically significant in mathematically explaining historical O&M. Estimated with a growth factor alone, actual Defense-wide O&M cost and modeled O&M cost during 1977–2013 are not particularly similar, either. Furthermore, in the baseline O&M cost model using only a growth factor (and those models that use global posture data), O&M cost projections are substantially higher than PB15 O&M requests (including OCO) in the FYDP. The O&M model forecasts that O&M will cost $54 billion more than PB15 requests (with expected OCO) over the FYDP; excluding DoD’s expected OCO increases this difference to $219 billion. There is no lower-bound estimate, as the Defense-wide O&M model does not use end strength or global posture variables. The size of the difference between these projections and the PB15 over the FYDP, coupled with the poor historical statistical performance of Defense-wide O&M models, lowers confidence in the results of Defense-wide models.
References
Defense Manpower Data Center. Active Duty Military Personnel by Service by Region/Country. Washington, DC. https://www.dmdc.osd.mil/appj/dwp/reports.do ?category=reports&subCat=milActDutReg.
Feickert, Andrew. Army Drawdown and Restructuring: Background and Issues for Congress. Washington, DC: Congressional Research Service, March 5, 2013.
Greene, David, Sean Carberry, and Tom Bowman. Afghans Want U.S. to Clarify Troop Level Post 2014, NPR (April 5, 2013).
Office of the Under Secretary of Defense (Comptroller). Operation and Maintenance Programs (O-1) Revolving and Management Funds (RF-1): Budget Amendment to the Fiscal Year 2015 President’s Budget Request for Overseas Contingency Operations. June 2014.
U.S. Department of Defense. “DoD News.” Claudette Roulo. “Hagel: Post-2014 Troop Level to Protect Afghan Progress.” American Forces Press Service (May 29, 2014). http://www.defense.gov/news/newsarticle.aspx?id=122362.
Wong, Kristina. “Army Lays Out Plans to Remove 80,000 Soldiers; Base Communities Brace for Impacts.” Washington Times (June 25, 2013).
Abbreviations
ARA Acquisition Resources and Analysis
DMDC Defense Manpower Data Center
DoD Department of Defense
FY Fiscal Year
FYDP Future Years Defense Program
IDA Institute for Defense Analyses
MILPERS Military Personnel
NATO North Atlantic Treaty Organization
O&M Operations and Maintenance
OCO Overseas Contingency Operations
OEF Operation Enduring Freedom
OIF Operation Iraqi Freedom
OMB Office of Management and Budget
OND Operation New Dawn
OPTEMPO Operations Tempo
OUSD(AT&L) Office of the Under Secretary of Defense for Acquisition, Technology and Logistics
PB President’s Budget
RDT&E Research, Development, Test and Evaluation
US United States
Standard Form 298 (Rev. 8/98)
REPORT DOCUMENTATION PAGE
Prescribed by ANSI Std. Z39.18
Form Approved OMB No. 0704-0188
The public reporting burden for this collection of information is estimated to average 1 hour per response, including the time for reviewing instructions, searching existing data sources, gathering and maintaining the data needed, and completing and reviewing the collection of information. Send comments regarding this burden estimate or any other aspect of this collection of information, including suggestions for reducing the burden, to Department of Defense, Washington Headquarters Services, Directorate for Information Operations and Reports (0704-0188), 1215 Jefferson Davis Highway, Suite 1204, Arlington, VA 22202-4302. Respondents should be aware that notwithstanding any other provision of law, no person shall be subject to any penalty for failing to comply with a collection of information if it does not display a currently valid OMB control number. PLEASE DO NOT RETURN YOUR FORM TO THE ABOVE ADDRESS. 1. REPORT DATE (DD-MM-YYYY) 2. REPORT TYPE 3. DATES COVERED (From - To)
4. TITLE AND SUBTITLE 5a. CONTRACT NUMBER
5b. GRANT NUMBER
5c. PROGRAM ELEMENT NUMBER
5d. PROJECT NUMBER
5e. TASK NUMBER
5f. WORK UNIT NUMBER
6. AUTHOR(S)
7. PERFORMING ORGANIZATION NAME(S) AND ADDRESS(ES) 8. PERFORMING ORGANIZATION REPORT NUMBER
9. SPONSORING/MONITORING AGENCY NAME(S) AND ADDRESS(ES) 10. SPONSOR/MONITOR'S ACRONYM(S)
11. SPONSOR/MONITOR'S REPORT NUMBER(S)
12. DISTRIBUTION/AVAILABILITY STATEMENT
13. SUPPLEMENTARY NOTES
14. ABSTRACT
15. SUBJECT TERMS
16. SECURITY CLASSIFICATION OF: a. REPORT b. ABSTRACT c. THIS PAGE