28
OM HOLDINGS LIMITED Australia • China • Japan • Malaysia • Singapore • South Africa 1 April 2019 • Sydney Mining Club • ASX:OMH
OM HOLDINGS LIMITEDAustralia • China • Japan • Malaysia • Singapore • South Africa
1
April 2019 • Sydney Mining Club • ASX:OMH
DISCLAIMER
This presentation has been prepared and issued by OM Holdings Limited ARBN 081 028 337 (“OMH”). This presentation containssummary information about OMH. The information in this presentation does not purport to be complete or to provide allinformation that an investor should consider when making an investment decision. It should be read in conjunction with OMH‘sother periodic and continuous disclosure announcements lodged with the Australian Securities Exchange which are available atwww.asx.com.au.
This presentation contains "forward‐looking" statements within the meaning of securities laws of applicable jurisdictions.Forward‐looking statements can generally be identified by the use of forward‐looking words such as "may", "will", "expect","intend", "plan", "estimate", "anticipate", "believe", "continue", "objectives", "outlook", "guidance" or other similar words, andinclude statements regarding certain plans, strategies and objectives of management and expected financial performance. Theseforward‐looking statements involve known and unknown risks, uncertainties and other factors, many of which are outside thecontrol of OMH, and its directors, officers, employees, agents or associates. Actual results, performance or achievements may varymaterially from any projections and forward‐looking statements and the assumptions on which those statements are based.Readers are therefore cautioned not to place undue reliance on forward‐looking statements and OMH, other than required by law,assumes no obligation to update such information.
OMH makes no representation and can give no assurance, guarantee or warranty, express or implied, as to, and takes no responsibility andassumes no liability for the authenticity, validity, accuracy, suitability or completeness of, or any errors in or omissions from, anyinformation, statement or opinion contained in this presentation.
This presentation is for information purposes only and is not a financial product or investment advice or a recommendation toacquire (or refrain from selling) OMH shares. Before making an investment decision prospective investors should consider theappropriateness of the information having regard to their own objectives, financial situation and needs and seek legal and taxationadvice appropriate to their jurisdiction. OMH is not licensed to provide financial product advice, either generally or in respect ofOMH shares.
2
THIS IS OUR STORY
OMH GROUP: MANGANESE & SILICON SPECIALIST
4
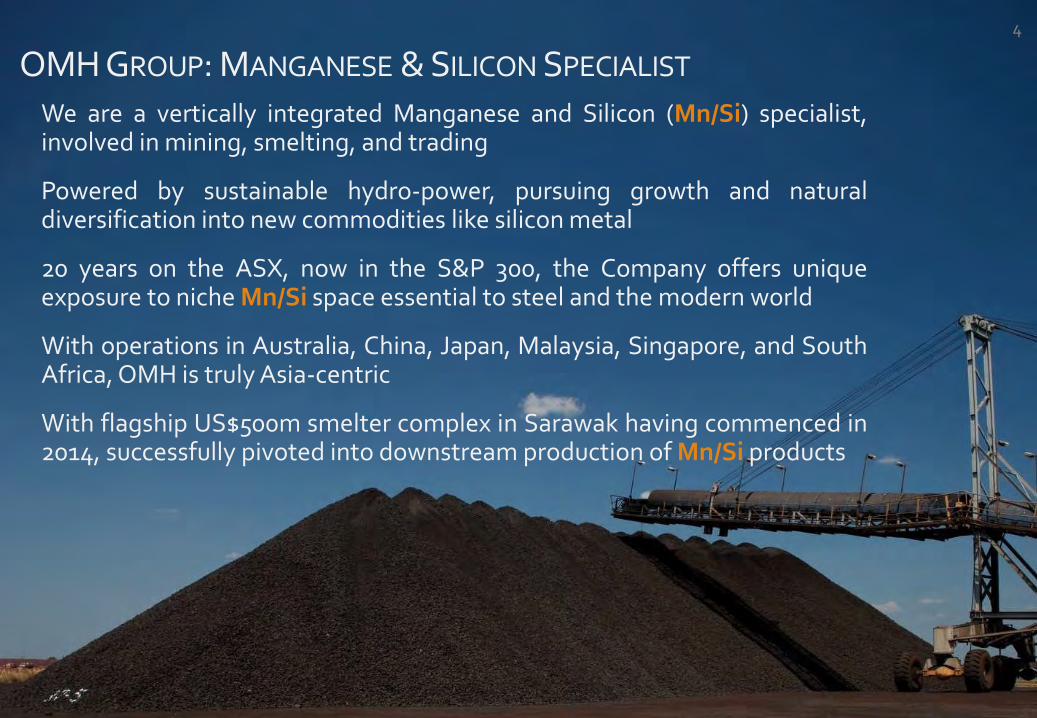
We are a vertically integrated Manganese and Silicon (Mn/Si) specialist,involved in mining, smelting, and trading
Powered by sustainable hydro-power, pursuing growth and naturaldiversification into new commodities like silicon metal
20 years on the ASX, now in the S&P 300, the Company offers uniqueexposure to niche Mn/Si space essential to steel and the modern world
With operations in Australia, China, Japan, Malaysia, Singapore, and SouthAfrica, OMH is truly Asia-centric
With flagship US$500m smelter complex in Sarawak having commenced in2014, successfully pivoted into downstream production of Mn/Si products
5
COMPANY SNAPSHOT
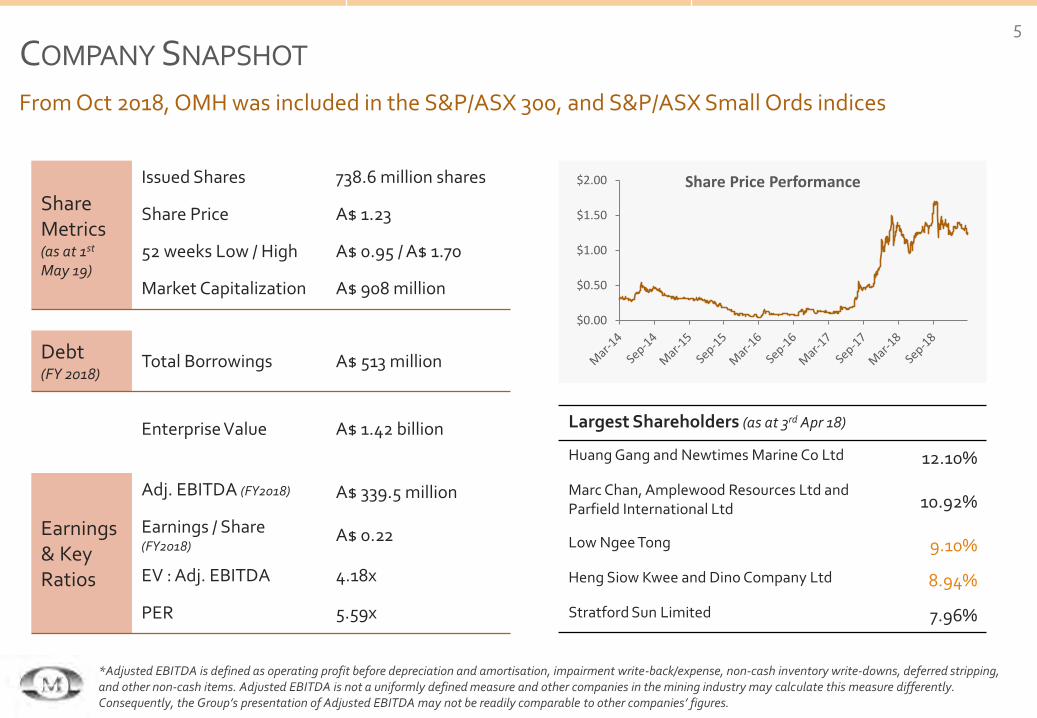
From Oct 2018, OMH was included in the S&P/ASX 300, and S&P/ASX Small Ords indices
Share Metrics(as at 1st
May 19)
Issued Shares 738.6 million shares
Share Price A$ 1.23
52 weeks Low / High A$ 0.95 / A$ 1.70
Market Capitalization A$ 908 million
Debt(FY 2018)
Total Borrowings A$ 513 million
Enterprise Value A$ 1.42 billion
Earnings & Key Ratios
Adj. EBITDA (FY2018) A$ 339.5 million
Earnings / Share (FY2018)
A$ 0.22
EV : Adj. EBITDA 4.18x
PER 5.59x
$0.00
$0.50
$1.00
$1.50
$2.00 Share Price Performance
Largest Shareholders (as at 3rd Apr 18)
Huang Gang and Newtimes Marine Co Ltd 12.10%
Marc Chan, Amplewood Resources Ltd and Parfield International Ltd 10.92%
Low Ngee Tong 9.10%
Heng Siow Kwee and Dino Company Ltd 8.94%
Stratford Sun Limited 7.96%
*Adjusted EBITDA is defined as operating profit before depreciation and amortisation, impairment write-back/expense, non-cash inventory write-downs, deferred stripping, and other non-cash items. Adjusted EBITDA is not a uniformly defined measure and other companies in the mining industry may calculate this measure differently. Consequently, the Group’s presentation of Adjusted EBITDA may not be readily comparable to other companies’ figures.

6
OUR PEOPLE
Low Ngee Tong Executive Chairman
Zainul Abidin Rasheed Independent Deputy Chairman
Julie WolseleyIndependent Non-Executive Director
Joint Company Secretary
Thomas TeoIndependent Non-Executive Director
Tan Peng ChinIndependent Non-Executive Director
Peter C. Church (OAM)Independent Non-Executive Director
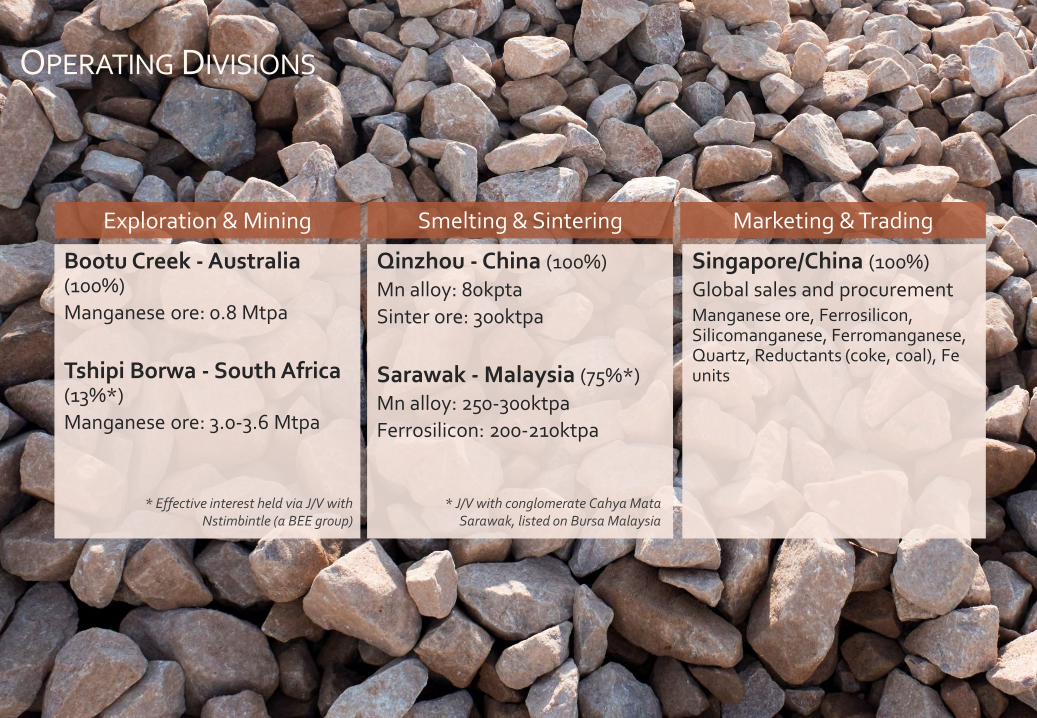
Bootu Creek - Australia (100%)
Manganese ore: 0.8 Mtpa
Tshipi Borwa - South Africa(13%*)
Manganese ore: 3.0-3.6 Mtpa
Qinzhou - China (100%)
Mn alloy: 80kpta
Sinter ore: 300ktpa
Sarawak - Malaysia (75%*)
Mn alloy: 250-300ktpa
Ferrosilicon: 200-210ktpa
Singapore/China (100%)
Global sales and procurementManganese ore, Ferrosilicon, Silicomanganese, Ferromanganese, Quartz, Reductants (coke, coal), Fe units
Exploration & Mining Smelting & Sintering Marketing & Trading
7
OPERATING DIVISIONS
* Effective interest held via J/V with Nstimbintle (a BEE group)
* J/V with conglomerate Cahya Mata Sarawak, listed on Bursa Malaysia
8
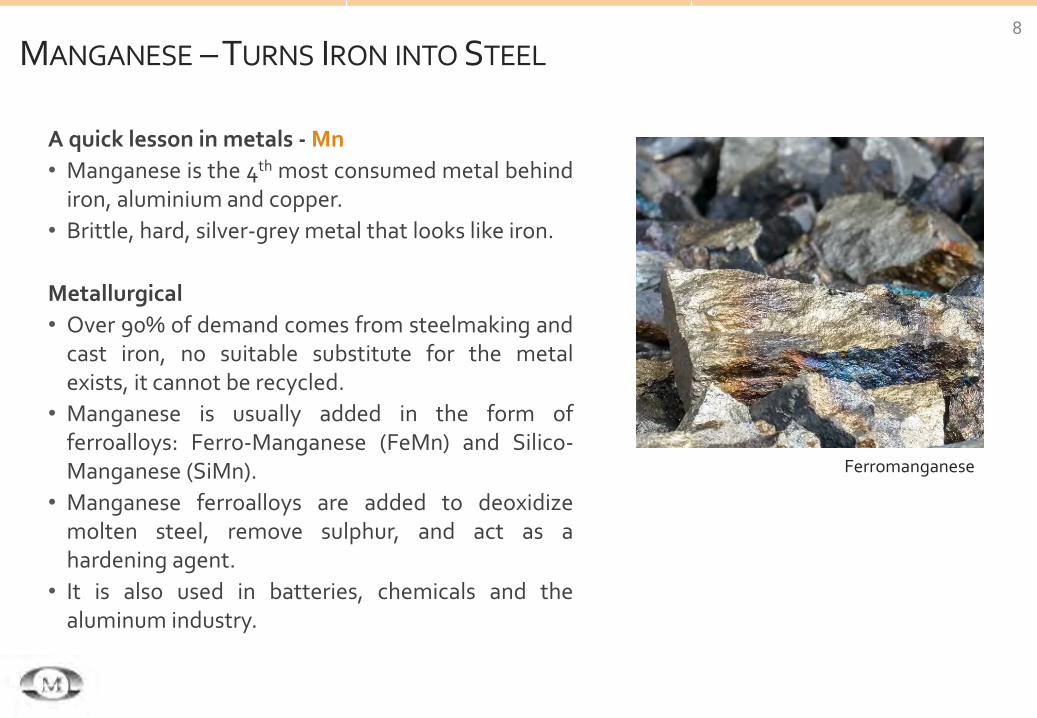
A quick lesson in metals - Mn
• Manganese is the 4th most consumed metal behindiron, aluminium and copper.
• Brittle, hard, silver-grey metal that looks like iron.
Metallurgical
• Over 90% of demand comes from steelmaking andcast iron, no suitable substitute for the metalexists, it cannot be recycled.
• Manganese is usually added in the form offerroalloys: Ferro-Manganese (FeMn) and Silico-Manganese (SiMn).
• Manganese ferroalloys are added to deoxidizemolten steel, remove sulphur, and act as ahardening agent.
• It is also used in batteries, chemicals and thealuminum industry.
MANGANESE –TURNS IRON INTO STEEL
Ferromanganese
9
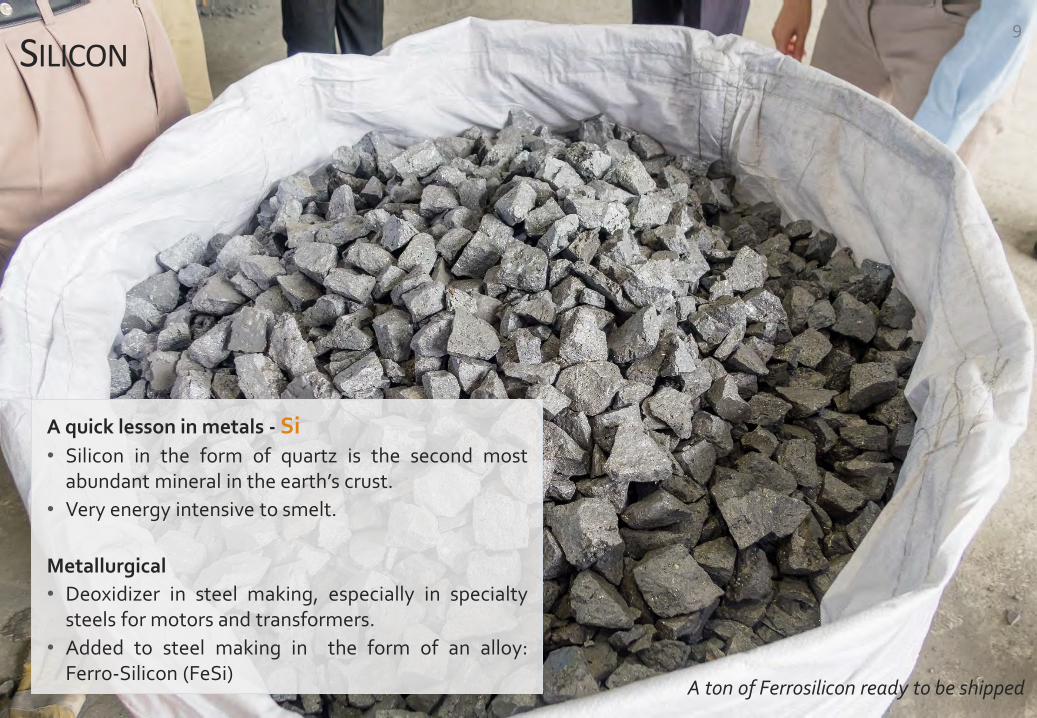
SILICON
A ton of Ferrosilicon ready to be shipped
A quick lesson in metals - Si• Silicon in the form of quartz is the second most
abundant mineral in the earth’s crust.
• Very energy intensive to smelt.
Metallurgical
• Deoxidizer in steel making, especially in specialtysteels for motors and transformers.
• Added to steel making in the form of an alloy:Ferro-Silicon (FeSi)
10
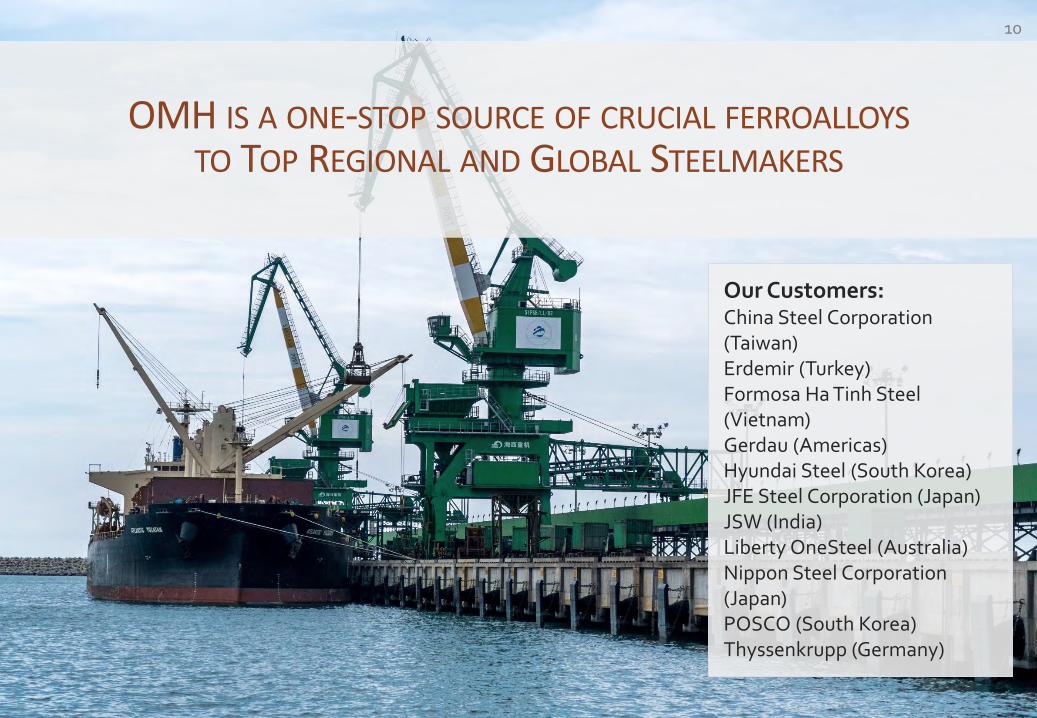
OMH IS A ONE-STOP SOURCE OF CRUCIAL FERROALLOYS
TO TOP REGIONAL AND GLOBAL STEELMAKERS
Our Customers:China Steel Corporation (Taiwan)Erdemir (Turkey)Formosa Ha Tinh Steel (Vietnam)Gerdau (Americas)Hyundai Steel (South Korea)JFE Steel Corporation (Japan)JSW (India)Liberty OneSteel (Australia)Nippon Steel Corporation (Japan)POSCO (South Korea)Thyssenkrupp (Germany)
11
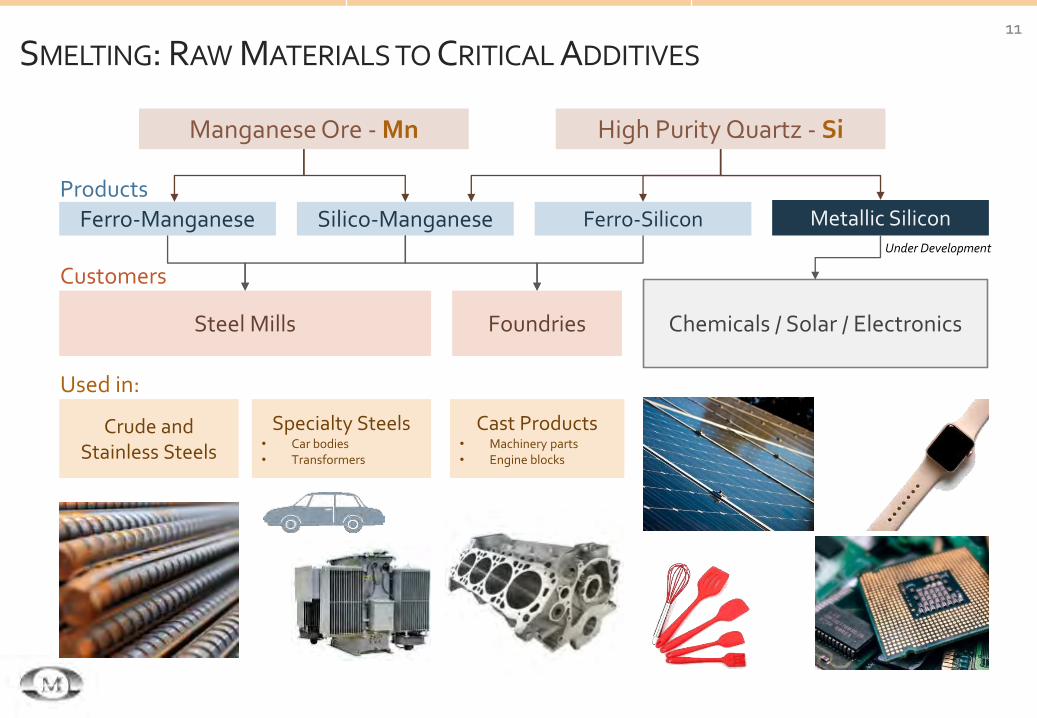
SMELTING: RAW MATERIALS TO CRITICAL ADDITIVES
Steel Mills Foundries
Ferro-Manganese Silico-Manganese Ferro-Silicon
Manganese Ore - Mn High Purity Quartz - Si
Customers
ProductsMetallic Silicon
Chemicals / Solar / Electronics
Crude andStainless Steels
Specialty Steels• Car bodies• Transformers
Cast Products• Machinery parts• Engine blocks
Under Development
Used in:
12
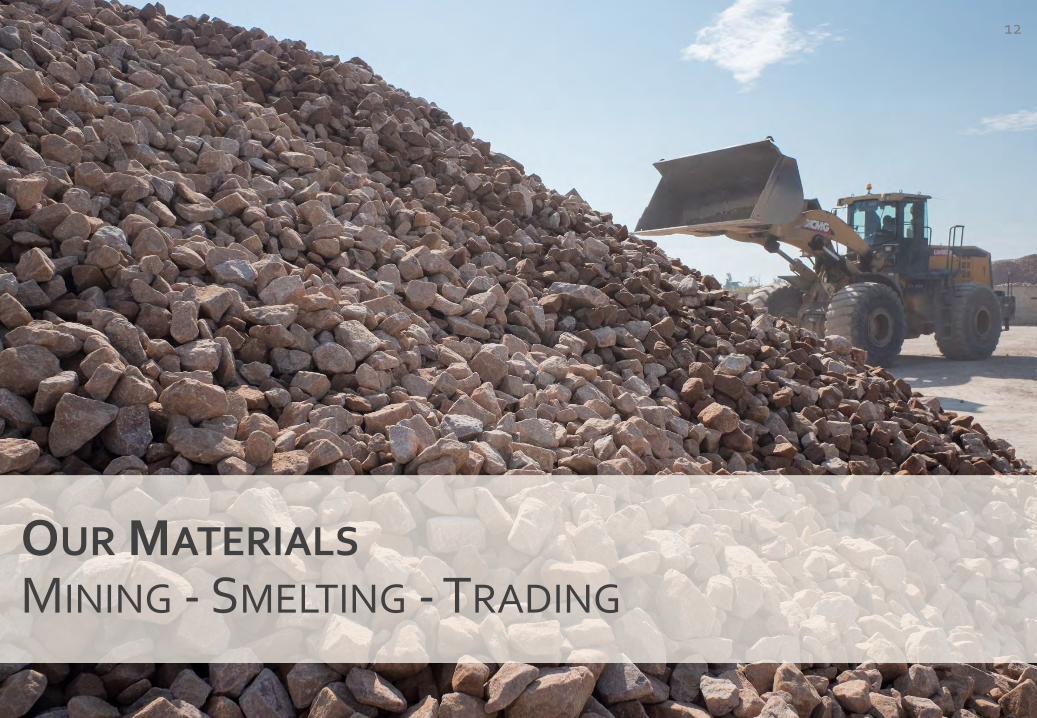
OUR MATERIALS
MINING - SMELTING - TRADING
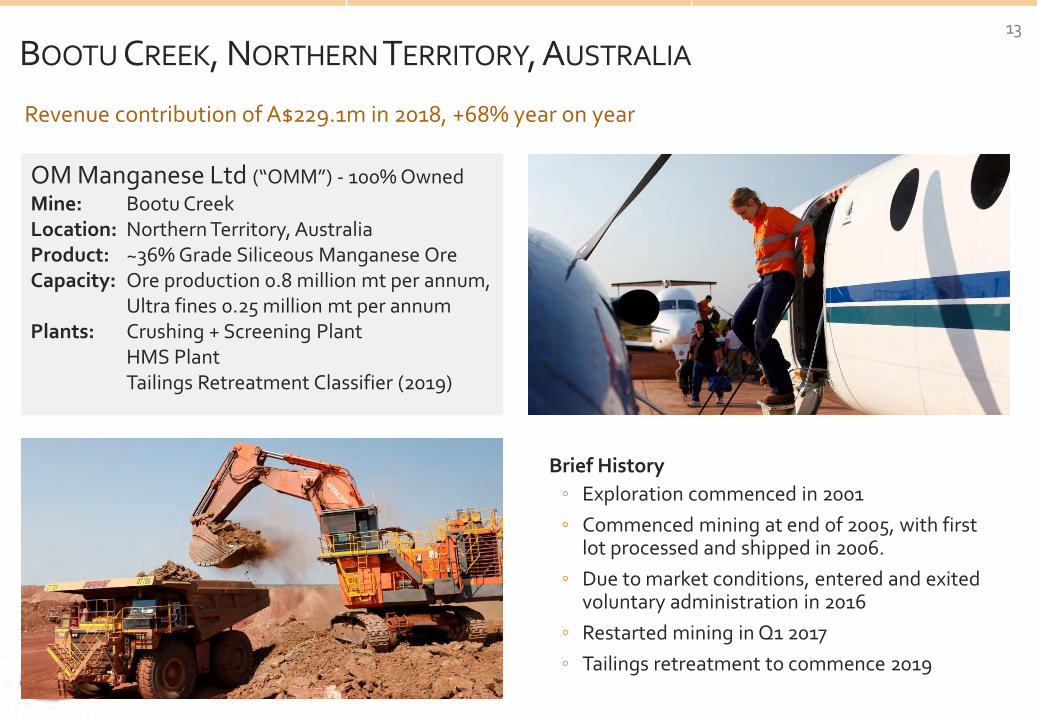
BOOTU CREEK, NORTHERN TERRITORY, AUSTRALIA
Brief History
◦ Exploration commenced in 2001
◦ Commenced mining at end of 2005, with first lot processed and shipped in 2006.
◦ Due to market conditions, entered and exited voluntary administration in 2016
◦ Restarted mining in Q1 2017
◦ Tailings retreatment to commence 2019
13
Revenue contribution of A$229.1m in 2018, +68% year on year
OM Manganese Ltd (“OMM”) - 100% Owned
Mine: Bootu CreekLocation: Northern Territory, AustraliaProduct: ~36% Grade Siliceous Manganese OreCapacity: Ore production 0.8 million mt per annum,
Ultra fines 0.25 million mt per annumPlants: Crushing + Screening Plant
HMS PlantTailings Retreatment Classifier (2019)
14
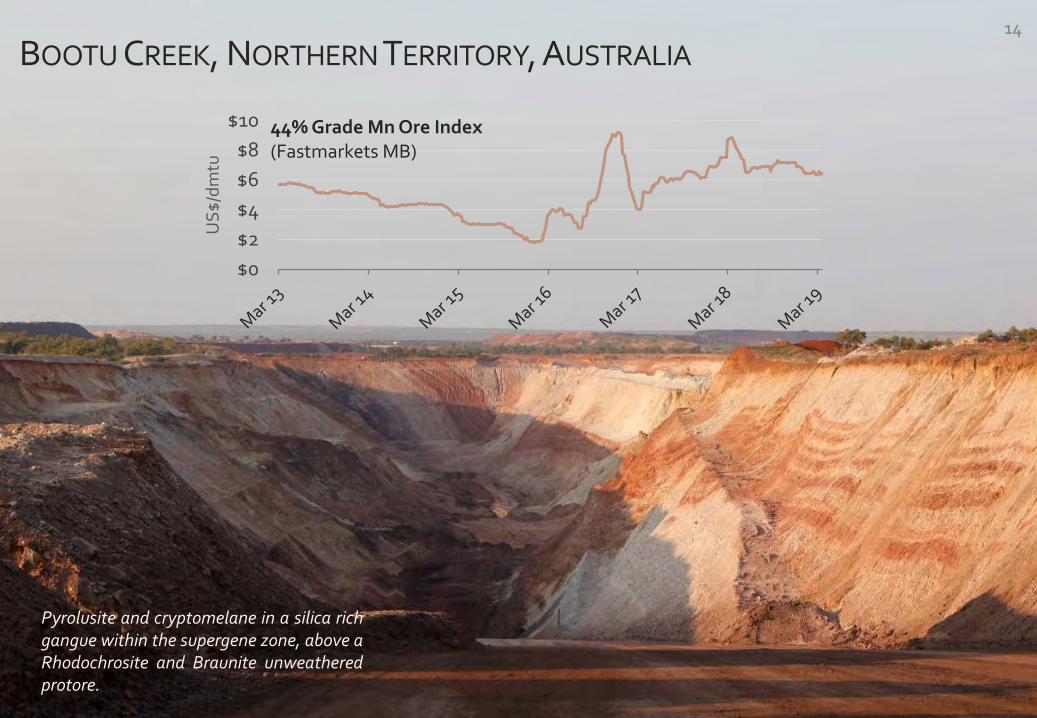
BOOTU CREEK, NORTHERN TERRITORY, AUSTRALIA
Pyrolusite and cryptomelane in a silica richgangue within the supergene zone, above aRhodochrosite and Braunite unweatheredprotore.
$0
$2
$4
$6
$8
$10
US
$/d
mtu
44% Grade Mn Ore Index(Fastmarkets MB)
15
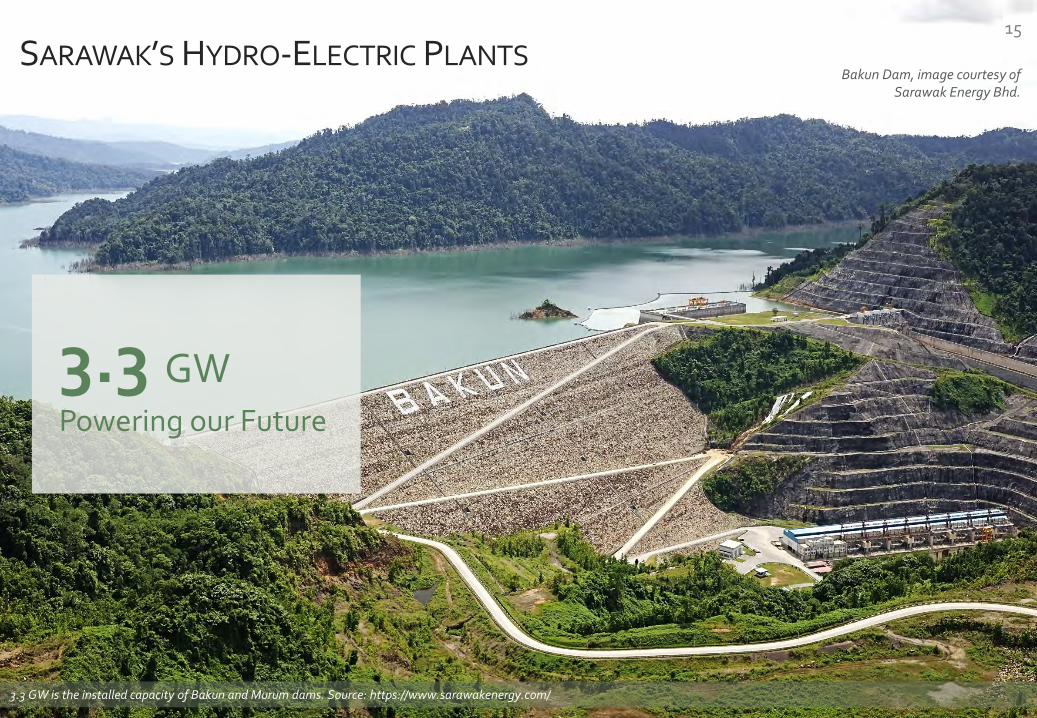
SARAWAK’S HYDRO-ELECTRIC PLANTS
3.3 GWPowering our Future
Bakun Dam, image courtesy of Sarawak Energy Bhd.
3.3 GW is the installed capacity of Bakun and Murum dams. Source: https://www.sarawakenergy.com/
16
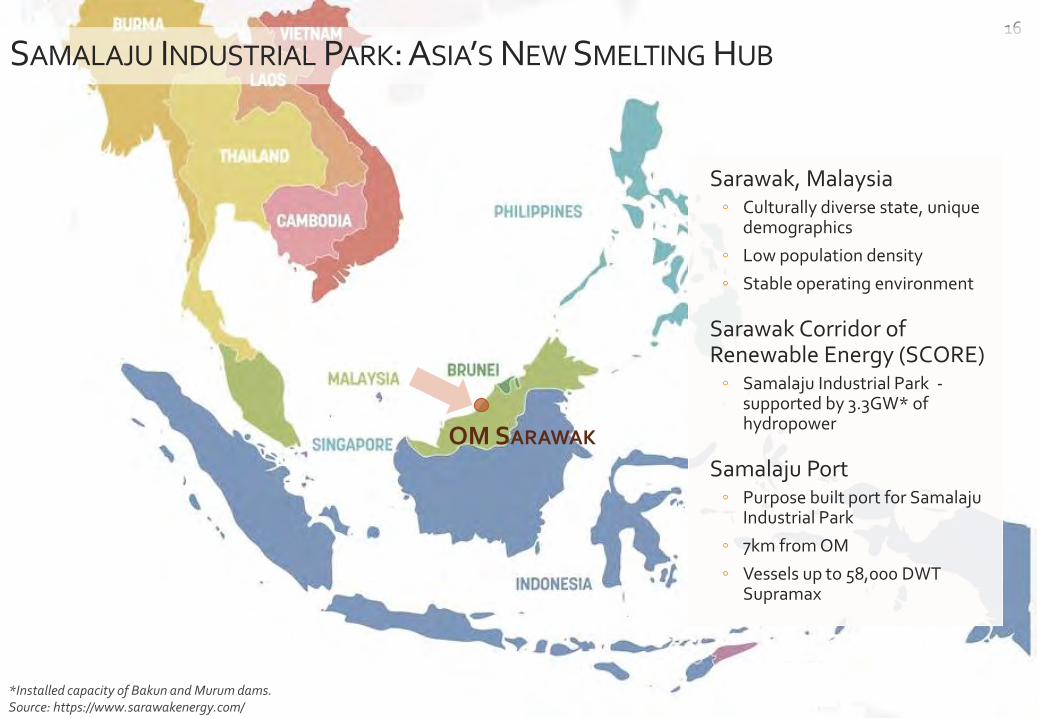
SAMALAJU INDUSTRIAL PARK: ASIA’S NEW SMELTING HUB
*Installed capacity of Bakun and Murum dams. Source: https://www.sarawakenergy.com/
Sarawak, Malaysia◦ Culturally diverse state, unique
demographics
◦ Low population density
◦ Stable operating environment
Sarawak Corridor of Renewable Energy (SCORE)◦ Samalaju Industrial Park -
supported by 3.3GW* of hydropower
Samalaju Port◦ Purpose built port for Samalaju
Industrial Park
◦ 7km from OM
◦ Vessels up to 58,000 DWT Supramax
OM SARAWAK
17
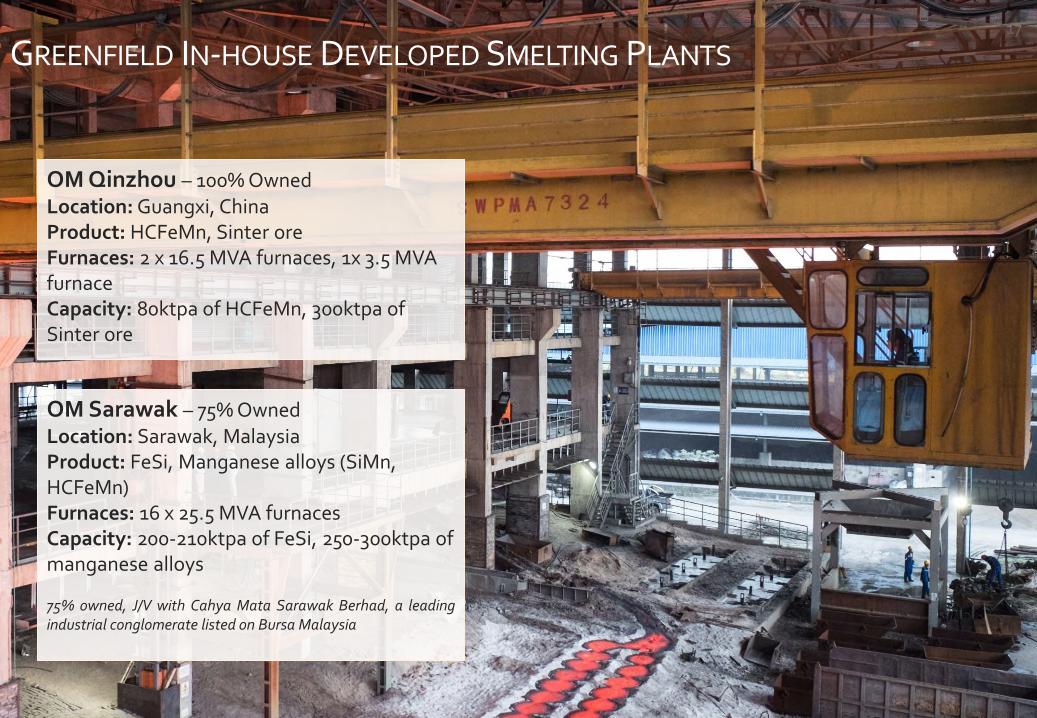
GREENFIELD IN-HOUSE DEVELOPED SMELTING PLANTS
OM Sarawak – 75% OwnedLocation: Sarawak, MalaysiaProduct: FeSi, Manganese alloys (SiMn, HCFeMn)Furnaces: 16 x 25.5 MVA furnacesCapacity: 200-210ktpa of FeSi, 250-300ktpa of manganese alloys
75% owned, J/V with Cahya Mata Sarawak Berhad, a leadingindustrial conglomerate listed on Bursa Malaysia
OM Qinzhou – 100% OwnedLocation: Guangxi, ChinaProduct: HCFeMn, Sinter oreFurnaces: 2 x 16.5 MVA furnaces, 1x 3.5 MVA furnaceCapacity: 80ktpa of HCFeMn, 300ktpa of Sinter ore
18
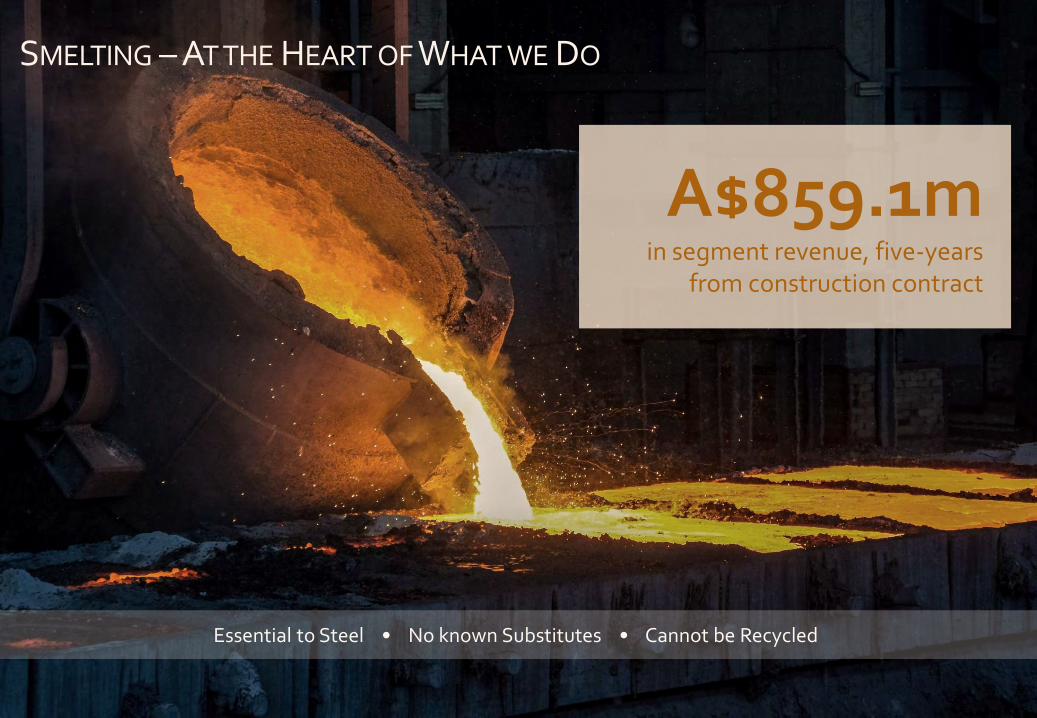
SMELTING – AT THE HEART OF WHAT WE DO
Essential to Steel • No known Substitutes • Cannot be Recycled
A$859.1min segment revenue, five-years
from construction contract
19
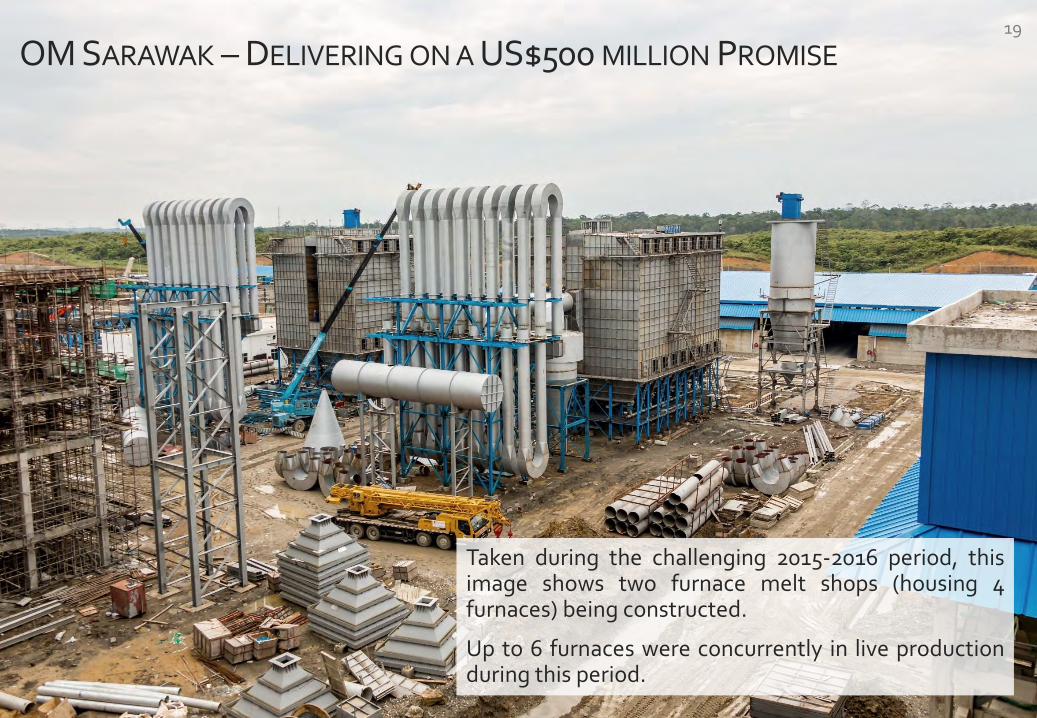
OM SARAWAK – DELIVERING ON A US$500 MILLION PROMISE
Taken during the challenging 2015-2016 period, thisimage shows two furnace melt shops (housing 4furnaces) being constructed.
Up to 6 furnaces were concurrently in live productionduring this period.
20
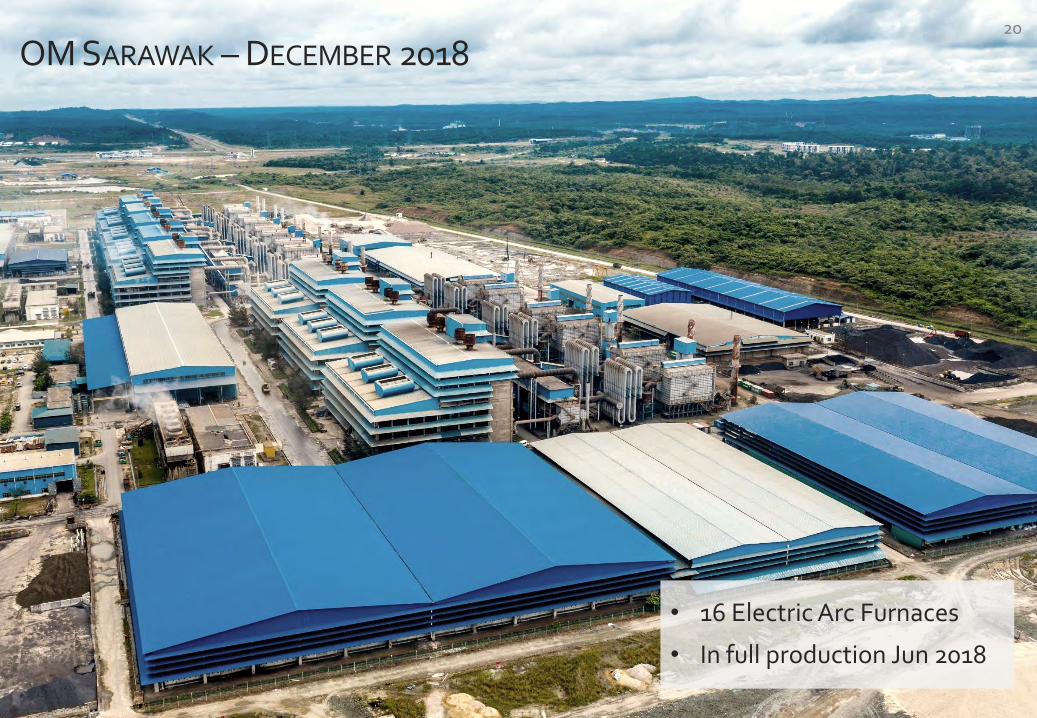
OM SARAWAK – DECEMBER 2018
• 16 Electric Arc Furnaces
• In full production Jun 2018
21
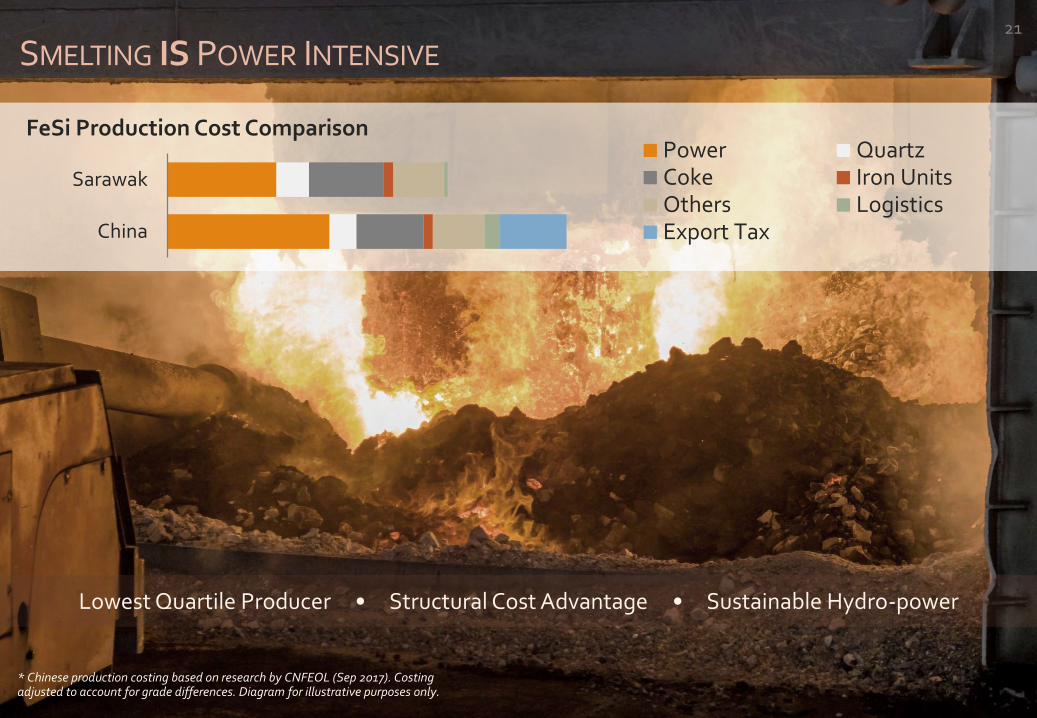
SMELTING IS POWER INTENSIVE
China
Sarawak
FeSi Production Cost ComparisonPower QuartzCoke Iron UnitsOthers LogisticsExport Tax
Lowest Quartile Producer • Structural Cost Advantage • Sustainable Hydro-power
* Chinese production costing based on research by CNFEOL (Sep 2017). Costing adjusted to account for grade differences. Diagram for illustrative purposes only.
22
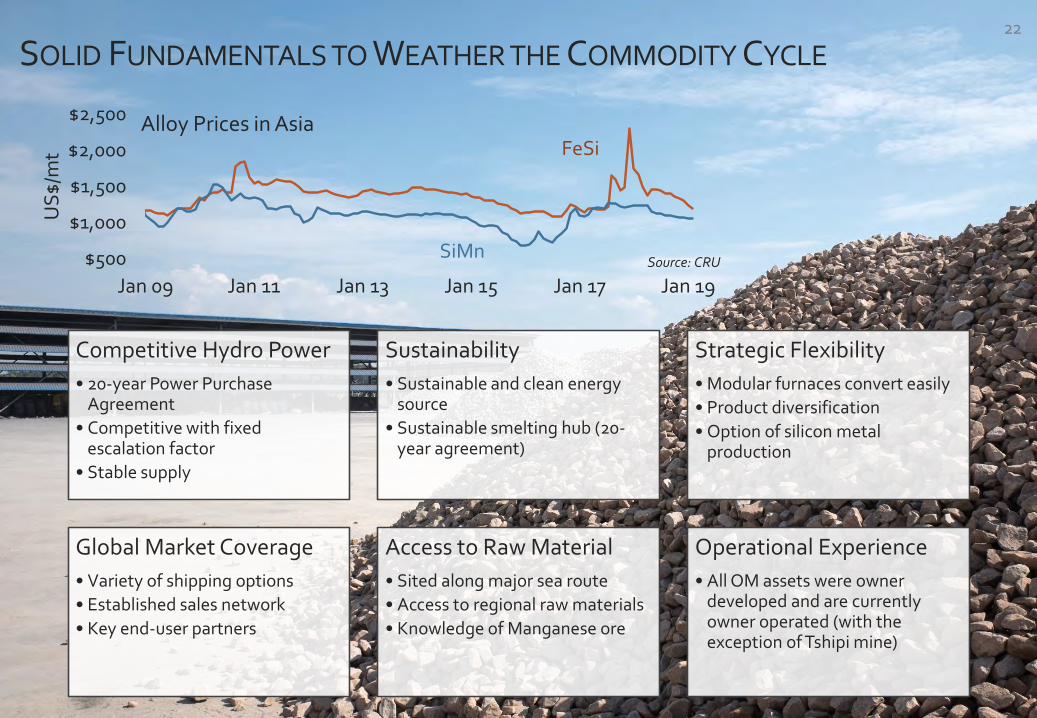
SOLID FUNDAMENTALS TO WEATHER THE COMMODITY CYCLE
Competitive Hydro Power
• 20-year Power Purchase Agreement
• Competitive with fixed escalation factor
• Stable supply
Sustainability
• Sustainable and clean energy source
• Sustainable smelting hub (20-year agreement)
Strategic Flexibility
• Modular furnaces convert easily
• Product diversification
• Option of silicon metal production
Global Market Coverage
• Variety of shipping options
• Established sales network
• Key end-user partners
Access to Raw Material
• Sited along major sea route
• Access to regional raw materials
• Knowledge of Manganese ore
Operational Experience
• All OM assets were owner developed and are currently owner operated (with the exception of Tshipi mine)
$500
$1,000
$1,500
$2,000
$2,500
Jan 09 Jan 11 Jan 13 Jan 15 Jan 17 Jan 19
US
$/m
t
Alloy Prices in AsiaFeSi
SiMnSource: CRU
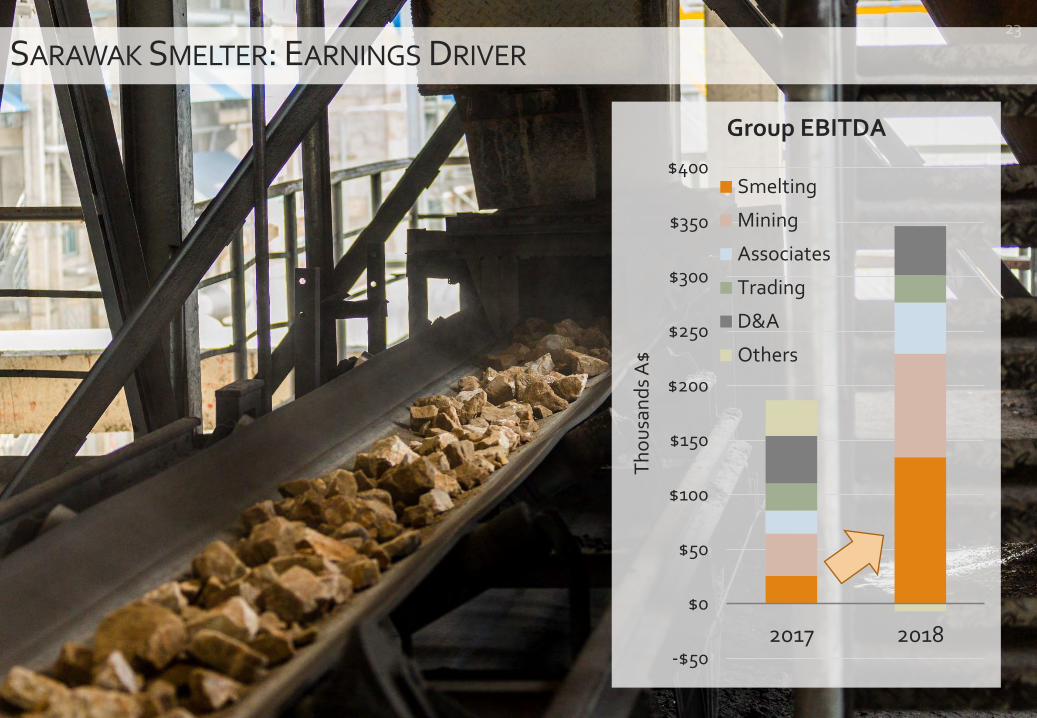
23
SARAWAK SMELTER: EARNINGS DRIVER
-$50
$0
$50
$100
$150
$200
$250
$300
$350
$400
2017 2018T
ho
usa
nd
s A
$
Group EBITDA
Smelting
Mining
Associates
Trading
D&A
Others
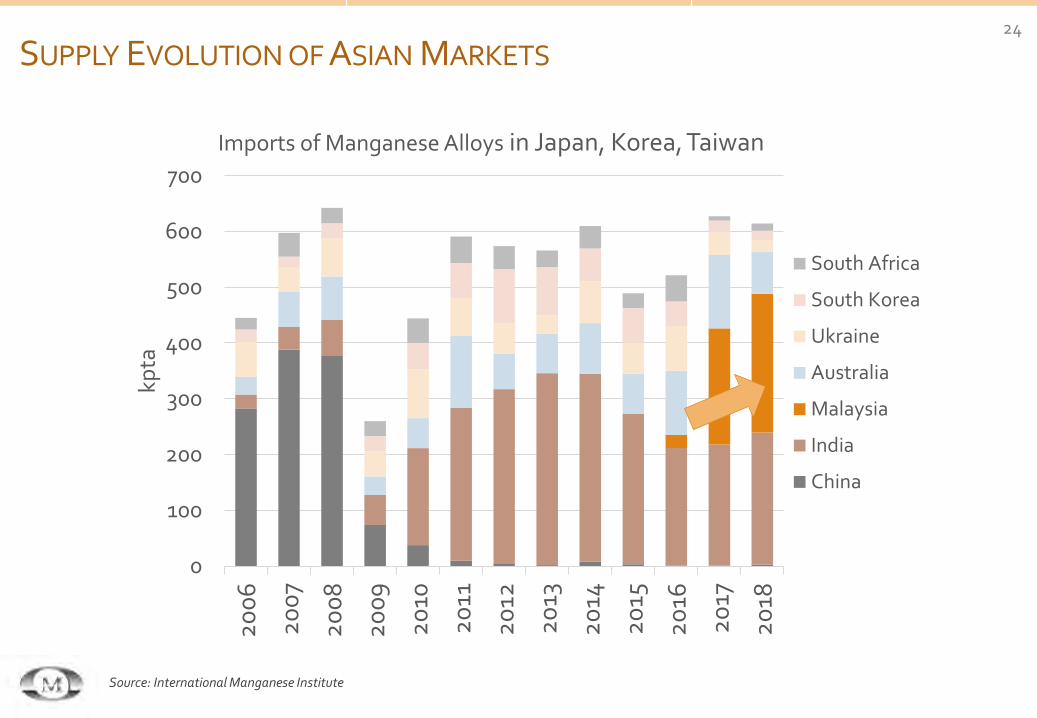
24
SUPPLY EVOLUTION OF ASIAN MARKETS
0
100
200
300
400
500
600
700
20
06
20
07
20
08
20
09
20
10
20
11
20
12
20
13
20
14
20
15
20
16
20
17
20
18
kpta
Imports of Manganese Alloys in Japan, Korea, Taiwan
South Africa
South Korea
Ukraine
Australia
Malaysia
India
China
Source: International Manganese Institute
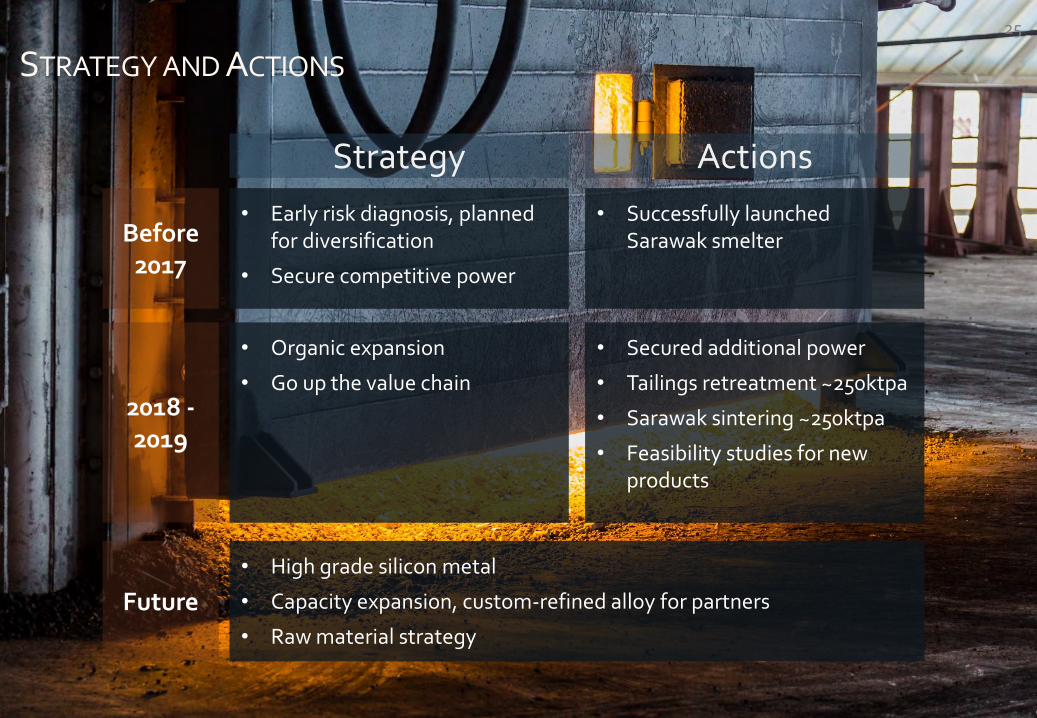
25
STRATEGY AND ACTIONS
ActionsStrategy
Before 2017
• Successfully launched Sarawak smelter
• Early risk diagnosis, planned for diversification
• Secure competitive power
• Secured additional power
• Tailings retreatment ~250ktpa
• Sarawak sintering ~250ktpa
• Feasibility studies for new products
• Organic expansion
• Go up the value chain2018 -2019
• High grade silicon metal
• Capacity expansion, custom-refined alloy for partners
• Raw material strategy
Future
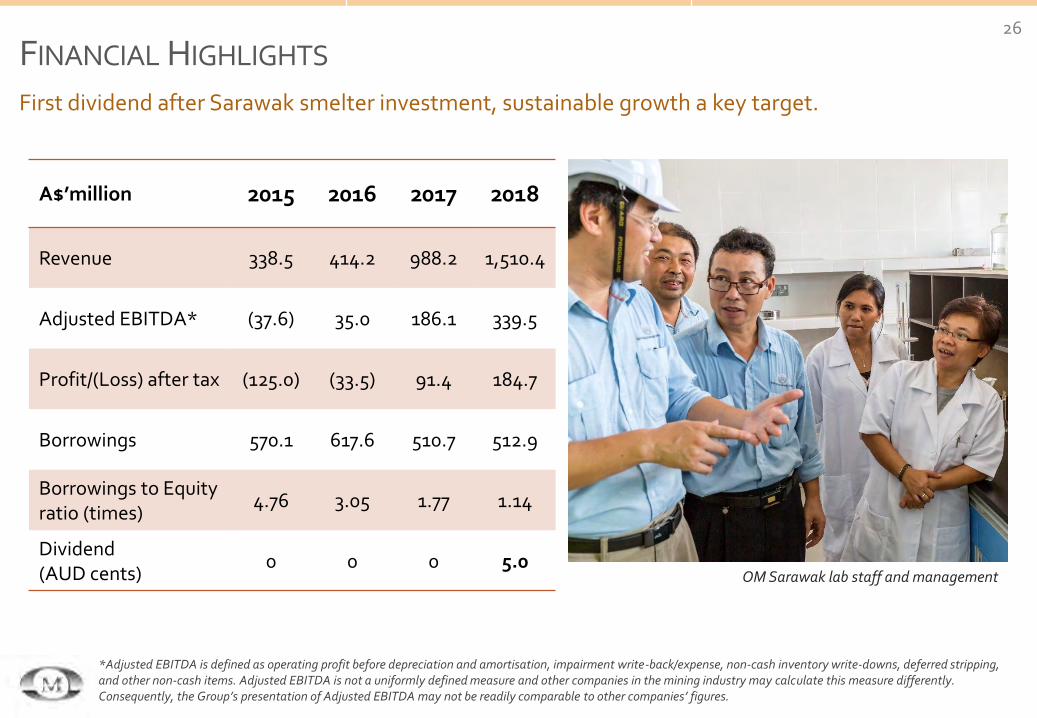
FINANCIAL HIGHLIGHTS26
First dividend after Sarawak smelter investment, sustainable growth a key target.
A$’million 2015 2016 2017 2018
Revenue 338.5 414.2 988.2 1,510.4
Adjusted EBITDA* (37.6) 35.0 186.1 339.5
Profit/(Loss) after tax (125.0) (33.5) 91.4 184.7
Borrowings 570.1 617.6 510.7 512.9
Borrowings to Equity ratio (times)
4.76 3.05 1.77 1.14
Dividend (AUD cents)
0 0 0 5.0
*Adjusted EBITDA is defined as operating profit before depreciation and amortisation, impairment write-back/expense, non-cash inventory write-downs, deferred stripping, and other non-cash items. Adjusted EBITDA is not a uniformly defined measure and other companies in the mining industry may calculate this measure differently. Consequently, the Group’s presentation of Adjusted EBITDA may not be readily comparable to other companies’ figures.
OM Sarawak lab staff and management
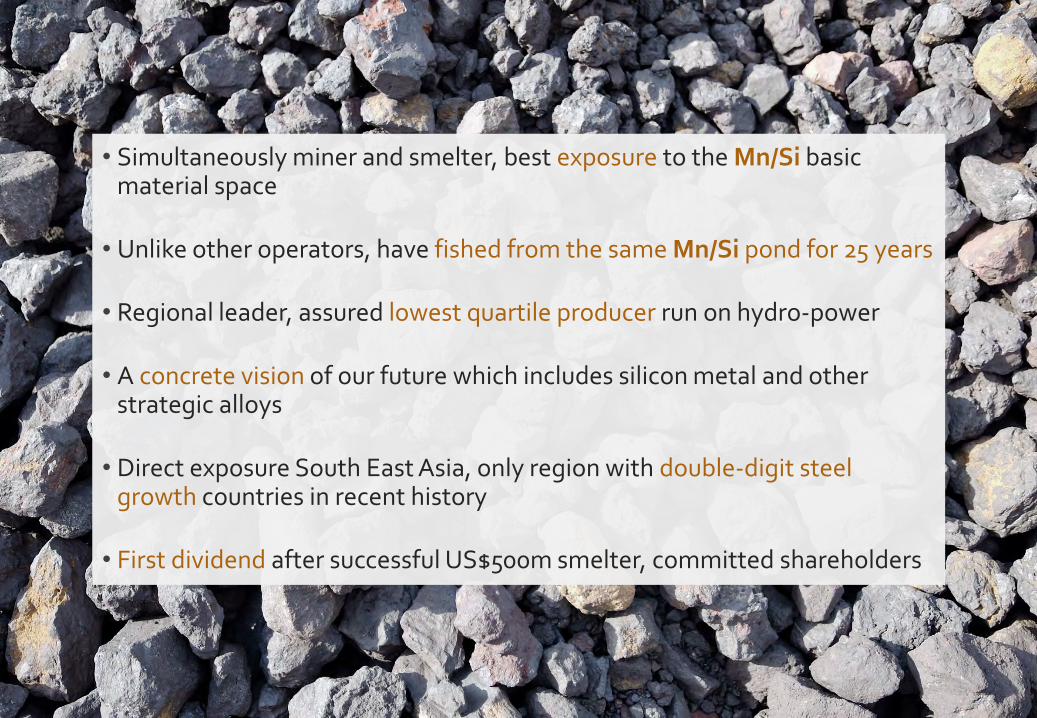
• Simultaneously miner and smelter, best exposure to the Mn/Si basic material space
• Unlike other operators, have fished from the same Mn/Si pond for 25 years
• Regional leader, assured lowest quartile producer run on hydro-power
• A concrete vision of our future which includes silicon metal and other strategic alloys
• Direct exposure South East Asia, only region with double-digit steel growth countries in recent history
• First dividend after successful US$500m smelter, committed shareholders
27
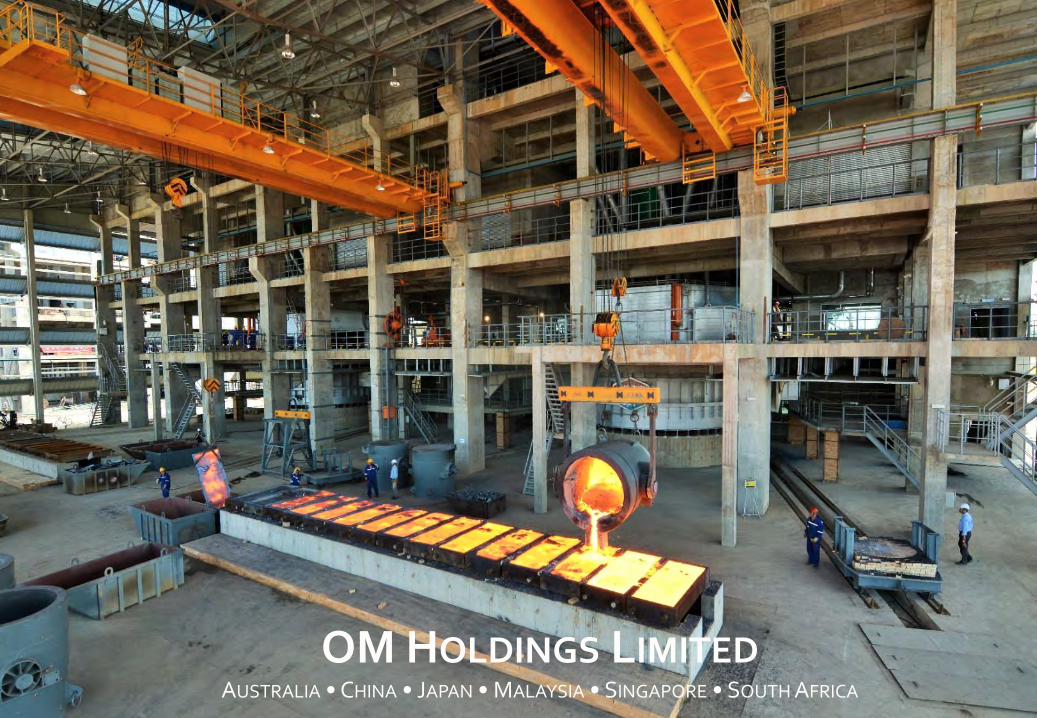
28
OM HOLDINGS LIMITEDAUSTRALIA • CHINA • JAPAN • MALAYSIA • SINGAPORE • SOUTH AFRICA


