172
User’s Guide OMEGAMON ® XE for CICSplex Version 220 GC32-9295-00 March 2002 Candle Corporation 201 North Douglas Street El Segundo, California 90245
User’s GuideOMEGAMON® XE for CICSplex
Version 220
GC32-9295-00
March 2002
Candle Corporation201 North Douglas Street
El Segundo, California 90245
2 OMEGAMON XE for CICSplex User’s Guide, Version 220
Registered trademarks and service marks of Candle Corporation: AF/OPERATOR, AF/PERFORMER, AF/REMOTE, Availability Command Center, Candle, Candle Command Center, Candle Direct logo, Candle Electronic Customer Support, Candle logo, Candle Management Server, Candle Management Workstation, Candle Technologies, CL/CONFERENCE, CL/SUPERSESSION, CommandWatch, CT, CT/Data Server, CT/DS, DELTAMON, eBA, eBA*ServiceMonitor, eBA*ServiceNetwork, eBusiness Institute, ETEWatch, IntelliWatch, IntelliWatch Pinnacle, MQSecure, MQView, OMEGACENTER, OMEGAMON, OMEGAMON/e, OMEGAMON II, OMEGAMON Monitoring Agent, OMEGAVIEW, OMEGAVIEW II, PQEdit, Solutions for Networked Applications, Solutions for Networked Businesses, and Transplex.Trademarks and service marks of Candle Corporation: Alert Adapter, Alert Adapter Plus, Alert Emitter, AMS, Amsys, AutoBridge, AUTOMATED FACILITIES, Availability Management Systems, Candle Alert, Candle Business Partner Logo, Candle Command Center/SentinelManager, Candle CommandPro, Candle CIRCUIT, Candle eDelivery, CandleLight, CandleNet, CandleNet 2000, CandleNet Command Center, CandleNet eBP, CandleNet eBP Access, CandleNet eBP Administrator, CandleNet eBP Broker Access, CandleNet eBP Configuration, CandleNet eBP Connector, CandleNet eBP File Transfer, CandleNet eBP Host Connect, CandleNet eBP Object Access, CandleNet eBP Object Browser, CandleNet eBP Secure Access, CandleNet eBP Service Directory, CandleNet eBP Universal Connector, CandleNet eBP Workflow Access, CandleNet eBusiness Assurance, CandleNet eBusiness Exchange, CandleNet eBusiness Platform, CandleNet eBusiness Platform Administrator, CandleNet eBusiness Platform Connector, CandleNet eBusiness Platform Connectors, CandleNet eBusiness Platform Powered by Roma Technology, CandleNet eBusiness Platform Service Directory, CandleNet Portal, CCC, CCP, CEBA, CECS, CICAT, CL/ENGINE, CL/GATEWAY, CL/TECHNOLOGY, CMS, CMW, Command & Control, Connect-Notes, Connect-Two, CSA ANALYZER, CT/ALS, CT/Application Logic Services, CT/DCS, CT/Distributed Computing Services, CT/Engine, CT/Implementation Services, CT/IX, CT/Workbench, CT/Workstation Server, CT/WS, !DB Logo, !DB/DASD, !DB/EXPLAIN, !DB/MIGRATOR, !DB/QUICKCHANGE, !DB/QUICKCOMPARE, !DB/SMU, !DB/Tools, !DB/WORKBENCH, Design Network, DEXAN, e2e, eBAA, eBAAuditor, eBAN, eBANetwork, eBAAPractice, eBP, eBusiness Assurance, eBusiness Assurance Network, eBusiness at the speed of light, eBusiness at the speed of light logo, eBusiness Exchange, eBusiness Institute, eBX, End-to-End, ENTERPRISE, Enterprise Candle Command Center, Enterprise Candle Management Workstation, Enterprise Reporter Plus, EPILOG, ER+, ERPNet, ESRA, ETEWatch Customizer, HostBridge, InterFlow, Candle InterFlow, Lava Console, MessageMate, Messaging Mastered, Millennium Management Blueprint, MMNA, MQADMIN, MQEdit, MQEXPERT, MQMON, NBX, NetGlue, NetGlue Extra, NetMirror, NetScheduler, OMA, OMC Gateway, OMC Status Manager, OMEGACENTER Bridge, OMEGACENTER Gateway, OMEGACENTER Status Manager, OMEGAMON Management Center, OSM, PC COMPANION, Performance Pac, PowerQ, PQConfiguration, PQScope, Response Time Network, Roma, Roma Application Manager, Roma Broker, Roma BSP, Roma Connector, Roma Developer, Roma FS/A, Roma FS/Access, RomaNet, Roma Network, Roma Object Access, Roma Secure, Roma WF/Access, Roma Workflow Access, RTA, RTN, SentinelManager, Somerset, Somerset Systems, Status Monitor, The Millennium Alliance, The Millennium Alliance logo, The Millennium Management Network Alliance, TMA2000, Tracer, Unified Directory Services, Volcano and ZCopy.Trademarks and registered trademarks of other companies: AIX, DB2, MQSeries and WebSphere are registered trademarks of International Business Machines Corporation. SAP is a registered trademark and R/3 is a trademark of SAP AG. UNIX is a registered trademark in the U.S. and other countries, licensed exclusively through X/Open Company Ltd. HP-UX is a trademark of Hewlett-Packard Company. SunOS is a trademark of Sun Microsystems, Inc. All other company and product names used herein are trademarks or registered trademarks of their respective companies.
Copyright © March 2002, Candle Corporation, a California corporation. All rights reserved. International rights secured.
Threaded Environment for AS/400, Patent No. 5,504,898; Data Server with Data Probes Employing Predicate Tests in Rule Statements (Event Driven Sampling), Patent No. 5,615,359; MVS/ESA Message Transport System Using the XCF Coupling Facility, Patent No. 5,754,856; Intelligent Remote Agent for Computer Performance Monitoring, Patent No. 5,781,703; Data Server with Event Driven Sampling, Patent No. 5,809,238; Threaded Environment for Computer Systems Without Native Threading Support, Patent No. 5,835,763; Object Procedure Messaging Facility, Patent No. 5,848,234; End-to-End Response Time Measurement for Computer Programs, Patent No. 5,991,705; Communications on a Network, Patent Pending; Improved Message Queuing Based Network Computing Architecture, Patent Pending; User Interface for System Management Applications, Patent Pending.
NOTICE: This documentation is provided with RESTRICTED RIGHTS. Use, duplication, or disclosure by the Government is subject to restrictions set forth in the applicable license agreement and/or the applicable government rights clause.This documentation contains confidential, proprietary information of Candle Corporation that is licensed for your internal use only. Any unauthorized use, duplication, or disclosure is unlawful.
Contents
List of Tables . . . . . . . . . . . . . . . . . . . . . . . . . . . . . . . . . . . . . . . . . . . . . . . . . . 7
Preface . . . . . . . . . . . . . . . . . . . . . . . . . . . . . . . . . . . . . . . . . . . . . . . . . . 9
What’s New . . . . . . . . . . . . . . . . . . . . . . . . . . . . . . . . . . . . . . . . . . . . . . . . . 15
Chapter 1. OMEGAMON XE for CICSplex Overview . . . . . . . . . . . . . . . . 17OMEGAMON XE for CICSplex Operating Environment . . . . . . . . . . 18Introducing OMEGAMON XE for CICSplex . . . . . . . . . . . . . . . . . . . 23Features of OMEGAMON XE for CICSplex . . . . . . . . . . . . . . . . . . . . 25
Chapter 2. Learning About OMEGAMON XE for CICSplex. . . . . . . . . . . . 27What is a CICSplex? . . . . . . . . . . . . . . . . . . . . . . . . . . . . . . . . . . . . . 30ISC and MRO Communication Methods . . . . . . . . . . . . . . . . . . . . . . 32Connections and Links Between CICS Regions . . . . . . . . . . . . . . . . . 34Understanding OMEGAMON XE for CICSplex Attributes . . . . . . . . . 37Understanding OMEGAMON XE for CICSplex Reports. . . . . . . . . . . 38Working with OMEGAMON XE for CICSplex Reports in CMW . . . . . 40Working with Workspaces in CandleNet Portal . . . . . . . . . . . . . . . . . 44Understanding the OMEGAMON XE for CICSplex Situations . . . . . . 50Using CandleNet Portal to Work with Situations . . . . . . . . . . . . . . . . 51Working with CICS Product-provided Situations in CMW . . . . . . . . . 56Setting Up a CICSplex. . . . . . . . . . . . . . . . . . . . . . . . . . . . . . . . . . . . 58Using Auto Node Generation . . . . . . . . . . . . . . . . . . . . . . . . . . . . . . 61Using the IBM System Manager Facility . . . . . . . . . . . . . . . . . . . . . . . 65
Chapter 3. Introducing the OMEGAMON XE for CICSplex Report Groups . . . . . . . . . . . . . . . . . . . . . . . . . . . . . . . . . . . . . 67OMEGAMON XE for CICSplex Report Groups . . . . . . . . . . . . . . . . . 68Navigating in a Report Group . . . . . . . . . . . . . . . . . . . . . . . . . . . . . . 74
Contents 3
Chapter 4. CICS Connections Analysis Report Group . . . . . . . . . . . . . . . . 77Introducing the CICS Connections Analysis Reports . . . . . . . . . . . . . 79CICS Connections Analysis Report . . . . . . . . . . . . . . . . . . . . . . . . . . 81CICS Connections Summary Report . . . . . . . . . . . . . . . . . . . . . . . . . 83Link Summary Report . . . . . . . . . . . . . . . . . . . . . . . . . . . . . . . . . . . . 85CICS Link Allocation Chart . . . . . . . . . . . . . . . . . . . . . . . . . . . . . . . . 87CICS Link Usage Chart in CMW . . . . . . . . . . . . . . . . . . . . . . . . . . . . 88Typical Scenarios in CMW. . . . . . . . . . . . . . . . . . . . . . . . . . . . . . . . . 89
Chapter 5. CICS Region Analysis Report Group. . . . . . . . . . . . . . . . . . . . . 91Introducing the CICS Region Analysis Reports . . . . . . . . . . . . . . . . . 93CICS Region Analysis Report . . . . . . . . . . . . . . . . . . . . . . . . . . . . . . 96CICS Region Summary Chart . . . . . . . . . . . . . . . . . . . . . . . . . . . . . 100CICS Storage Summary Report. . . . . . . . . . . . . . . . . . . . . . . . . . . . 101CICSplex MQ Connection Details Report . . . . . . . . . . . . . . . . . . . . 103CICS VSAM Analysis Report . . . . . . . . . . . . . . . . . . . . . . . . . . . . . . 105Regions Sharing a VSAM File Report . . . . . . . . . . . . . . . . . . . . . . . 107Typical Scenarios in CMW. . . . . . . . . . . . . . . . . . . . . . . . . . . . . . . . 109
Chapter 6. CICS Service Level Analysis Report Group . . . . . . . . . . . . . . 113Introducing the CICS Service Level Analysis Reports . . . . . . . . . . . 115CICS Service Level Analysis Report . . . . . . . . . . . . . . . . . . . . . . . . 117Service Class Analysis Report . . . . . . . . . . . . . . . . . . . . . . . . . . . . . 119Service Class Analysis by Region Report . . . . . . . . . . . . . . . . . . . . . 120Service Class Analysis by Transaction ID Report . . . . . . . . . . . . . . . 122Service Class Time Distribution Chart . . . . . . . . . . . . . . . . . . . . . . . 124Service Level Performance . . . . . . . . . . . . . . . . . . . . . . . . . . . . . . . 125Typical Scenarios in CMW. . . . . . . . . . . . . . . . . . . . . . . . . . . . . . . . 126
Chapter 7. CICS Shared Temporary Storage Report Group . . . . . . . . . . . 129Introducing the CICS Shared Temporary Storage Reports . . . . . . . . 131CICS Shared Temporary Storage Summary Report. . . . . . . . . . . . . 132CICS Shared Temporary Storage Queues Report . . . . . . . . . . . . . . 133Typical Scenarios in CMW. . . . . . . . . . . . . . . . . . . . . . . . . . . . . . . . 134
4 OMEGAMON XE for CICSplex User’s Guide, Version 220
Chapter 8. CICS Transaction Analysis Report Group . . . . . . . . . . . . . . . . 135Introducing the CICS Transaction Analysis Reports . . . . . . . . . . . . . 137CICS Transaction Analysis Report . . . . . . . . . . . . . . . . . . . . . . . . . . 139UOW by Region Report . . . . . . . . . . . . . . . . . . . . . . . . . . . . . . . . . 141UOW by Transaction Report . . . . . . . . . . . . . . . . . . . . . . . . . . . . . . 143Typical Scenarios in CMW. . . . . . . . . . . . . . . . . . . . . . . . . . . . . . . . 145
Chapter 9. CICS Topology Report Group. . . . . . . . . . . . . . . . . . . . . . . . . 147Introducing the CICS Topology Reports for CMW . . . . . . . . . . . . . . 149CICS Topology Report . . . . . . . . . . . . . . . . . . . . . . . . . . . . . . . . . . 150CICS Region Detail Report . . . . . . . . . . . . . . . . . . . . . . . . . . . . . . . 152CICS Connections Summary Report . . . . . . . . . . . . . . . . . . . . . . . . 154Typical Scenarios in CMW. . . . . . . . . . . . . . . . . . . . . . . . . . . . . . . . 155
Chapter 10. CICS VSAM RLS Lock Analysis Report Group. . . . . . . . . . . . 157Introducing the CICS VSAM RLS Lock Analysis Report Group . . . . 158Typical Scenarios in CMW. . . . . . . . . . . . . . . . . . . . . . . . . . . . . . . . 160
Appendix A. Guide to Candle Customer Support . . . . . . . . . . . . . . . . . . . . 161Base Maintenance Plan . . . . . . . . . . . . . . . . . . . . . . . . . . . . . . . . . . 162Enhanced Support Services . . . . . . . . . . . . . . . . . . . . . . . . . . . . . . 166Customer Support Contact Information. . . . . . . . . . . . . . . . . . . . . . 168
Index . . . . . . . . . . . . . . . . . . . . . . . . . . . . . . . . . . . . . . . . . . . . . . . . 169
Contents 5

6 OMEGAMON XE for CICSplex User’s Guide, Version 220
List of Tables
Table 1. Product Features . . . . . . . . . . . . . . . . . . . . . . . . . . . . . . . . . . . . . . . . 25Table 2. CICS Report Groups for CMW . . . . . . . . . . . . . . . . . . . . . . . . . . . . . 68Table 3. CICS Reports for CMW . . . . . . . . . . . . . . . . . . . . . . . . . . . . . . . . . . . 70Table 4. CICS Workspaces for CandleNet Portal . . . . . . . . . . . . . . . . . . . . . . . 71Table 5. CICS Connections Analysis Reports . . . . . . . . . . . . . . . . . . . . . . . . . 79Table 6. CICS Region Analysis Reports and Chart . . . . . . . . . . . . . . . . . . . . . 94Table 7. CICS Service Level Analysis Reports . . . . . . . . . . . . . . . . . . . . . . . . 115Table 8. CICS Shared Temporary Storage Reports . . . . . . . . . . . . . . . . . . . . 131Table 9. CICS Transaction Analysis Reports . . . . . . . . . . . . . . . . . . . . . . . . . 137
Table 10. CICS Topology Reports . . . . . . . . . . . . . . . . . . . . . . . . . . . . . . . . . . 149
List of Tables 7

8 OMEGAMON XE for CICSplex User’s Guide, Version 220
Preface
P
The OMEGAMON XE for CICSplex User’s Guide, Version 220 provides information about the OMEGAMON® XE for CICSplex product for the Candle Management Workstation® (CMW™) and CandleNet Portal™ platforms. It discusses the CICS reports for CMW, which correspond to the workspace and table view information in CandleNet Portal.Preface 9
About This Book
About This Book
Who should use this guideThis manual is intended to be used by data center personnel who are responsible for monitoring CICS performance, systems programmers and performance analysts who are responsible for a CICS system, and application programmers who want to monitor their programs.
This user’s guide provides additional information for using OMEGAMON XE for CICSplex to monitor CICS systems through a CMW or CandleNet Portal interface. This manual supplements the online help for OMEGAMON XE for CICSplex.
This guide serves the following audiences:
n operators
n system programers
n systems administrators
n network administrators
n Candle® sales force and field support
Prerequisites for using this guideThis manual assumes that you
n have installed and configured the Candle Management Server®(CMS®), the CMW, and OMEGAMON XE for CICSplex as described in the installation manuals shipped with these products
n have optionally installed the CandleNet Portal for OMEGAMON XE for CICSplex
n are familiar with basic CCC concepts and tasks, including
– how to use attributes to define situations and how to modify predefined situations
– the roles managed systems and managed objects play in a CCC
– what alerts and events are and how they affect managed objects
10 OMEGAMON XE for CICSplex User’s Guide, Version 220
About This Book
If you are unfamiliar with these concepts and tasks, please review the CMW online tutorial and the Candle Management Workstation Quick Reference before beginning this manual. If you will use CandleNet Portal, you should review the online Quick Tour to become familiar with the product’s features and capabilities.
Why you should use this guideThis guide will help you understand how to use the OMEGAMON XE to monitor CICS systems. This manual supplements the online help for OMEGAMON XE for CICSplex. Candle recommends that you refer to this guide whenever you need additional information about the CICS product and reports.
Organization of this guideThis guide begins with a chapter that introduces you to OMEGAMON XE for CICSplex. The next chapters
n familiarize you with the CICS attributes, reports, and product-provided situations
n introduce you to the OMEGAMON XE for CICS reports groups
n cover the specific reports in each report group
The remaining parts of this guide consist of an appendix for customer support information, an index, and a user comment form. Use the index in this guide to locate information about specific attributes.
Documentation set informationIn addition to this User’s Guide, you should refer to the following documents that provide information:
n CandleNet Portal / Systems Management Edition Administrator’s Guide, CJ99-6348
n OMEGAMON XE for OS/390 Configuration and Customization Guide, M351-6432
n Candle Management Workstation Administrator’s Guide, MW53-6049
Preface 11
About This Book
n CandleNet Command Center Historical Data Collection User’s Guide, MW99-6404
Also, refer to the online Help for both the Candle Mangement Workstation and CandleNet Portal.
Where to look for more informationFor more information related to this product and other related products, please see the
n technical documentation CD-ROM that came with your product
n technical documentation information available on the Candle Web site at www.candle.com
n online help provided with this and the other related products
Ordering additional documentationTo order additional product manuals, contact your Candle Support Services representative.
We would like to hear from youCandle welcomes your comments and suggestions for changes or additions to the documentation set. A user comment form, located at the back of each manual, provides simple instructions for communicating with the Candle Information Development department. You can also send email to [email protected]. Please include “OMEGAMON XE for CICSplex User’s Guide, Version 220” in the subject line.
12 OMEGAMON XE for CICSplex User’s Guide, Version 220
Adobe Portable Document Format
Adobe Portable Document Format
Printing this bookCandle supplies documentation in the Adobe Portable Document Format (PDF). The Adobe Acrobat Reader will print PDF documents with the fonts, formatting, and graphics in the original document. To print a Candle document, do the following:
1. Specify the print options for your system. From the Acrobat Reader Menu bar, select File > Page Setup… and make your selections. A setting of 300 dpi is highly recommended as is duplex printing if your printer supports this option.
2. To start printing, select File > Print... on the Acrobat Reader Menu bar.
3. On the Print pop-up, select one of the Print Range options forn Alln Current pagen Pages from: [ ] to: [ ]
4. (Optional). Select the Shrink to Fit option if you need to fit oversize pages to the paper size currently loaded on your printer.
Printing problems?The print quality of your output is ultimately determined by your printer. Sometimes printing problems can occur. If you experience printing problems, potential areas to check are:n settings for your printer and printer driver. (The dpi settings for both your
driver and printer should be the same. A setting of 300 dpi is recommended.)
n the printer driver you are using. (You may need a different printer driver or the Universal Printer driver from Adobe. This free printer driver is available at www.adobe.com.)
n the halftone/graphics color adjustment for printing color on black and white printers (check the printer properties under Start > Settings > Printer). For more information, see the online help for the Acrobat Reader.
n the amount of available memory in your printer. (Insufficient memory can cause a document or graphics to fail to print.)
For additional information on printing problems, refer to the documentation for your printer or contact your printer manufacturer.
Preface 13
Adobe Portable Document Format
Contacting AdobeIf additional information is needed about Adobe Acrobat Reader or printing problems, see the Readme.pdf file that ships with Adobe Acrobat Reader or contact Adobe at www.adobe.com.
14 OMEGAMON XE for CICSplex User’s Guide, Version 220
What’s New
W
Candle monitoring agents have a new nameCandle’s intelligent monitoring agents that comprise the OMEGAMON XE suite of products and use the CandleNet Portal user interface have been renamed. You will see the new names in the product help and documentation.
Within the application, some of the panels do not reflect the new product name. However, all of the intelligent functionality of OMEGAMON XE is available for these agents. The new product names will be added to the applications in a subsequent release.
What’s New 15

16 OMEGAMON XE for CICSplex User’s Guide, Version 220
OMEGAMON XE for CICSplexOverview1
IntroductionThis chapter introduces you to the OMEGAMON line of products, generally, and specifically toOMEGAMON XE for CICSplex.
Chapter contents
OMEGAMON XE for CICSplex Operating Environment . . . . . . . . . . . . . . . . . . . . 18
Overview . . . . . . . . . . . . . . . . . . . . . . . . . . . . . . . . . . . . . . . . . . . . . . . . . . . . 18What is OMEGAMON XE?. . . . . . . . . . . . . . . . . . . . . . . . . . . . . . . . . . . . . . . 18Components of the environment . . . . . . . . . . . . . . . . . . . . . . . . . . . . . . . . . . 18What is CandleNet Portal? . . . . . . . . . . . . . . . . . . . . . . . . . . . . . . . . . . . . . . . 19What is the Candle Management Workstation?. . . . . . . . . . . . . . . . . . . . . . . . 19What is OMEGAMON DE?. . . . . . . . . . . . . . . . . . . . . . . . . . . . . . . . . . . . . . . 20Historical data collection. . . . . . . . . . . . . . . . . . . . . . . . . . . . . . . . . . . . . . . . . 21
Introducing OMEGAMON XE for CICSplex . . . . . . . . . . . . . . . . . . . . . . . . . . . . . 23Overview . . . . . . . . . . . . . . . . . . . . . . . . . . . . . . . . . . . . . . . . . . . . . . . . . . . . 23Using OMEGAMON XE for CICSplex. . . . . . . . . . . . . . . . . . . . . . . . . . . . . . . 23How OMEGAMON XE for CICSplex assists you. . . . . . . . . . . . . . . . . . . . . . . 23Advanced monitoring facilities . . . . . . . . . . . . . . . . . . . . . . . . . . . . . . . . . . . . 24Planning and installation . . . . . . . . . . . . . . . . . . . . . . . . . . . . . . . . . . . . . . . . 24Information about the CMS and CMW . . . . . . . . . . . . . . . . . . . . . . . . . . . . . . 24
Features of OMEGAMON XE for CICSplex . . . . . . . . . . . . . . . . . . . . . . . . . . . . . . 25Overview . . . . . . . . . . . . . . . . . . . . . . . . . . . . . . . . . . . . . . . . . . . . . . . . . . . . 25User interface . . . . . . . . . . . . . . . . . . . . . . . . . . . . . . . . . . . . . . . . . . . . . . . . . 25Product features . . . . . . . . . . . . . . . . . . . . . . . . . . . . . . . . . . . . . . . . . . . . . . . 25
OMEGAMON XE for CICSplex Overview 17
OMEGAMON XE for CICSplex Operating Environment
OMEGAMON XE for CICSplex Operating Environment
Overview
OMEGAMON XE for CICSplex can help you to address the increasing challenges presented by today’s technical environment. In this unit you learn about the operating environment in which the OMEGAMON XE for CICSplex resides.
What is OMEGAMON XE?OMEGAMON XE is a suite of products that assists you in monitoring your mainframe and distributed systems on a variety of platforms using a variety of workstations.
It provides a way to monitor the availability and performance of all the systems in your enterprise from one or several designated workstations. It provides many useful reports you can use to track trends and understand and troubleshoot system problems. You can use OMEGAMON XE to
n establish your own performance thresholdsn create situations, which are conditions to monitorn create and send commands to systems in your managed enterprise by
means of the Take Action feature. Take Action enables you to, for instance, restart a process that is not functioning properly or send a message
n create comprehensive reports about system conditionsn monitor for alerts on the systems and platforms you are managingn trace the causes leading up to an alert
n define your own queries, using the attributes provided by OMEGAMON XE for CICSplex, to monitor conditions of particular interest to you
Components of the environmentThe client-server-agent implementation includes
n a client, that can be
– a CandleNet Portal workstation
18 OMEGAMON XE for CICSplex User’s Guide, Version 220
OMEGAMON XE for CICSplex Operating Environment
– a Candle Management Workstation® (CMW™), used primarily for managing work groups and work lists, data items, and managed systems lists.
n a server, known as the Candle Management Server® (CMS™)
n a CandleNet Portal server that performs common CandleNet Portal functions and serves to lighten the CandleNet Portal client
n monitoring agents that collect and distribute data to a CMS. The OMEGAMON XE for CICSplex is such an agent.
An additional feature package, OMEGAMON DE®, is available with OMEGAMON XE. This feature package provides all the capability of OMEGAMON XE, plus additional capabilities as described later in this chapter.
What is CandleNet Portal?CandleNet Portal is the user interface into your OMEGAMON XE product set. It provides a view of your enterprise from which you can drill down to more closely examine components of your systems environment. Its application window consists of a Navigator that shows all the systems in your enterprise where Candle agents are installed, and a workspace that includes table and chart views of system and application conditions.
CandleNet Portal runs situations at regular intervals to check that your applications and system resources are running, and running well. A failed test causes event indicators to appear in the Navigator.
CandleNet Portal offers two modes of operation: desktop and browser. In desktop mode, the application software is installed on your system. In browser mode, the system administrator installs the application on the web server and you start CandleNet Portal from your browser. In browser mode, the software is downloaded to your system the first time you log on to CandleNet Portal, and thereafter only when there are software updates.
What is the Candle Management Workstation?– When using OMEGAMON XE for CICSplex, you use the Candle
Management Workstation (CMW) to manage work groups and work lists, data items, and managed systems lists.
OMEGAMON XE for CICSplex Overview 19
OMEGAMON XE for CICSplex Operating Environment
Further Information about the CMW and CandleNet Portal
For further information about CandleNet Portal, refer to the product’s online Help and to Administering OMEGAMON Products with CandleNet Portal.
Further information about using the CMW for user administration can be found in the Candle Management Workstation Administrator’s Guide as well as in the CMW online Help.
If you are an experienced CMW user, you should review the CandleNet Portal help topic called “CMW Users.” This topic addresses the similarities and differences of these user interfaces, provides guidance about each interface’s functionality, and a cross-reference listing that clarifies the products’ terminology.
What is OMEGAMON DE?The OMEGAMON DE feature package for CandleNet Portal offers a dashboard view of your enterprise. This feature provides a single point of control from which you can manage the resources your business-critical applications rely on, including a range of operating systems, servers, databases, mainframes, and Web components. It enables you to pull together the data and functionality built into all the Candle monitoring solutions, such as OMEGAMON XE for OS/390. OMEGAMON DE provides all the capability of OMEGAMON XE, plus these additional capabilities:
n Multiple applications can be displayed in one workspace
In a single workspace, you can build a table or chart with data from one type of monitoring agent, and another table or chart with data from a different agent. Within that workspace, you can show views from as many different agent types as are included on that branch of the Navigator.
n You can link application workspaces
You can define a link from a workspace associated with one type of monitoring agent to a workspace associated with another type of agent.
n You can define enterprise-specific Navigator views
The Navigator physical view shows the hierarchy of your managed enterprise by operating platform and type of Candle agent. The Navigator business view shows the hierarchy of any managed objects defined
20 OMEGAMON XE for CICSplex User’s Guide, Version 220
OMEGAMON XE for CICSplex Operating Environment
through the CMW. You can also define Navigator views for any logical grouping, such as a departmental or site hierarchy.
n You can define a graphic view
The graphic view enables you to retrieve and display real-time monitoring data from Candle agents. Using the graphic view, you can create a background image or import one, then place objects (Navigator items) on the image or have it done automatically using geographical coordinates. You can zoom in and you can add such graphics as floor plans and organization charts.
n OMEGAMON DE with Policy Management
If your product supports the use of the Workflow Editor, you can find information about its use in CandleNet Portal Help and Administering OMEGAMON Products: CandleNet Portal. The Workflow Editor permits you to create new policies or modify any predefined policies for your product or policies created using the Candle Management Workstation.
Historical data collectionYou can use the facilities of CandleNet Portal’s historical data collection function to store and save the data being collected by your OMEGAMON XE for OS/390 agent or agents. The historical data collection function permits you to specify
n the attribute group or groups for which data is to be collected
n the interval at which data is to be collected
n the interval at which data is to be warehoused (if you choose to do so)
n the location (either at the agent or at the CMS) at which the collected data is to be stored
Information about using the Historical Data Collection function can be found in the CandleNet Portal Help and in the Historical Data Collection Guide for OMEGAMON XE and CandleNet Command Center.
To ensure that data samplings are saved to populate your predefined historical workspaces, you must configure and start historical data collection. This requirement does not apply to workspaces using attribute groups that are historical in nature and show all their entires withour you having to start data
OMEGAMON XE for CICSplex Overview 21
OMEGAMON XE for CICSplex Operating Environment
collection. See the Historical Data Collection Guide for OMEGAMON XE and CandleNet Command Center for more information.
n You can integrate information provided by Candle’s Universal Agent
Candle’s Universal Agent is an agent you can configure to monitor any data you collect. It lets you integrate data from virtually any platform and any source, such as custom applications, databases, systems, and subsystems. Your defined dataproviders are listed in the Navigator, and default workspaces are automatically created.
22 OMEGAMON XE for CICSplex User’s Guide, Version 220
Introducing OMEGAMON XE for CICSplex
Introducing OMEGAMON XE for CICSplex
OverviewThis topic introduces you to the OMEGAMON XE for CICSplex product features. This product can help you address challenges in a changing technical environment and better manage performance for your CICS regions.
Using OMEGAMON XE for CICSplexOMEGAMON XE for CICSplex provides a comprehensive means for gathering the information you need to detect and prevent problems with your CICS regions.
OMEGAMON XE for CICSplex lets you easily collect and analyze CICS-specific information, that enables you to
n manage all CICS regions from a single point to identify problems at any time
n balance workloads across various regions
n track performance against goals
With OMEGAMON XE for CICSplex, systems administrators can set threshold levels and flags to alert them when the system reaches these thresholds.
How OMEGAMON XE for CICSplex assists youOMEGAMON XE for CICSplex helps you monitor and gather consistent, accurate, and timely information that you need to effectively perform your job. OMEGAMON XE for CICSplex provides several benefits.
Simplifies application and system management—by managing resources across your system.
Increases profits—by providing you with real-time access to reliable, up-to-the minute data that allows you to make faster, better informed, operating decisions.
Enhances system performance—by letting you integrate, monitor, and manage your system environment console and mission-critical applications.
OMEGAMON XE for CICSplex Overview 23
Introducing OMEGAMON XE for CICSplex
OMEGAMON XE for CICSplex alerts the Candle Management Workstation when conditions in your environment meet threshold-based conditions. These alerts notify your systems administrator to limit and control system traffic. You can view data that OMEGAMON XE for CICSplex gathers in reports which inform you of the status of your managed CICS regions.
Advanced monitoring facilitiesOMEGAMON XE for CICSplex includes advanced monitoring facilities.
n user-defined and product-provided situations based on thresholds to raise different types of alerts: critical, warning, and others
n at-a-glance status picture of all CICS regions
n the capability to monitor multiple CICS regions simultaneously from one or more centralized workstations
Planning and installationFor information on planning and installing OMEGAMON XE for CICSplex or CandleNet Portal, refer to the installation documentation that came with your product.
Information about the CMS and CMWFor information on using CMS and CMW, refer to these publications:n CandleNet Command Center Administrator’s Guiden CandleNet Command Center User’s Guiden CandleNet Command Center Quick Reference
24 OMEGAMON XE for CICSplex User’s Guide, Version 220
Features of OMEGAMON XE for CICSplex
Features of OMEGAMON XE for CICSplex
Overview This topic discusses the user interface and product features.
User interfaceOMEGAMON XE for CICSplex uses the standard Candle Management Workstation (CMW) interface on either a Windows NT, Windows 98, or Windows 2000 operating system. The CandleNet Portal interface requires either a Windows NT, Windows 98, or Windows 2000 operating system.
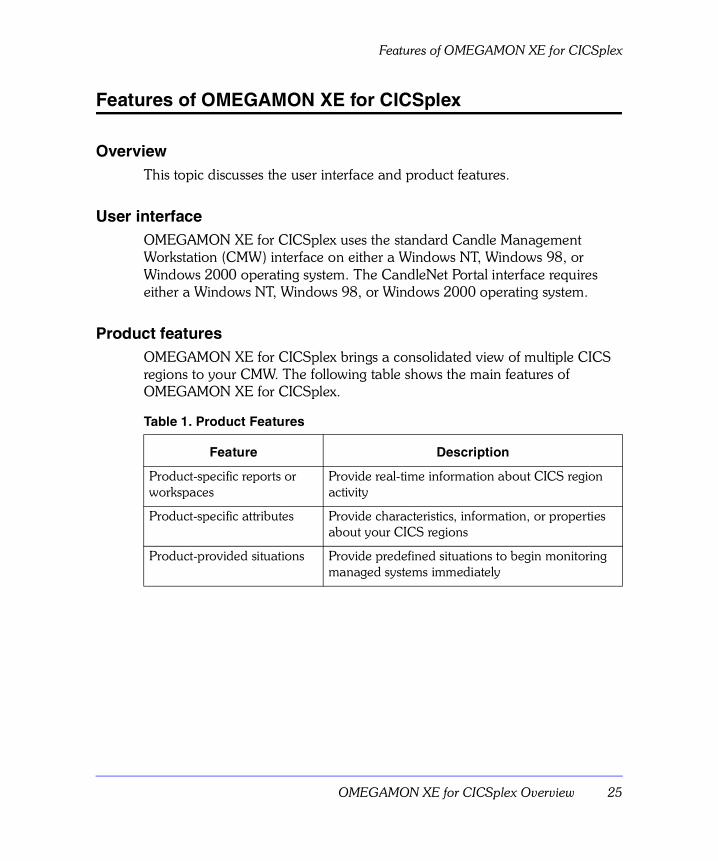
Product featuresOMEGAMON XE for CICSplex brings a consolidated view of multiple CICS regions to your CMW. The following table shows the main features of OMEGAMON XE for CICSplex.
Table 1. Product Features
Feature Description
Product-specific reports or workspaces
Provide real-time information about CICS region activity
Product-specific attributes Provide characteristics, information, or properties about your CICS regions
Product-provided situations Provide predefined situations to begin monitoring managed systems immediately
OMEGAMON XE for CICSplex Overview 25
Features of OMEGAMON XE for CICSplex
26 OMEGAMON XE for CICSplex User’s Guide, Version 220
Learning AboutOMEGAMON XE for CICSplex2
IntroductionThis chapter introduces you to the OMEGAMON XE for CICSplex attributes, reports, and product-provided situations.
Chapter Contents
What is a CICSplex? . . . . . . . . . . . . . . . . . . . . . . . . . . . . . . . . . . . . . . . . . . . . . . . 30
Overview . . . . . . . . . . . . . . . . . . . . . . . . . . . . . . . . . . . . . . . . . . . . . . . . . . . . 30CICSplex components . . . . . . . . . . . . . . . . . . . . . . . . . . . . . . . . . . . . . . . . . . 31How does OMEGAMON XE for CICSplex monitor CICS regions? . . . . . . . . . 31
ISC and MRO Communication Methods . . . . . . . . . . . . . . . . . . . . . . . . . . . . . . . . 32Overview . . . . . . . . . . . . . . . . . . . . . . . . . . . . . . . . . . . . . . . . . . . . . . . . . . . . 32ISC. . . . . . . . . . . . . . . . . . . . . . . . . . . . . . . . . . . . . . . . . . . . . . . . . . . . . . . . . 32MRO . . . . . . . . . . . . . . . . . . . . . . . . . . . . . . . . . . . . . . . . . . . . . . . . . . . . . . . 32How can OMEGAMON XE for CICSplex help monitor communications? . . . 33
Connections and Links Between CICS Regions. . . . . . . . . . . . . . . . . . . . . . . . . . . 34Overview . . . . . . . . . . . . . . . . . . . . . . . . . . . . . . . . . . . . . . . . . . . . . . . . . . . . 34Distributed processing concepts . . . . . . . . . . . . . . . . . . . . . . . . . . . . . . . . . . . 34How does OMEGAMON XE for CICSplex help monitor connections and links? . . . . . . . . . . . . . . . . . . . . . . . . . . . . . . . . . . . . . . . . . . 36
Understanding OMEGAMON XE for CICSplex Attributes . . . . . . . . . . . . . . . . . . . 37Overview . . . . . . . . . . . . . . . . . . . . . . . . . . . . . . . . . . . . . . . . . . . . . . . . . . . . 37Using OMEGAMON XE for CICSplex attributes . . . . . . . . . . . . . . . . . . . . . . . 37
Understanding OMEGAMON XE for CICSplex Reports . . . . . . . . . . . . . . . . . . . . 38Overview . . . . . . . . . . . . . . . . . . . . . . . . . . . . . . . . . . . . . . . . . . . . . . . . . . . . 38Using the OMEGAMON XE for CICSplex reports . . . . . . . . . . . . . . . . . . . . . . 38
Learning About OMEGAMON XE for CICSplex 27
Associating OMEGAMON XE for CICSplex reports with attributes . . . . . . . . . 38Using the Zoom feature in CMW . . . . . . . . . . . . . . . . . . . . . . . . . . . . . . . . . . 39For more information on reports. . . . . . . . . . . . . . . . . . . . . . . . . . . . . . . . . . . 39
Working with OMEGAMON XE for CICSplex Reports in CMW. . . . . . . . . . . . . . . 40Overview . . . . . . . . . . . . . . . . . . . . . . . . . . . . . . . . . . . . . . . . . . . . . . . . . . . . 40Accessing CICS reports in CMW. . . . . . . . . . . . . . . . . . . . . . . . . . . . . . . . . . . 40Refreshing OMEGAMON XE for CICSplex reports in CMW . . . . . . . . . . . . . . 41Sorting CICS reports in CMW. . . . . . . . . . . . . . . . . . . . . . . . . . . . . . . . . . . . . 42Filtering CICS reports in CMW . . . . . . . . . . . . . . . . . . . . . . . . . . . . . . . . . . . . 43
Working with Workspaces in CandleNet Portal . . . . . . . . . . . . . . . . . . . . . . . . . . . 44Overview . . . . . . . . . . . . . . . . . . . . . . . . . . . . . . . . . . . . . . . . . . . . . . . . . . . . 44Formats for CandleNet Portal information . . . . . . . . . . . . . . . . . . . . . . . . . . . 45Opening a workspace . . . . . . . . . . . . . . . . . . . . . . . . . . . . . . . . . . . . . . . . . . . 45Refreshing or reloading a workspace . . . . . . . . . . . . . . . . . . . . . . . . . . . . . . . 45Suspending or stopping a workspace . . . . . . . . . . . . . . . . . . . . . . . . . . . . . . . 46Editing a workspace . . . . . . . . . . . . . . . . . . . . . . . . . . . . . . . . . . . . . . . . . . . . 47Saving the workspace . . . . . . . . . . . . . . . . . . . . . . . . . . . . . . . . . . . . . . . . . . . 47Opening multiple workspaces . . . . . . . . . . . . . . . . . . . . . . . . . . . . . . . . . . . . . 48Saving a new workspace . . . . . . . . . . . . . . . . . . . . . . . . . . . . . . . . . . . . . . . . 48Linking workspaces . . . . . . . . . . . . . . . . . . . . . . . . . . . . . . . . . . . . . . . . . . . . 48Defining workspace properties . . . . . . . . . . . . . . . . . . . . . . . . . . . . . . . . . . . . 48Opening an Event workspace . . . . . . . . . . . . . . . . . . . . . . . . . . . . . . . . . . . . . 49
Understanding the OMEGAMON XE for CICSplex Situations . . . . . . . . . . . . . . . . 50Overview . . . . . . . . . . . . . . . . . . . . . . . . . . . . . . . . . . . . . . . . . . . . . . . . . . . . 50Using the product-provided OMEGAMON XE for CICSplex situations . . . . . . 50OMEGAMON XE for CICSplex product-provided situations. . . . . . . . . . . . . . 50
Using CandleNet Portal to Work with Situations . . . . . . . . . . . . . . . . . . . . . . . . . . 51Overview . . . . . . . . . . . . . . . . . . . . . . . . . . . . . . . . . . . . . . . . . . . . . . . . . . . . 51The Situation editor . . . . . . . . . . . . . . . . . . . . . . . . . . . . . . . . . . . . . . . . . . . . 51Create a Situation. . . . . . . . . . . . . . . . . . . . . . . . . . . . . . . . . . . . . . . . . . . . . . 52Display a Situation . . . . . . . . . . . . . . . . . . . . . . . . . . . . . . . . . . . . . . . . . . . . . 53Edit a Situation. . . . . . . . . . . . . . . . . . . . . . . . . . . . . . . . . . . . . . . . . . . . . . . . 53Reset a Situation . . . . . . . . . . . . . . . . . . . . . . . . . . . . . . . . . . . . . . . . . . . . . . 54Start, Stop, or Delete a Situation . . . . . . . . . . . . . . . . . . . . . . . . . . . . . . . . . . 55
Working with CICS Product-provided Situations in CMW . . . . . . . . . . . . . . . . . . . 56Overview . . . . . . . . . . . . . . . . . . . . . . . . . . . . . . . . . . . . . . . . . . . . . . . . . . . . 56
28 OMEGAMON XE for CICSplex User’s Guide, Version 220
Accessing OMEGAMON XE for CICSplex situations. . . . . . . . . . . . . . . . . . . . 56Activating product-provided situations for CICS at startup . . . . . . . . . . . . . . . 56Restarting situations assigned to managed objects . . . . . . . . . . . . . . . . . . . . . 57
Setting Up a CICSplex . . . . . . . . . . . . . . . . . . . . . . . . . . . . . . . . . . . . . . . . . . . . . 58Overview . . . . . . . . . . . . . . . . . . . . . . . . . . . . . . . . . . . . . . . . . . . . . . . . . . . . 58Setting up a CICSplex object . . . . . . . . . . . . . . . . . . . . . . . . . . . . . . . . . . . . . 59Setting up a CICSplex region object . . . . . . . . . . . . . . . . . . . . . . . . . . . . . . . . 60
Using Auto Node Generation . . . . . . . . . . . . . . . . . . . . . . . . . . . . . . . . . . . . . . . . 61Overview . . . . . . . . . . . . . . . . . . . . . . . . . . . . . . . . . . . . . . . . . . . . . . . . . . . . 61Manually executing auto node generation . . . . . . . . . . . . . . . . . . . . . . . . . . . 61Changing an auto-generated CICS region object to ROR or TOR. . . . . . . . . . 62Verifying a CICS region object . . . . . . . . . . . . . . . . . . . . . . . . . . . . . . . . . . . . 63Monitoring CICSplex performance . . . . . . . . . . . . . . . . . . . . . . . . . . . . . . . . . 64
Using the IBM System Manager Facility. . . . . . . . . . . . . . . . . . . . . . . . . . . . . . . . . 65Overview . . . . . . . . . . . . . . . . . . . . . . . . . . . . . . . . . . . . . . . . . . . . . . . . . . . . 65Procedure. . . . . . . . . . . . . . . . . . . . . . . . . . . . . . . . . . . . . . . . . . . . . . . . . . . . 65
Learning About OMEGAMON XE for CICSplex 29
What is a CICSplex?
What is a CICSplex?
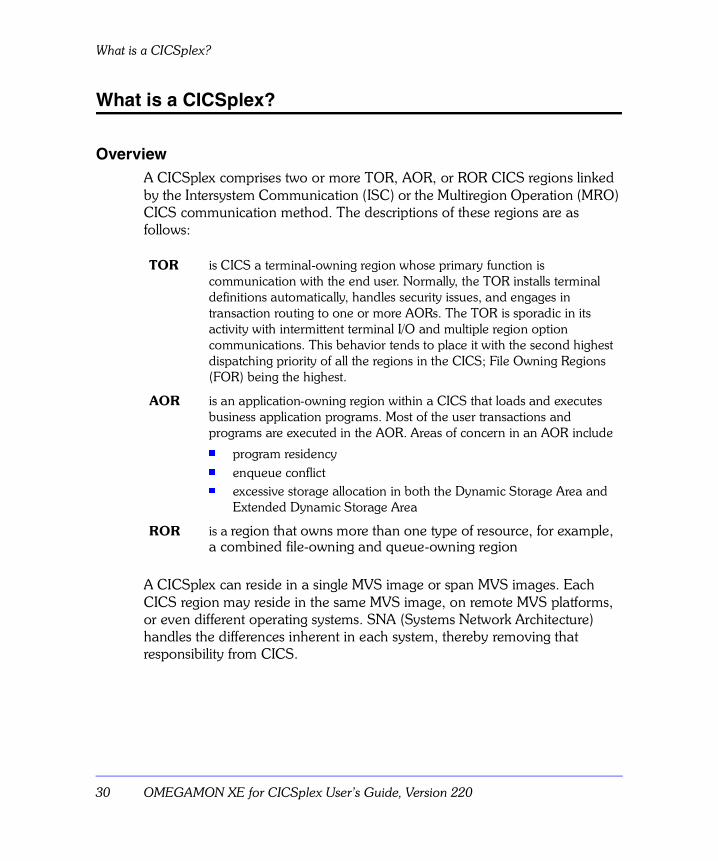
OverviewA CICSplex comprises two or more TOR, AOR, or ROR CICS regions linked by the Intersystem Communication (ISC) or the Multiregion Operation (MRO) CICS communication method. The descriptions of these regions are as follows:
A CICSplex can reside in a single MVS image or span MVS images. Each CICS region may reside in the same MVS image, on remote MVS platforms, or even different operating systems. SNA (Systems Network Architecture) handles the differences inherent in each system, thereby removing that responsibility from CICS.
TOR is CICS a terminal-owning region whose primary function is communication with the end user. Normally, the TOR installs terminal definitions automatically, handles security issues, and engages in transaction routing to one or more AORs. The TOR is sporadic in its activity with intermittent terminal I/O and multiple region option communications. This behavior tends to place it with the second highest dispatching priority of all the regions in the CICS; File Owning Regions (FOR) being the highest.
AOR is an application-owning region within a CICS that loads and executes business application programs. Most of the user transactions and programs are executed in the AOR. Areas of concern in an AOR includen program residency n enqueue conflict n excessive storage allocation in both the Dynamic Storage Area and
Extended Dynamic Storage Area
ROR is a region that owns more than one type of resource, for example, a combined file-owning and queue-owning region
30 OMEGAMON XE for CICSplex User’s Guide, Version 220
What is a CICSplex?
CICSplex componentsA typical CICSplex contains
n one or more TORs to intercept user logon sequences and to route job requests to the AOR
n several AORs to handle transaction processing
n several RORs to handle file processing
n an intercommunication method (ISC or MRO) to join the regions
In addition to supporting distributed processing, both ISC and MRO reduce the following problems associated with processing in one region:
n isolate unstable applications without affecting other regions
n alleviate storage restrictions
n separate production and test systems
n execute maintenance on a single region during production time
How does OMEGAMON XE for CICSplex monitor CICS regions?OMEGAMON XE for CICSplex monitors multiple inter-connected CICS regions as a single unit on an MVS platform. You can also monitor multiple CICSplexes on multiple MVS systems.
A CICS region does not have to be part of a ’plex’ to benefit. OMEGAMON XE for CICSplex can apply single region monitoring performance by using situations and workload management components, and in addition, view all regions from a single point.
OMEGAMON XE for CICSplex reports on the state of storage, files, databases, and queuing that affect the health of individual regions, and on the condition of the MRO connection. This allows you to identify problems in individual regions and in the connectivity between regions.
Learning About OMEGAMON XE for CICSplex 31
ISC and MRO Communication Methods
ISC and MRO Communication Methods
OverviewISC and MRO communication methods are very similar; they differ only in implementation. Both ISC and MRO support distributed processing, which is a method of dispensing work throughout your computer resources. ISC and MRO enables CICS regions to connect in any arrangement, even to other operating systems and non-CICS resources.
ISCIntercommunication system method that enables multiple CICS regions to participate in distributed processing regardless of the location of the individual regions. Even non-CICS systems can connect to CICS with ISC. It
n uses networking facilities
n provides communication between separate operating systems.
n provides communication between CICS regions residing within the same, or multiple, images of MVS
n provides communication between CICS and non-CICS resources residing within the same, or multiple, images of MVS
MROMultiregion operation ties two or more CICS regions together in the same instance of MVS to share workloads. The inter-region communication facility enables the communication between the CICS regions. It
n does not use networking facilities
n provides communication only between CICS regions within the same image of MVS
n provides communication between CICS regions within multiple images of MVS (at the sysplex level) when using the cross system coupling facility (XCF). This condition requires CICS Version 4.1 and MVS Version 5.1, or higher.
32 OMEGAMON XE for CICSplex User’s Guide, Version 220
ISC and MRO Communication Methods
How can OMEGAMON XE for CICSplex help monitor communications?
OMEGAMON XE for CICSplex reports on the
n state of workload processing (locating where work was routed during its lifecycle)
n location of failing transactions and identify them by user ID, terminal ID, transaction ID, or VTAM LU ID in any region
n condition of connections and links
Learning About OMEGAMON XE for CICSplex 33
Connections and Links Between CICS Regions
Connections and Links Between CICS Regions
OverviewA connection, whether ISC or MRO, contains many links. Links provide addressability to all computer resources (CICSs, databases, queues, and so forth) by assigning unique identifiers to them. Then, the task of connecting and locating these resources is the responsibility of the communication method.
Whether ISC or MRO, links provide the connectivity to support distributed processing. Distributed processing has four main functions:
n transaction routing
n function shipping
n asynchronous processing
n distributed transaction processing
Both MRO and ISC links must be defined to the CICS regions. An MRO link definition assumes a CICS to CICS connection in the same MVS image. An ISC definition permits connections between two CICS regions and between CICS and non-CICS resources.
Distributed processing conceptsThe following descriptions provide explanations of basic CICS communications concepts.
Transaction routing
This condition enables CICS to run a transaction defined to another CICS region. Transaction routing functions in the following manner: the originating CICS region makes a request to execute a transaction that resides in another region, and after the transaction completes, the response returns to the originating CICS region. The transaction must be defined as remote to the originating CICS regions to identify the region that owns the transaction. You do not have to know which region owns the transaction because CICS reads the Program Control Table (PCT) to find the region that owns the transaction.
34 OMEGAMON XE for CICSplex User’s Guide, Version 220
Connections and Links Between CICS Regions
Function shipping
Function shipping provides the ability to share resources among CICS regions, regardless of where the resource resides. Function shipping enables application programs running under CICS to access the following information from other CICS regions:
n transient data queues
n files
n temporary storage queues
n DL/I databases
Asynchronous processing
Asynchronous processing allows an application program to start one or more tasks in connected CICS regions without the benefit of CICS synchronization. The nature of asynchronous processing is that CICS does not see a relationship among the tasks. Consequently, if a task ends abnormally (an abend), there is no way to recover resources, such as files or storage that are accessed during that task’s execution. Function shipping and distributed transaction processing are contrasts to asynchronous processing.
Distributed transaction processing (DTP)
CICS uses this method of task synchronization to accomplish a logical unit of work (LUW). Distributed transaction processing (DTP) coordinates protected resources, such as data files, with multiple programs. DTP provides a means for two or more programs to communicate valuable resource usage information to each other.
VTAM
VTAM is a set of IBM programs that handle MVS telecommunication processing for terminals and printers. VTAM supports Systems Network Architecture (SNA) access method for direct application to application communication with the same host, and NCP to NCP connections between processors.
Learning About OMEGAMON XE for CICSplex 35

Connections and Links Between CICS Regions
How does OMEGAMON XE for CICSplex help monitor connections and links?
OMEGAMON XE for CICSplex reports on the type and status of your connections. It reports on connections experiencing capacity problems or on changes in status that could cease production. Also, OMEGAMON XE for CICSplex reports on the percentage of links in use.
36 OMEGAMON XE for CICSplex User’s Guide, Version 220
Understanding OMEGAMON XE for CICSplex Attributes
Understanding OMEGAMON XE for CICSplex Attributes
OverviewThis topic introduces you to the OMEGAMON XE for CICSplex attributes.
Using OMEGAMON XE for CICSplex attributesOMEGAMON XE for CICSplex gathers data from remote agents residing on managed systems within your CICS network and stores this data in system elements that we call attributes.
You can use the OMEGAMON XE for CICSplex attributes to build situations to monitor the performance of your CICS regions.
To use these attributes effectively, you must first understand the organization of an attribute.
n An attribute is made up of an attribute group and an attribute item.
n An attribute group refers to some unique characteristic of the data that we store in the attribute.
n An attribute item stores data for a particular property of an attribute group.
For example,
CICSplex_Region_Analysis.CPU_Utilization
In this example, the CPU_Utilization is an attribute item that stores the percentage of accumulated CPU time for a CICS address space.
Learning About OMEGAMON XE for CICSplex 37
Understanding OMEGAMON XE for CICSplex Reports
Understanding OMEGAMON XE for CICSplex Reports
OverviewThis topic introduces you to the OMEGAMON XE for CICSplex reports for CMW. The data provided by CMW reports are displayed in the CandleNet Portal workspaces as table views or chart views.
Note: For simplicity, we will refer collectively to the information provided by OMEGAMON XE for CICSplex as “reports.”
Using the OMEGAMON XE for CICSplex reportsOMEGAMON XE for CICSplex provides reports in which you can view attribute information about each CICS region you are monitoring.
You can use the OMEGAMON XE for CICSplex reports to
n investigate attribute information relating to a change in state
n monitor the performance of each CICS region, helping you to identify system bottlenecks and evaluate tuning decisions
n select the most effective threshold values for situations you create
Associating OMEGAMON XE for CICSplex reports with attributesA direct relationship exists between the CICS attributes and reports. An attribute group corresponds to a report and attribute items correspond to report columns.
For example,
CICS Connection Analysis Report
and
CICS_Connection_Analysis.CICS_Region_VTAM_Generic_Applid
The CICS Connection Analysis and CICS Connections Summary reports are generated by the attributes in the CICS_Connection_Analysis attribute group. The CICS_Region_VTAM_Generic_Applid attribute corresponds to the CICS Region VTAM Applid report column in the CICS Connections Analysis report.
38 OMEGAMON XE for CICSplex User’s Guide, Version 220
Understanding OMEGAMON XE for CICSplex Reports
Each report displays real-time information for many of the CICS attributes. The CICS reports are available to you, independent of whether you are using OMEGAMON XE for CICSplex to monitor situations.
Using the Zoom feature in CMWZoom enables you to switch your monitoring from a CICSplex to a single region. You can view data from either an OMEGAMON II for CICS session (V300 or higher), or IBM’s CICSplex/System Manager (CNP).
Note: This feature only applies to CMW. In CandleNet Portal, you can open a 3270 terminal session in a workspace to access a CICS session.
For more information on reportsSee “Working with OMEGAMON XE for CICSplex Reports in CMW” on page 40 for detailed information on accessing, refreshing, sorting, and filtering the CICS reports in CMW.
Learning About OMEGAMON XE for CICSplex 39
Working with OMEGAMON XE for CICSplex Reports in CMW
Working with OMEGAMON XE for CICSplex Reports in CMW
OverviewThis topic explains how to access, refresh, sort, and filter the OMEGAMON XE for CICSplex reports in CMW. The examples used in the following procedures give you an understanding of how to access, refresh, sort, and filter all the OMEGAMON XE for CICSplex reports. In these steps, the right-click action displays a pop-up menu of selections.
Note: This topic does not apply to the CandleNet Portal platform. See page 44 for CandleNet Portal information.
Accessing CICS reports in CMWUse the following procedure to access the CCC for Connections Analysis report.
1. From the CMW main window, right-click the Reports icon and select Open as Icons.The Reports window displays an icon for each OMEGAMON XE for CICSplex report group.
2. Right-click the CICS Connections Analysis icon and choose CICSplex Selection Report.The CICS Selection report displays a list of available CICS regions. You must select one.
3. Right-click the row of the selected CICS region and choose the CICS Connections Analysis Report.The CICS Connections Analysis report opens, showing the reported values from the CICS_Connection_Analysis attributes at the time the CICSplex agents collected the information.
4. Right-click a row for a transaction-owning region in the CICS Connections Analysis report. Select the CICS Connections Summary Report.The CICS Connections Summary report for that transaction-owning region (TOR) opens. This report displays a row for each region connected to the selected TOR, and provides additional data about the processing in those regions.
40 OMEGAMON XE for CICSplex User’s Guide, Version 220
Working with OMEGAMON XE for CICSplex Reports in CMW
Refreshing OMEGAMON XE for CICSplex reports in CMWUse the following procedure to refresh the OMEGAMON XE for CICSplex Connections Analysis report.
1. From the CMW main window, right-click the Reports icon and select Open as Icons.The Reports window displays an icon for each OMEGAMON XE for CICSplex report group.
2. Right-click the CICS Connections Analysis icon, choose CICSplex Selection Report, and then click the CICS Connections Analysis report.The CICS Connections Analysis Report opens.
3. Right-click a row in the CICS Connections Analysis report and then click the CICS Connections Summary Report.The CICS Connections Summary Report opens.
4. To refresh the values on the report select View > Refresh Now on the menu bar.The CICS Connections Summary report redisplays with the most current information available from the Candle Management Server (CMS).
Learning About OMEGAMON XE for CICSplex 41
Working with OMEGAMON XE for CICSplex Reports in CMW
Sorting CICS reports in CMWUse the following procedure to sort the CCC for Connections Analysis report.
1. From the CMW main window, right-click the Reports icon and choose CICSplex Connections Analysis.The Reports window displays an icon for each OMEGAMON XE for CICSplex report group.
2. Right-click the CICS Connections Analysis icon, choose CICSplex Selection Report, and then click the CICS Connections Analysis report.The CICS Connections Analysis Report opens.
3. Right-click a row in the CICS Connections Analysis report and then click the CICS Connections Summary Report.The CICS Connections Summary report opens.
4. To sort the report, access the Sort dialog for Settings.A. Select View > Settings View on the menu bar.B. Click the Sort tab.
5. Specify the Sort by criteria and the Sort Method.
6. To begin the sort, click OK.The CICS Connections Summary report redisplays showing the connections information based on the sort criteria you specified.
42 OMEGAMON XE for CICSplex User’s Guide, Version 220
Working with OMEGAMON XE for CICSplex Reports in CMW
Filtering CICS reports in CMWUse the following procedure to filter the CCC for Connections Analysis report.
1. From the CMW main window, right-click the Reports icon and click Open as Icons.The Reports window displays an icon for each OMEGAMON XE for CICSplex report group.
2. Right-click the CICS Connections Analysis icon, choose CICSplex Selection Report, and then click the CICS Connections Analysis report.The CICS Connections Analysis Report opens.
3. Right-click a row in the CICS Connections Analysis report and then click the CICS Connections Summary Report.The CICS Connections Summary report opens.
4. To filter the report, access the Include settings page.A. Select View > Setting View on the menu bar.B. Click the include tab.
The Include settings page displays.
5. Specify the Field to compare, Compare operator, and Value inclusion criteria for filtering.
6. To apply the filter to the report, click OK.The CICS Connections Summary report redisplays showing the connections information based on the filter criteria you specified.
Learning About OMEGAMON XE for CICSplex 43
Working with Workspaces in CandleNet Portal
Working with Workspaces in CandleNet Portal
OverviewThis topic provides a high-level overview of working with workspaces while using CandleNet Portal (CNP). The default workspaces contain table views and graphical information that corresponds to the report data in CMW. For the most current in-depth information, refer to the online Help provided with CandleNet Portal.
Note: This topic does not apply to the CMW platform. See page 40 for information for CMW.
The workspace is the working area in which CandleNet Portal presents information. As you select items, the workspace presents views pertinent to your selection. Each workspace has at least one view.
Every workspace has a set of properties associated with it. You can customize the workspace by working in the Properties editor to change the style and content of each view. The Properties editor also shows any links with other workspaces.
Be aware that the changes you make to the workspace are lost when you switch to another workspace unless you Save them first.
Another way to customize the workspace is to change the type of view or to add views to the workspace.
44 OMEGAMON XE for CICSplex User’s Guide, Version 220
Working with Workspaces in CandleNet Portal
Formats for CandleNet Portal informationCCC for CICS information can be presented to you in any of the views below:
n Table view
n Pie chart view
n Bar chart view
n Plot chart view
n Needle gauge view
n Thermometer gauge view
n Text area view
n Event console view, that shows the status of the situations associated with the system.
n Take Action view, that is used to send a command to the system.
n Terminal view, that enables you to start a 3270 or 5250 work session.
n Browser view, that permits you to open a browser to see HTML pages and Web sites.
Opening a workspaceEvery item in the Navigator has a default workspace associated with it. Some items have multiple workspaces you can open, although only one workspace can be open in the CandleNet Portal application window at one time. If you want to see more than one workspace at the same time:
1. Open a new window.
2. In the Navigator, click the item name or its icon.Result: The default workspace for that item displays, replacing the workspace of the previously selected item.
Refreshing or reloading a workspaceOnce a workspace is open, it is not refreshed automatically. Rather, CandleNet Portal refreshes the table and chart views in the workspace only when you manually request they be refreshed or when the workspace is reloaded. You can,
Learning About OMEGAMON XE for CICSplex 45
Working with Workspaces in CandleNet Portal
however, choose to automate the refresh at specified intervals. When choosing automatic refresh for a workspace, you should consider the impact of the refresh on system resources.
To define automatic refresh for a workspace:
1. Open the View menu, then select Refresh Every.
2. Click 5, 10, 15, 30, or 60 seconds, or On Demand.To manually reload the saved workspace and refresh the monitoring data, click Reload. Note that, if you made any changes to the workspace properties without saving them, the changes will be lost when a reload occurs.
Suspending or stopping a workspaceCandleNet Portal receives monitoring data from the agents at timed intervals and, if you have defined automatic refresh for the workspace, refreshes the table and chart views in the workspace. The refreshes use system resources. You can control when the views are refreshed by suspending the refresh. You can also stop loading the workspace if it is not what you want or you plan to change it.
To stop refreshing, click Suspend. You can then manually refresh the workspace, or you can click Resume to resume automatic refresh.
To stop loading a workspace, click Stop.
46 OMEGAMON XE for CICSplex User’s Guide, Version 220
Working with Workspaces in CandleNet Portal
Editing a workspaceYour CandleNet Portal product comes with a set of predefined workspaces for every item in the Navigator’s physical map. You can edit any of these workspaces to suit your environment.
The changes you can make to a workspace include the following:
n Split a view horizontally or vertically into two separate views.
n Change a view to a different type, such as from a pie chart to a thermometer gauge.
n Edit the properties of any view to change the data displayed and how the view is styled.
When you are finished editing a workspace you must save your changes, or save them as a new workspace, or they will be lost when you open another workspace or end your work session.
Any changes you make to a workspace are available to all other users on the network having the same ID.
Saving the workspaceWhatever changes you make to the workspace properties, such as adding or editing a view, are only temporary. They will be lost when you open another workspace or exit CandleNet Portal, unless you save the workspace. You can also save multiple workspaces for the same Navigator item.
Click Save Workspace to save the current workspace.
Note: The saved workspace is associated with your CandleNet Portal user ID. Users with a different ID will not see your changes. If you have edited the workspace but don’t want to save your workspace, you can reload the saved workspace as described on page 45.
Learning About OMEGAMON XE for CICSplex 47
Working with Workspaces in CandleNet Portal
Opening multiple workspacesEvery item in the physical Navigator has a default workspace associated with it: Click the item and the workspace opens. CandleNet Portal also enables you to have multiple workspaces for an item.
1. Open a workspace.
2. Click the Navigator item associated with the workspace.For example, if this is to be an alternative workspace to the Region Analysis workspace, you would click Users.
3. Open the View menu, then select Workspace.
4. Click a name in the list to open that workspace.Result: The workspace replaces the previous workspace view.
Saving a new workspace
1. Open the File menu and choose Save Workspace As.
2. Type a name for the new workspace in the text box and click OK.Result: The workspace is saved with the name you specify.
Linking workspacesSome of your product’s predefined workspaces may be linked to other related workspaces. While using a workspace’s table view, you can right-click a cell in the table to display existing links to other related workspaces. Linking workspaces is a method for going from one workspace to another related workspace quickly.
You can define your own links by following the directions in CandleNet Portal’s online Help. Once a link is defined, you can link to the subject workspace from another workspace, edit the link, or remove a link definition.
Defining workspace propertiesEvery workspace has properties for its views and links. You can right-click in an open view or any item in the Navigator to select and open the Properties editor.
48 OMEGAMON XE for CICSplex User’s Guide, Version 220
Working with Workspaces in CandleNet Portal
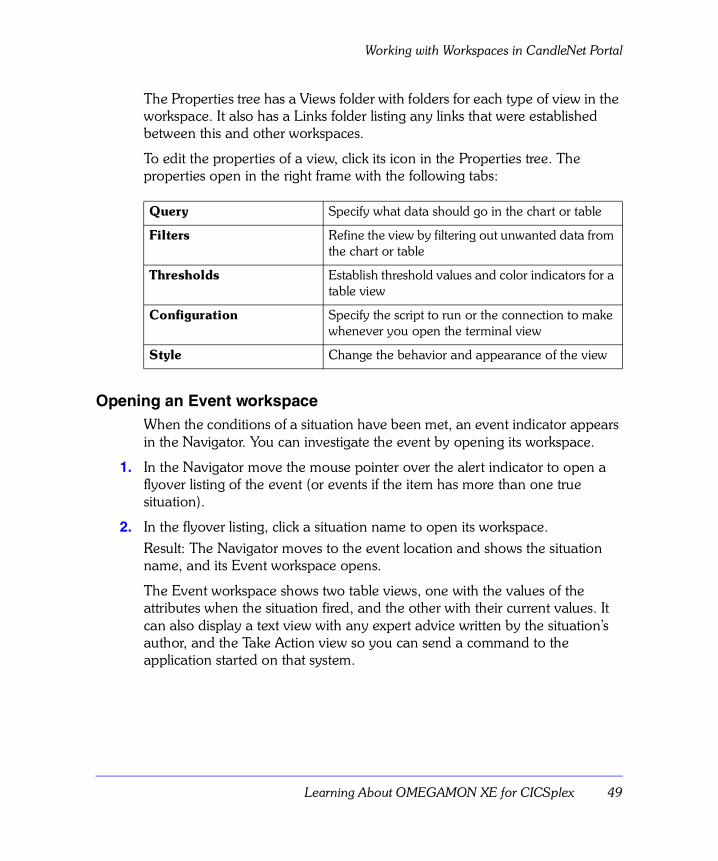
The Properties tree has a Views folder with folders for each type of view in the workspace. It also has a Links folder listing any links that were established between this and other workspaces.
To edit the properties of a view, click its icon in the Properties tree. The properties open in the right frame with the following tabs:
Opening an Event workspaceWhen the conditions of a situation have been met, an event indicator appears in the Navigator. You can investigate the event by opening its workspace.
1. In the Navigator move the mouse pointer over the alert indicator to open a flyover listing of the event (or events if the item has more than one true situation).
2. In the flyover listing, click a situation name to open its workspace.Result: The Navigator moves to the event location and shows the situation name, and its Event workspace opens.
The Event workspace shows two table views, one with the values of the attributes when the situation fired, and the other with their current values. It can also display a text view with any expert advice written by the situation’s author, and the Take Action view so you can send a command to the application started on that system.
Query Specify what data should go in the chart or table
Filters Refine the view by filtering out unwanted data from the chart or table
Thresholds Establish threshold values and color indicators for a table view
Configuration Specify the script to run or the connection to make whenever you open the terminal view
Style Change the behavior and appearance of the view
Learning About OMEGAMON XE for CICSplex 49
Understanding the OMEGAMON XE for CICSplex Situations
Understanding the OMEGAMON XE for CICSplex Situations
OverviewThis topic discusses the OMEGAMON XE for CICSplex product-provided situations for CMW. In CandleNet Portal, these are referred to as predefined situations.
Note: The product-provided situations in CMW provide the data for the CandleNet Portal predefined situations.
Using the product-provided OMEGAMON XE for CICSplex situationsYou can use the OMEGAMON XE for CICSplex situations that are provided in the product
n to begin monitoring your CICS regions immediately
n to serve as models for creating your own situations
n to embed them within your own situations
n to monitor and manage, through localized automation, widely dispersed resources
OMEGAMON XE for CICSplex product-provided situationsOMEGAMON XE for CICSplex provides 34 predefined situations in CMW and CandleNet Portal that you can immediately use to begin monitoring your CICS regions. You can also change the predicate functions, relational operators, and compare values to ones more appropriate for your enterprise. Most of the product-provided situations have an alert status of either Critical or Warning.
50 OMEGAMON XE for CICSplex User’s Guide, Version 220
Using CandleNet Portal to Work with Situations
Using CandleNet Portal to Work with Situations
OverviewThe Candle agent or agents that come with your CCC product have a set of predefined situations that you can use as-is or modify to meet your requirements. Candle suggests that if you choose to modify the predefined situations shipped with your product, you first make a copy for backup purposes.
This topic provides a high-level overview of working with situations while using CandleNet Portal. It does not apply to the CMW platform. For the most current in-depth information, refer to the online Help provided with CandleNet Portal.
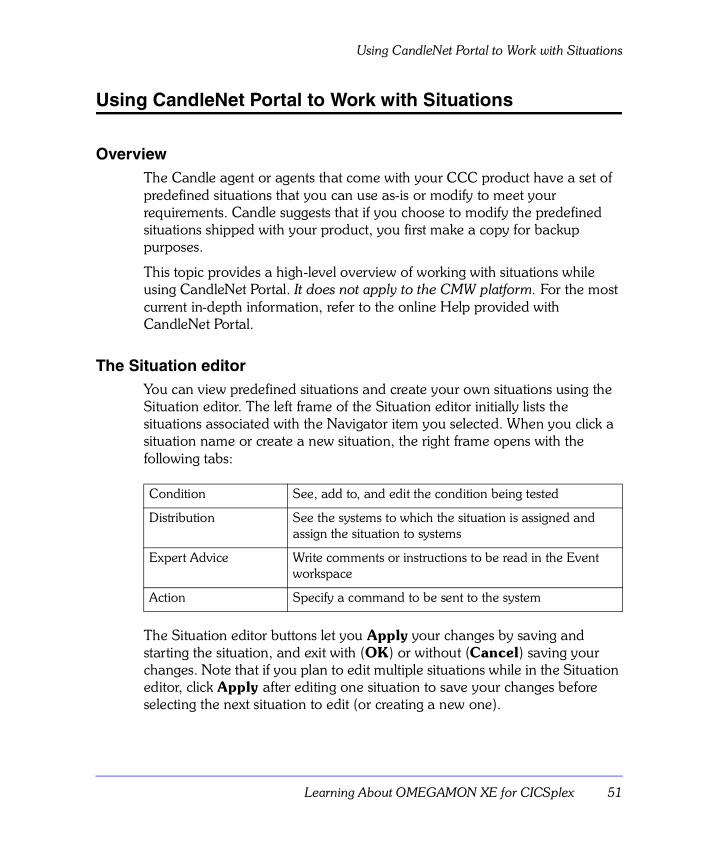
The Situation editorYou can view predefined situations and create your own situations using the Situation editor. The left frame of the Situation editor initially lists the situations associated with the Navigator item you selected. When you click a situation name or create a new situation, the right frame opens with the following tabs:
The Situation editor buttons let you Apply your changes by saving and starting the situation, and exit with (OK) or without (Cancel) saving your changes. Note that if you plan to edit multiple situations while in the Situation editor, click Apply after editing one situation to save your changes before selecting the next situation to edit (or creating a new one).
Condition See, add to, and edit the condition being tested
Distribution See the systems to which the situation is assigned and assign the situation to systems
Expert Advice Write comments or instructions to be read in the Event workspace
Action Specify a command to be sent to the system
Learning About OMEGAMON XE for CICSplex 51
Using CandleNet Portal to Work with Situations
Create a SituationYou can create and customize your own situations to monitor specific conditions in your enterprise.
1. Decide on which system you want the situation to run, then right-click either the name or icon of the system, agent, or attribute group in the Navigator.
2. Select Situations from the popup menu.The Situation editor opens.
3. Click New Situation.The Enter New Situation Name dialog opens.
4. Type a name for the situation and click OK.The Select Attribute dialog opens.
5. Click a name in the Group list to see its attributes in the Item list.
6. Click an attribute name in the Item list, then OK.The properties for the new situation display, with the attribute you just selected as the first column.
7. In the Condition tab, edit the condition, interval and status.
8. Click the Distribution tab to see and assign the systems to monitor.
9. Click the Expert Advice tab to enter text viewable from the Event workspace.
10. Click the Action tab to enter a command to be invoked when the situation fires.
11. When you are finished creating the situation, click Apply to save your changes and start the situation; or, click OK to save your changes, start the situation, and exit the Situation editor.The Situation editor checks the syntax of each expression you enter. If you enter an improper value for an attribute, such as "abc" for Disk Size, the cell turns red and the situation will not be saved until you correct the error.
52 OMEGAMON XE for CICSplex User’s Guide, Version 220
Using CandleNet Portal to Work with Situations
Notes:n When you save a situation, it is stored on the Candle Management Server
hub and is viewable at any other CandleNet Portal console whose server is connected to the same CMS hub. The CandleNet Portal server and consoles must be recycled (restarted) before the situation can be observed from other consoles.
n In the unlikely event that two users attempt to save a situation with the same name simultaneously, an error will occur, ensuring that one situation does not overwrite another.
Display a SituationTo examine the condition written for a situation, open it in the Situations editor. The editor has four tabs showing Condition, Distribution, Expert Advice, and Action for a given situation.
1. In the Navigator, right-click a system or any level below.You can right-click either the name or icon of a system, any of its Candle agents, or attribute groups. If you have already selected an event and opened its workspace, you can right-click the situation name.
2. Select Situations from the popup menu; or, if you right-clicked a situation name, click Edit Situation and skip step 3.The Situation editor opens. The Situation tree lists the situations for the object level chosen.
3. Click the situation to see its properties or, if you don’t see the situation in the tree, click Show to see more.
Note: If you still don’t see the situation you are looking for, click Cancel and locate the system to which the situation has been distributed. Then repeat these steps.
Edit a SituationTo fine tune a situation, use the Situation editor to edit it.
1. In the Navigator right-click a system, agent, or attribute group.
Learning About OMEGAMON XE for CICSplex 53
Using CandleNet Portal to Work with Situations
You can right-click either the icon or name of a system, any of its agents or attribute groups. If you have already selected an event and opened its workspace, you can right-click the situation name.
2. Click Situations from the popup menu; or, if you right-clicked a situation name, click Edit Situation and skip step 3.
3. Click Situations from the popup menu.The Situation editor opens. The Situation tree lists the situations for the level chosen.
4. Click a situation to see its properties, or, if you do not see the situation in the tree, click Situation Filter and select more options.
5. If you still do not see the situation you are looking for, click Cancel and locate the system to which the situation is distributed. Then repeat the previous steps.
6. On the Condition tab, edit the condition, interval, or status.
7. Click the Distribution tab to see and assign the systems to monitor.
8. Click the Expert Advice tab to enter text viewable from the Event workspace.
9. Click the Action tab to enter a command to be invoked when the situation fires.
10. When you are finished editing the situation, click Apply to save your changes and start the situation; or, click OK to save your changes, start the situation, and exit the Situation editor.The Situation editor edits the syntax of each expression you enter. If you enter an improper value for an attribute, such as "30000" for % User Time, the cell turns red and the situation will not be saved until you correct the error.
Reset a SituationWhen the conditions of a situation are met, the situation becomes true and an event indicator appears over the system name and all related items in the Navigator. You can clear the event by resetting the situation.
1. In the Navigator, move the mouse pointer over the event indicator to open a flyover listing of the situation (or situations).
2. In the flyover list, click a situation name.
54 OMEGAMON XE for CICSplex User’s Guide, Version 220
Using CandleNet Portal to Work with Situations
The Navigator moves to the event location and shows the situation name, and its Event workspace opens.
3. In the Navigator, right-click the situation name and click Reset.The situation restarts and the indicator disappears. If the condition is still true the next time the agent is tested, the indicator will reappear.
Note: When you reset a situation you can no longer acknowledge it.
Start, Stop, or Delete a SituationWhenever you create or edit a situation, it starts running as soon as you click OK to close the Situation editor. You can stop and restart a situation at any time.
1. In the Navigator, right-click a system, agent, or attribute group.You can right-click either the icon or name of a system, any of its agents, or attribute groups. If you have already selected an event and opened its workspace, you can right-click the situation name.
2. Click Situations from the popup menu; or, if you right-clicked a situation name, click Edit Situation and skip step 3.
3. Click Situations from the popup menu.The Situation editor opens. The Situation tree lists the situations for the level chosen.
4. Right-click the situation, then select one of the following:n Start to start the situation. This has no effect if the situation is already
started.
n Stop to stop the situation running.
n Delete to permanently remove the situation.
Notes:
n If you don’t see the situation in the tree, click Show to see more. If you still do not see the situation you are looking for, click Cancel and locate the system where the situation is distributed. Then repeat these steps.
n You can delete only those situations created with your user name.
Learning About OMEGAMON XE for CICSplex 55
Working with CICS Product-provided Situations in CMW
Working with CICS Product-provided Situations in CMW
OverviewThis topic explains how to access, activate, and set up monitoring for CICS product-provided situations and how to use the CICS local automation situations. It does not apply to the CandleNet Portal platform.
Accessing OMEGAMON XE for CICSplex situationsUse the following procedure to access the CCC for CICS product-provided situations.
1. From the CMW main window, double-click the Administration icon.
2. Right-click the Situations icon and choose Open as Details.The Situations window opens showing the name and description of each product-provided situation.
3. To view a situation in the graphic view, right-click a situation name and choose Open as Graphic.
4. To view a situation formula, right-click a situation name and choose Show Formula.
Activating product-provided situations for CICS at startupUse the following procedure to have the OMEGAMON XE for CICSplex situations start automatically each time you start the CMW.
1. From the CMW main window, double-click the Administration icon.
2. Right-click the Situations icon and then choose Open as Details.
3. Right-click a situation and then choose Open as Settings. The Settings page for the situation displays.
4. Click the Properties tab, check Activate at Startup, and then click OK.
5. At the Notification window, click OK.
6. To confirm the activation, click OK. (To start a situation that is not running, right-click the situation and then Restart.)
56 OMEGAMON XE for CICSplex User’s Guide, Version 220
Working with CICS Product-provided Situations in CMW
Restarting situations assigned to managed objectsOMEGAMON XE for CICSplex automatically creates managed objects for all CICS regions. However, you can manually create managed objects for new regions. Manually created objects require that you restart situations. To learn how to manually create managed objects, see “Using Auto Node Generation” on page 61.
To restart situations, use these steps:
1. Select the States page of the Settings notebook for the CICS region object.
2. Select Critical in the States field.
3. Return to the Candle Management Workstation main container and double-click the Administration object.
4. Right-click on the Situations object and select Open as Details.
5. Arrange the two windows, the Settings notebook page and the Situations - Details view, on your desktop so that each is visible.
6. Click on Critical in the Settings page and note the names of the situations that appear in the Assigned field.
7. Click on Warning in the Settings page and note the names of the situations that appear in the Assigned field.
8. Right-click each situation within the Situations - Details window that corresponds to the Critical and Warning states, and select Restart.
9. Close both the Settings notebook page and the Situations - Details view.
Learning About OMEGAMON XE for CICSplex 57
Setting Up a CICSplex
Setting Up a CICSplex
OverviewSetting up a CICSplex enables you to monitor your CICS regions. It does not apply to the CandleNet Portal platform. These are the basic steps you will use to set up a CICSplex,
1. Set up a CICSplex object.
2. Set up a CICS region object for each region in the CICSplex. You perform these actions by
1. Dragging the appropriate objects from the Templates container in the Administration container to the Enterprise - Icons window in the Enterprise container
2. Assigning a name and description to the objects 3. Modifying the default values in the Settings notebook as necessary to
apply to the new objects The next sections cover these topics in detail.
58 OMEGAMON XE for CICSplex User’s Guide, Version 220
Setting Up a CICSplex
Setting up a CICSplex objectTo set up a CICSplex object, follow these steps:
1. Double-click the Administration container in the Candle Management Workstation main window. The Administration window appears.
2. Double-click the Templates icon. The Templates window appears.
3. On the Candle Management Workstation main window, double-click the Enterprise icon. The Enterprise window appears.
4. On the Templates window, place the cursor on the CICSPLEX icon, hold down the right mouse button and drag the object to the Enterprise window:
5. Release the right mouse button. The CICSPLEX Object - Create New window appears.
6. Specify an Object Name and a Description.
7. Click Create. The Managed Systems page of the CICSPLEX - Settings notebook appears.
Note: A CICSplex object reflects the status of the region managed objects contained within. Consequently, managed systems are not assigned to CICSplex objects.
8. Click OK. The Enterprise window appears. It contains the new CICSplex object.
Learning About OMEGAMON XE for CICSplex 59
Setting Up a CICSplex
Setting up a CICSplex region objectTo set up a CICSplex region object, use these steps:
1. On the Enterprise window, right-click the desired CICSplex object, and select Open as Icons from the pop-up menu. The Icons window for the selected CICSplex appears.
Note: Although Open as Icons lets you set up a CICS region object, you can also do it from any pop-up menu selection except for Open as Help and Open as Settings.
2. On the Templates window (which you access from the Administration container), place the cursor on the CICSTOR, CICSAOR, or CICSROR icon, depending on the type of CICS region you are setting up.
3. Hold down the right mouse button and drag the object to the Icons window for the selected CICSplex.
4. Release the right mouse button. The Create New window for the selected object appears.
5. Specify an Object Name and a Description.
6. Click Create. The Managed Systems page of the Settings notebook for the CICS region appears.
7. Select from the Managed Systems field the CICS region node that the CICS region object represents.
Note: The Managed System Lists field contains the names of CICSplexes. It is important that you do not select an entry from this field.
8. Click Add.
9. Click OK. The Icons window for the selected CICSplex appears. It contains the new CICS region object.
Note: OMEGAMON XE for CICSplex uses the Auto Node Generation feature of the Candle Management Workstation to build managed objects for all CICS regions. See “Using Auto Node Generation” on page 61 if you need to add managed objects for CICS regions coming online after starting the product.
You have now set up one CICS region object for the selected CICSplex. Repeat this procedure for every region you want to monitor.
60 OMEGAMON XE for CICSplex User’s Guide, Version 220
Using Auto Node Generation
Using Auto Node Generation
OverviewAuto node generation creates a managed object in the default CICSplex for each online CICS region registered to the Candle Management Server.
The presence of an online CICS region means
n You can run Situations against regions.
n You can zoom to a defined OMEGAMON II for CICS session for a region.
Auto node generation starts automatically when the first user signs onto the Candle Management Server or when you execute Generate in the Managed Systems folder.
You execute Generate from the Managed Systems container when a region comes online that previously did not have a managed object assigned to it. OMEGAMON XE for CICSplex then creates a managed object for that region.
Manually executing auto node generationTo manually execute auto node generation from the Managed Systems container, use these steps:
1. Double-click the Managed Systems icon in the Candle Management Workstation main container.
2. Select Generate from the Managed Systems pull-down menu. OMEGAMON XE for CICSplex makes every new managed object an AOR.
Learning About OMEGAMON XE for CICSplex 61
Using Auto Node Generation
Changing an auto-generated CICS region object to ROR or TORThe Auto Node Generate function in the Managed Systems container creates objects for all regions that came online since last executing the generate command. OMEGAMON XE for CICSplex places all CICS region objects in the default CICSplex object and designates them as AORs.
To change the CICS region object to represent an ROR or TOR, use these steps:
1. If not already done, execute Generate in the Managed Systems container. See “Using Auto Node Generation” on page 61 to learn how.
2. Within the Administration container, double-click the Templates icon. The Templates window appears.
3. Select the template of the region type, CICSROR or CICSTOR, that you want your CICS region object to be. For this tutorial, right-click the CICSROR template and select Open as Settings.
4. Select the Objects tab.
5. Open the pull-down menu in Templates field and select CICSAOR. This updates the Available field with all the regions defined as AOR types, including the new managed systems that appear as a result of the generate function.
6. Select a region name in the Available field and click the Import button. You may select multiple region names. This imports the region name into the Assigned field.
7. Click OK.
8. When prompted to save settings, click Yes.
62 OMEGAMON XE for CICSplex User’s Guide, Version 220
Using Auto Node Generation
Verifying a CICS region objectTo verify that the CICS Region object represents an ROR or TOR,
1. Right-click the Enterprise icon in the Candle Management Workstation main container and select Open as Icons.
2. Right-click the default CICSPLEX icon and select Open as Icons.
3. Right-click the CICS region icon that you changed to an ROR or TOR and select Open as Settings. Select the Properties tab. The template region type appears in the Parent Template field.
4. Click OK.
Learning About OMEGAMON XE for CICSplex 63
Using Auto Node Generation
Monitoring CICSplex performanceThe CICSplex objects and CICS region objects represent Candle Management Workstation managed objects. The color, shape, and symbol associated with each object changes as the status of the object changes.
The status of a CICSplex or CICS region object is represented as follows:
n A blue circle with a question mark means that the object is not monitored or that information on its current status is not available.
n A yellow circle with an exclamation point means a Warning condition.
n A red triangle with an exclamation point means a Critical condition.
Monitored objects that are in a normal state, that is, objects that do not have an unavailable, warning, or critical condition, do not have a status alert (color, shape, or symbol combination).
If you right click on a CICSplex or CICS region object, a pop-up menu appears. For a CICS region object, the menu has the following options:
n Open as Help
n Open as Settings
n Open as Events
n Open as Historical
n Create Another...
n Delete
n Zoom to OMEGAMON
n CICS Topology
64 OMEGAMON XE for CICSplex User’s Guide, Version 220
Using the IBM System Manager Facility
Using the IBM System Manager Facility
OverviewCP/SM is an IBM program product that provides a general-purpose interface to CICS system management functions. If your installation has CP/SM installed, you can access it through OMEGAMON XE for CICSplex in the CMW interface.
ProcedureTo access CP/SM through the CMW, use these steps:
1. Double-click the Administration icon. The Administration container appears.
2. Double-click the Pass through to CP/SM icon. The Logon to CP/SM panel opens.
3. Specify the TSO Logon Applid, Parameters, TSO Userid, and Password to identify the CP/SM system you want to access.
4. Click Zoom. OMEGAMON XE for CICSplex zooms to the TSO session, passing the parameters required to start CP/SM. The CP/SM panel appears.
TSO LOGON APPLID
This is the VTAM applid of the TSO system under which CP/SM runs. Once entered, OMEGAMON XE for CICSplex retains the applid to subsequent calls to CP/SM zooming.
Parameters The TSO or ISPF command required to start CP/SM. Once entered, OMEGAMON XE for CICSplex retains the command to subsequent calls to CP/SM zooming.
TSO Userid This is the userid that you want to log onto TSO. Once entered, OMEGAMON XE for CICSplex retains the userid to subsequent calls to CP/SM zooming.
Password This is the password associated with the TSO userid. You must reenter the password each time you zoom to CP/SM.
Learning About OMEGAMON XE for CICSplex 65
Using the IBM System Manager Facility
66 OMEGAMON XE for CICSplex User’s Guide, Version 220

Introducing theOMEGAMON XE for CICSplex
Report Groups3
IntroductionThis chapter introduces you to the OMEGAMON XE for CICSplex report groups for Candle Management Workstation (CMW) and provides information for navigating in a report group.
Note: In CandleNet Portal, individual workspaces provide table views, which are the equivalent of the CMW reports.
Chapter Contents
OMEGAMON XE for CICSplex Report Groups. . . . . . . . . . . . . . . . . . . . . . . . . . . 68
Overview . . . . . . . . . . . . . . . . . . . . . . . . . . . . . . . . . . . . . . . . . . . . . . . . . . . . 68Report groups and descriptions for CMW . . . . . . . . . . . . . . . . . . . . . . . . . . . . 68Reports associated with CMW report groups . . . . . . . . . . . . . . . . . . . . . . . . . 70Workspaces and descriptions for CandleNet Portal . . . . . . . . . . . . . . . . . . . . . 71For more information on report groups and reports . . . . . . . . . . . . . . . . . . . . 73
Navigating in a Report Group . . . . . . . . . . . . . . . . . . . . . . . . . . . . . . . . . . . . . . . . 74Overview . . . . . . . . . . . . . . . . . . . . . . . . . . . . . . . . . . . . . . . . . . . . . . . . . . . . 74Procedure for navigating in a report group . . . . . . . . . . . . . . . . . . . . . . . . . . . 74Example of how to navigate in a report group . . . . . . . . . . . . . . . . . . . . . . . . 74
Introducing the OMEGAMON XE for CICSplex Report Groups 67
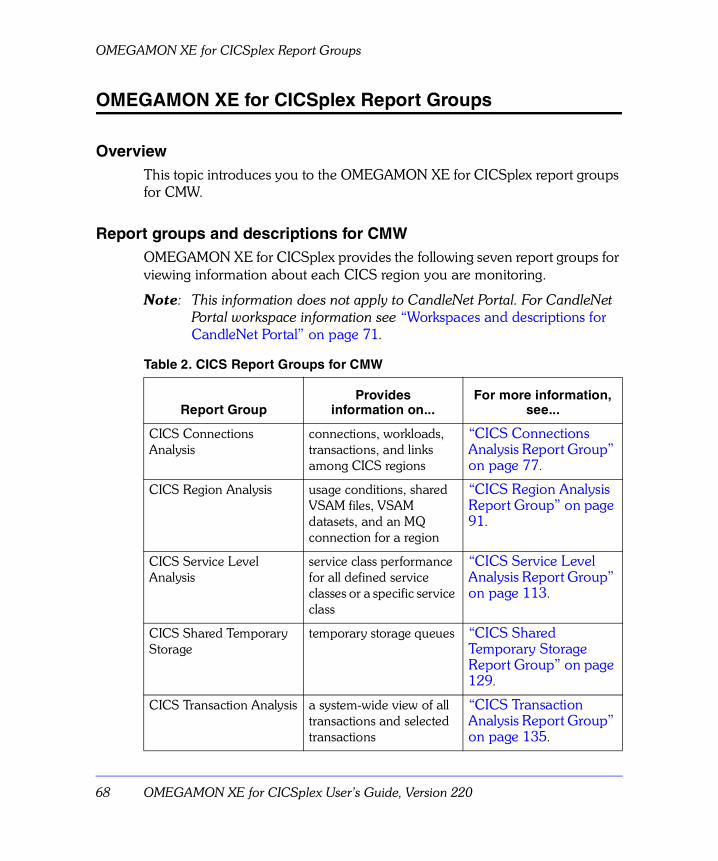
OMEGAMON XE for CICSplex Report Groups
OMEGAMON XE for CICSplex Report Groups
OverviewThis topic introduces you to the OMEGAMON XE for CICSplex report groups for CMW.
Report groups and descriptions for CMWOMEGAMON XE for CICSplex provides the following seven report groups for viewing information about each CICS region you are monitoring.
Note: This information does not apply to CandleNet Portal. For CandleNet Portal workspace information see “Workspaces and descriptions for CandleNet Portal” on page 71.
Table 2. CICS Report Groups for CMW
Report GroupProvides
information on...For more information,
see...
CICS Connections Analysis
connections, workloads, transactions, and links among CICS regions
“CICS Connections Analysis Report Group” on page 77.
CICS Region Analysis usage conditions, shared VSAM files, VSAM datasets, and an MQ connection for a region
“CICS Region Analysis Report Group” on page 91.
CICS Service Level Analysis
service class performance for all defined service classes or a specific service class
“CICS Service Level Analysis Report Group” on page 113.
CICS Shared Temporary Storage
temporary storage queues “CICS Shared Temporary Storage Report Group” on page 129.
CICS Transaction Analysis a system-wide view of all transactions and selected transactions
“CICS Transaction Analysis Report Group” on page 135.
68 OMEGAMON XE for CICSplex User’s Guide, Version 220
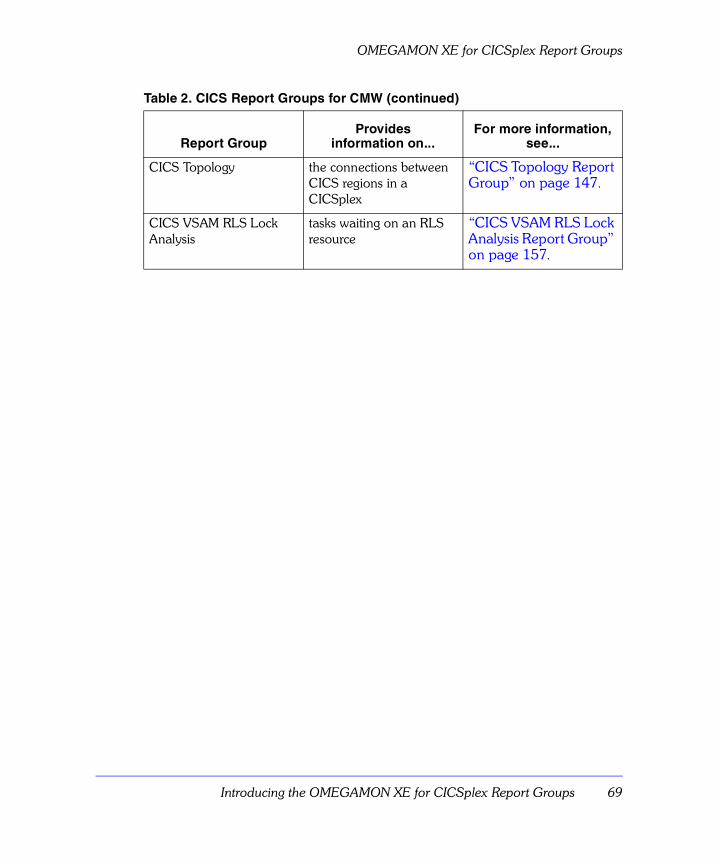
OMEGAMON XE for CICSplex Report Groups
CICS Topology the connections between CICS regions in a CICSplex
“CICS Topology Report Group” on page 147.
CICS VSAM RLS Lock Analysis
tasks waiting on an RLS resource
“CICS VSAM RLS Lock Analysis Report Group” on page 157.
Table 2. CICS Report Groups for CMW (continued)
Report GroupProvides
information on...For more information,
see...
Introducing the OMEGAMON XE for CICSplex Report Groups 69
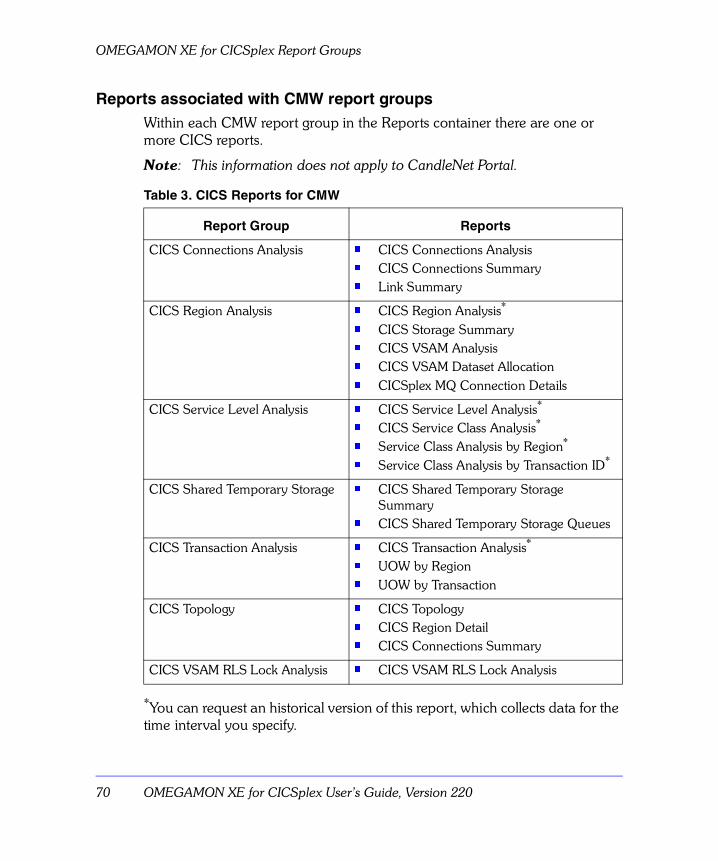
OMEGAMON XE for CICSplex Report Groups
Reports associated with CMW report groups Within each CMW report group in the Reports container there are one or more CICS reports.
Note: This information does not apply to CandleNet Portal.
*You can request an historical version of this report, which collects data for the time interval you specify.
Table 3. CICS Reports for CMW
Report Group Reports
CICS Connections Analysis n CICS Connections Analysisn CICS Connections Summaryn Link Summary
CICS Region Analysis n CICS Region Analysis*
n CICS Storage Summaryn CICS VSAM Analysisn CICS VSAM Dataset Allocation n CICSplex MQ Connection Details
CICS Service Level Analysis n CICS Service Level Analysis*
n CICS Service Class Analysis*
n Service Class Analysis by Region*
n Service Class Analysis by Transaction ID*
CICS Shared Temporary Storage n CICS Shared Temporary Storage Summary
n CICS Shared Temporary Storage Queues
CICS Transaction Analysis n CICS Transaction Analysis*
n UOW by Regionn UOW by Transaction
CICS Topology n CICS Topologyn CICS Region Detailn CICS Connections Summary
CICS VSAM RLS Lock Analysis n CICS VSAM RLS Lock Analysis
70 OMEGAMON XE for CICSplex User’s Guide, Version 220
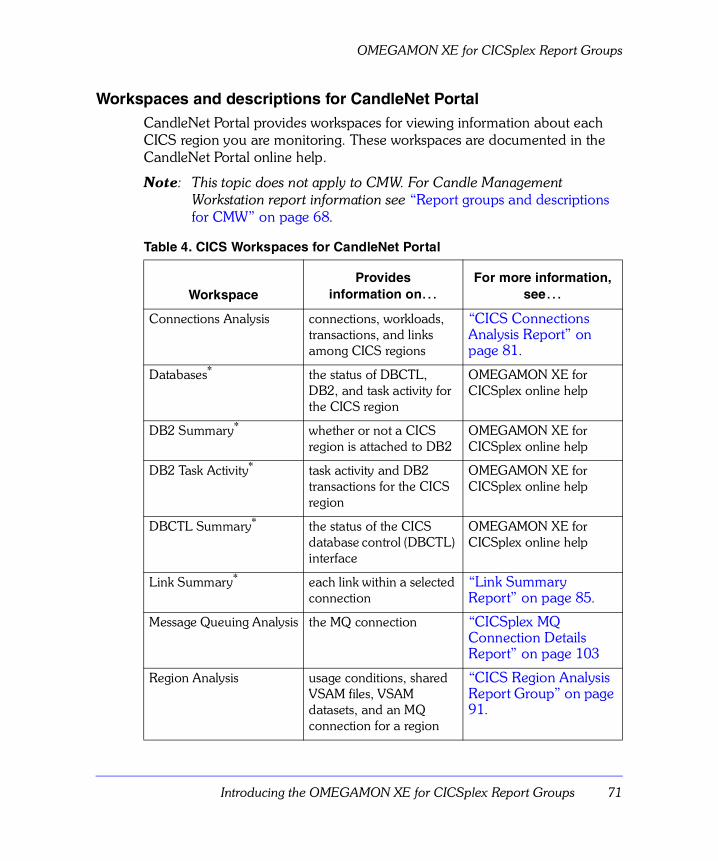
OMEGAMON XE for CICSplex Report Groups
Workspaces and descriptions for CandleNet PortalCandleNet Portal provides workspaces for viewing information about each CICS region you are monitoring. These workspaces are documented in the CandleNet Portal online help.
Note: This topic does not apply to CMW. For Candle Management Workstation report information see “Report groups and descriptions for CMW” on page 68.
Table 4. CICS Workspaces for CandleNet Portal
WorkspaceProvides
information on…For more information,
see…
Connections Analysis connections, workloads, transactions, and links among CICS regions
“CICS Connections Analysis Report” on page 81.
Databases* the status of DBCTL, DB2, and task activity for the CICS region
OMEGAMON XE for CICSplex online help
DB2 Summary* whether or not a CICS region is attached to DB2
OMEGAMON XE for CICSplex online help
DB2 Task Activity* task activity and DB2 transactions for the CICS region
OMEGAMON XE for CICSplex online help
DBCTL Summary* the status of the CICS database control (DBCTL) interface
OMEGAMON XE for CICSplex online help
Link Summary* each link within a selected connection
“Link Summary Report” on page 85.
Message Queuing Analysis the MQ connection “CICSplex MQ Connection Details Report” on page 103
Region Analysis usage conditions, shared VSAM files, VSAM datasets, and an MQ connection for a region
“CICS Region Analysis Report Group” on page 91.
Introducing the OMEGAMON XE for CICSplex Report Groups 71
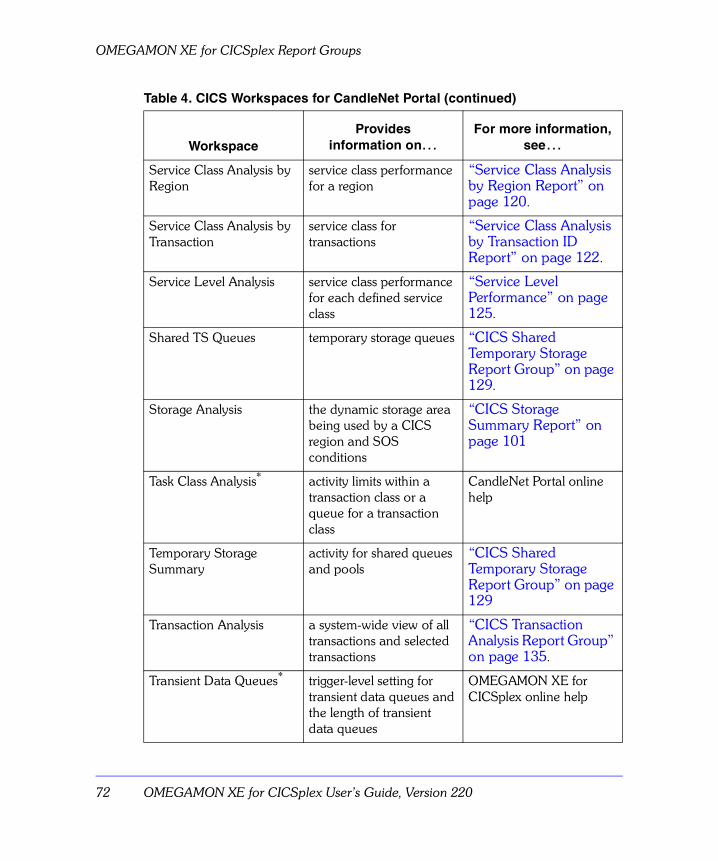
OMEGAMON XE for CICSplex Report Groups
Service Class Analysis by Region
service class performance for a region
“Service Class Analysis by Region Report” on page 120.
Service Class Analysis by Transaction
service class for transactions
“Service Class Analysis by Transaction ID Report” on page 122.
Service Level Analysis service class performance for each defined service class
“Service Level Performance” on page 125.
Shared TS Queues temporary storage queues “CICS Shared Temporary Storage Report Group” on page 129.
Storage Analysis the dynamic storage area being used by a CICS region and SOS conditions
“CICS Storage Summary Report” on page 101
Task Class Analysis* activity limits within a transaction class or a queue for a transaction class
CandleNet Portal online help
Temporary Storage Summary
activity for shared queues and pools
“CICS Shared Temporary Storage Report Group” on page 129
Transaction Analysis a system-wide view of all transactions and selected transactions
“CICS Transaction Analysis Report Group” on page 135.
Transient Data Queues* trigger-level setting for transient data queues and the length of transient data queues
OMEGAMON XE for CICSplex online help
Table 4. CICS Workspaces for CandleNet Portal (continued)
WorkspaceProvides
information on…For more information,
see…
72 OMEGAMON XE for CICSplex User’s Guide, Version 220
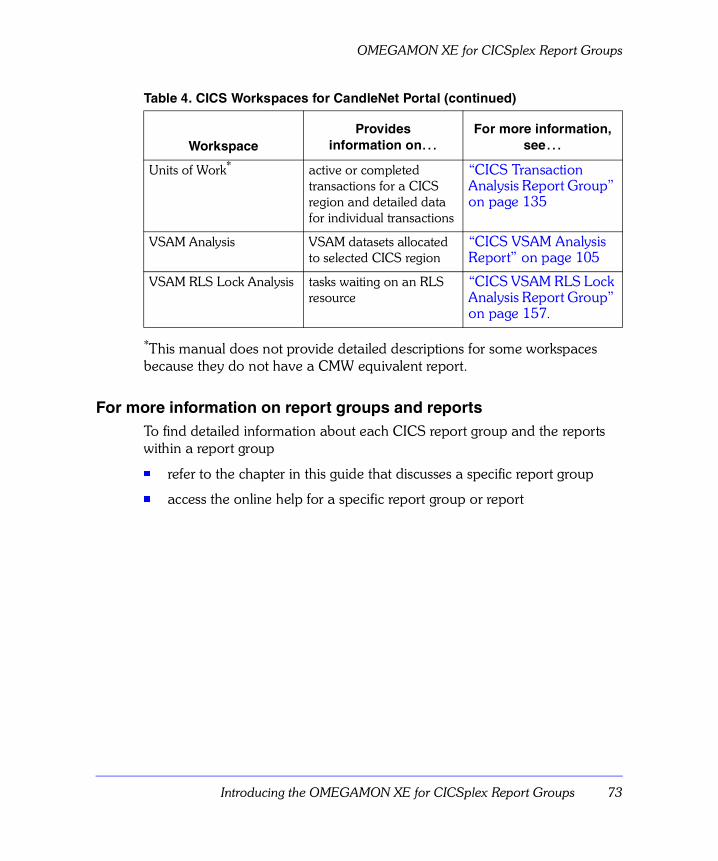
OMEGAMON XE for CICSplex Report Groups
*This manual does not provide detailed descriptions for some workspaces because they do not have a CMW equivalent report.
For more information on report groups and reportsTo find detailed information about each CICS report group and the reports within a report group
n refer to the chapter in this guide that discusses a specific report group
n access the online help for a specific report group or report
Units of Work* active or completed transactions for a CICS region and detailed data for individual transactions
“CICS Transaction Analysis Report Group” on page 135
VSAM Analysis VSAM datasets allocated to selected CICS region
“CICS VSAM Analysis Report” on page 105
VSAM RLS Lock Analysis tasks waiting on an RLS resource
“CICS VSAM RLS Lock Analysis Report Group” on page 157.
Table 4. CICS Workspaces for CandleNet Portal (continued)
WorkspaceProvides
information on…For more information,
see…
Introducing the OMEGAMON XE for CICSplex Report Groups 73
Navigating in a Report Group
Navigating in a Report Group
OverviewThis topic explains how you can navigate in a report group in CMW and provides an example.
Procedure for navigating in a report group
1. From the CMW main window, double-click the reports.Result: The reports window shows an icon for each OMEGAMON XE for CICSplex report.
2. Do one of the following:n Double-click the icon for the report group you want.
n Right-click the icon for the report group you want and then choose the menu item for the report from the pop-up menu.
Result: The report opens showing a list of available CICS regions.
3. In the first column of the report, do one of the following:n Double-click the name of the region you want.
n Right-click the name you want and then choose the first menu item for the report from the pop-up menu. (The first report listed is the CICS Region Analysis Report.)
Result: The program displays the next report in the report group.
4. Repeat step 3 until you have displayed all the reports in the group.
Example of how to navigate in a report groupThis example shows how to navigate through the three reports in the CICS Connections Analysis report group.
n CICS Connections Analysis Report
n CICS Connections Summary Report
n Link Summary Report
74 OMEGAMON XE for CICSplex User’s Guide, Version 220
Navigating in a Report Group
Follow this procedure to navigate in the CICSplex Connections Analysis report group.
1. From the CMW main window, double-click the Reports icon.Result: The Reports window shows an icon for each OMEGAMON XE for CICSplex report group.
2. Perform one of the following actions:n Double-click the CICS Connections Analysis icon.
n Right-click the CICS Connections Analysis icon and then choose CICS Connections Analysis from the pop-up menu.
Result: The CICS Selection window opens showing a list of available CICS regions.
3. In the first column in the report, do one of the following:n Double-click the name of the region you want.
n Right-click the name region you want and choose CICS Connections Analysis Report from the pop-up menu.
Result: The program displays the CICS Connections Analysis report.
4. In the first column in the report, do one of the following:n Double-click the CICS you want.
n Right-click the name of the CICS you want and then choose CICS Connections Summary Report from the pop-up menu.
Result: The program displays the CICS Connections Summary report.
5. In the first column in the report, do one of the following:n Double-click the CICS you want.
n Right-click the name of the CICS you want and then choose Link Summary Report from the pop-up menu.
Result: The program displays the Link Summary report showing the links.
Introducing the OMEGAMON XE for CICSplex Report Groups 75
Navigating in a Report Group
76 OMEGAMON XE for CICSplex User’s Guide, Version 220

CICS Connections AnalysisReport Group4
IntroductionThis chapter provides detailed information about the reports in the CICS Connections Analysis report group in CMW. This report group provides information about connections and links for your CICS regions.
Note: In CandleNet Portal, individual workspaces provide table views, which are the equivalent of CMW reports.
Chapter contents
Introducing the CICS Connections Analysis Reports . . . . . . . . . . . . . . . . . . . . . . . 79
Overview . . . . . . . . . . . . . . . . . . . . . . . . . . . . . . . . . . . . . . . . . . . . . . . . . . . . 79Understanding the CICS Connections Analysis report group . . . . . . . . . . . . . 79Reminder about sorting and filtering data in CMW . . . . . . . . . . . . . . . . . . . . . 80
CICS Connections Analysis Report . . . . . . . . . . . . . . . . . . . . . . . . . . . . . . . . . . . . 81Overview . . . . . . . . . . . . . . . . . . . . . . . . . . . . . . . . . . . . . . . . . . . . . . . . . . . . 81Accessing the CICS Connections Analysis report in CMW . . . . . . . . . . . . . . . 81Report fields and definitions . . . . . . . . . . . . . . . . . . . . . . . . . . . . . . . . . . . . . . 82Accessing connections analysis information from CandleNet Portal . . . . . . . . 82
CICS Connections Summary Report. . . . . . . . . . . . . . . . . . . . . . . . . . . . . . . . . . . 83Overview . . . . . . . . . . . . . . . . . . . . . . . . . . . . . . . . . . . . . . . . . . . . . . . . . . . . 83Accessing the CICS Connections Summary report in CMW . . . . . . . . . . . . . . 83Report fields and definitions . . . . . . . . . . . . . . . . . . . . . . . . . . . . . . . . . . . . . . 83Accessing connections summary information from CandleNet Portal . . . . . . . 84
Link Summary Report. . . . . . . . . . . . . . . . . . . . . . . . . . . . . . . . . . . . . . . . . . . . . . 85Overview . . . . . . . . . . . . . . . . . . . . . . . . . . . . . . . . . . . . . . . . . . . . . . . . . . . . 85Accessing the Link Summary report in CMW . . . . . . . . . . . . . . . . . . . . . . . . . 85
CICS Connections Analysis Report Group 77
Report fields and definitions . . . . . . . . . . . . . . . . . . . . . . . . . . . . . . . . . . . . . . 86Accessing link summary information from CandleNet Portal . . . . . . . . . . . . . . 86
CICS Link Allocation Chart. . . . . . . . . . . . . . . . . . . . . . . . . . . . . . . . . . . . . . . . . . 87Overview . . . . . . . . . . . . . . . . . . . . . . . . . . . . . . . . . . . . . . . . . . . . . . . . . . . . 87Accessing the CICS Link Allocation chart in CMW . . . . . . . . . . . . . . . . . . . . . 87
CICS Link Usage Chart in CMW . . . . . . . . . . . . . . . . . . . . . . . . . . . . . . . . . . . . . . 88Overview . . . . . . . . . . . . . . . . . . . . . . . . . . . . . . . . . . . . . . . . . . . . . . . . . . . . 88Accessing the CICS Link Usage chart in CMW . . . . . . . . . . . . . . . . . . . . . . . . 88Accessing the Link Utilization bar charts in CandleNet Portal . . . . . . . . . . . . . 88
Typical Scenarios in CMW . . . . . . . . . . . . . . . . . . . . . . . . . . . . . . . . . . . . . . . . . . 89Overview . . . . . . . . . . . . . . . . . . . . . . . . . . . . . . . . . . . . . . . . . . . . . . . . . . . . 89Scenario 1: Are connections across CICS regions experiencing any overloads? 89Scenario 2: Are queued AIDs accumulating for a CICS regions? . . . . . . . . . . . 89Scenario 3: Does link usage indicate a potential bottleneck?. . . . . . . . . . . . . . 90
78 OMEGAMON XE for CICSplex User’s Guide, Version 220
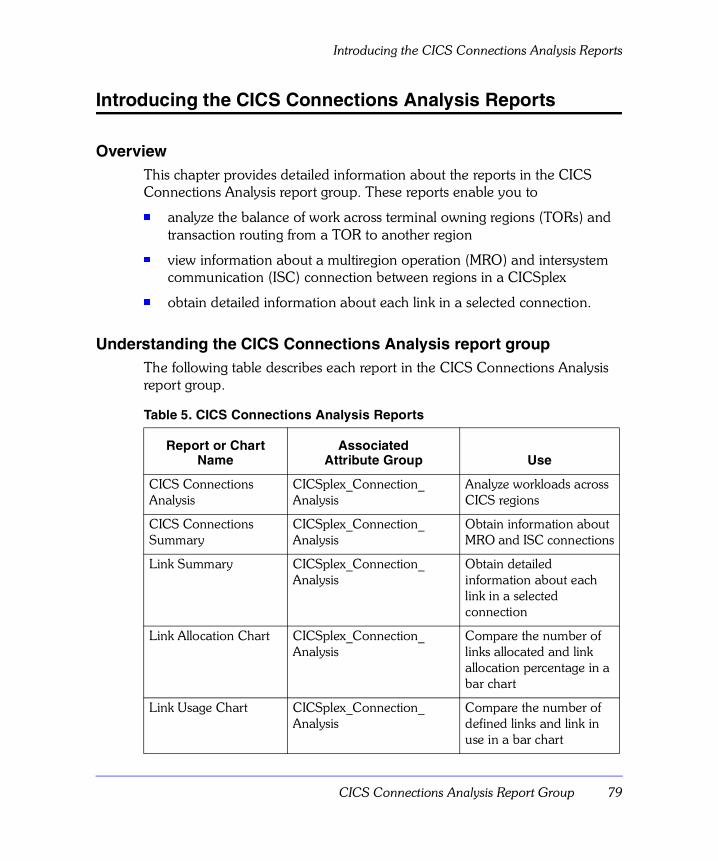
Introducing the CICS Connections Analysis Reports
Introducing the CICS Connections Analysis Reports
OverviewThis chapter provides detailed information about the reports in the CICS Connections Analysis report group. These reports enable you to
n analyze the balance of work across terminal owning regions (TORs) and transaction routing from a TOR to another region
n view information about a multiregion operation (MRO) and intersystem communication (ISC) connection between regions in a CICSplex
n obtain detailed information about each link in a selected connection.
Understanding the CICS Connections Analysis report groupThe following table describes each report in the CICS Connections Analysis report group.
Table 5. CICS Connections Analysis Reports
Report or Chart Name
AssociatedAttribute Group Use
CICS Connections Analysis
CICSplex_Connection_Analysis
Analyze workloads across CICS regions
CICS Connections Summary
CICSplex_Connection_Analysis
Obtain information about MRO and ISC connections
Link Summary CICSplex_Connection_Analysis
Obtain detailed information about each link in a selected connection
Link Allocation Chart CICSplex_Connection_Analysis
Compare the number of links allocated and link allocation percentage in a bar chart
Link Usage Chart CICSplex_Connection_Analysis
Compare the number of defined links and link in use in a bar chart
CICS Connections Analysis Report Group 79
Introducing the CICS Connections Analysis Reports
Reminder about sorting and filtering data in CMWYou can sort and filter information on the CICS Connections Analysis reports to change the way you view information in a report. Refer to “Sorting CICS reports in CMW” on page 42 and “Filtering CICS reports in CMW” on page 43 for more information about sorting and filtering reports.
80 OMEGAMON XE for CICSplex User’s Guide, Version 220
CICS Connections Analysis Report
CICS Connections Analysis Report
OverviewThe CICS Connections Analysis report lets you determine activity and workloads across TORs. It enables you to determine the efficiency of multiregion operation (MRO) and intersystem communication (ISC) links and detect capacity constraints that could cause bottlenecks.
For example, you can readily determine
n the number of connections between this region and others
n the number of transactions per minute
n the number of active LU2
n CPU usage
n link usage
n the balance of work across Terminal Owning Regions (TORs)
n the number of automatic initiate (AIDs) associated with the worst performing MRO and ISC connections
Accessing the CICS Connections Analysis report in CMWUse the following procedure to display the CICS Connections Analysis report in CMW.
Note: This procedure assumes that you have the CMW main window open.
1. From the CMW main window, double-click the Reports icon.Result: The Reports window shows an icon for each CICS report group.
2. Double-click the CICS Connections Analysis icon to display the CICSplex Selection window.
3. Right-click a CICSplex and choose the CICS Connections Analysis Report from the pop-up menu.Result: The CICS Connections Analysis report opens showing the data for the CICS region.
CICS Connections Analysis Report Group 81
CICS Connections Analysis Report
Report fields and definitionsFor a list of report fields and definitions for each field, access the online help for the CICS Connections Analysis report.
Accessing connections analysis information from CandleNet PortalTo access connection analysis information,
1. From the Navigator, select Connection Analysis.
2. The Connection Analysis workspace opens. Within this workspace, you can view the Connection Analysis table view and Link Utilization bar chart.
82 OMEGAMON XE for CICSplex User’s Guide, Version 220
CICS Connections Summary Report
CICS Connections Summary Report
OverviewThe CICS Connections Summary report provides information about the MRO and ISC connections between regions in the CICSplex. You can produce a summary report for each terminal owing region (TOR), application owning region (AOR), or resource owning region (ROR) in the CICSplex or connected to another region. Specifically, you can view information about the
n number of links defined, requested, and in use
n number of primary and secondary links and their usage
n number of AIDs queued to the connected system
n type of connection, its name, and its status
Accessing the CICS Connections Summary report in CMWUse the following procedure to access the CICS Connections Summary report in CMW.
Note: This procedure assumes that you have the CMW main window open.
1. From the CMW main window, double-click the Reports icon.Result: The Reports window shows an icon for each CICS report group.
2. Double-click the CICS Connections Analysis icon to display the CICSplex Selection window.
3. Right-click a CICSplex and choose the CICS Connections Analysis Report from the pop-up menu.
4. Right-click a row in the CICS Connections Analysis report and choose the CICS Connections Summary Report from the pop-up menu.Result: The CICS Connections Summary report opens showing a list of connections for the CICS region.
Report fields and definitionsFor a list of report fields and definitions for each field, access the online help the CICS Connections Summary report.
CICS Connections Analysis Report Group 83
CICS Connections Summary Report
Accessing connections summary information from CandleNet PortalThe connection summary information is provided in the Connections Analysis workspace. See “Accessing connections analysis information from CandleNet Portal” on page 82.
84 OMEGAMON XE for CICSplex User’s Guide, Version 220
Link Summary Report
Link Summary Report
OverviewThe Link Summary report provides detailed information about each link within a selected connection. The Link Summary report enables you to detect system problems before they can have a negative impact on applications. For example, you can obtains statistics on link usage that can alert you to a capacity problem.
For each link, you can determine the
n service status of the link
n number of inputs and outputs
n number of transaction and transmission errors
n number of storage violations
n various names and IDs associated with the link
n name of the connection that owns the link session
Accessing the Link Summary report in CMWUse the following procedure to access the Link Summary report in CMW.
Note: This procedure assumes that you have the CMW main window open.
1. From the CMW main window, double-click the Reports icon.
2. Double-click the CICS Connections Analysis icon to display the CICSplex Selection window.
3. Right-click a CICSplex and choose the CICS Connections Analysis Report from the pop-up menu.
4. Right-click a row in the CICS Connections Analysis report and choose the CICS Connections Summary Report from the pop-up menu.
5. Right-click a row in the CICS Connections Summary report and choose the Link Summary Report from the pop-up menu.Result: The Link Summary report opens showing the data for the CICS connection.
CICS Connections Analysis Report Group 85
Link Summary Report
Report fields and definitionsFor a list of report fields and definitions for each field, access the online help for the Link Summary report.
Accessing link summary information from CandleNet PortalTo access link summary information,
1. From the Navigator, choose Connection Analysis.
2. Right-click a row for a specific connection in the Connection Analysis table view and choose Link Summary from the pop-up menu.
3. The Link Summary workspace opens. Within the this workspace, you can view the Link Summary for Connection table view and Link Utilization bar chart.
86 OMEGAMON XE for CICSplex User’s Guide, Version 220
CICS Link Allocation Chart
CICS Link Allocation Chart
OverviewThe CICS Link Allocation chart reports the following data in bar chart format:
n number of allocated links
n percentage of links being used
View this chart to compare allocation and link usage.
Accessing the CICS Link Allocation chart in CMWUse the following procedure to access the CICS Link Allocation chart in CMW.
Note: This procedure assumes that you have the CMW main window open.
1. From the CMW main window, double-click the Reports icon.Result: The Reports window shows an icon for each CICS report group.
2. Double-click the CICS Connections Analysis icon to display the CICSplex Selection window.
3. Right-click a CICSplex and choose the CICS Connections Analysis Report from the pop-up menu.
4. Right-click a row in the CICS Connections Analysis report and choose the CICS Connections Summary Report from the pop-up menu.
5. Right-click a row in the CICS Connections Summary report and choose the Link Allocation Chart from the pop-up menu.Result: The CICS Link Allocatiaon bar chart opens for the selected connection.
CICS Connections Analysis Report Group 87
CICS Link Usage Chart in CMW
CICS Link Usage Chart in CMW
OverviewThe CICS Link Usage chart reports the following data in bar chart format:
n number of links defined
n number of links in use
View this chart to compare the defined number of links with their actual use.
Accessing the CICS Link Usage chart in CMWUse the following procedure to access the CICS Link Usage chart in CMW.
Note: This procedure assumes that you have the CMW main window open.
1. From the CMW main window, double-click the Reports icon.Result: The Reports window shows an icon for each CICS report group.
2. Double-click the CICS Connections Analysis icon to display the CICSplex Selection window.
3. Right-click a CICSplex and choose the CICS Connections Analysis Report from the pop-up menu.
4. Right-click a row in the CICS Connections Analysis report and choose the CICS Connections Summary Report from the pop-up menu.
5. Right-click a row in the CICS Connections Summary report and choose the Link Usage Chart from the pop-up menu.
6. Result: The CICS Link Usage bar chart opens for the selected connection.
Accessing the Link Utilization bar charts in CandleNet PortalThis information is provided in the Connections Analysis and Link Summary workspaces. See “Accessing connections summary information from CandleNet Portal” on page 84 and “Accessing link summary information from CandleNet Portal” on page 86 for details.
88 OMEGAMON XE for CICSplex User’s Guide, Version 220
Typical Scenarios in CMW
Typical Scenarios in CMW
OverviewThese scenarios describe some ways you can use the CMW reports in the CICS Connections Analysis report group. To retain report data for more analysis, use the Export feature to save the data to a file.
Note: The procedures in this topic do not apply to CandleNet Portal.
Scenario 1: Are connections across CICS regions experiencing any overloads?
You can use the CICS Connections Analysis report to monitor connections activity across CICS regions to identify potential capacity problems. This report identifies the worst MRO and ISC connections and the number of links defined for them. You can also view the number of AIDs associated with the worst connections to help you evaluate conditions.
To track the connections over a period of time, update or refresh the data in the CICS Connections Analysis report by clicking Refresh Now on the View pull-down menu. This refreshes the report with the most current data available from the Candle Management Server (CMS).
Scenario 2: Are queued AIDs accumulating for a CICS regions?You can monitor the accumulation of AIDs in two ways:
n Use the CICS Connections Summary report to determine if any AIDs are queued for a connected system. This report shows all the connections for a region and their status. You can immediately determine a connection type and if it is in service. You can also see the number of AIDS queued against the connection. Queued aids indicate that the connection is running at full capacity. You may need to redefine or increase the connection capacity.
To track the connections over a period of time, update or refresh the data in the CICS Connections Summary report by clicking Refresh Now on the View pull-down menu. This refreshes the report with the most current data available from the Candle Management Server (CMS).
CICS Connections Analysis Report Group 89
Typical Scenarios in CMW
n Use the product-provided situation CICSRegion_AIDSCrit to issue an alert whenever the number of AIDs exceed a critical threshold.
Scenario 3: Does link usage indicate a potential bottleneck? You can monitor the link usage in three ways:
n Use the Link Summary report to analyze performance for a link. This report shows such information at the link service status and the number of link transmission errors and transaction errors for each link.
You can also determine the number of transactions run on this link and how many link storage violations have occurred.
n Display the Link Allocation and Link Usage charts to analyze performance for a connection. These charts indicate current activity.
n Use the product-provided situation CICSRegion_ISC_Capacity_Warning to issue an alert whenever link usage exceeds defined thresholds.
90 OMEGAMON XE for CICSplex User’s Guide, Version 220
CICS Region AnalysisReport Group5
IntroductionThis chapter provides detailed information about the reports in the CICS Region Analysis report group. These reports let you monitor CICS regions and storage, obtain information about VSAM files that are being used, and view information about a message queueing (MQ) connection.
Note: In CandleNet Portal, individual workspaces provide table views, which are the equivalent of CMW reports.
Chapter Contents
Introducing the CICS Region Analysis Reports . . . . . . . . . . . . . . . . . . . . . . . . . . . 93
Overview . . . . . . . . . . . . . . . . . . . . . . . . . . . . . . . . . . . . . . . . . . . . . . . . . . . . 93Understanding the CICS Region Analysis report group. . . . . . . . . . . . . . . . . . 94Reminder about sorting and filtering data in CMW . . . . . . . . . . . . . . . . . . . . . 95
CICS Region Analysis Report . . . . . . . . . . . . . . . . . . . . . . . . . . . . . . . . . . . . . . . . 96Overview . . . . . . . . . . . . . . . . . . . . . . . . . . . . . . . . . . . . . . . . . . . . . . . . . . . . 96Accessing the current CICS Region Analysis report in CMW . . . . . . . . . . . . . . 97Accessing the Historical CICS Region Analysis report in CMW . . . . . . . . . . . . 98Report fields and definitions . . . . . . . . . . . . . . . . . . . . . . . . . . . . . . . . . . . . . . 98Accessing region analysis information from CandleNet Portal . . . . . . . . . . . . . 99
CICS Region Summary Chart . . . . . . . . . . . . . . . . . . . . . . . . . . . . . . . . . . . . . . . 100Overview . . . . . . . . . . . . . . . . . . . . . . . . . . . . . . . . . . . . . . . . . . . . . . . . . . . 100Accessing the CICS Regions Summary chart in CMW . . . . . . . . . . . . . . . . . 100
CICS Storage Summary Report . . . . . . . . . . . . . . . . . . . . . . . . . . . . . . . . . . . . . 101Overview . . . . . . . . . . . . . . . . . . . . . . . . . . . . . . . . . . . . . . . . . . . . . . . . . . . 101Accessing the CICS Storage Summary report in CMW . . . . . . . . . . . . . . . . . 102
CICS Region Analysis Report Group 91
Report fields and definitions . . . . . . . . . . . . . . . . . . . . . . . . . . . . . . . . . . . . . 102Accessing storage analysis information from CandleNet Portal . . . . . . . . . . . 102
CICSplex MQ Connection Details Report . . . . . . . . . . . . . . . . . . . . . . . . . . . . . . 103Overview . . . . . . . . . . . . . . . . . . . . . . . . . . . . . . . . . . . . . . . . . . . . . . . . . . . 103Accessing the MQ Connection Details report in CMW . . . . . . . . . . . . . . . . . 103Report fields and definitions . . . . . . . . . . . . . . . . . . . . . . . . . . . . . . . . . . . . . 104Accessing message queuing information from CandleNet Portal . . . . . . . . . . 104
CICS VSAM Analysis Report. . . . . . . . . . . . . . . . . . . . . . . . . . . . . . . . . . . . . . . . 105Overview . . . . . . . . . . . . . . . . . . . . . . . . . . . . . . . . . . . . . . . . . . . . . . . . . . . 105Accessing the CICS VSAM Analysis report in CMW . . . . . . . . . . . . . . . . . . . 106Report fields and definitions . . . . . . . . . . . . . . . . . . . . . . . . . . . . . . . . . . . . . 106Accessing VSAM analysis information from CandleNet Portal. . . . . . . . . . . . 106
Regions Sharing a VSAM File Report . . . . . . . . . . . . . . . . . . . . . . . . . . . . . . . . . 107Overview . . . . . . . . . . . . . . . . . . . . . . . . . . . . . . . . . . . . . . . . . . . . . . . . . . . 107Accessing the Regions Sharing a VSAM File report in CMW . . . . . . . . . . . . . 107Report fields and definitions . . . . . . . . . . . . . . . . . . . . . . . . . . . . . . . . . . . . . 108Accessing connections VSAM file information from CandleNet Portal . . . . . . 108
Typical Scenarios in CMW . . . . . . . . . . . . . . . . . . . . . . . . . . . . . . . . . . . . . . . . . 109Overview . . . . . . . . . . . . . . . . . . . . . . . . . . . . . . . . . . . . . . . . . . . . . . . . . . . 109Scenario 1: Is the CICS Web interface available? . . . . . . . . . . . . . . . . . . . . . 109Scenario 2: What is the activity for an MQ connection? . . . . . . . . . . . . . . . . 109Scenario 3: Do conditions across a CICS region indicate potential problems? . . . . . . . . . . . . . . . . . . . . . . . . . . . . . . . . . . . . . . . . . . . 110Scenario 4: Is storage availability for the DSA and EDSA a problem?. . . . . . 111Scenario 5: What are the current conditions for VSAM datasets allocated to a CICS region? . . . . . . . . . . . . . . . . . . . . . . . . . . . . . . . . . . . . . 111Scenario 6: What are activity levels for shared VSAM datasets? . . . . . . . . . . 112
92 OMEGAMON XE for CICSplex User’s Guide, Version 220
Introducing the CICS Region Analysis Reports
Introducing the CICS Region Analysis Reports
OverviewThis chapter provides detailed information about the reports in the CICS Region Analysis report group. These reports enable you to
n monitor all regions
n monitor usage of the dynamic storage area (DSA) by a single region
n identify all regions that share a VSAM dataset and determine its status
n obtain detailed information about VSAM datasets allocated to a region
n obtain performance information about a message queueing (MQ) connection
n view performance data in bar chart form
CICS Region Analysis Report Group 93
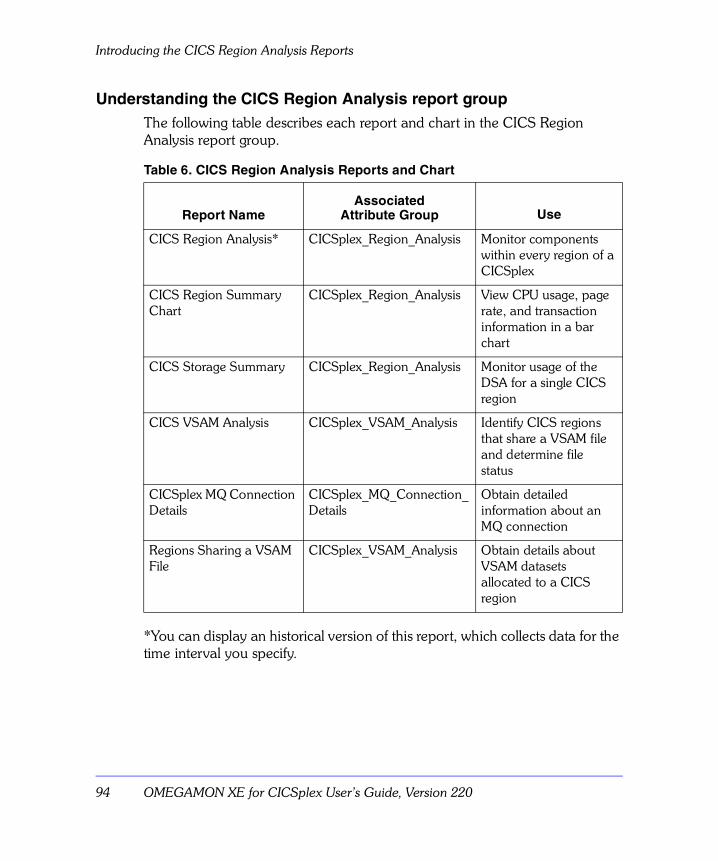
Introducing the CICS Region Analysis Reports
Understanding the CICS Region Analysis report groupThe following table describes each report and chart in the CICS Region Analysis report group.
*You can display an historical version of this report, which collects data for the time interval you specify.
Table 6. CICS Region Analysis Reports and Chart
Report NameAssociated
Attribute Group Use
CICS Region Analysis* CICSplex_Region_Analysis Monitor components within every region of a CICSplex
CICS Region Summary Chart
CICSplex_Region_Analysis View CPU usage, page rate, and transaction information in a bar chart
CICS Storage Summary CICSplex_Region_Analysis Monitor usage of the DSA for a single CICS region
CICS VSAM Analysis CICSplex_VSAM_Analysis Identify CICS regions that share a VSAM file and determine file status
CICSplex MQ Connection Details
CICSplex_MQ_Connection_Details
Obtain detailed information about an MQ connection
Regions Sharing a VSAM File
CICSplex_VSAM_Analysis Obtain details about VSAM datasets allocated to a CICS region
94 OMEGAMON XE for CICSplex User’s Guide, Version 220
Introducing the CICS Region Analysis Reports
Reminder about sorting and filtering data in CMWYou can sort and filter information on the CICS Connections Analysis reports to change the way you view information in a report. Refer to “Sorting CICS reports in CMW” on page 42 and “Filtering CICS reports in CMW” on page 43 for more information about sorting and filtering reports.
CICS Region Analysis Report Group 95
CICS Region Analysis Report
CICS Region Analysis Report
OverviewThis report or table view lets you review operations for every region of a CICSplex. You can analyze this data to detect system problems before they have a negative impact on operations.
The CICS Region Analysis report provides data on more than 30 items for you to evaluate. For example, it provides information about
n short-on-storage (SOS) conditions for the DSA and EDSA
n the number of tasks that are waiting for buffers and strings
n the number of enqueues for a resource that also has tasks waiting for it
n the numbers of active tasks and total tasks within a region expressed as a percentage of their defined limits
n the percentages of CPU, dynamic storage area (DSA), and extended dynamic storage area (EDSA) being used
n the number of connections, AIDs, and ICEs
n the maximum contiguous free space in the local system queue area (LSQA) and operating system core (OSCOR)
n the number of control intervals (CIs), transient data strings, and temporary storage strings being used by the transient (DFHINTRA) and the auxiliary temporary storage (DFHTEMP) datasets
n status of information for the Web interface and MQ adapter
n the occurrence of system and transaction dumps
n storage violations
n I/O rate and page rate per second
n transactions and program compressions per minute
n VTAM action control block (ACB)
You can view either a current CISC Region Analysis report for the current interval or an historical version for a time span that you specify.
96 OMEGAMON XE for CICSplex User’s Guide, Version 220
CICS Region Analysis Report
This report group also provides access to the CICS Region Summary chart.
Accessing the current CICS Region Analysis report in CMWUse the following procedure to access the CICS Region Analysis report in CMW. (In CandleNet Portal, choose Region Analysis from the list of workspaces in the Navigator.)
Note: This procedure assumes that you have the CMW main window open.
1. From the CMW main window, double-click the Reports icon.Result: The Reports window shows an icon for each CICS report group.
2. Double-click the CICS Region Analysis icon to display the CICSplex Selection window.
3. Right-click a CICSplex and choose the CICS Region Analysis Report from the pop-up menu.Result: The CICS Region Analysis report opens showing a list of available CICS regions.
CICS Region Analysis Report Group 97
CICS Region Analysis Report
Accessing the Historical CICS Region Analysis report in CMWUse the following procedure to access the Historical CICS Region Analysis report in CMW.
Note: This procedure assumes that you have the CMW main window open.
1. From the CMW main window, double-click the Reports icon.Result: The Reports window shows an icon for each CICS report group.
2. Double-click the CICS Region Analysis icon to display the CICSplex Selection window.
3. Right-click a CICSplex and choose the Historical CICS Region Analysis Report from the pop-up menu.Result: The Time Span Selection dialog box opens.
4. Choose one of the predefined time spans or click Custom Time Span to specify your own.
5. Click OK. Result: The CICS Region Analysis report opens showing a list of available CICS regions.
Note: Because a large time span may cause response time delays, OMEGAMON XE for CICSplex prompts you if this could occur. If prompted choose either
– Continue if you wish to proceed
– Cancel and specify a new timespan
Report fields and definitionsFor a list of report fields and definitions for each field, access the online help for the CICS Region Analysis report.
98 OMEGAMON XE for CICSplex User’s Guide, Version 220
CICS Region Analysis Report
Accessing region analysis information from CandleNet PortalTo access region analysis information:
1. From the Navigator, select Region Analysis.
2. The Region Analysis workspace opens. Within this workspace, you can view the CICS Region Overview table view, Minimum Tasks Percent needle gauge, CPU Utilization needle gauge, and Transaction Rate plot chart.
CICS Region Analysis Report Group 99
CICS Region Summary Chart
CICS Region Summary Chart
OverviewThe CICS Region Summary chart reports the following data in bar chart format:
n percentage of CPU being used
n page rate per second
n number of transactions per minute
This data provides an overview of activity for the CICS Region.
Accessing the CICS Regions Summary chart in CMWUse the following procedure to access the CICS Regions Summary chart in CMW.
Note: This procedure assumes that you have the CMW main window open.
1. From the CMW main window, double-click the Reports icon.Result: The Reports window shows an icon for each CICS report group.
2. Double-click the CICS Region Analysis icon to display the CICSplex Selection window.
3. Right-click a CICSplex and choose the CICS Regions Summary Chart from the pop-up menu.Result: The CICS Regions Summary bar chart opens.
100 OMEGAMON XE for CICSplex User’s Guide, Version 220
CICS Storage Summary Report
CICS Storage Summary Report
OverviewThis topic teaches you about the CICS Storage Summary report. The CICS Storage Summary report provides an overview of DSA usage for a single CICS region. It enables you to determine if there are any storage-related problems, such as an SOS condition.
The version of CICS that you are using determines the information that is reported.
n CICS Version 3 and below reports
– the size of allocated storage in kilobytes
– the percentage of allocated storage in use
– the amount of free space in kilobytes
– SOS conditions
n CICS Version 4 and above reports
– the limit set for storage in kilobytes
– the amount of allocated storage in use in kilobytes
– the amount of storage in use in kilobytes
– the percentage of storage being used
– SOS conditions
CICS Region Analysis Report Group 101
CICS Storage Summary Report
Accessing the CICS Storage Summary report in CMWUse the following procedure to access the CICS Storage Summary report in CMW. (In CandleNet Portal, choose Storage Analysis from the list of workspaces in the Navigator.)
Note: This procedure assumes that you have the CMW main window open.
1. From the CMW main window, double-click the Reports icon.Result: The Reports window shows an icon for each CICS report group.
2. Double-click the CICS Region Analysis icon to display the CICSplex Selection window.
3. Right-click a CICSplex and choose the CICS Region Analysis Report from the pop-up menu.
4. Right-click a row in the CICS Region Analysis report and choose the CICS Storage Summary Report from the pop-up menu.Result: The CICS Storage Summary report opens showing a list of available CICS regions.
Report fields and definitionsFor a list of report fields and definitions for each field, access the online help the CICS Storage Summary report.
Accessing storage analysis information from CandleNet PortalTo access storage analysis information,
1. From the Navigator, select Storage Analysis.
2. The Storage Analysis workspace opens. Within this workspace, you can view the Dynamic Storage Analysis table view, DSA Utilization and EDSA Utilization needle gauges, and the CICS Storage Allocation bar chart.
102 OMEGAMON XE for CICSplex User’s Guide, Version 220
CICSplex MQ Connection Details Report
CICSplex MQ Connection Details Report
OverviewThe CICS MQ Connection Details report lets you evaluate how the MQ connection for message queueing may be affecting operations in your CICS environment. It gives you information about such items as
n the status of the MQ connection
n API calls logged for an MQ connection
n the number of MQ calls that resulted in commits and backouts
n the number of MQ calls that were successfully completed
n the counts for specific types of MQ requests, for example, the number of calls applications issued for getting messages from the queue
n busy task control blocks (TCBs)
If you discover a problem, you can zoom directly to OMEGAMON II for CICS to get more information about the region. You can also create situations based on the various columns in this report. For example, you can create situations that monitor connection status and the number of busy CICS-MQ TCBs.
Accessing the MQ Connection Details report in CMWUse the following procedure to access the CICS MQ Connection Details report in CMW. (In CandleNet Portal, choose Message Queueing Analysis from the list of workspaces in the Navigator.)
Note: This procedure assumes that you have the CMW main window open.
1. From the CMW main window, double-click the Reports icon.Result: The Reports window shows an icon for each CICS report group.
2. Double-click the CICS Region Analysis icon to display the CICSplex Selection window.
3. Right-click a CICSplex and choose the CICS Region Analysis Report from the pop-up menu.
CICS Region Analysis Report Group 103
CICSplex MQ Connection Details Report
4. Right-click a row in the CICS Region Analysis report and choose the CICSplex MQ Connection Report from the pop-up menu.Result: The CICSplex MQ Connection Details report opens.
Report fields and definitionsFor a list of report fields and definitions for each field, access the online help for the CICSplex MQ Connection Details report.
Accessing message queuing information from CandleNet PortalTo access message queuing information,
1. From the Navigator, select Message Queuing Analysis.
2. The Message Queuing Analysis workspace opens. Within this workspace, you can view the Message Queuing Analysis table view, Message Queuing Requests bar chart, and Busy TCBs thermometer gauge.
104 OMEGAMON XE for CICSplex User’s Guide, Version 220
CICS VSAM Analysis Report
CICS VSAM Analysis Report
OverviewThe CICS VSAM Analysis report provides details about the VSAM datasets allocated to a selected CICS region.
Because CICS dumps, traces, transient data, and auxiliary temporary storage reside in VSAM datasets, you can use this report to locate a VSAM dataset experiencing string waits or excessive control interval (CI) or control area (CA) splits. Such conditions can adversely affect CICS performance.
This report contains current data collected on demand for such items as
n the number of data CA and data CI splits for the VSAM dataset
n the number of index CA and CI splits for the VSAM dataset
n the numbers of new data and index extents taken by the VSAM dataset
n mode of access CICS uses to open the dataset
n type of VSAM dataset
n total time-outs from VSAM datasets in record-level sharing (RLS) mode
n the status of the VSAM dataset
n statistics for the number of strings defined, the strings being used, and the strings with requests queued against them
CICS Region Analysis Report Group 105
CICS VSAM Analysis Report
Accessing the CICS VSAM Analysis report in CMWUse the following procedure to access the CICS VSAM Analysis report in CMW. (In CandleNet Portal, choose VSAM Analysis from the list of workspaces in the Navigator.)
Note: This procedure assumes that you have the CMW main window open.
1. From the CMW main window, double-click the Reports icon.Result: The Reports window shows an icon for each CICS report group.
2. Double-click the CICS Region Analysis icon to display the CICSplex Selection window.
3. Right-click a CICSplex and choose the CICS Region Analysis Report from the pop-up menu.
4. Right-click a row in the CICS Region Analysis report and choose the CICS VSAM Analysis Report from the pop-up menu.Result: The CICS VSAM Analysis report opens showing a list of available CICS regions.
Report fields and definitionsFor a list of report fields and definitions for each field, access the online help for the CICS VSAM Analysis report.
Accessing VSAM analysis information from CandleNet PortalTo access VSAM analysis information,
1. From the Navigator, select VSAM Analysis.
2. The VSAM Analysis workspace opens. Within this workspace, you can view the VSAM Analysis table view and VSAM String Utilization bar chart.
106 OMEGAMON XE for CICSplex User’s Guide, Version 220
Regions Sharing a VSAM File Report
Regions Sharing a VSAM File Report
OverviewThe Regions Sharing a VSAM File report shows the CICS regions that share the selected VSAM file in RLS mode. You can use this report to see the CICS region job names of the sharing CICS regions, open VSAM file status, and string statistics.
This report contains current data collected on demand about the shared VSAM dataset which includes the
n CICS region job name
n data definition name
n type of VSAM dataset and its status
n statistics for the number of strings defined and being used
n total time-outs from VSAM datasets in RLS mode
Accessing the Regions Sharing a VSAM File report in CMWUse the following procedure to access the Regions Sharing a VSAM File report in CMW.
Note: This procedure assumes that you have the CMW main window open.
1. From the CMW main window, double-click the Reports icon.Result: The Reports window shows an icon for each CICS report group.
2. Double-click the CICS Region Analysis icon to display the CICSplex Selection window.
3. Right-click a CICSplex and choose the CICS Region Analysis Report from the pop-up menu.
4. Right-click a row in the CICS Region Analysis report and choose the CICS VSAM Analysis Report from the pop-up menu.
5. Right-click a row in the CICS VSAM Analysis report and choose the Regions Sharing a VSAM File Report from the pop-up menu.
CICS Region Analysis Report Group 107
Regions Sharing a VSAM File Report
Result: The Regions Sharing a VSAM File report opens showing a list of available CICS regions.
Report fields and definitionsFor a list of report fields and definitions for each field, access the online help for the CICS VSAM Dataset Allocation report.
Accessing connections VSAM file information from CandleNet PortalThe VSAM file information is provided in the VSAM Analysis workspace. See page 106 for information.
108 OMEGAMON XE for CICSplex User’s Guide, Version 220
Typical Scenarios in CMW
Typical Scenarios in CMW
OverviewThese scenarios describe some ways you can use the reports in the CICS Connections Region report group in CMW. To retain report data for more analysis, use the Export feature to save the data to a file.
Note: This topic does not apply to CandleNet Portal.
Scenario 1: Is the CICS Web interface available?Use the CICS Region Analysis report to check the Web Interface Status column to see if the Web interface is available.
Scenario 2: What is the activity for an MQ connection?You can monitor activity for an MQ connection in two ways:
n You can use the CICS MQ Connection Details report to view information about an MQ connection. This report shows the status of the MQ connection and lets you review additional information that includes the number of
– busy TCBs for the MQ connection
– CICS-MQ tasks that are i the process of being completed
– MQ calls that resulted in a blackout
– MQ calls that were successfully completed
– MQ calls issued to commit operations for MQ resources
– different types of MQ requests that were issued
n Use the CICSRegion_MQ_Connection product-provided situation to issue an alert whenever the status of the connection has been anything but ACTIVE for a specified amount of time.
CICS Region Analysis Report Group 109
Typical Scenarios in CMW
Scenario 3: Do conditions across a CICS region indicate potential problems?
You can monitor potential problem areas for a CICS region in two ways:
n Use the CICS Region Analysis report to monitor conditions for a CICSplex and identify potential problems. This report reveals conditions about potential problems related to files, storage, and queues.
These are some of the numerous ways you can monitor potential problem areas
– Check the Maximum Tasks Percent and Maximum Active Tasks Percent columns. If these amounts reach 100%, then CICS stops attaching and dispatching new tasks in the region.
– Check the Enqueue Waits column to see if CICS enqueues are controlling a resource for which that tasks are waiting. A large number indicates that too many tasks are competing for exclusive access to the same resource, at the same time. This situation may indicate a looping task, a deadlock, or poor response time from a task.
– Check the Transaction Dumps Count and System Dumps Count columns to see if any dumps have occurred in the last hour.
– Check the AIDS Count column to see if any exist. AIDs are created when CICS is unable to start a task. An accumulation of AIDs can adversely affect CICS storage and CPU availability.
– Check the Journal Wait Count column to see if CICS is waiting for an operator response to confirm the journal can be overwritten and reused. CICS transactions using a journal may not be able to continue until a response is received.
n Use the following product-provided situations to issue alerts for problem areas for CICS regions:
– CICSRegion_PcntAMXTCrit and CICSRegion_PercentMXTCrit issues alerts whenever the number of tasks exceed critical thresholds.
– CICSRegion_ENQWaitCrit issues an alert whenever the number of enqueues exceeds a critical threshold.
– CICSRegion_SysDumpCrit and CICSRegion_TranDumpCrit issue alerts whenever the number of dumps exceed critical thresholds.
110 OMEGAMON XE for CICSplex User’s Guide, Version 220
Typical Scenarios in CMW
– CICSRegion_AIDsCrit issues an alert whenever the number of AIDs exceed a critical threshold.
– CICSRegion_JrnlWaitCrit issues an alert whenever a journal wait occurs.
Scenario 4: Is storage availability for the DSA and EDSA a problem?You can monitor potential problem areas for a CICS region in two ways:
n Use the CICS Storage Summary report to monitor storage conditions for the DSA and EDSA. For each area, this report shows
– the total amount of storage, in kilobytes, that you are allowed to request from CICS for the area
– the total amount of storage, in kilobytes, that is allocated for the area
– the total amount of storage, in kilobytes, that CICS is using for the area
– the percentage of total storage that CICS is using for the area
– whether or not a short-on-storage (SOS) condition exists
n Use the CICSRegion_Storage_Availabilty product-provided situation to issue an alert whenever the use of the dynamic storage areas exceeds a critical threshold.
Scenario 5: What are the current conditions for VSAM datasets allocated to a CICS region?
You can use the CICS VSAM Analysis report to review details about the VSAM datasets allocated to a CICS region. This report reveals if a file is enabled and open. For each VSAM dataset, you can review analytical information that includes
n the number of data and index control area (CA) and control interval (CI) splits. Excessive splits can adversely affect CICS performance.
n the number of data and index extents taken for the filen the number of RLS timeouts taken for the file. These timeouts occur
whenever a task issues a request for a record that is being held by another task.
CICS Region Analysis Report Group 111
Typical Scenarios in CMW
n information to monitor usage of VSAM strings that includes the
– number of defined strings
– number of strings in use
– percentage of strings in use
– waits for strings
When all the strings are in use, new requests are queued until a string is released. Too many string waits can force tasks to wait and degrade response time.
Scenario 6: What are activity levels for shared VSAM datasets?You can use the Regions Sharing a VSAM File report to monitor activity for VSAM datasets that are being shared by regions. This report enables you to
n identify the type of VSAM file that is being shared
n obtain the status of each file and determines if it has been defined in the File Access Control Table
n determine the number of strings that are defined to process I/O requests to the VSAM file, the number of strings that are being used, and the percentage of strings that are being used
n note the total number of timeouts for VSAM files in record-level sharing (RLS) mode
112 OMEGAMON XE for CICSplex User’s Guide, Version 220
CICS Service Level AnalysisReport Group6
IntroductionThis chapter provides detailed information about the reports in the CICS Service Level Analysis report group.
Note: In CandleNet Portal, individual workspaces provide table views, which are the equivalent of CMW reports.
Chapter Contents
Introducing the CICS Service Level Analysis Reports . . . . . . . . . . . . . . . . . . . . . 115
Overview . . . . . . . . . . . . . . . . . . . . . . . . . . . . . . . . . . . . . . . . . . . . . . . . . . . 115Understanding the CICS Service Level Analysis report group . . . . . . . . . . . . 115Reminder about sorting and filtering data in CMW . . . . . . . . . . . . . . . . . . . . 116
CICS Service Level Analysis Report . . . . . . . . . . . . . . . . . . . . . . . . . . . . . . . . . . 117Overview . . . . . . . . . . . . . . . . . . . . . . . . . . . . . . . . . . . . . . . . . . . . . . . . . . . 117Accessing the CICS Service Level Analysis report in CMW . . . . . . . . . . . . . . 118Report fields and definitions . . . . . . . . . . . . . . . . . . . . . . . . . . . . . . . . . . . . . 118Accessing service level information from CandleNet Portal . . . . . . . . . . . . . . 118
Service Class Analysis Report . . . . . . . . . . . . . . . . . . . . . . . . . . . . . . . . . . . . . . . 119Overview . . . . . . . . . . . . . . . . . . . . . . . . . . . . . . . . . . . . . . . . . . . . . . . . . . . 119Accessing the Service Class Analysis report in CMW. . . . . . . . . . . . . . . . . . . 119Report fields and definitions . . . . . . . . . . . . . . . . . . . . . . . . . . . . . . . . . . . . . 119
Service Class Analysis by Region Report . . . . . . . . . . . . . . . . . . . . . . . . . . . . . . . 120Overview . . . . . . . . . . . . . . . . . . . . . . . . . . . . . . . . . . . . . . . . . . . . . . . . . . . 120Accessing the Service Class Analysis by Region report in CMW . . . . . . . . . . 120Report fields and definitions . . . . . . . . . . . . . . . . . . . . . . . . . . . . . . . . . . . . . 120
CICS Service Level Analysis Report Group 113
Accessing service class analysis by region information from CandleNet Portal . . . . . . . . . . . . . . . . . . . . . . . . . . . . . . . . . . . . . . . . . . . . . 121
Service Class Analysis by Transaction ID Report . . . . . . . . . . . . . . . . . . . . . . . . . 122Overview . . . . . . . . . . . . . . . . . . . . . . . . . . . . . . . . . . . . . . . . . . . . . . . . . . . 122Accessing the Service Class Analysis by Transaction ID report in CMW . . . . 122Report fields and definitions . . . . . . . . . . . . . . . . . . . . . . . . . . . . . . . . . . . . . 122Accessing service class analysis by transaction information from CandleNet Portal . . . . . . . . . . . . . . . . . . . . . . . . . . . . . . . . . . . . . . . . . . . . . 123
Service Class Time Distribution Chart . . . . . . . . . . . . . . . . . . . . . . . . . . . . . . . . . 124Overview . . . . . . . . . . . . . . . . . . . . . . . . . . . . . . . . . . . . . . . . . . . . . . . . . . . 124Accessing the Service Class Time Distribution chart in CMW . . . . . . . . . . . . 124
Service Level Performance . . . . . . . . . . . . . . . . . . . . . . . . . . . . . . . . . . . . . . . . . 125Overview . . . . . . . . . . . . . . . . . . . . . . . . . . . . . . . . . . . . . . . . . . . . . . . . . . . 125Accessing the Service Level Performance chart in CMW. . . . . . . . . . . . . . . . 125
Typical Scenarios in CMW . . . . . . . . . . . . . . . . . . . . . . . . . . . . . . . . . . . . . . . . . 126Overview . . . . . . . . . . . . . . . . . . . . . . . . . . . . . . . . . . . . . . . . . . . . . . . . . . . 126Scenario 1: Is a CICSplex meeting its expected performance levels? . . . . . . . 126Scenario 2: Are any databases causing CICS performance problems? . . . . . 126Scenario 3: Is a service class spending excessive time waiting for the DL/I service program? . . . . . . . . . . . . . . . . . . . . . . . . . . . . . . . . . . . . . . . . . 127Scenario 4: Are tasks for a particular transaction ID waiting too long for file I/O requests to complete? . . . . . . . . . . . . . . . . . . . . . . . . . . . . . . . . . . . . 127Scenario 5: Are tasks within a region being slowed by function shipping? . . . 128
114 OMEGAMON XE for CICSplex User’s Guide, Version 220
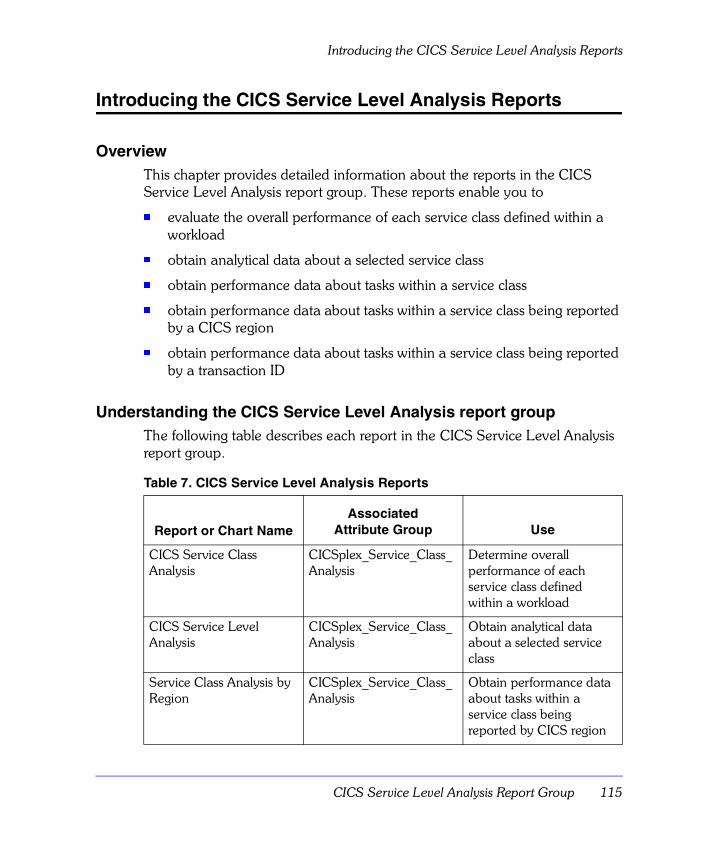
Introducing the CICS Service Level Analysis Reports
Introducing the CICS Service Level Analysis Reports
OverviewThis chapter provides detailed information about the reports in the CICS Service Level Analysis report group. These reports enable you to
n evaluate the overall performance of each service class defined within a workload
n obtain analytical data about a selected service class
n obtain performance data about tasks within a service class
n obtain performance data about tasks within a service class being reported by a CICS region
n obtain performance data about tasks within a service class being reported by a transaction ID
Understanding the CICS Service Level Analysis report groupThe following table describes each report in the CICS Service Level Analysis report group.
Table 7. CICS Service Level Analysis Reports
Report or Chart NameAssociated
Attribute Group Use
CICS Service Class Analysis
CICSplex_Service_Class_Analysis
Determine overall performance of each service class defined within a workload
CICS Service Level Analysis
CICSplex_Service_Class_Analysis
Obtain analytical data about a selected service class
Service Class Analysis by Region
CICSplex_Service_Class_Analysis
Obtain performance data about tasks within a service class being reported by CICS region
CICS Service Level Analysis Report Group 115
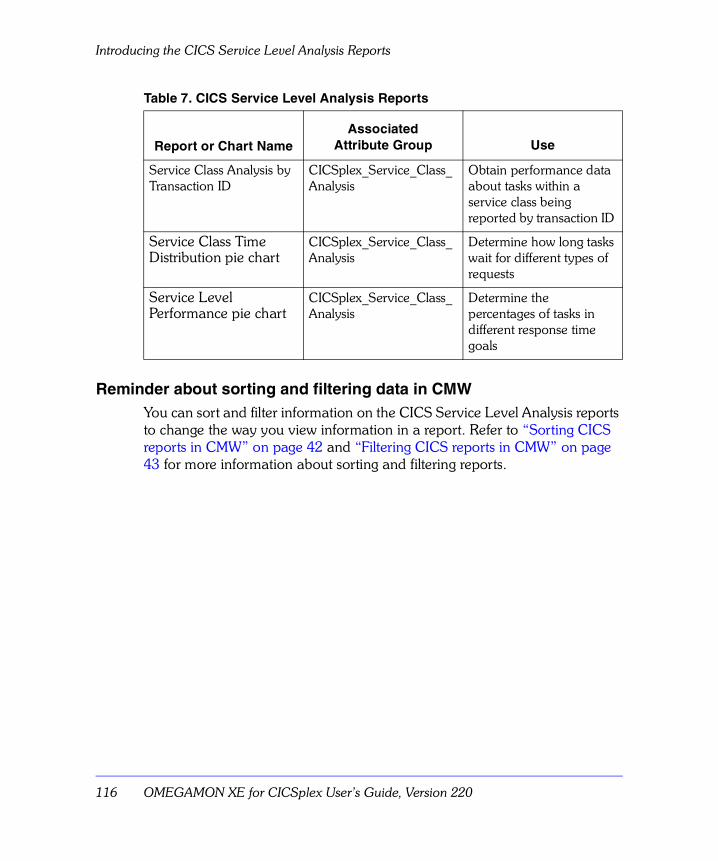
Introducing the CICS Service Level Analysis Reports
Reminder about sorting and filtering data in CMWYou can sort and filter information on the CICS Service Level Analysis reports to change the way you view information in a report. Refer to “Sorting CICS reports in CMW” on page 42 and “Filtering CICS reports in CMW” on page 43 for more information about sorting and filtering reports.
Service Class Analysis by Transaction ID
CICSplex_Service_Class_Analysis
Obtain performance data about tasks within a service class being reported by transaction ID
Service Class Time Distribution pie chart
CICSplex_Service_Class_Analysis
Determine how long tasks wait for different types of requests
Service Level Performance pie chart
CICSplex_Service_Class_Analysis
Determine the percentages of tasks in different response time goals
Table 7. CICS Service Level Analysis Reports
Report or Chart NameAssociated
Attribute Group Use
116 OMEGAMON XE for CICSplex User’s Guide, Version 220
CICS Service Level Analysis Report
CICS Service Level Analysis Report
OverviewThe CICS Service Level Analysis report displays the overall performance of each service class defined within a workload. A high percentage of time spent for different types of waits may indicate potential problem areas.
Each report row contains summary information about a service class for the collection interval that falls within the reported time span. If the reported time span includes multiple collection intervals for a service class, each interval is reported separately.
For each service class entry, the default analysis includes the following:
n service class name
n collection interval end date and time
n response time goal, including the percent of goal, where appropriate
n the number of completed transactions
n performance data, such as average response time, performance index, and percent-of-goal information
OMEGAMON XE for CICSplex provides a CICS Service Level Analysis report for the following reporting periods:
Current This report contains data collected in the last 5 minutes.
Historical This report contains data for the time interval you specify when you request the report.
CICS Service Level Analysis Report Group 117
CICS Service Level Analysis Report
Accessing the CICS Service Level Analysis report in CMWUse the following procedure to access the CICS Service Level Analysis report in CMW.
Note: This procedure assumes that you have the CMW main window open.
1. From the CMW main window, double-click the Reports icon.Result: The Reports window shows an icon for each CICS report group.
2. Right-click the CICS Service Level Analysis icon and then choose the CICS Workload Selection Report from the pop-up menu.
3. Right-click a workload name in the first column and select the Service Level Report from the pop-up menu.Result: The CICS Service Level Analysis report opens showing a list of available CICS regions.
Report fields and definitionsFor a list of report fields and definitions for each field, access the online help for the CICS Service Level Analysis report.
Accessing service level information from CandleNet PortalTo access connection analysis information,
1. From the Navigator, select Service Level Analysis.
2. The Service Level Analysis workspace opens. Within this workspace, you can view the Service Level Analysis table view and a browser view.
118 OMEGAMON XE for CICSplex User’s Guide, Version 220
Service Class Analysis Report
Service Class Analysis Report
OverviewThe CICS Service Class Analysis report displays one row of CICS Service Level Analysis data for the selected service class. For each service class, the default analysis includes the following information:
n the response time goal
n performance data, such as average response time, performance index, and percent-of-goal information
n percentage of elapsed time tasks spent using the CPU
n the percentage of elapsed time that was spent waiting for specific items such as DB2 requests or the MQ connection
n the number of completed tasks in a service class during the collection interval
Accessing the Service Class Analysis report in CMWUse the following procedure to access the Service Class Analysis report in CMW.
Note: This procedure assumes that you have the CMW main window open.
1. From the CMW main window, double-click the Reports icon.Result: The Reports window shows an icon for each CICS report group.
2. Right-click the CICS Service Class Analysis icon and then choose the Service Class Analysis Report from the pop-up menu.Result: The Service Class Analysis report opens showing a list of available CICS regions.
Report fields and definitionsFor a list of report fields and definitions for each field, access the online help the Service Class Analysis report.
CICS Service Level Analysis Report Group 119
Service Class Analysis by Region Report
Service Class Analysis by Region Report
OverviewThe Service Class Analysis by Region report identifies the CICS regions in which tasks within a service class completed in the reported time span.
The default analysis includes the following information:
n collection interval end date and time
n CICS region name
n response time goal
n number of completed transactions
n performance data, such as the average transaction response time and corresponding performance indexes, and percent-of-goal information
Accessing the Service Class Analysis by Region report in CMWUse the following procedure to access the Service Class Analysis by Region report in CMW.
Note: This procedure assumes that you have the CMW main window open.
1. From the CMW main window, double-click the Reports icon.Result: The Reports window shows an icon for each CICS report group.
2. Right-click the CICS Service Class Analysis icon and then choose the Service Class Analysis Report by Region from the pop-up menu.Result: The Service Class Analysis by Region report opens showing a list of available CICS regions.
Report fields and definitionsFor a list of report fields and definitions for each field, access the online help for the Service Class Analysis by Region report.
120 OMEGAMON XE for CICSplex User’s Guide, Version 220
Service Class Analysis by Region Report
Accessing service class analysis by region information from CandleNet Portal
To access service class analysis information for a region,
1. From the Navigator, select Service Level Analysis.
2. Right-click a row in the Service Level Analysis table view. Select Service Class Analysis by Region from the pop-up menu to open the workspace. Within this workspace, you can view the Service Class by Region table view and a browser view.
CICS Service Level Analysis Report Group 121
Service Class Analysis by Transaction ID Report
Service Class Analysis by Transaction ID Report
OverviewThe Service Class Analysis by Transaction ID report summarizes performance data for tasks within a service class that completed in the reported time span. Each report row contains CICS Service Level Analysis report data for one transaction ID.
The default analysis includes the following information:
n collection interval end date and time
n transaction ID
n response time goal
n number of completed transactions (by ID)
n performance data, such as average response time, performance index, and percent-of-goal information
Accessing the Service Class Analysis by Transaction ID report in CMW
Use the following procedure to access the Service Class Analysis by Region report in CMW.
Note: This procedure assumes that you have the CMW main window open.
1. From the CMW main window, double-click the Reports icon.Result: The Reports window shows an icon for each CICS report group.
2. Right-click the CICS Service Class Analysis icon and then choose the Service Class Analysis Report by Transaction ID from the pop-up menu.Result: The Service Class Analysis by Transaction ID report opens showing a list of available CICS regions.
Report fields and definitionsFor a list of report fields and definitions for each field, access the online help for the Service Class Analysis by Transaction ID report.
122 OMEGAMON XE for CICSplex User’s Guide, Version 220
Service Class Analysis by Transaction ID Report
Accessing service class analysis by transaction information from CandleNet Portal
To access service class analysis information for a region,
1. From the Navigator, select Service Level Analysis.Right-click a row in the Service Level Analysis table view. Select Service Class Analysis by Transaction from the pop-up menu to open the workspace. Within this workspace, you can view the Service Class by Transaction table view and a browser view.
CICS Service Level Analysis Report Group 123
Service Class Time Distribution Chart
Service Class Time Distribution Chart
OverviewThe Service Class Time Distribution chart reports elapsed time in a pie chart format. This data provides a visual summary of time tasks are required to wait for different types of requests. For example, you can compare the amount of time spent waiting for DL/I task and journal I/O requests.
Accessing the Service Class Time Distribution chart in CMWUse the following procedure to access the Service Class Time Distribution chart in CMW.
Note: This procedure assumes that you have the CMW main window open.
1. From the CMW main window, double-click the Reports icon.Result: The Reports window shows an icon for each CICS report group.
2. Right-click the CICS Service Class Analysis icon and then choose the Elapsed Time Distribution option from the pop-up menu.Result: The Service Class Time Distribution pie chart opens.
124 OMEGAMON XE for CICSplex User’s Guide, Version 220
Service Level Performance
Service Level Performance
OverviewThe Service Level Performance chart reports goal performance in a pie chart format. This data provides a visual summary of how many tasks are performing within the performance goals ranges. For example, you can see what percentage of tasks are in the 50% response time category with those in the 200% category.
Accessing the Service Level Performance chart in CMWUse the following procedure to access the Service Level Performance chart in CMW.
Note: This procedure assumes that you have the CMW main window open.
1. From the CMW main window, double-click the Reports icon.Result: The Reports window shows an icon for each CICS report group.
2. Right-click the CICS Service Class Analysis icon and then choose the Service Level Performance option from the pop-up menu.Result: The Service Level Performance pie chart opens.
CICS Service Level Analysis Report Group 125
Typical Scenarios in CMW
Typical Scenarios in CMW
OverviewThese scenarios describe some ways you can use the reports in the CICS Service Level Analysis report group. To retain report data for more analysis, use the Export feature to save the data to a file.
Note: This topic does not apply to CandleNet Portal.
Scenario 1: Is a CICSplex meeting its expected performance levels?You can evaluate the performance level for a CICSplex in two ways:
n Use the CICS Service Level Analysis report to determine levels. Look at the data in the Performance Index column of determine how well a service class is performing relative to its response time goal.
n Use the CICSplex_Performance_Index product-provided situation to issue an alert whenever the performance index exceeds a specified limit.
Scenario 2: Are any databases causing CICS performance problems?Excessive transaction response time attributed to database performance can potentially cause CICSplex delays. You can monitor database performance in two ways:
n Use the CICS Service Level Analysis report to analyze performance for a specific workload. For a selected service class, you can determine, the percentage of time the service class waited for the following databases:
– Adabas
– Datacom
– DB2
– DLI
– IDMS
– SUPRA
126 OMEGAMON XE for CICSplex User’s Guide, Version 220
Typical Scenarios in CMW
n Use the CICSplex_delay_in_Database product-provided situation to issue an alert whenever the time spent by any active database exceeds a specified limit.
To track the performance over a period of time, update the data in the CICS Connections Analysis report by clicking Refresh Now on the View pull-down menu. This refreshes the report with the most current data available from the Candle Management Server (CMS).
Scenario 3: Is a service class spending excessive time waiting for the DL/I service program?
You can evaluate the DL/I performance for a service class in three ways:
n Use the CICS Service Class Analysis report to determine if the time spent waiting for DL/I is excessive. Look at the data in the % Wait on DLI column of determine current performance.
n Use the CICSplex_CSM5_delay_in_DLI product-provided situation to issue an alert whenever the wait time exceeds a specified limit.
n Display the Elapsed Time Distribution pie chart to shows the amount of time spent waiting for DL/I and other items.
Scenario 4: Are tasks for a particular transaction ID waiting too long for file I/O requests to complete?
You can evaluate the time tasks waiting in a region for a file I/O request in two ways:
n Use the CICS Service Class Analysis by Transaction ID report to view the data in the % Wait on File Control column.
n Use the CICSplex_CSMI_Delay_in_FCP product-provided situation to issue an alert whenever service levels for a transaction group are not met due to file control requests.
CICS Service Level Analysis Report Group 127
Typical Scenarios in CMW
Scenario 5: Are tasks within a region being slowed by function shipping?
You can evaluate the function shipping performance for in two ways:
n Use the CICS Service Class Analysis by Region report to view the data for the percent of time waiting on I/O, redispatch, DL/I, and journal control.
n Use the CICSplex_Function_Ship_Delays product-provided situation to issue an alert whenever time used for function shipping exceeds limits.
128 OMEGAMON XE for CICSplex User’s Guide, Version 220
CICS Shared Temporary StorageReport Group7
IntroductionThis chapter provides detailed information about the reports in the CICS Shared Temporary Storage report group.
Note: In CandleNet Portal, individual workspaces provide table views, which are the equivalent of CMW reports.
Chapter Contents
Introducing the CICS Shared Temporary Storage Reports . . . . . . . . . . . . . . . . . . 131
Overview . . . . . . . . . . . . . . . . . . . . . . . . . . . . . . . . . . . . . . . . . . . . . . . . . . . 131Understanding the CICS Shared Temporary Storage report group . . . . . . . . 131Reminder about sorting and filtering data in CMW . . . . . . . . . . . . . . . . . . . . 131
CICS Shared Temporary Storage Summary Report. . . . . . . . . . . . . . . . . . . . . . . 132Overview . . . . . . . . . . . . . . . . . . . . . . . . . . . . . . . . . . . . . . . . . . . . . . . . . . . 132Accessing the CICS Shared Temporary Storage report . . . . . . . . . . . . . . . . . 132Report fields and definitions . . . . . . . . . . . . . . . . . . . . . . . . . . . . . . . . . . . . . 132Accessing shared temporary storage information from CandleNet Portal . . . 132
CICS Shared Temporary Storage Queues Report . . . . . . . . . . . . . . . . . . . . . . . . 133Overview . . . . . . . . . . . . . . . . . . . . . . . . . . . . . . . . . . . . . . . . . . . . . . . . . . . 133Accessing the CICS Shared Temporary Storage Queues report. . . . . . . . . . . 133Report fields and definitions . . . . . . . . . . . . . . . . . . . . . . . . . . . . . . . . . . . . . 133Accessing shared temporary storage information from CandleNet Portal . . . 133
Typical Scenarios in CMW . . . . . . . . . . . . . . . . . . . . . . . . . . . . . . . . . . . . . . . . . 134Overview . . . . . . . . . . . . . . . . . . . . . . . . . . . . . . . . . . . . . . . . . . . . . . . . . . . 134Scenario 1: What information can you obtain on any shared temporary storage queues?. . . . . . . . . . . . . . . . . . . . . . . . . . . . . . . . . . . . . . 134
CICS Shared Temporary Storage Report Group 129
Scenario 2: What shared temporary storage queues are available to a specific CICS region?. . . . . . . . . . . . . . . . . . . . . . . . . . . . . . . . . . . . . . . 134
130 OMEGAMON XE for CICSplex User’s Guide, Version 220
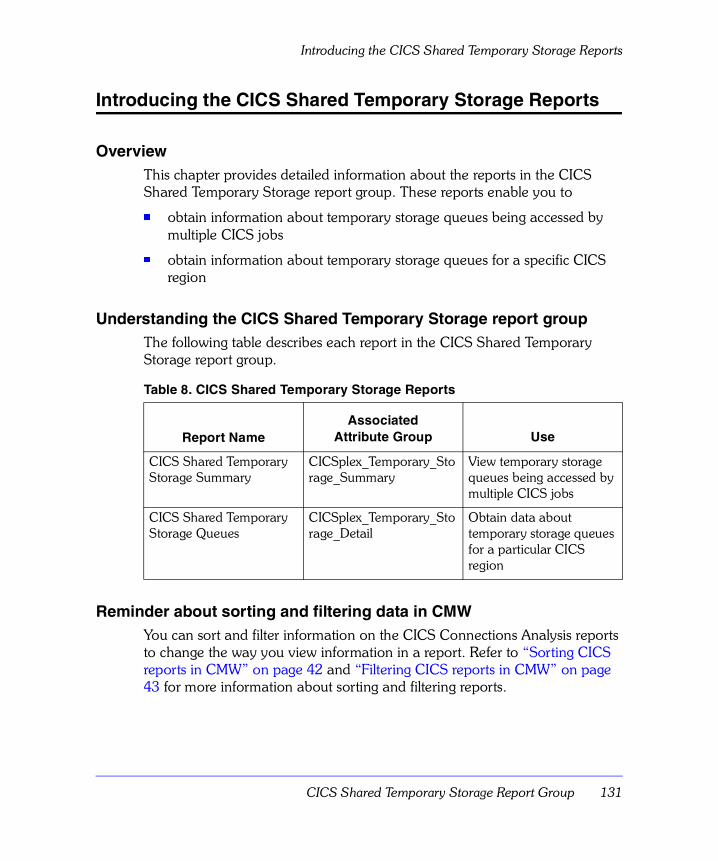
Introducing the CICS Shared Temporary Storage Reports
Introducing the CICS Shared Temporary Storage Reports
OverviewThis chapter provides detailed information about the reports in the CICS Shared Temporary Storage report group. These reports enable you to
n obtain information about temporary storage queues being accessed by multiple CICS jobs
n obtain information about temporary storage queues for a specific CICS region
Understanding the CICS Shared Temporary Storage report groupThe following table describes each report in the CICS Shared Temporary Storage report group.
Reminder about sorting and filtering data in CMWYou can sort and filter information on the CICS Connections Analysis reports to change the way you view information in a report. Refer to “Sorting CICS reports in CMW” on page 42 and “Filtering CICS reports in CMW” on page 43 for more information about sorting and filtering reports.
Table 8. CICS Shared Temporary Storage Reports
Report NameAssociated
Attribute Group Use
CICS Shared Temporary Storage Summary
CICSplex_Temporary_Storage_Summary
View temporary storage queues being accessed by multiple CICS jobs
CICS Shared Temporary Storage Queues
CICSplex_Temporary_Storage_Detail
Obtain data about temporary storage queues for a particular CICS region
CICS Shared Temporary Storage Report Group 131
CICS Shared Temporary Storage Summary Report
CICS Shared Temporary Storage Summary Report
OverviewThe CICS Shared Temporary Storage Summary report provides you with a view of the shared queues accessed by multiple CICS jobs. It
n shows you how many shared pools are defined and connected
n provides information on read and write activity
Accessing the CICS Shared Temporary Storage reportUse the following procedure to access the CICS Shared Temporary Storage Summary report in CMW.
Note: This procedure assumes that you have the CMW main window open.
1. From the CMW main window, double-click the Reports icon.Result: The Reports window shows an icon for each CICS report group.
2. Right-click the CICS Shared Temporary Storage icon and then choose the CICS Shared Temporary Storage Summary Report from the pop-up menu.Result: The CICS Shared Temporary Storage Summary report opens showing a list of available CICS regions.
Report fields and definitionsFor a list of report fields and definitions for each field, access the online help for the CICS Shared Temporary Storage Summary report.
Accessing shared temporary storage information from CandleNet Portal
To access shared temporary storage information,
1. From the Navigator, select Temporary Storage Summary.
2. The Temporary Storage Summary workspace opens. Within this workspace, you can view the Shared Temporary Storage table view, the Shared Pool Status bar chart, and the Shared Temporary Storage I/O bar chart.
132 OMEGAMON XE for CICSplex User’s Guide, Version 220
CICS Shared Temporary Storage Queues Report
CICS Shared Temporary Storage Queues Report
OverviewThe CICS Shared Temporary Storage Queues report displays a list of the shared temporary storage queues available to a particular CICS region. The report shows the size of the items in each queue and identifies the transaction that created the queue.
Accessing the CICS Shared Temporary Storage Queues reportUse the following procedure to access the CICS Shared Temporary Storage Queues report in CMW.
Note: This procedure assumes that you have the CMW main window open.
1. From the CMW main window, double-click the Reports icon.Result: The Reports window shows an icon for each CICS report group.
2. Right-click the CICS Service Class Analysis icon and then choose the CICS Shared Temporary Storage Queues Report from the pop-up menu.Result: The CICS Shared Temporary Storage Queues report opens showing a list of available CICS regions.
Report fields and definitionsFor a list of report fields and definitions for each field, access the online help for the CICS Shared Temporary Storage Queues report.
Accessing shared temporary storage information from CandleNet Portal
To access shared temporary storage information,
1. From the Navigator, select Shared TS Queues.
2. The Shared TS Queues workspace opens. Within this workspace, you can view the Shared Temporary Storage Queues table view and a 3270 terminal session.
CICS Shared Temporary Storage Report Group 133
Typical Scenarios in CMW
Typical Scenarios in CMW
OverviewThis topic presents several scenarios that describe how you can use the reports in the CICS Shared Temporary Storage report group.
Note: This procedures in this topic do not apply to CandleNet Portal.
Scenario 1: What information can you obtain on any shared temporary storage queues?
Use the CICS Shared Temporary Storage Summary report to identify any shared temporary storage queues and view data about them. You can compare the number of defined temporary storage pools with the number of connected pools. You can also evaluate activity from the number of read and write requests that are reported. The report also displays the name of the CICS region and the MVS system ID.
Scenario 2: What shared temporary storage queues are available to a specific CICS region?
Use the CICS Shared Temporary Queues report to identify the temporary storage queues that are available to a particular CICS region and view detailed information about them. This report gives you the ID of the transaction that created the pool and the name of the pool and its standard name and hexadecimal name. You can also determine how much time has passed since the queue was last referenced.
134 OMEGAMON XE for CICSplex User’s Guide, Version 220
CICS Transaction AnalysisReport Group8
IntroductionThis chapter provides detailed information about the reports in the CICS Transaction Analysis report group.
Note: In CandleNet Portal, individual workspaces provide table views, which are the equivalent of CMW reports.
Chapter Contents
Introducing the CICS Transaction Analysis Reports . . . . . . . . . . . . . . . . . . . . . . . 137
Overview . . . . . . . . . . . . . . . . . . . . . . . . . . . . . . . . . . . . . . . . . . . . . . . . . . . 137Understanding the CICS Transaction Analysis report group . . . . . . . . . . . . . 137Reminder about sorting and filtering data in CMW . . . . . . . . . . . . . . . . . . . . 138
CICS Transaction Analysis Report . . . . . . . . . . . . . . . . . . . . . . . . . . . . . . . . . . . . 139Overview . . . . . . . . . . . . . . . . . . . . . . . . . . . . . . . . . . . . . . . . . . . . . . . . . . . 139Accessing the CICS Transaction Analysis report in CMW . . . . . . . . . . . . . . . 139Report fields and definitions . . . . . . . . . . . . . . . . . . . . . . . . . . . . . . . . . . . . . 140Accessing transaction analysis information from CandleNet Portal . . . . . . . . 140
UOW by Region Report . . . . . . . . . . . . . . . . . . . . . . . . . . . . . . . . . . . . . . . . . . . 141Overview . . . . . . . . . . . . . . . . . . . . . . . . . . . . . . . . . . . . . . . . . . . . . . . . . . . 141Accessing the UOW by Region report in CMW . . . . . . . . . . . . . . . . . . . . . . . 141Report fields and definitions . . . . . . . . . . . . . . . . . . . . . . . . . . . . . . . . . . . . . 142Accessing UOW information from CandleNet Portal . . . . . . . . . . . . . . . . . . . 142
UOW by Transaction Report . . . . . . . . . . . . . . . . . . . . . . . . . . . . . . . . . . . . . . . . 143Overview . . . . . . . . . . . . . . . . . . . . . . . . . . . . . . . . . . . . . . . . . . . . . . . . . . . 143Accessing the UOW by Transaction report in CMW . . . . . . . . . . . . . . . . . . . 144Report fields and definitions . . . . . . . . . . . . . . . . . . . . . . . . . . . . . . . . . . . . . 144
CICS Transaction Analysis Report Group 135
Accessing UOW by transaction information from CandleNet Portal . . . . . . . 144Typical Scenarios in CMW . . . . . . . . . . . . . . . . . . . . . . . . . . . . . . . . . . . . . . . . . 145
Overview . . . . . . . . . . . . . . . . . . . . . . . . . . . . . . . . . . . . . . . . . . . . . . . . . . . 145Scenario 1: Are any transactions using too much CPU? . . . . . . . . . . . . . . . . 145Scenario 2: Is the DSNC interface between CICS and DB2 still active?. . . . . 145
136 OMEGAMON XE for CICSplex User’s Guide, Version 220
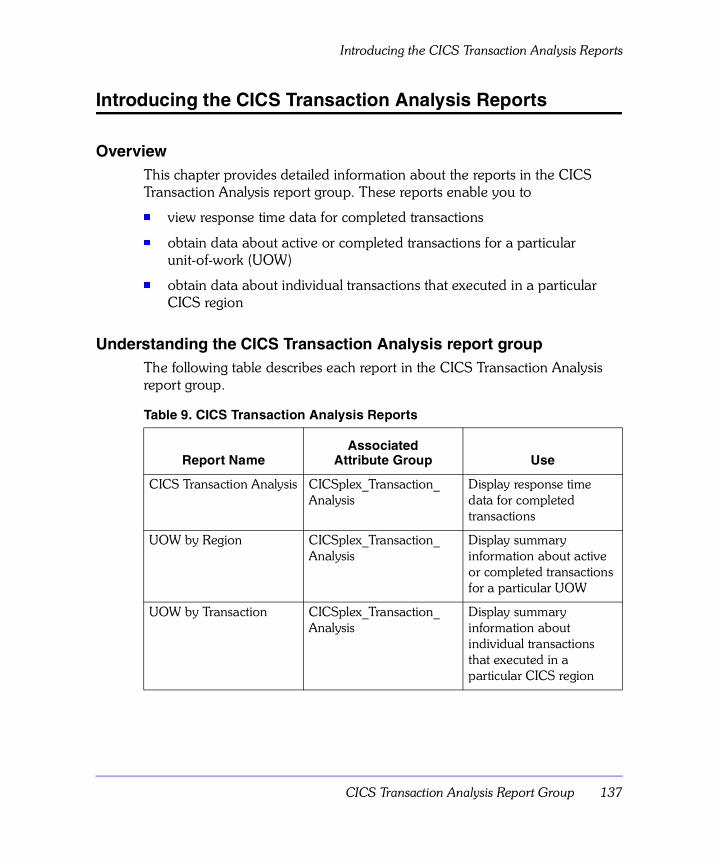
Introducing the CICS Transaction Analysis Reports
Introducing the CICS Transaction Analysis Reports
OverviewThis chapter provides detailed information about the reports in the CICS Transaction Analysis report group. These reports enable you to
n view response time data for completed transactions
n obtain data about active or completed transactions for a particular unit-of-work (UOW)
n obtain data about individual transactions that executed in a particular CICS region
Understanding the CICS Transaction Analysis report groupThe following table describes each report in the CICS Transaction Analysis report group.
Table 9. CICS Transaction Analysis Reports
Report NameAssociated
Attribute Group Use
CICS Transaction Analysis CICSplex_Transaction_Analysis
Display response time data for completed transactions
UOW by Region CICSplex_Transaction_Analysis
Display summary information about active or completed transactions for a particular UOW
UOW by Transaction CICSplex_Transaction_Analysis
Display summary information about individual transactions that executed in a particular CICS region
CICS Transaction Analysis Report Group 137

Introducing the CICS Transaction Analysis Reports
Reminder about sorting and filtering data in CMWYou can sort and filter information on the CICS Connections Analysis reports to change the way you view information in a report. Refer to “Sorting CICS reports in CMW” on page 42 and “Filtering CICS reports in CMW” on page 43 for more information about sorting and filtering reports.
138 OMEGAMON XE for CICSplex User’s Guide, Version 220
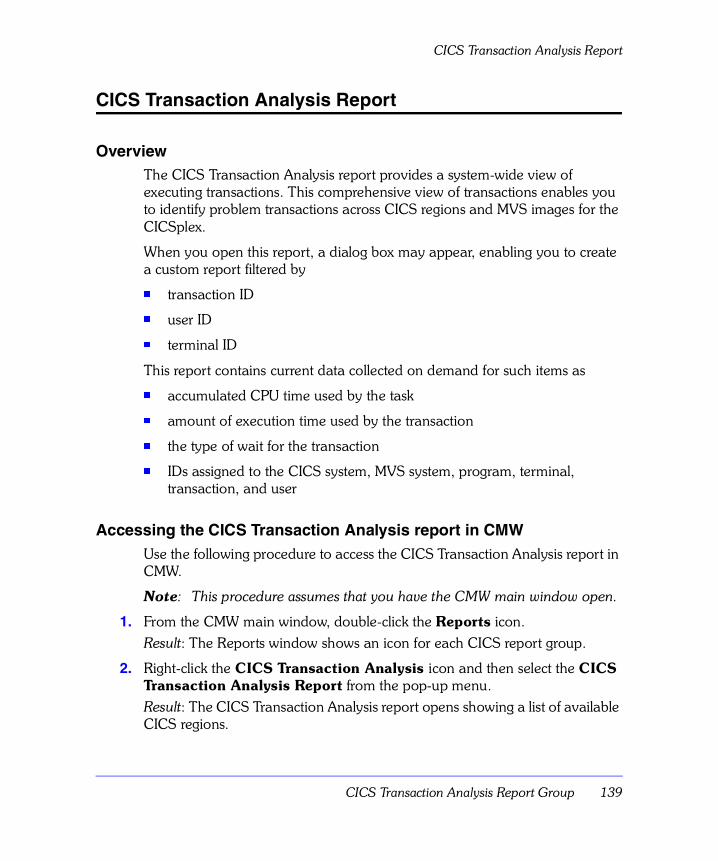
CICS Transaction Analysis Report
CICS Transaction Analysis Report
OverviewThe CICS Transaction Analysis report provides a system-wide view of executing transactions. This comprehensive view of transactions enables you to identify problem transactions across CICS regions and MVS images for the CICSplex.
When you open this report, a dialog box may appear, enabling you to create a custom report filtered by
n transaction ID
n user ID
n terminal ID
This report contains current data collected on demand for such items as
n accumulated CPU time used by the task
n amount of execution time used by the transaction
n the type of wait for the transaction
n IDs assigned to the CICS system, MVS system, program, terminal, transaction, and user
Accessing the CICS Transaction Analysis report in CMWUse the following procedure to access the CICS Transaction Analysis report in CMW.
Note: This procedure assumes that you have the CMW main window open.
1. From the CMW main window, double-click the Reports icon.Result: The Reports window shows an icon for each CICS report group.
2. Right-click the CICS Transaction Analysis icon and then select the CICS Transaction Analysis Report from the pop-up menu.Result: The CICS Transaction Analysis report opens showing a list of available CICS regions.
CICS Transaction Analysis Report Group 139
CICS Transaction Analysis Report
Report fields and definitionsFor a list of report fields and definitions for each field, access the online help for the CICS Transaction Analysis report.
Accessing transaction analysis information from CandleNet PortalTo access transaction analysis information,
1. From the Navigator, select Transaction Analysis.
2. The Transaction Analysis workspace opens. Within this workspace, you can view the Transaction Analysis table view and Transaction Processor Utilization bar chart.
140 OMEGAMON XE for CICSplex User’s Guide, Version 220
UOW by Region Report
UOW by Region Report
OverviewThe UOW by Region report contains a summary of active or completed transactions in a given CICS region for a particular unit-of-work (UOW). It provides the total amount of time transactions spent in various processing states for each CICS region.
You can use this report to
n locate regions responsible for performance degradation
n fine-tune business transactions based on overall response time
It enables you to determine the
n amount of accumulated CPU time for a task
n amount of time the tasks in the unit-of-work spent being dispatched
n number of transactions executed on behalf of the unit-of-work
n amount of elapsed time the task spent waiting for various operations to complete
n version of CICS in use, CICS region job name, and MVS system ID
Accessing the UOW by Region report in CMWUse the following procedure to access the UOW by Region report in CMW.
Note: This procedure assumes that you have the CMW main window open.
1. From the CMW main window, double-click the Reports icon.Result: The Reports window shows an icon for each CICS report group.
2. Right-click the CICS Service Class Analysis icon and then select the UOW by Region Report from the pop-up menu.Result: The UOW by Region report opens showing a list of available CICS regions.
CICS Transaction Analysis Report Group 141
UOW by Region Report
Report fields and definitionsFor a list of report fields and definitions for each field, access the online help for the UOW by Region report.
Accessing UOW information from CandleNet PortalTo access connection analysis information,
1. From the Navigator, select Transaction Analysis.
2. Right-click a row in the Transaction Analysis table view.
3. Select Units of Work from the pop-up menu. The Units of Work workspace opens. Within the this workspace, you can view the Units of Work by Region and Units of Work by Transaction table views.
142 OMEGAMON XE for CICSplex User’s Guide, Version 220
UOW by Transaction Report
UOW by Transaction Report
OverviewThe UOW by Transaction report contains a list of individual transactions (active or done) that executed in a particular CICS region. Each report row indicates the amount of time a transaction spent in various processing states.
You can use this report to
n locate regions responsible for performance degradation
n fine-tune business transactions based on overall response time
The UOW by Transaction report enables you to determine the
n status of a task
n accumulated CPU time for a task
n amount of time the tasks spent being dispatched and redispatched
n total amount of elapsed time a task spent waiting for various operations to complete
n amount of time tasks spent waiting for
– exceptions
– I/O requests
– VSAM temporary storage I/O requests
– VSAM transient data I/O requests
– journal requests
– MRO operations
– user input from the terminal
n version of CICS in use, CICS region job name, and MVS system ID
CICS Transaction Analysis Report Group 143
UOW by Transaction Report
Accessing the UOW by Transaction report in CMWUse the following procedure to access the UOW by Transaction report in CMW.
Note: This procedure assumes that you have the CMW main window open.
1. From the CMW main window, double-click the Reports icon.Result: The Reports window shows an icon for each CICS report group.
2. Right-click the CICS Service Class Analysis icon and then select the UOW by Region Report from the pop-up menu.Result: The UOW by Region report opens showing a list of available CICS regions.
Report fields and definitionsFor a list of report fields and definitions for each field, access the online help for the UOW by Region report.
Accessing UOW by transaction information from CandleNet PortalThe connection summary information is provided in the Units of Work workspace. See page 142 for information.
144 OMEGAMON XE for CICSplex User’s Guide, Version 220
Typical Scenarios in CMW
Typical Scenarios in CMW
OverviewThis topic presents several scenarios that describe how you can use the reports in the CICS Transaction Analysis report group and Candle Command Center for CICS.
Note: The procedures in this topic do not apply to CandleNet Portal.
Scenario 1: Are any transactions using too much CPU?You can determine if a transaction is using too much CPU in two ways:
n Use the CICS Transaction Analysis report to view the data in the CPU Time, transaction ID, and Task # columns. This data reports the amount of CPU being used by a specific transaction.
n Use the CICSRegion_Tran_Elapsed_CPU product-provided situation to issue an alert whenever a given transaction has passed a specified threshold.
Scenario 2: Is the DSNC interface between CICS and DB2 still active?You can determine if the DSNC interface between CICS and DB2 is still active in two ways:
n Use the Unit of Work by Transaction report to view the data in the Transaction ID and Task Status columns. These columns should show that the interface is active.
n Use the CICSRegion_Tran_DSNC_Inactive product-provided situation to issue an alert whenever the DSNC interface between CICS and DB2 becomes inactive.
CICS Transaction Analysis Report Group 145

Typical Scenarios in CMW
146 OMEGAMON XE for CICSplex User’s Guide, Version 220
CICS Topology Report Group
9
IntroductionThis chapter provides detailed information about the reports in the CICS Topology report group.
Note: In CandleNet Portal, individual workspaces provide table views, which are the equivalent of CMW reports.
Chapter Contents
Introducing the CICS Topology Reports for CMW . . . . . . . . . . . . . . . . . . . . . . . . 149
Overview . . . . . . . . . . . . . . . . . . . . . . . . . . . . . . . . . . . . . . . . . . . . . . . . . . . 149Understanding the CICS Topology report group . . . . . . . . . . . . . . . . . . . . . . 149Reminder about sorting and filtering data in CMW . . . . . . . . . . . . . . . . . . . . 149
CICS Topology Report . . . . . . . . . . . . . . . . . . . . . . . . . . . . . . . . . . . . . . . . . . . . 150Overview . . . . . . . . . . . . . . . . . . . . . . . . . . . . . . . . . . . . . . . . . . . . . . . . . . . 150Accessing the CICS Topology report in CMW . . . . . . . . . . . . . . . . . . . . . . . . 151Report fields and definitions . . . . . . . . . . . . . . . . . . . . . . . . . . . . . . . . . . . . . 151
CICS Region Detail Report . . . . . . . . . . . . . . . . . . . . . . . . . . . . . . . . . . . . . . . . . 152Overview . . . . . . . . . . . . . . . . . . . . . . . . . . . . . . . . . . . . . . . . . . . . . . . . . . . 152Accessing the CICS Region Detail report in CMW . . . . . . . . . . . . . . . . . . . . 153Report fields and definitions . . . . . . . . . . . . . . . . . . . . . . . . . . . . . . . . . . . . . 153Accessing region detail information from CandleNet Portal. . . . . . . . . . . . . . 153
CICS Connections Summary Report. . . . . . . . . . . . . . . . . . . . . . . . . . . . . . . . . . 154Overview . . . . . . . . . . . . . . . . . . . . . . . . . . . . . . . . . . . . . . . . . . . . . . . . . . . 154Accessing the CICS Connections Summary report in CMW . . . . . . . . . . . . . 154Report fields and definitions . . . . . . . . . . . . . . . . . . . . . . . . . . . . . . . . . . . . . 154
Typical Scenarios in CMW . . . . . . . . . . . . . . . . . . . . . . . . . . . . . . . . . . . . . . . . . 155
CICS Topology Report Group 147
Overview . . . . . . . . . . . . . . . . . . . . . . . . . . . . . . . . . . . . . . . . . . . . . . . . . . . 155Scenario 1: What are conditions for connected CICS regions? . . . . . . . . . . . 155Scenario 2: What are conditions for a problem CICS region? . . . . . . . . . . . . 155Scenario 3: Are there any connectivity problems for a CICS region?. . . . . . . 155
148 OMEGAMON XE for CICSplex User’s Guide, Version 220
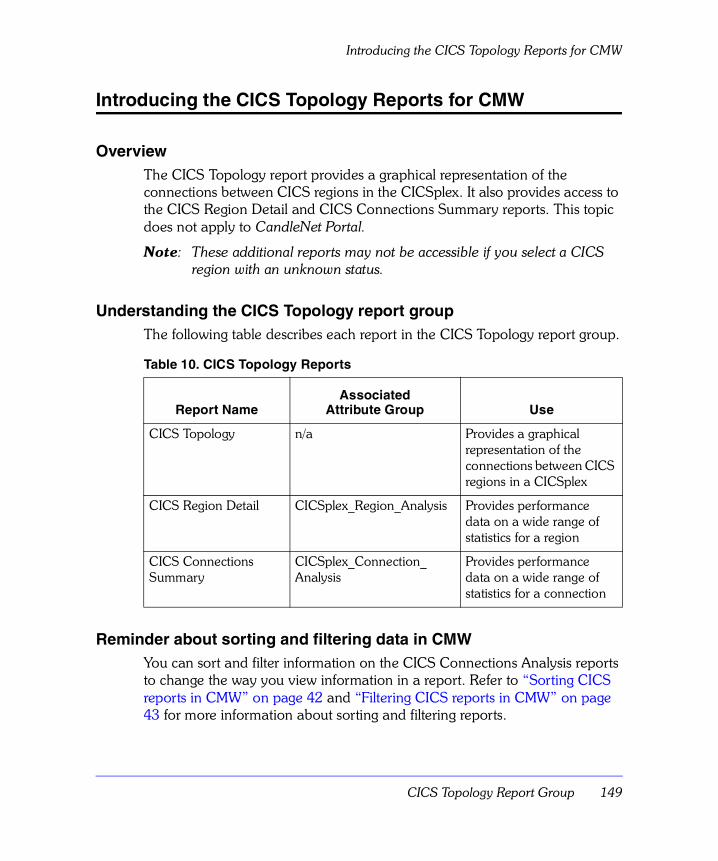
Introducing the CICS Topology Reports for CMW
Introducing the CICS Topology Reports for CMW
OverviewThe CICS Topology report provides a graphical representation of the connections between CICS regions in the CICSplex. It also provides access to the CICS Region Detail and CICS Connections Summary reports. This topic does not apply to CandleNet Portal.
Note: These additional reports may not be accessible if you select a CICS region with an unknown status.
Understanding the CICS Topology report groupThe following table describes each report in the CICS Topology report group.
Reminder about sorting and filtering data in CMWYou can sort and filter information on the CICS Connections Analysis reports to change the way you view information in a report. Refer to “Sorting CICS reports in CMW” on page 42 and “Filtering CICS reports in CMW” on page 43 for more information about sorting and filtering reports.
Table 10. CICS Topology Reports
Report NameAssociated
Attribute Group Use
CICS Topology n/a Provides a graphical representation of the connections between CICS regions in a CICSplex
CICS Region Detail CICSplex_Region_Analysis Provides performance data on a wide range of statistics for a region
CICS Connections Summary
CICSplex_Connection_Analysis
Provides performance data on a wide range of statistics for a connection
CICS Topology Report Group 149
CICS Topology Report
CICS Topology Report
OverviewThe CICS Topology report provides a graphical representation of the connections between CICS regions in the CICSplex. This report is only available in the CMW interface.
If you access this report from a specific region, it displays the connections between the selected region and the CICS regions connected to it.
This report displays those CICS regions that have one or more defined connections. CICS regions that do not have any defined connections are not displayed.
Use this report to
n view the status (Critical, Warning, Normal, or Unknown) of CICS regions
n access a CICS Region Detail or CICS Connections Summary report from a selected CICS region
n zoom to OMEGAMON II for CICS from a selected CICS region
You can use the Overview Window to see a condensed view of CICS region connections should the connections extend past the window frame. This view allows you to see the CICS regions as color-coded status blocks.
Each CICS region in the report, such as a CICS Terminal Owning Region (CICSTOR), CICS Resource Owning Region (CICSROR), or a CICS Application Owning Region (CICSAOR) is identified by its corresponding icon and Origin Node. If the origin node for the region is unknown, then the region is identified by its CICS Region VTAM applid.
150 OMEGAMON XE for CICSplex User’s Guide, Version 220
CICS Topology Report
Accessing the CICS Topology report in CMWUse the following procedure to access the CICS Topology report.
Note: This procedure assumes that you have the CMW main window open.
1. From the CMW main window, double-click the Reports icon.Result: The Reports window shows an icon for each CICS report group.
2. Right-click the CICS Topology icon and choose CICSplex Selection from the pop-up menu.
3. Right-click a CICSplex and choose the CICS Topology Report from the pop-up menu.Result: The CICS Topology report opens.
Report fields and definitionsFor a list of report fields and definitions for each field, access the online help for the CICS Topology report.
CICS Topology Report Group 151
CICS Region Detail Report
CICS Region Detail Report
OverviewThis report lets you review operations for every region of a CICSplex. You can analyze this data to detect system problems before they have a negative impact on operations.
The CICS Region Detail report provides data on more than 30 items within a single region for you to evaluate. For example, it provides information about
n short-on-storage (SOS) conditions for the DSA and EDSA
n the number of tasks that are waiting for buffers and strings
n the number of enqueues for a resource that also has tasks waiting for it
n the numbers of active tasks and total tasks within a region expressed as a percentage of their defined limits
n the percentages of CPU, dynamic storage area (DSA), and extended dynamic storage area (EDSA) being used
n the number of connections, AIDs, and ICEs
n the maximum contiguous free space in the local system queue area (LSQA) and operating system core (OSCOR)
n the number of control intervals (CIs), transient data strings, and temporary storage strings being used by the transient (DFHINTRA) and the auxiliary temporary storage (DFHTEMP) datasets
n status of information for the Web interface and MQ adapter
n the occurrence of system and transaction dumps
n storage violations
n I/O rate and page rate per second
n transactions and program compressions per minute
n VTAM action control block (ACB)
152 OMEGAMON XE for CICSplex User’s Guide, Version 220
CICS Region Detail Report
Accessing the CICS Region Detail report in CMWUse the following procedure to access the CICS Region Detail report.
Note: This procedure assumes that you have the CMW main window open.
1. From the CMW main window, double-click the Reports icon.Result: The Reports window shows an icon for each CICS report group.
2. Right-click the CICS Topology icon and choose CICSplex Selection from the pop-up menu.
3. Right-click a CICSplex and choose the Topology Report from the pop-up menu.
4. Right-click a CICS region and choose the CICS Region Detail Report from the pop-up menu.Result: The CICS Region Detail report opens.
Report fields and definitionsFor a list of report fields and definitions for each field, access the online help the CICS Region Detail report.
Accessing region detail information from CandleNet PortalThe region detail information is provided in the Region Analysis workspace. See “Accessing region analysis information from CandleNet Portal” on page 99.
CICS Topology Report Group 153
CICS Connections Summary Report
CICS Connections Summary Report
OverviewThe CICS Connections Summary report provides information about the MRO and ISC connections between regions in the CICSplex. You can produce a summary report for each terminal owing region (TOR), application owning region (AOR), or resource owning region (ROR) in the CICSplex or connected to another region. Specifically, you can view information about the
n number of links defined, requested, and in use
n number of primary and secondary links and their usage
n number of AIDs queued to the connected system
n type of connection, its name, and its status
Accessing the CICS Connections Summary report in CMWUse the following procedure to access the CICS Connections Summary report in CMW.
Note: This procedure assumes that you have the CMW main window open.
1. From the CMW main window, double-click the Reports icon.Result: The Reports window shows an icon for each CICS report group.
2. Right-click the CICS Topology icon and choose CICSplex Selection from the pop-up menu.
3. Right-click a CICSplex and choose the Topology Report from the pop-up menu.
4. Right-click a CICS region and choose the CICS Connection Summary Report from the pop-up menu.Result: The CICS Connection Summary report opens.
Report fields and definitionsFor a list of report fields and definitions for each field, access the online help for the CICS Connection Summary report.
154 OMEGAMON XE for CICSplex User’s Guide, Version 220
Typical Scenarios in CMW
Typical Scenarios in CMW
OverviewThis topic presents several scenarios that describe how you can use the reports in the CICS Topology report group.
Note: The procedures in this topic do not apply to CandleNet Portal.
Scenario 1: What are conditions for connected CICS regions?Use the CICS Topology report to evaluate conditions for CICS regions that have one or more connections. This report displays the connections between the selected region and the CICS regions connected to it.
This graphical report gives the name of each region and shows a status icon for current conditions. If the connections extend past the window frame, use the Overview Window to see the regions as color-coded status blocks.
Scenario 2: What are conditions for a problem CICS region?Use the CICS Topology report to evaluate conditions for connected CICS regions. To investigate any regions that show a Critical, Warning, or Unknown status, right click the region and choose the CICS Region Detail report from the pop-up menu. Review the information in the report to investigate the source of the problem.
Scenario 3: Are there any connectivity problems for a CICS region?Use the CICS Topology report to evaluate conditions for connected CICS regions. To investigate any regions that show a Critical, Warning, or Unknown status, right click the region and choose the CICS Connections Summary report from the pop-up menu. Review the information in the report to investigate the connections for the region.
CICS Topology Report Group 155
Typical Scenarios in CMW
156 OMEGAMON XE for CICSplex User’s Guide, Version 220
CICS VSAM RLS Lock AnalysisReport Group10
IntroductionThis chapter provides detailed information about the CICS VSAM RLS Lock Analysis report group.
Note: In CandleNet Portal, individual workspaces provide table views, which are the equivalent of CMW reports.
Chapter Contents
Introducing the CICS VSAM RLS Lock Analysis Report Group . . . . . . . . . . . . . . 158
Overview . . . . . . . . . . . . . . . . . . . . . . . . . . . . . . . . . . . . . . . . . . . . . . . . . . . 158CICS VSAM RLS Lock Analysis Report . . . . . . . . . . . . . . . . . . . . . . . . . . . . 158Accessing the CICS VSAM RLS Lock Analysis report in CMW . . . . . . . . . . . 159Report fields and definitions . . . . . . . . . . . . . . . . . . . . . . . . . . . . . . . . . . . . . 159Reminder about sorting and filtering data . . . . . . . . . . . . . . . . . . . . . . . . . . . 159Accessing VSAM RLS information from CandleNet Portal . . . . . . . . . . . . . . 159
Typical Scenarios in CMW . . . . . . . . . . . . . . . . . . . . . . . . . . . . . . . . . . . . . . . . . 160Overview . . . . . . . . . . . . . . . . . . . . . . . . . . . . . . . . . . . . . . . . . . . . . . . . . . . 160Scenario 1: Are specific applications making poor use of resources and possibly degrading performance? . . . . . . . . . . . . . . . . . . . . . . . . . . . . . 160Scenario 2: What are the characteristics of the VSAM files that are holding a lock? . . . . . . . . . . . . . . . . . . . . . . . . . . . . . . . . . . . . . . . . . . . . . . . 160
CICS VSAM RLS Lock Analysis Report Group 157
Introducing the CICS VSAM RLS Lock Analysis Report Group
Introducing the CICS VSAM RLS Lock Analysis Report Group
OverviewThe CICS VSAM RLS Lock Analysis report is the only report in the CICS VSAM RLS Lock Analysis report group.
CICS VSAM RLS Lock Analysis ReportThis report provides you with information about tasks waiting on an RLS resource.
This information includes all CICS tasks that are
n suspended when trying to obtain a record lock
n holding a record
This data enables you to identify applications that are making poor use of resources and possibly degrading system performance.
This report provides you with the
n complete record key for VSAM key-sequenced dataset (KSDS) files
n complete relative byte address for VSAM relative-record dataset (RRDS) files
n record number for VSAM entry-sequenced dataset (ESDS) files
n dataset name and type
n length of the record key
n IDs assigned to the CICS system, MVS system, and transaction
158 OMEGAMON XE for CICSplex User’s Guide, Version 220
Introducing the CICS VSAM RLS Lock Analysis Report Group
Accessing the CICS VSAM RLS Lock Analysis report in CMWUse the following procedure to access the CICS VSAM RLS Lock Analysis report in CMW.
Note: This procedure assumes that you have the CMW main window open.
1. From the CMW main window, double-click the Reports icon.Result: The Reports window shows an icon for each CICS report group.
2. Right-click the CICS VSAM RLS Lock Analysis icon and choose CICSplex Selection from the pop-up menu.
3. Right-click a CICSplex and choose the CICS VSAM RLS Lock Analysis Report from the pop-up menu.Result: The CICS VSAM RLS Lock Analysis report opens.
Report fields and definitionsFor a list of report fields and definitions for each field, access the online help for the CICS VSAM RLS Lock Analysis report.
Reminder about sorting and filtering dataYou can sort and filter information in the CICS VSAM RLS Lock Analysis reports to change the way you view information in a report. Refer to “Sorting CICS reports in CMW” on page 42 and “Filtering CICS reports in CMW” on page 43 for more information about sorting and filtering reports.
Accessing VSAM RLS information from CandleNet PortalTo access VSAM RLS analysis information,
1. From the Navigator, select VSAM RLS Lock Analysis.
2. The VSAM RLS Lock Analysis workspace opens. Within this workspace, you can view the VSAM Record Level Sharing Lock Analysis table view.
CICS VSAM RLS Lock Analysis Report Group 159
Typical Scenarios in CMW
Typical Scenarios in CMW
OverviewThis topic presents several scenarios that describe how you can use the reports in the CICS VSAM RLS Lock Analysis report group.
Note: The procedures in this topic do not apply to CandleNet Portal.
Scenario 1: Are specific applications making poor use of resources and possibly degrading performance?
You can monitor locks on RLS resources in two ways:
n Use the CICS VSAM RLS Lock Analysis report. Review the information in the Task State and Time in Suspend columns to make a general appraisal
n Use the CICSRegion_Held_RLS_Locks product-provided situation to issue an alert whenever it finds a locks being held on RLS resources.
Scenario 2: What are the characteristics of the VSAM files that are holding a lock?
Use the CICS VSAM RLS Lock Analysis report to obtain information about any VSAM files that are holding locks. You can obtain the following information from the report:
n name and type of the dataset
n the complete record key, relative byte address, or record number for the file
n length of the record key
n transaction ID
n MVS system ID
160 OMEGAMON XE for CICSplex User’s Guide, Version 220
Guide to CandleCustomer SupportA
IntroductionCandle Corporation is committed to producing top-quality software products and services. To assist you with making effective use of our products in your business environment, Candle is also committed to providing easy-to-use, responsive customer support.
Precision, speed, availability, predictability—these terms describe our products and Customer Support services.
Included in this Guide to Candle Customer Support is information about the following:
Base Maintenance Plan . . . . . . . . . . . . . . . . . . . . . . . . . . . . . . . . . . . . . 162– Telephone Support– eSupport– Description of Severity Levels– Service-level objectives– Recording and monitoring calls for quality purposes– Customer Support Escalations– Above and Beyond
Enhanced Support Services . . . . . . . . . . . . . . . . . . . . . . . . . . . . . . . . . . 166– Assigned Support Center Representative (ASCR)– Maintenance Assessment Services (MAS)– Multi-Services Manager (MSM)
Customer Support Contact Information . . . . . . . . . . . . . . . . . . . . . . . . . 168– Link to Worldwide Support Telephone and E-mail information
Guide to Candle Customer Support 161
Base Maintenance Plan
Base Maintenance Plan
OverviewCandle offers a comprehensive Base Maintenance Plan to ensure that you realize the greatest value possible from your Candle software investments. We have more than 200 technicians providing support worldwide, committed to being responsive and to providing expedient resolutions to support requests. Technicians are available worldwide at all times during the local business day. In the event of an after-hours or weekend emergency, our computerized call management and forwarding system will ensure that a technician responds to Severity One situations within one hour. For customers outside of North America, after-hours and weekend support is provided in English language only by Candle Customer Support technicians located in the United States.
Telephone supportCandle provides consistently reliable levels of service—thanks to our worldwide support network of dedicated experts trained for specific products and operating systems. You will always work with a professional who truly understands your problem.
We use an online interactive problem management system to log and track all customer-reported support requests. We give your support request immediate attention by routing the issue to the appropriate technical resource, regardless of geographic location.
Level 0 Support is where your call to Candle Customer Support is first handled. Your support request is recorded in our problem management system, then transferred to the appropriate Level 1 support team. We provide Level 0 manual interaction with our customers because we support more than 170 products. We feel our customers would prefer personal interaction to a complex VRU or IVR selection menu.
Level 1 Support is the service provided for initial support requests. Our Level 1 team offers problem determination assistance, problem analysis, problem resolutions, installation assistance, and preventative and corrective service information. They also provide product usage assistance.
162 OMEGAMON XE for CICSplex User’s Guide, Version 220
Base Maintenance Plan
Level 2 Support is engaged if Level 1 cannot provide a resolution to your problem. Our Level 2 technicians are equipped to analyze and reproduce errors or to determine that an error is not reproducible. Problems that cannot be resolved by Level 2 are escalated to Candle’s Level 3 R&D support team.
Level 3 Support is engaged if a problem is identified in Candle product code. At Level 3, efforts are made to provide error correction, circumvention or notification that a correction or circumvention is not available. Level 3 support provides available maintenance modifications and maintenance delivery to correct appropriate documentation or product code errors.
eSupportIn order to facilitate the support process, Candle also provides eSupport, an electronic full-service information and customer support facility, via the World Wide Web at www.candle.com/support/. eSupport allows you to open a new service request and update existing service requests, as well as update information in your customer profile. New and updated service requests are queued to a support technician for immediate action. And we can respond to your request electronically or by telephone—it is your choice.
eSupport also contains a continually expanding knowledge base that customers can tap into at any time for self-service access to product and maintenance information.
The Candle Web Site and eSupport can be accessed 24 hours a day, 7 days a week by using your authorized Candle user ID and password.
Description of Candle severity levelsResponses to customer-reported product issues and usage questions are prioritized within Candle according to Severity Code assignment. Customers set their own Severity Levels when contacting a support center. This ensures that we respond according to your individual business requirements.
Severity 1 Crisis
A crisis affects your ability to conduct business, and no procedural workaround exists. The system or application may be down.
Severity 2High
A high-impact problem indicates significant business effect to you. The program is usable but severely limited.
Guide to Candle Customer Support 163
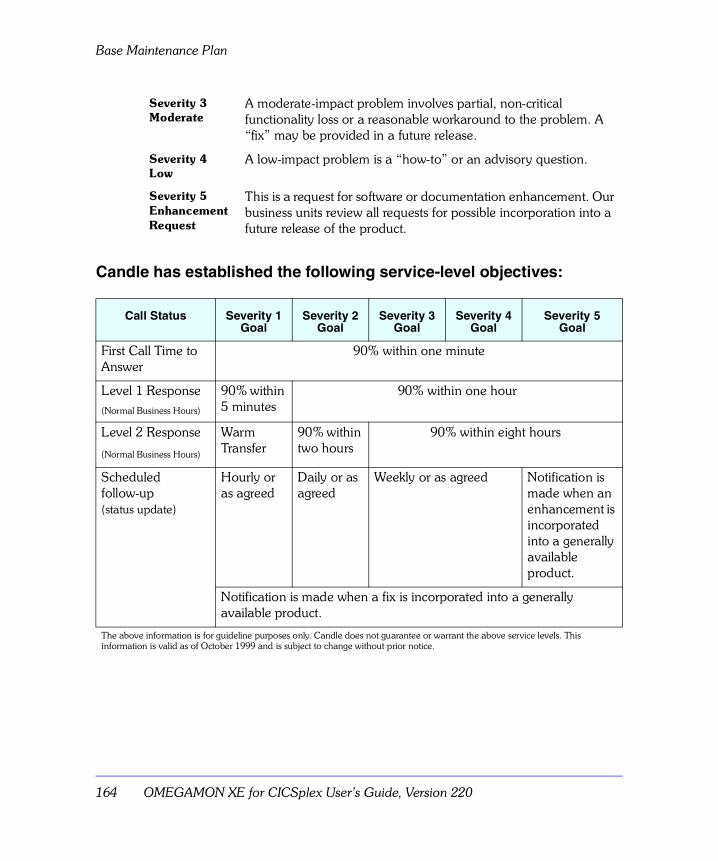
Base Maintenance Plan
Candle has established the following service-level objectives:
Severity 3Moderate
A moderate-impact problem involves partial, non-critical functionality loss or a reasonable workaround to the problem. A “fix” may be provided in a future release.
Severity 4Low
A low-impact problem is a “how-to” or an advisory question.
Severity 5Enhancement Request
This is a request for software or documentation enhancement. Our business units review all requests for possible incorporation into a future release of the product.
Call Status Severity 1 Goal
Severity 2 Goal
Severity 3 Goal
Severity 4 Goal
Severity 5Goal
First Call Time to Answer
90% within one minute
Level 1 Response(Normal Business Hours)
90% within 5 minutes
90% within one hour
Level 2 Response
(Normal Business Hours)
Warm Transfer
90% within two hours
90% within eight hours
Scheduled follow-up (status update)
Hourly or as agreed
Daily or as agreed
Weekly or as agreed Notification is made when an enhancement is incorporated into a generally available product.
Notification is made when a fix is incorporated into a generally available product.
The above information is for guideline purposes only. Candle does not guarantee or warrant the above service levels. This information is valid as of October 1999 and is subject to change without prior notice.
164 OMEGAMON XE for CICSplex User’s Guide, Version 220
Base Maintenance Plan
Recording and Monitoring Calls for Quality PurposesCandle is committed to customer satisfaction. To ensure that our customers receive high levels of service, quality and professionalism, we’ll monitor and possibly record incoming and outgoing Customer Support calls. The information gleaned from these calls will help us serve you better. If you prefer that your telephone call with Candle Customer Support in North America not be monitored or recorded, please advise the representative when you call us at (800) 328-1811 or (310) 535-3636.
Customer Support EscalationsCandle Customer Support is committed to achieving high satisfaction ratings from our customers. However, we realize that you may occasionally have support issues that need to be escalated to Candle management. In those instances, we offer the following simple escalation procedure:
If you experience dissatisfaction with Candle Customer Support at any time, please escalate your concern by calling the Candle support location closest to you. Ask to speak to a Customer Support manager. During standard business hours, a Customer Support manager will be available to talk with you or will return your call. If you elect to hold for a manager, you will be connected with someone as soon as possible. If you wish a return call, please tell the Candle representative coordinating your call when you will be available. After contacting you, the Customer Support manager will develop an action plan to resolve your issue. All escalations or complaints received about support issues are logged and tracked to ensure responsiveness and closure.
Above and BeyondWhat differentiates Candle’s support services from our competitors? We go the extra mile by offering the following as part of our Base Maintenance Plan:
n Unlimited multi-language defect, installation and operations supportn eSupport using the World Wide Webn Regularly scheduled product updates and maintenance provided at no
additional chargen Over 200 specialized technicians providing expert support for your
Candle products
Guide to Candle Customer Support 165
Enhanced Support Services
Enhanced Support Services
OverviewOur Base Maintenance Plan provides a high level of software support in a packaged offering. However, in addition to this plan, we have additional fee-based support services to meet unique customer needs.
The following are some examples of our added-value support services:
n Assigned Support Center Representative Services (ASCR)
– An assigned focal point for managing support escalation needs– Proactive notification of available software fixes– Proactive notification of product version updates– Weekly conference calls with your ASCR to review active problem
records– Monthly performance reviews of Candle Customer Support service
levels– Optional on-site visits (extra charges may apply)
n Maintenance Assessment Service (MAS)
– On-site assessment services– Advice about product maintenance and implementation– Training your staff to develop efficient and focused procedures to
reduce overall cost of ownership of your Candle software products– Analysis of your Candle product environment: versions, updates,
code correction history, incident history and product configurations– Reviews to ensure that purchased Candle products and solutions are
used effectively
n Multi-Services Manager (MSM)
Multi-Services Manager provides highly valued services to customers requiring on-site full time expertise to complement their technical resources.
– Dedicated on-site Candle resource (6 months or one year) at your site to help ensure maximum use and effectiveness of your Candle products
166 OMEGAMON XE for CICSplex User’s Guide, Version 220
Enhanced Support Services
– Liaison for all Candle product support activities, coordination and assistance with implementation of all product updates and maintenance releases
– Works with your staff to understand business needs and systems requirements
– Possesses technical and systems management skills to enhance your staff’s knowledge and expertise
– Other projects as defined in Statement of Work for MSM services
Guide to Candle Customer Support 167
Customer Support Contact Information
Customer Support Contact Information
Link to Worldwide Support Telephone and e-mail InformationTo contact Customer Support, the current list of telephone numbers and e-mail addresses can be found on the Candle Web site, www.candle.com/support/.
Select Support Contacts from the list on the left of the page.
168 OMEGAMON XE for CICSplex User’s Guide, Version 220
Index
I
AAdobe portable document format 13Adobe reader 14AOR 30ASCR
assigned support center representative 166
assigned support center representativeASCR 166
asynchronous processing 34, 35attributes 37attributes, definition 25Auto node generation 61auto node generation, manual 61available 134
BBusy TCBs themometer guage 104
CCandle Command Center
definition 18–19Candle Management Server 19Candle Management Workstation 24
benefits 19CandleNet Portal
working with workspaces 44CandleNet Portal server 19
chartsCICS Region Summary 100
CICS Connections Analysis report 81CICS Connections Analysis report
group 77–90CICS Connections Region report group
scenarios 109–112CICS Connections Summary report 83, 154CICS MQ Connection Details report 103CICS Region Analysis report 96CICS Region Analysis report group 91–112CICS Region Detail report 152CICS Region Summary chart 100CICS Service Class Analysis report 119CICS Service Level Analysis report 117CICS Service Level Analysis report
group 113–128CICS Shared Temporary Storage Queues
report 133CICS Shared Temporary Storage report
group 129–134scenarios 134
CICS Shared Temporary Storage Summary report 132
CICS Storage Allocation bar chart 102CICS Storage Summary report 101CICS Topology report group 147–155
scenarios 155CICS Transaction Analysis report 139CICS Transaction Analysis report group 135
Index 169
CICS VSAM Analysis report 105CICS VSAM RLS Lock Analysis report 157–
160CICSplex components 30, 31CICSplex object, set up 59CICSplex performance, monitoring 64CICSplex region, set up 60CICSplex, set up 58CICSRegion 160CICSRegion_Held_RLS_Locks
product-provided situation 160communication methods 32components of CCC 18Connection Analysis workspace 82Connection Summary workspace
See Connection Analysis workspaceconnections 34CP/SM 65CPU Utilization needle gauage 99creating multiple workspaces 48customer service
telephone support 162customer support
base maintenance plan 162contact information 168enhanced support services 166eSupport 163severity levels 163
Ddistributed transaction processing 34, 35DSA 102DSA Utilization needle gauage 102DTP 35
Eedit a workspace 47EDSA Utilization needle gauage 102eSupport
customer support 163event
investigating 49
Event workspace, opening 49
Ffiltering reports 43function shipping 34, 35
Iinstallation 24intersystem communication 81investigating an event 49ISC 32, 81
LLink Summary report 85
scenarios 89, 90Link Summary workspace 86linking workspaces 48links 34
Mmaintenance assessment service
MAS 166MAS
maintenance assessment service 166Message Queuing Analysis workspace 104Message Queuing Requests bar chart 104Minimum Tasks Percent needle gauage 99monitoring agents 19monitoring facilities 24MQ connection 103MRO 32, 81MSM
multi-services manager 166multiregion operation 81multi-services manager
MSM 166
Nnavigating in a report group 74, 75
170 OMEGAMON XE for CICSplex User’s Guide, Version 220
OOMEGAMON II for CICS, zoom to 39OMEGAMON XE for CICSplex
introduction 27–39OMEGAMON XE for CICSplex report
groups, introduction 67–75OMEGAMON XE for CICSplex reports
general use 40–43OMEGAMON XE for CICSplex reports,
overview 38open a workspace 45operating system support 25
PPDF documents 14performance 64planning 24printing problems 13, 14product features 25product-provided situation, accessing 56product-provided situations
CICSRegion_Held_RLS_Locks 160product-provided situations, definition 25properties
defining for a workspace 48
Rrefresh a workspace 45refreshing reports 41Region Analysis workspace 99region object
changing to ROR or TOR 62Regions Sharing a VSAM File report 107reload a workspace 45report groups
CICS Connections Analysis 77–90CICS Service Level Analysis 113–128CICS Shared Temporary Storage 129–
134CICS Transaction Analysis 135descriptions 68
reportsCICS Connections Analysis 81CICS Connections Summary 83, 154CICS MQ Connection Details 103CICS Region Analysis 96CICS Region Detail 152CICS Service Class Analysis 119CICS Service Level Analysis 117CICS Shared Temporary Storage
Queue 133CICS Shared Temporary Storage
Summary 132CICS Storage Summary 101CICS Topology report 147–155CICS Transaction Analysis 139CICS VSAM Analysis 105CICS VSAM RLS Lock Analysis 157–160Link Summary 85Regions Sharing a VSAM File 107Service Class Analysis by Region 120Service Class Analysis by Transaction
ID 122UOW by Region 141UOW by Transaction 143
reports groupsCICS Region Analysis 91–112
reports, filtering 43reports, function 25reports, refreshing 41ROR 30
Ssaving a new workspace 48saving a workspace 47scenarios
CICS Connections Region report group 109–112
CICS Service Level Analysis group 126, 128
CICS Shared Temporary Storage report group 134
CICS Topology report group 155
Index 171
CICS VSAM RLS Lock Analysis report 160
Link Summary report 89, 90server, CNP 19Service Class Analysis by Region report 120Service Class Analysis by Transaction ID
report 122Service Class by Region workspace 121,
123Service Level Analysis workspace 118severity levels
customer support 163Shared TS Queues workspace 133SOS condition 101stop a workspace 46suspend a workspace 46
Ttelephone support
customer service 162Temporary Storage Summary
workspace 132TOR 30Transaction Analysis workspace 140Transaction Processor Utilization bar
chart 140transaction routing 34Transation Rate plot chart 99
UUnits of Work workspace 142UOW 142UOW by Region report 141UOW by Transaction report 143user interface 25
VVSAM Analysis workspace 106VSAM datasets 93VSAM RLS Lock Analysis workspace 159
VSAM String Utilization bar char 106VTAM 35
WWeb interface 109Windows 2000 25Windows 95 25Windows NT 25workspace
creating multiple 48defining properties 48linking 48new 48opening 45refreshing 45reload 45saving 47saving a new 48stop 46suspend 46
workspace, editing 47workspace, Event
opening 49workspaces
Connection Analysis 82Link Summary 86Message Queuing Analysis 104Region Analysis 99Service Class by Region 121, 123Service Level Analysis 118Shared TS Queues 133Temporary Shared Storage 132Transaction Analysis 140Units of Work 142VSAM Analysis 106VSAM RLS Lock Analysis 159
Zzoom feature 39
172 OMEGAMON XE for CICSplex User’s Guide, Version 220


