50
OMV Aktiengesellschaft Annual Report 2005 Move & More.
OMV Aktiengesellschaft
Annual Report 2005
Move & More.

Move & More
OMV 2005 |1
Dear stockholders,
We have much pleasure in presenting you our Annual Report of OMV Aktiengesellschaft for 2005.
Highlights 2005 2
Report of the Supervisory Board 3
Executive Board 5
Statement of the Chairman of the Executive Board 6
50 years of OMV 8
OMV stock and bonds 9
Directors´ report of OMV Aktiengesellschaft 12
Annual accounts of OMV Aktiengesellschaft 25
List of investments 47
Auditors´ opinion 48
Contacts 49
Through profitable growth and the consolidation of our clear leadership in the central European oil and gas industry, OMV confirmed its position as a strong European company. Three years ahead of schedule, we have already achieved our target of doubling the size of the Company. Because of this growth, we now operate across many national boundaries. The successful implementation of our growth strategy, together with a favorable market environment has produced another record financial performance.
This strong position is reflected in facts and figures but is underpinned by the values under which we operate. Values have to be put into practice in order to have a true meaning. We adhere to them in all our daily activities and they provide the energy behind our successful growth strategy and our market position in Exploration and Production, Refining and Marketing as well as Gas.
Wolfgang Ruttenstorfer

Highlights 2005
OMV 2005 |2
January
OMV’s first oil discovery in Iran
Five new exploration blocks offshore Faroe Islands awarded
February
Portfolio streamlining through sale of gasfields in Australia
March
Exploration success in the UK North Sea
Contracts of OMV Executive Board extended until 2010
April
Large Austrian gas field discovery
May
Sale of a 50% stake in OMV’s Chemical business (AMI) to IPIC
Annual General Meeting approved dividend of EUR 4.4 per share (EUR 0.44 after stock split)
OMV and Gazexport sign new gas transport contract
June
Additional capacities for the Trans-Austria gas pipeline agreed
Joint venture agreement signed for the Nabucco pipeline project
OMV and IPIC acquire 100% of Borealis
July
Stock split by a ratio of 1:10
August
Significant oil field discovered in Yemen
Sale of E&P assets in Qatar
September
4 new exploration licenses awarded in the West of Shetland area
Oil and gas discovery in UK North Sea
Sale of E&P assets in Ecuador
October
Acquisition of 70 Aral filling stations in the Czech Republic
Divestment of the geotextile business Polyfelt
Capital Markets Day in Bucharest: OMV sets new targets for further growth to 2010
November
Sixth exploration success in Libya in NC 186
Successful appraisal of oil discovery in Yemen
Maari oil field development offshore New Zealand approved
December
Further significant gas discovery in Austria
Report of the Supervisory Board
OMV 2005 |3
Dear Stockholders,
The 2005 financial year was as exciting as it was exceptional for the OMV Group. From the outset, the key question was how long Petrom’s transformation would take before it will be possible to extract maximum value from the Group. The personal commitment and professionalism shown by the Executive Board and the workforce reaffirmed that the investment in Petrom had been an excellent strategic decision and one which has considerably increased the value of both companies.
The highly favorable business environment undoubtedly contributed to the remarkable results reported for the year. However, neither OMV’s domestic and international exploration success nor increased market presence are a result of external factors. OMV’s success is primarily due to a great deal of hard work and commitment within the Group. An important decision of the Personnel and Presidential Committee, and subsequently the full Supervisory Board in 2005 was to take timely action in maintaining the continuity of the OMV Executive Board in light of the Group’s successful expansion strategy. During the initial meeting, Executive Board members’ contracts were extended until March 31, 2010, in order to provide the necessary stability.
Furthermore, I should like to outline the directors’ compensation, as required by the new Austrian Code of Corporate Governance. This is set at a competitive level, and has a strong performance related component. Market orientation is ensured by regular benchmarking against directors’ payment at relevant Austrian industrial companies and the European oil market as a whole. The correlation with performance consists of a long and a short-term incentive plan. Short-term incentives are derived from bonus agreements, largely based on earnings, profitability and growth, but can also include special projects forming part of the Group’s growth strategy. Longterm incentives consist of stock option plans of which the design is customary for firms of comparable size. Eligibility for an occupational pension depends on reaching a stipulated age – usually the statutory retirement age – although early retirement is possible, subject to reductions in benefits. The rules governing the amounts of directors’ pensions are comparable to those applied to other employees. The severance pay arrangements applicable on termination of a director’s contract are in accordance with the previous legal situation in Austria; there are no other entitlements.
The work performed by the Supervisory Board has been very wide ranging, as its supervisory and
advisory role is particularly vital during phases of rapid expansion. There were seven Supervisory Board meetings all together, and two meetings of each committee. At the Accounts Committee meetings, important aspects of the annual audit were discussed with the auditors during the audit process. The committee also discussed the reserves estimates and the internal audit report. A Project Committee meeting was devoted to the restructuring of the petrochemical operations, and another one to the work programs at Petrom. Executive Board members’ extensions and compensation were dealt with by the Personnel and Presidential Committee, which also took a systematic approach to succession planning at a meeting in December. The Supervisory Board attached importance to overseeing the transformation process at Petrom on an ongoing basis. For this reason the Board meeting on June 27 was held in Bucharest, giving us a chance to speak to the management there, and to gain an impression of Petrom’s assets and operations.
One of the Supervisory Board’s central tasks is discussing and critically examining OMV’s strategy with the Executive Board. We unanimously approved the new 2010 strategy, and fully support the drive for growth as the best means of ensuring that stockholders enjoy good long-term returns. During the Audit Committee meetings particularly close attention was paid to whether the necessary processes and appropriate risk management tools were in place, and if the proposals put forward in the auditor’s management letter had been implemented.
The controlling function of the Supervisory Board depends on transparency and independence. The Board has therefore adopted independence rules based on EU Directive 2003/51/EC and the 2006 Austrian Code of Corporate Governance, which is posted on the OMV corporate website. All members of the Supervisory Board have declared themselves to be independent directors. In the interests of maximum transparency, the compensation of each member of the Board is submitted for resolution of the Annual General Meeting each year, and is published.
Over the past few years, OMV has made major progress in terms of growth, market capitalization and profitability. I am confident that the conditions have been created for holding to this course and mastering new challenges. Following thorough examination and discussions with the auditors at the Audit Committee and plenary meetings, the Supervisory Board approved the Directors’ report, prepared in accordance with section 127 of the Stock Corporation Act, and the company financial statements for 2005 which were thereby adopted

Report of the Supervisory Board
OMV 2005 |4
under section 125(2) of the Act. The Board has also approved the consolidated financial statements and the Group Directors’ report. The Supervisory Board has accepted the Executive Board’s proposal to pay a dividend of EUR 0.90 per share and to carry forward the remaining EUR 335,069 to a new account.
Vienna, March 21, 2006
Rainer Wieltsch Chairman of the Supervisory Board
Supervisory board
Rainer Wieltsch (Chairman)First election at the AGM on May 24, 2002 Member of the ÖIAG Management Board, Member of the following Supervisory Boards: Austrian Airlines Österreichische Luftverkehrs AG (Chairman), Telekom Austria AG and voestalpine AG
Mohamed Nassar Al Khaily (Deputy Chairman) First election at the AGM on June 7, 1995 Managing Director of IPIC, Member of the following Supervisory Board: Companía Espanola de Petróleos S.A.
Peter Michaelis (Deputy Chairman) First election at the AGM on May 23, 2001 Spokesman of the ÖIAG Management Board, Member of the following Supervisory Boards: Austrian Airlines Österreichische Luftverkehrs AG, and Telekom Austria AG (Chairman)
Murtadha Mohammed Al Hashemi
Division Manager/Finance, IPIC First election at the AGM on May 18, 1999 Member of the following Supervisory Board: Companía Espanola de Petróleos S.A.
Helmut Draxler
First election at the AGM on October 16, 1990 Chairman of the Management Board of RHI AG, Member of the following Supervisory Board: Didier-Werke AG (Chairman)
Wolfram Littich
First election at the AGM on May 23, 2001 Chairman of the Board of Management of Allianz Elementar Versicherungs-AG
Gerhard Mayr
First election at the AGM on May 24, 2002 Member of the following Supervisory Boards: Bank Austria Creditanstalt AG and UCB S.A.
Herbert Stepic
First election at the AGM on May 18, 2004 Deputy CEO of Raiffeisen Zentralbank Österreich AG
Herbert Werner
First election at the AGM on June 4, 1996 Member of the following Supervisory Boards: Innstadt Brauerei AG (Chairman) and Ottakringer Brauerei AG
Norbert Zimmermann
First election at the AGM on May 23, 2001 Chairman of the Management Board of Berndorf AG Member of the following Supervisory Boards: Schoeller Bleckmann Oilfield Equipment AG (Chairman) and Oberbank AG
Delegates of the Group Works Council:
Leopold Abraham, Wolfgang Baumann,
Franz Kaba, Hugo Pleckinger until December 13, 2005,Wolfgang Weigert since December 13, 2005, Ferdinand
Nemesch
Personnel and Presidential Committee
Wieltsch, Al Khaily, Michaelis, Al Hashemi since March
24, 2005, Abraham, Baumann
Audit Committee
Wieltsch, Al Khaily, Michaelis, Littich, Draxler since
March 2, 2005, Werner since March 2, 2005, Abraham, Baumann, Nemesch since March 2, 2005
Strategy and Project Committee
Wieltsch, Al Khaily, Michaelis, Al Hashemi, Littich, Zimmermann, Abraham, Kaba, Nemesch
The elected members’ terms run until the 2009 Annual General Meeting (AGM). Pursuant to Rule 54 Austrian Corporate Governance Code, Draxler, Littich, Mayr, Stepic, Werner and Zimmermann have made declarations stating that they were independent of major shareholders in the Company in 2005 and up to the time of those declarations

Executive Board
OMV 2005 |5
(from left to right: Gerhard Roiss, Helmut Langanger, Wolfgang Ruttenstorfer, David C. Davies)
Wolfgang Ruttenstorfer (*1950) As of January 1, 2002 Chairman and Chief Executive Officer; responsible for Gas and Chemicals. He began his career with OMV after graduating from the Vienna University of Economics and Business Administration in 1976, going on to head the planning and financial control, corporate development and marketing functions, among others. He was a member of the Executive Board from 1992 to 1997. From 1997 to 1999 he was Austria´s Deputy Finance Minister. In January 2000 he returned to the OMV Group as Deputy Chief Executive Officer, assuming responsibility for Finance and the Gas segment.
David C. Davies (*1955) As of April 1, 2002 Chief Financial Officer. He graduated from the University of Liverpool (UK) in Economics in 1978 and started his career as a chartered accountant. He then held positions in international companies in the beverage, food and health industry. Before joining OMV he had been finance director of a number of UK companies.
Gerhard Roiss (*1952) As of January 1, 2002 Deputy Chairman; responsible for Refining and Marketing including petrochemicals. His business education at Vienna, Linz and Stanford (USA) prepared him for managerial responsibilities at various companies in the consumer goods industry. In 1990 he started as head of OMV’s Group marketing department. In the same year he was appointed to the board of PCD Polymere GmbH. He moved across to the OMV Executive Board in 1997. Until the end of 2001 he was responsible for Exploration and Production, and for the Plastics operations.
Helmut Langanger (*1950) As of January 1, 2002 responsible for Exploration and Production. He complemented his education at the Mining University in Leoben with a degree in economics in Vienna. In 1974 he began his career with OMV. He was appointed Senior Vice President for Exploration and Production in 1992, and in this position he played a key role in building up the Group’s international E&P portfolio.
The terms of office of all Board members’ run until the end of March 2010. Directorships in companies that do not form part of the OMV Group and in which OMV does not hold equity interests (section 228 (1) Austrian Commercial Code): Ruttenstorfer (member of the Supervisory Board of Wiener Börse AG); Langanger (member of the Supervisory Board of Schoeller-Bleckmann Oilfield Equipment AG).
Statement of the Chairman of the Executive Board
OMV 2005 |6
Ladies and Gentlemen,
2005 was an important year for OMV and its shareholders. Today, OMV’s position as the leading integrated oil and gas group in Central Europe is undisputed. Not only have we doubled the size of the Group three years earlier than planned, but our rapid expansion has been highly profitable, bringing benefits to our owners through substantial value growth.
Number 1 in Central Europe
Your OMV stock has more than doubled in value in 2005 – a year in which OMV once again posted record results. EBIT doubled to almost EUR 2 bn, free cash flow multiplied fivefold to EUR 774 mn, and at the same time we have eliminated our Group borrowings. This strong improvement in earnings was reflected in an outstanding stock performance over the year. Our stock price significantly outperformed the entire oil and gas industry, rising by 123%.
Over the past three years, the market capitalization – or in other words, the value – of the Company you have invested in, has risen more than sixfold, from EUR 2.5 bn to EUR 15 bn. Aside from your rewards from this value growth, we would like you to participate in these excellent annual results in the form of a 105% dividend increase. We are therefore proposing a dividend of EUR 0.90 per share.
Macroeconomic conditions naturally played a decisive role in these record-breaking profits, which are explained in detail in this report. However, it was only by pursuing our growth strategy that we were able to fully exploit this favorable environment.
I am particularly proud of our people. Without their outstanding motivation and complete commitment we would not have been able to hit our targets so fast. My thanks go to each and everyone of them!
Playing in a new league, thanks to Petrom
The substantial contribution from Petrom which delivered EBIT before special items of EUR 805 mn, played a key role in this year’s excellent results. This undoubtedly reflected the success of the restructuring program underway in Romania. Petrom has opened up new
perspectives for us. Making the most of its potential remains the central task as we move ahead with integrating and reorganizing the company, so as to develop it into a modern and profitable member of the OMV Group. In 2005, we launched a wide number of initiatives at Petrom based on thorough planning. These were aimed at improving operational productivity in the E&P segment, reducing production losses, and increasing refinery utilization, as well as establishing a new gas marketing business. Organizational structures and processes were recast and new service contracts made. A social plan was drawn up in a close and constructive dialog with the labor unions, opening the way for a reduction in the headcount from 51,005 to 44,693 by the end of the year. Petrom’s strong earnings contribution already shows the benefits of the modernization programs being implemented at the company.
Milestones
During the first year since the Petrom acquisition we have paid special attention to this challenge. We did not lose sight of other activities, however. We successfully expanded our exploration and production operations in 2005, and announced significant discoveries in Austria, Iran, Libya, the UK and Yemen. We optimized our upstream portfolio by tightening the focus on our core regions. Meanwhile, the acquisition of the Aral filling stations in the Czech Republic made OMV the leader in that market. On October 1, 2005, we launched biodiesel on the market, ahead of the EU deadline, and we introduced an ultra low sulfur diesel grade. The year also witnessed expansion projects that turned Schwechat into one of Europe’s leading petrochemical sites. We increased our holding in the second-largest European polyolefine producer, Borealis from 25% to 35%. In order to concentrate on our core business, we divested the Polyfelt geotextile business, and a 50% of the AMI Chemical business. In the Gas segment, we signed a new transport contract with Gazexport of Russia. A joint venture was formed to advance the major Nabucco gas pipeline project, which is aimed at opening up sources of supply in Central Asia so as to meet growing demand in Europe. This will draw up financing plans and coordinate further planning stages under OMV’s leadership.
Statement of the Chairman of the Executive Board
OMV 2005 |7
Strategy 2010
We completed the first stage of our expansion strategy ahead of schedule, generating long-term value growth for stockholders, but we are not resting on our laurels. Instead, we have formulated a new strategy that will take us through to 2010, and this makes a clear commitment to continued profitable growth. Our financial strength gives us a solid platform for this. Our strategic objectives can be summarized as follows:
OMV will strive to extend its market leadership in Central Europe, and to be the oil company that profits most from the opportunities offered by the European “growth belt”. This represents a conscious decision to continue to move outwards from mature markets into a rapidly growing regional economy of 200 mn people.
We aim to make OMV the most attractive oil and gas group in this high-growth region, having a stable ownership structure and achieving a ROACE of 13% given average market conditions. This means that when considering acquisition targets we will weigh up our strategic options and the potential profitability of each move very carefully, just as we always have in the past. In order to attain this objective, we must also still make better use of the earnings potential offered by our 20% market share and our integration.
We want OMV to be the best integrated mid-sized oil and gas company. In Exploration and Production we will focus on today’s five core regions, targeting Russia as a potential sixth region. We would like at least half of the crude we process at our refineries to be produced by ourselves. We also plan to place the integration of our E&P and Gas operations on a new footing.
OMV is committed to business, social and environmental sustainability (“triple bottom line”). In fulfilling our mission of providing our customers with secure energy supplies, we will pay greater attention to improved products and new energy forms, as well as environmental protection and the interests of the community.
The quantitative targets implied by this strategy are:
Oil and gas production of 500,000 boe per dayRefining capacity of up to 50 mn tons per year Gas sales volumes of 20 bcm per year 13% ROACE
Outlook for 2006
The oil and gas industry will continue to be subject to many uncertainties in the near term, and markets will therefore remain volatile. However, we have shown that we are capable of mastering challenges like this. We will investigate acquisition opportunities very carefully, but will simultaneously devote as much energy as before to developing and integrating Petrom.
I am confident that our new strategy and the steps already taken towards its implementation in 2006 will continue to be in the interests of our stockholders.
Wolfgang Ruttenstorfer

50 years of OMV
OMV 2005 |8
OMV started in 1956 as a state enterprise and has since developed into Austria’s most successful industrial enterprise and a multinational player. 50 years on from the formation of “Österreichische Mineralölverwaltung Aktiengesellschaft” the Company now represents an excellent economic position as never before. In the preceding financial year OMV realized the best results in its entire history. For the next 50 years we are confident that OMV will continue to successfully operate in a socially responsible manner according to the “Move & More“ motto and ensure the supply of mineral oil products and natural gas in its markets.
Significant milestones in OMV’s 50-year history
1956: Founding of "Österreichische Mineralölverwaltung Aktiengesellschaft"
1958: Laying of the foundation stone for the new refinery in Schwechat
1960: Start-up of the refinery in Schwechat
1965: Initialization of mineral oil sales with Martha and ÖROP (later ELAN)
1968: First contract for natural gas deliveries with the former Soviet Union
1970: Start-up of the Adria-Wien crude oil pipeline
1974: Start-up of the Trans-Austria gas pipeline
1980: Start up of the West-Austria gas pipeline
1985: First international E&P production in Libya
1987: Acquisition of the Burghausen refinery; First step taken towards privatization: 15% of capital stock sold via stock exchange
1989: Take-over of PCD Polymere Ltd; Privatization of further 10% of ÖMV’s capital stock
1990: Acquisition of CHEMIE LINZ group; Inauguration of the first ÖMV filling station
1991: Initiation of international retail business in Hungary, Czech Republic, Slovakia, Germany and Italy
1992: First ÖMV filling station in Slovenia
1993: First ÖMV filling station in Croatia
1994: Acquisition of 19.6% of ÖMV’s capital stock by IPIC (Abu Dhabi)
1995: Renaming from ÖMV to OMV
1996: Secondary offering of 15% of OMV shares
1997: Commencement of the first OMV CNG (compressed natural gas) filling station in Austria
1998: Sale of PCD to Borealis and acquisition of 25% stake in Borealis
1999: Takeover of the Australian exploration company CULTUS Petroleum NL; First OMV filling stations in Romania and Bulgaria
2000: Acquisition of 10% of the Hungarian oil and gas company MOL
2001: Expansion of the exploration areas in Yemen, Iran and Ireland; Spin-off the Gas business
2002: Acquisition of 25.1% of the Rompetrol group;First OMV filling station in Serbia-Montenegro
2003: Acquisition of Preussag Energie’s international E&P-portfolio; Acquisition of 45% of BAYERNOIL-Raffinerieverbund as well as 313 BP-filling stations in Germany, Hungary and Slovakia; First OMV filling stations in Bosnia and Herzegovina;Acquisition of 139 AVANTI filling stations in Austria, Czech Republic, Slovakia and Bulgaria
2004: Restructuring into a management holding; Acquisition of a 51% stake in the Romanian oil and gas group Petrom; Capital increase and issue of a convertible bond, hence the free float representing more than 50% of issued shares for the first time
2005: Sale of the stake in the Rompetrol group; OMV and IPIC acquire 100% of Borealis; OMV sells 50% AMI stake to IPIC
OMV stock and bonds
OMV 2005 |9
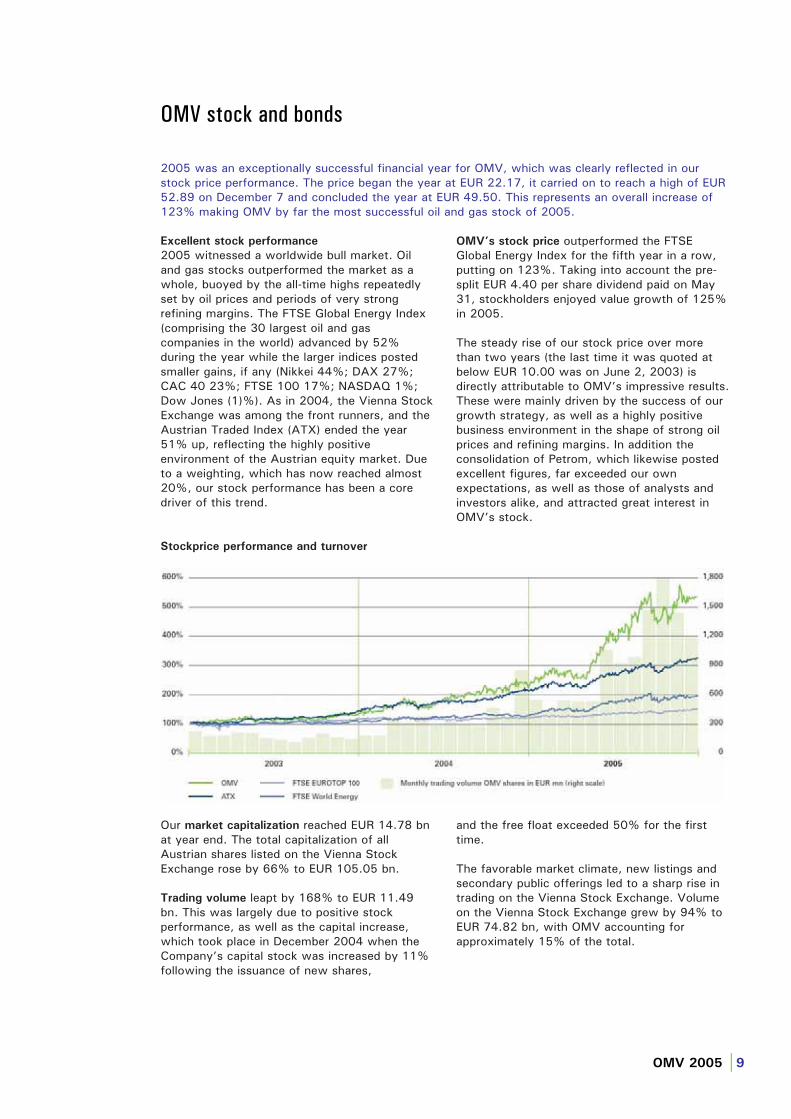
2005 was an exceptionally successful financial year for OMV, which was clearly reflected in our stock price performance. The price began the year at EUR 22.17, it carried on to reach a high of EUR 52.89 on December 7 and concluded the year at EUR 49.50. This represents an overall increase of 123% making OMV by far the most successful oil and gas stock of 2005.
Excellent stock performance
2005 witnessed a worldwide bull market. Oil and gas stocks outperformed the market as a whole, buoyed by the all-time highs repeatedly set by oil prices and periods of very strong refining margins. The FTSE Global Energy Index (comprising the 30 largest oil and gas companies in the world) advanced by 52% during the year while the larger indices posted smaller gains, if any (Nikkei 44%; DAX 27%; CAC 40 23%; FTSE 100 17%; NASDAQ 1%; Dow Jones (1)%). As in 2004, the Vienna Stock Exchange was among the front runners, and the Austrian Traded Index (ATX) ended the year 51% up, reflecting the highly positive environment of the Austrian equity market. Due to a weighting, which has now reached almost 20%, our stock performance has been a core driver of this trend.
OMV’s stock price outperformed the FTSE Global Energy Index for the fifth year in a row, putting on 123%. Taking into account the pre-split EUR 4.40 per share dividend paid on May 31, stockholders enjoyed value growth of 125% in 2005.
The steady rise of our stock price over more than two years (the last time it was quoted at below EUR 10.00 was on June 2, 2003) is directly attributable to OMV’s impressive results. These were mainly driven by the success of our growth strategy, as well as a highly positive business environment in the shape of strong oil prices and refining margins. In addition the consolidation of Petrom, which likewise posted excellent figures, far exceeded our own expectations, as well as those of analysts and investors alike, and attracted great interest in OMV’s stock.
Stockprice performance and turnover
Our market capitalization reached EUR 14.78 bn at year end. The total capitalization of all Austrian shares listed on the Vienna Stock Exchange rose by 66% to EUR 105.05 bn.
Trading volume leapt by 168% to EUR 11.49 bn. This was largely due to positive stock performance, as well as the capital increase, which took place in December 2004 when the Company’s capital stock was increased by 11% following the issuance of new shares,
and the free float exceeded 50% for the first time.
The favorable market climate, new listings and secondary public offerings led to a sharp rise in trading on the Vienna Stock Exchange. Volume on the Vienna Stock Exchange grew by 94% to EUR 74.82 bn, with OMV accounting for approximately 15% of the total.

OMV 2005 |10
Results of the Annual General Meeting
The main items on the agenda at the Annual General Meeting held on May 18, 2005 were payment of a EUR 4.40 per share dividend for 2004 and authorization of a ten-for-one stock split.
The meeting also approved the 2005 stock option plan, which is focused on providing management with a substantial long-term stake in the Company’s success, thus aligning its interests more closely with those of its shareholders. However, the approved share buyback program related to the stock option plan could not be carried out, as the price exceeded the upper limit on the first day of the buyback window. A total of 26,544 shares were resold to satisfy options exercised under existing plans. In all, OMV now holds 1,319,606 own shares, or 0.44% of the capital stock, as a result of the five buyback programs launched between 2001 and 2005. The number of outstanding shares is thus 298,681,094, after 700 convertible bonds were converted into shares in 2005 (for further details see Note 29 or visit www.omv.com > Investor Relations > Stock Information). Under a further employee stock ownership plan, operated in autumn 2005, employees received ten free shares for every 40 purchased; there is a two-year holding period. Approximately 30% of the Company’s workforce participated in the program.
The Executive Board will propose a dividend of EUR 0.90 per share at the next Annual General Meeting, scheduled for May 24, 2006. The payout ratio will be 21%, resulting in a dividend yield, based on the closing price of the last trading day in 2005, of almost 2%.
Ten-for-one stock split
As part of efforts to enhance the tradability and liquidity of OMV’s stock, and simplify comparisons with the international peer group, a ten-for-one stock split was carried out on the Vienna Stock Exchange on July 11, 2005.
In order to facilitate the split, OMV’s capital stock was increased from EUR 218,100,000 to EUR 300,000,000 from internal resources and without issuing new shares. The split increased the number of no par bearer shares into which the Company’s capital stock is divided from 30,000,000 to 300,000,000. The conversion price for the OMV 2004–2008 bond was adjusted to EUR 30.66 per share.
OMV shareholder structure
OMV’s shareholder structure comprises 50.9% free float, 31.5% ÖIAG and 17.6% International Petroleum Investment Company (IPIC) from Abu Dhabi. Our capital stock consists of common shares. The one-share one-vote principle is applied, meaning that there are no share classes that carry special rights. There is a consortium agreement between the core stockholders IPIC and ÖIAG, which provides for block voting and certain limitations to transfers of shareholdings. In the interests of equal treatment of stockholders, the articles of incorporation exclude the statutory 15% maximum discount on compulsory offers to minority shareholders in the event of a takeover.
OMV stock ISIN: AT0000743059
Listings Vienna, USA (ADR Level I) Symbols Vienna Stock Exchange: OMV
Reuters: OMV.VI Bloomberg: OMV AV
ADR information Sponsored Level I and Rule 144A: 5 ADR represent 1 share
Depositary JPMorgan Chase Bank 4 New York Plaza; New York, NY 10004, USA
Custodian Bank Austria Creditanstalt AG, Julius Tandler-Platz 3, 1090 Vienna
Level I OMVKY, CUSIP: 670875509 ISIN: US6708755094
Rule 144A OMVZY, CUSIP: 670875301 ISIN: US6708753016
OMV bond ISIN: AT0000341623 Duration, coupon 2003 to June 30, 2010; 3.75% OMV convertible
bond
ISIN: AT0000342647
Duration, coupon 2004 to Dec. 1, 2008; 1.5%
OMV 2005 |11
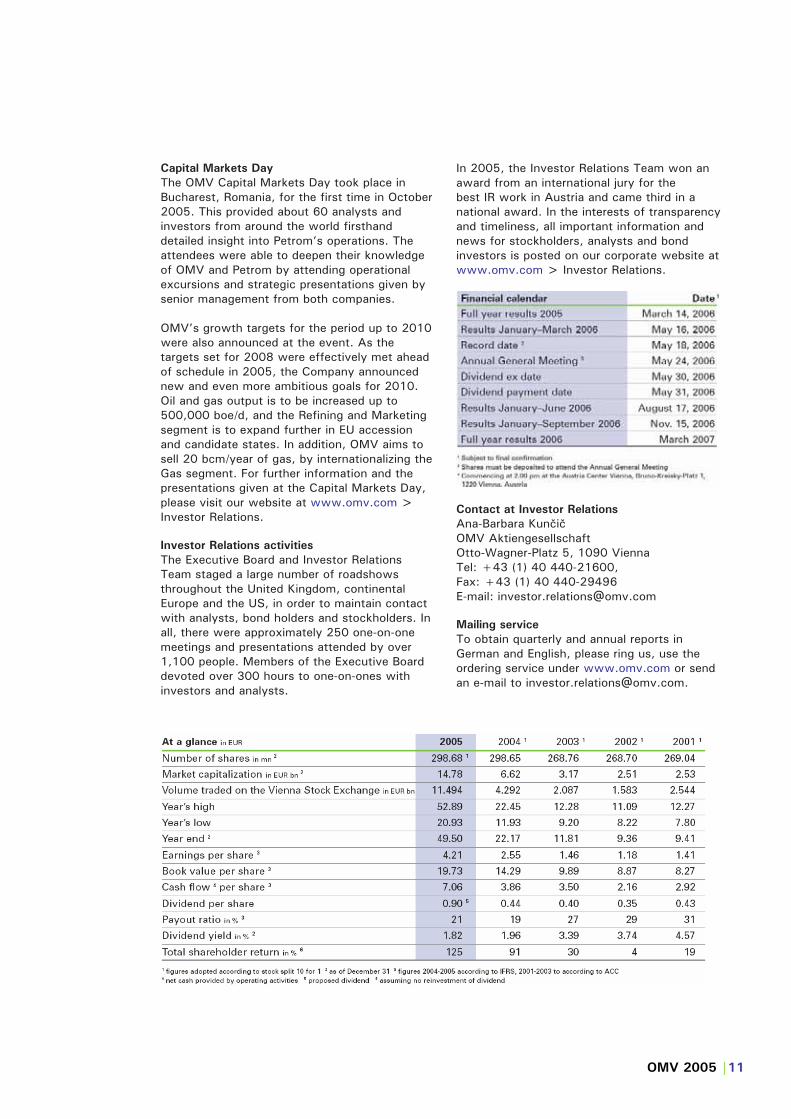
Capital Markets Day
The OMV Capital Markets Day took place in Bucharest, Romania, for the first time in October 2005. This provided about 60 analysts and investors from around the world firsthand detailed insight into Petrom’s operations. The attendees were able to deepen their knowledge of OMV and Petrom by attending operational excursions and strategic presentations given by senior management from both companies.
OMV’s growth targets for the period up to 2010 were also announced at the event. As the targets set for 2008 were effectively met ahead of schedule in 2005, the Company announced new and even more ambitious goals for 2010. Oil and gas output is to be increased up to 500,000 boe/d, and the Refining and Marketing segment is to expand further in EU accession and candidate states. In addition, OMV aims to sell 20 bcm/year of gas, by internationalizing the Gas segment. For further information and the presentations given at the Capital Markets Day, please visit our website at www.omv.com >Investor Relations.
Investor Relations activities
The Executive Board and Investor Relations Team staged a large number of roadshows throughout the United Kingdom, continental Europe and the US, in order to maintain contact with analysts, bond holders and stockholders. In all, there were approximately 250 one-on-one meetings and presentations attended by over 1,100 people. Members of the Executive Board devoted over 300 hours to one-on-ones with investors and analysts.
In 2005, the Investor Relations Team won an award from an international jury for the best IR work in Austria and came third in a national award. In the interests of transparency and timeliness, all important information and news for stockholders, analysts and bond investors is posted on our corporate website at www.omv.com > Investor Relations.
Contact at Investor Relations
Ana-Barbara Kun iOMV Aktiengesellschaft Otto-Wagner-Platz 5, 1090 Vienna Tel: +43 (1) 40 440-21600, Fax: +43 (1) 40 440-29496 E-mail: [email protected]
Mailing service
To obtain quarterly and annual reports in German and English, please ring us, use the ordering service under www.omv.com or send an e-mail to [email protected].

Directors’ report
OMV 2005 |12
The Company’s Austrian annual financial statements conform to the valuation rules of the Austrian Commercial Code. According to the rules affiliated companies are only shown under financial assets meaning that just a part of the business performance of OMV Aktiengesellschaft and their affiliated companies is given. In order to provide a better picture of assets, earnings and finances of OMV Aktiengesellschaft and its affiliates, the Directors’ report is based on the International Financial Reporting Standards (IFRS) accounts.
Economic Climate
The global economy continued to grow robustly, achieving growth of more than 4% in 2005. In addition, world trade powered ahead, although the rate of expansion reduced to approximately 7%. GDP growth in developing countries outpaced the 2.6% average for industrialized countries, growing at an average of almost 6%. In the OECD area, economic growth in the USA and Japan was 3.5% and 2.7%, respectively. The positive environment was mainly driven by the continuing strength of domestic consumption spending and brisk investment activity.
In the EU, the export-led upturn that had begun in 2004 was held back by muted domestic demand, and GDP growth averaged only 1.7%, although there were marked regional variations. Eurozone growth was below expectations at 1.5%, reflecting the weak performance of the larger economies, particularly France, Germany and Italy. The German economy only began to recover in the second half of 2005, driven by export demand, and as a result output edged up by 1% over the year as a whole. In contrast, the ten new EU member states continued to catch up with the wealthier countries, with growth averaging 4.6%. The economies of the five Central European accession countries – the Czech Republic, Hungary, Poland, Slovakia and Slovenia – expanded between 3.2% and 6%. However, Romania suffered a sharp loss of momentum, and GDP growth halved to 4.1%. While investment and consumer demand remained strong, industrial and agricultural output fell short of forecasts, partly as a result of the flooding in South-Eastern Europe during the summer. Economic growth in Austria also slowed, declining to a real 1.9%, of which almost half was due to a rise in exports, however, both personal consumption and construction continued to gather pace. Unemployment increased to 5.2%, despite a 1% rise in employment, while inflation climbed to 2.3%, with housing and energy prices growing the most rapidly.
According to International Energy Agency (IEA) figures, world crude oil demand increased by 1.1 mn bbl/d or 1.3% to 83.3 mn bbl/d. In the OECD area – which accounts for 60% of global demand – consumption only rose by 0.1 mn bbl/d. Over 80% of the additional demand was accounted for by developing countries in Asia, South America, Africa and the Middle East. For the third year in a row world oil production growth
outstripped global demand, resulting in an inventory build. The rise in world oil output to 84.1 mn bbl/d was slightly below demand growth for the year.
A 1 mn bbl/d drop in OECD production, partly caused by the impact of the hurricanes on the US oil industry was fully offset by OPEC output gains. Furthermore CIS, South American and African producers also increased supply. OPEC production of 34.0 mn bbl/d (incl. NGL) drove the Organization’s market share above the 40% mark. Within OPEC, Saudi Arabia lifted production by 0.4 mn bbl/d while Iraq output shrank by approximately 0.2 mn bbl/d or 10%.
Crude oil prices hit nominal record highs several times over the course of 2005. Spot Brent blend peaked at USD 67.33/bbl on August 12, and put on USD 20/bbl over the year, closing on USD 58.21/bbl. Fears of shortages also buoyed futures despite adequate supply. Two 0.5 mn bbl/d increases in the OPEC output ceiling, in mid-March and early July, had little impact on sentiment, and were followed by real supply disruptions caused by hurricane Katrina in August and hurricane Rita in September. The storms temporarily shut down drilling rigs and production platforms with a combined production capacity of 1.5 mn bbl/d in the Gulf of Mexico, in addition to approximately one-quarter of US refining capacity. An OPEC pledge to activate remaining swing capacity of about 2 mn bbl/d if necessary from October onwards, and the IEA’s announcement of an emergency stock release calmed the market. The average price of a barrel of Brent rose by 43% year-on-year, to stand at USD 54.49.
Crude price (Brent) and USD exchange rate
The average euro/dollar exchange rate was at USD 1.244 virtually unchanged from the previous year meaning that price rises were no longer cushioned by a weakening dollar as in former years. Rotterdam petroleum product prices firmed between 34% and 57%. The price run-up was more pronounced in the
OMV 2005 |13
case of middle distillates (gasoil and aviation fuel) and heavy heating oil than that of gasolines. Global refining capacity shortages partly decoupled petroleum product prices from crudes.
According to first estimates Austrian primary energy
consumption rose by 2–3%. Oil, gas and “other renewable energy sources” gained market shares at the expense of coal (cessation of brown coal production) and hydro power. Electricity demand increased by about 1% and cross-border electricity trade rose sharply. Heat generation by thermal power stations increased by 5% while hydro power generation stagnated, and renewable power generation jumped by about 50% to 6 TWh. Domestic heating demand was about 3% higher year-on-year due to colder weather, while the energy price index for private households rose by about 9.3%. According to E-Control Austrian natural gas demand
surged, registering a year-on-year increase of about 5.4%. In addition, consumption (including own consumption) reached a record 9.5 bcm. Austrian underground gas storage facilities were 80% full at year end, with inventories up to 2.3 bcm – a third higher than in the previous year.
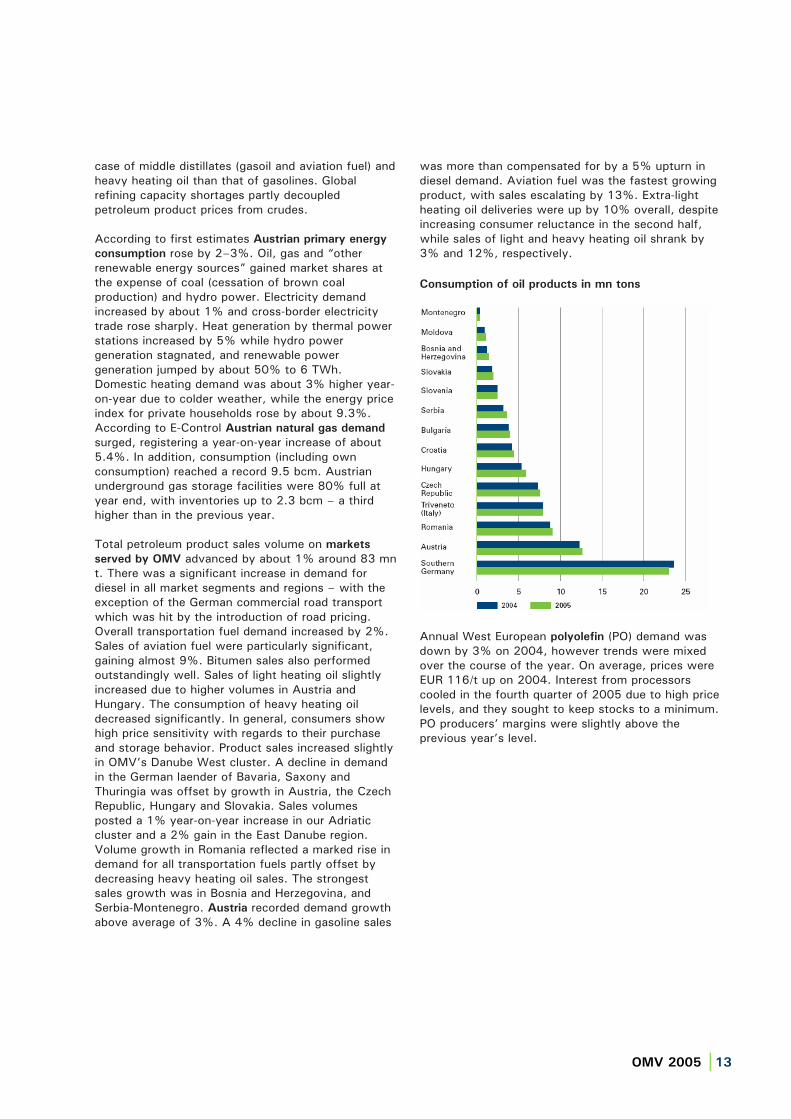
Total petroleum product sales volume on markets
served by OMV advanced by about 1% around 83 mn t. There was a significant increase in demand for diesel in all market segments and regions – with the exception of the German commercial road transport which was hit by the introduction of road pricing. Overall transportation fuel demand increased by 2%. Sales of aviation fuel were particularly significant, gaining almost 9%. Bitumen sales also performed outstandingly well. Sales of light heating oil slightly increased due to higher volumes in Austria and Hungary. The consumption of heavy heating oil decreased significantly. In general, consumers show high price sensitivity with regards to their purchase and storage behavior. Product sales increased slightly in OMV’s Danube West cluster. A decline in demand in the German laender of Bavaria, Saxony and Thuringia was offset by growth in Austria, the Czech Republic, Hungary and Slovakia. Sales volumes posted a 1% year-on-year increase in our Adriatic cluster and a 2% gain in the East Danube region. Volume growth in Romania reflected a marked rise in demand for all transportation fuels partly offset by decreasing heavy heating oil sales. The strongest sales growth was in Bosnia and Herzegovina, and Serbia-Montenegro. Austria recorded demand growth above average of 3%. A 4% decline in gasoline sales
was more than compensated for by a 5% upturn in diesel demand. Aviation fuel was the fastest growing product, with sales escalating by 13%. Extra-light heating oil deliveries were up by 10% overall, despite increasing consumer reluctance in the second half, while sales of light and heavy heating oil shrank by 3% and 12%, respectively.
Consumption of oil products in mn tons
Annual West European polyolefin (PO) demand was down by 3% on 2004, however trends were mixed over the course of the year. On average, prices were EUR 116/t up on 2004. Interest from processors cooled in the fourth quarter of 2005 due to high price levels, and they sought to keep stocks to a minimum. PO producers’ margins were slightly above the previous year’s level.

OMV 2005 |14
The success of the Group’s expansion strategy brought an unprecedented surge in growth during the 2005 financial year. The integration of Petrom, acquired at the end of 2004, progressed well during the year, and made a first, substantial contribution to profits well above expectations. The consolidation of Petrom aside, earnings growth was chiefly driven by the highly positive environment experienced by most of our businesses – notably stronger crude prices and refining margins. These factors enabled OMV to post record earnings, once again.
The main focus for management was effectively integrating Petrom in the OMV Group. During the year Petrom was reorganized, and “quick wins” were targeted in order to achieve early improvements in earnings. The first radical restructuring measures were introduced, and a large-scale investment program was launched to increase Petrom’s competitiveness. Alongside these initial achievements at Petrom, existing operations were also making major strides towards further growth. E&P made significant oil and gas discoveries in Austria, Libya, the North Sea and Yemen. And the Group increased its interest in Borealis – one of the world’s leading producers of basic plastics – from 25% to 35%.
In order to streamline OMV’s portfolio, the 25% stake in the Romanian oil company Rompetrol, the 50% interest in the AMI group (melamine and fertilizers), the Polyfelt group (geotextiles) and the Australian gas production activities were divested. Agreements for the sale of E&P assets in Qatar and Ecuador have been signed, and these transactions are expected to be completed in 2006.
EBIT was up by 101% to EUR 1,958 mn, and net income for the year by 117% to EUR 1,496 mn. These improvements were primarily attributable to consolidation of Petrom, but also reflected steadily rising crude oil prices and high refining margins. Robust earnings growth also had a positive impact on the Group’s financial performance ratios. Return on average capital employed (ROACE) rose from 15% to 20%, and return on fixed assets (ROfA) increased from 24% to 29%, while return on equity (ROE) was 22%. Readers are referred to the glossary of abbreviations and definitions on page 127 for definitions of these ratios.
OMV 2005 |15
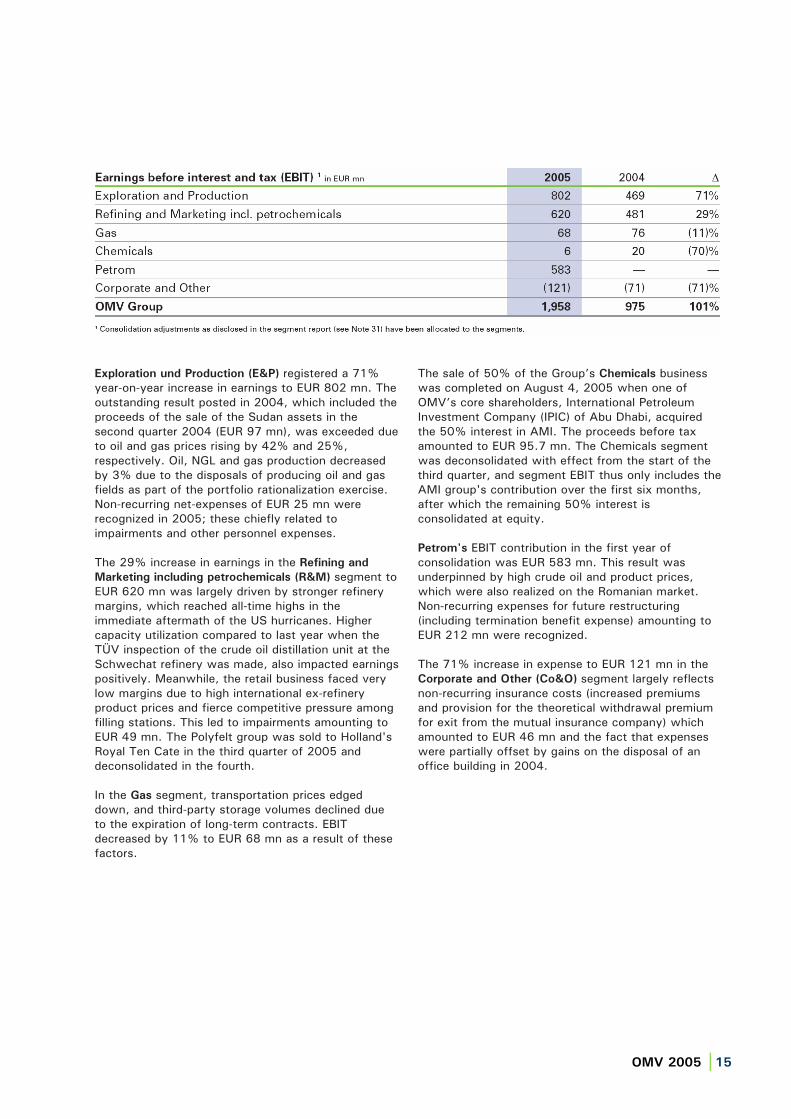
Exploration und Production (E&P) registered a 71% year-on-year increase in earnings to EUR 802 mn. The outstanding result posted in 2004, which included the proceeds of the sale of the Sudan assets in the second quarter 2004 (EUR 97 mn), was exceeded due to oil and gas prices rising by 42% and 25%, respectively. Oil, NGL and gas production decreased by 3% due to the disposals of producing oil and gas fields as part of the portfolio rationalization exercise. Non-recurring net-expenses of EUR 25 mn were recognized in 2005; these chiefly related to impairments and other personnel expenses.
The 29% increase in earnings in the Refining and
Marketing including petrochemicals (R&M) segment to EUR 620 mn was largely driven by stronger refinery margins, which reached all-time highs in the immediate aftermath of the US hurricanes. Higher capacity utilization compared to last year when the TÜV inspection of the crude oil distillation unit at the Schwechat refinery was made, also impacted earnings positively. Meanwhile, the retail business faced very low margins due to high international ex-refinery product prices and fierce competitive pressure among filling stations. This led to impairments amounting to EUR 49 mn. The Polyfelt group was sold to Holland's Royal Ten Cate in the third quarter of 2005 and deconsolidated in the fourth.
In the Gas segment, transportation prices edged down, and third-party storage volumes declined dueto the expiration of long-term contracts. EBIT decreased by 11% to EUR 68 mn as a result of these factors.
The sale of 50% of the Group’s Chemicals businesswas completed on August 4, 2005 when one of OMV’s core shareholders, International Petroleum Investment Company (IPIC) of Abu Dhabi, acquired the 50% interest in AMI. The proceeds before tax amounted to EUR 95.7 mn. The Chemicals segment was deconsolidated with effect from the start of the third quarter, and segment EBIT thus only includes the AMI group's contribution over the first six months, after which the remaining 50% interest is consolidated at equity.
Petrom's EBIT contribution in the first year of consolidation was EUR 583 mn. This result was underpinned by high crude oil and product prices, which were also realized on the Romanian market. Non-recurring expenses for future restructuring (including termination benefit expense) amounting to EUR 212 mn were recognized.
The 71% increase in expense to EUR 121 mn in the Corporate and Other (Co&O) segment largely reflects non-recurring insurance costs (increased premiums and provision for the theoretical withdrawal premium for exit from the mutual insurance company) which amounted to EUR 46 mn and the fact that expenses were partially offset by gains on the disposal of an office building in 2004.
OMV 2005 |16
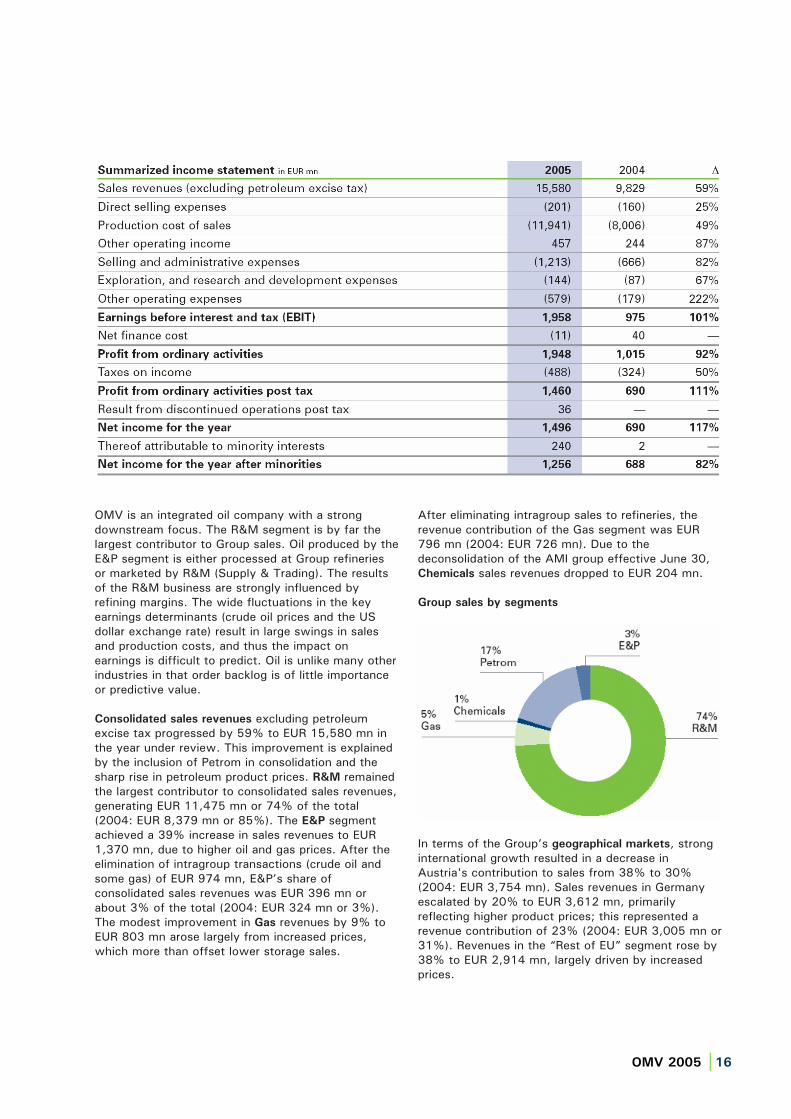
OMV is an integrated oil company with a strong downstream focus. The R&M segment is by far the largest contributor to Group sales. Oil produced by the E&P segment is either processed at Group refineries or marketed by R&M (Supply & Trading). The results of the R&M business are strongly influenced by refining margins. The wide fluctuations in the key earnings determinants (crude oil prices and the US dollar exchange rate) result in large swings in sales and production costs, and thus the impact on earnings is difficult to predict. Oil is unlike many other industries in that order backlog is of little importance or predictive value.
Consolidated sales revenues excluding petroleum excise tax progressed by 59% to EUR 15,580 mn in the year under review. This improvement is explained by the inclusion of Petrom in consolidation and the sharp rise in petroleum product prices. R&M remained the largest contributor to consolidated sales revenues, generating EUR 11,475 mn or 74% of the total (2004: EUR 8,379 mn or 85%). The E&P segmentachieved a 39% increase in sales revenues to EUR 1,370 mn, due to higher oil and gas prices. After the elimination of intragroup transactions (crude oil and some gas) of EUR 974 mn, E&P’s share of consolidated sales revenues was EUR 396 mn or about 3% of the total (2004: EUR 324 mn or 3%). The modest improvement in Gas revenues by 9% to EUR 803 mn arose largely from increased prices, which more than offset lower storage sales.
After eliminating intragroup sales to refineries, the revenue contribution of the Gas segment was EUR 796 mn (2004: EUR 726 mn). Due to the deconsolidation of the AMI group effective June 30, Chemicals sales revenues dropped to EUR 204 mn.
Group sales by segments
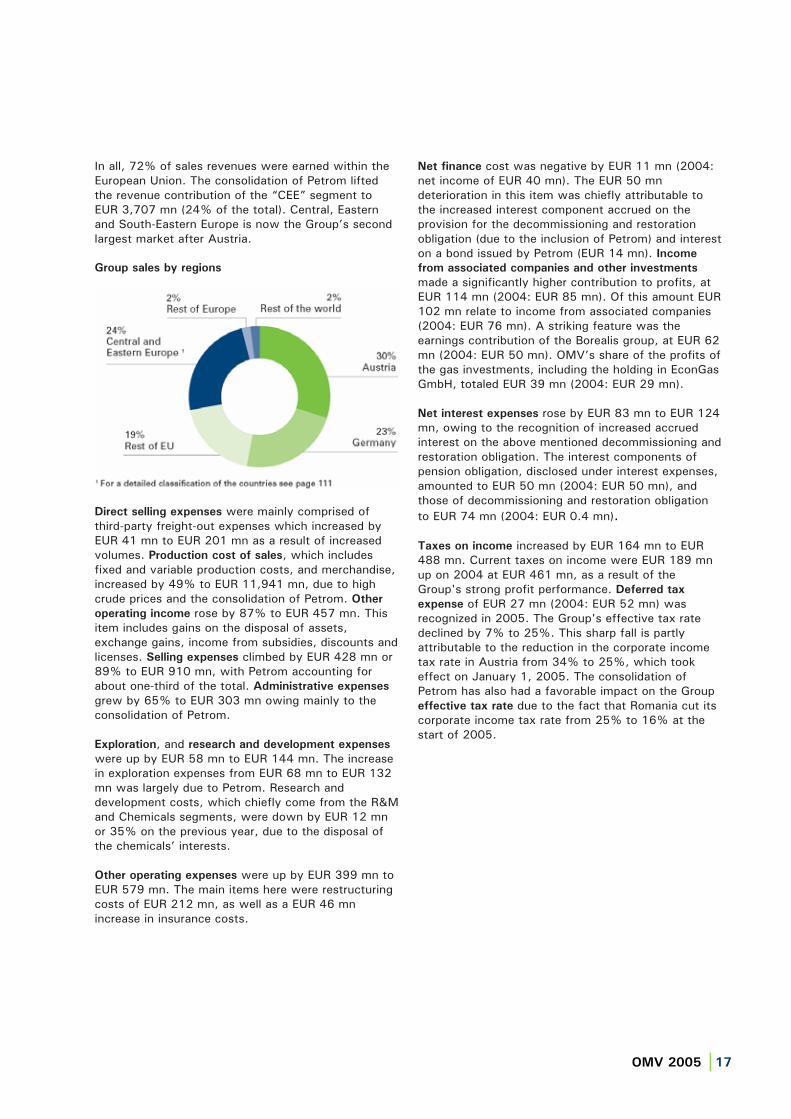
In terms of the Group’s geographical markets, strong international growth resulted in a decrease in Austria's contribution to sales from 38% to 30% (2004: EUR 3,754 mn). Sales revenues in Germany escalated by 20% to EUR 3,612 mn, primarily reflecting higher product prices; this represented a revenue contribution of 23% (2004: EUR 3,005 mn or 31%). Revenues in the “Rest of EU” segment rose by 38% to EUR 2,914 mn, largely driven by increased prices.
OMV 2005 |17
In all, 72% of sales revenues were earned within the European Union. The consolidation of Petrom lifted the revenue contribution of the “CEE” segment to EUR 3,707 mn (24% of the total). Central, Eastern and South-Eastern Europe is now the Group’s second largest market after Austria.
Group sales by regions
Direct selling expenses were mainly comprised of third-party freight-out expenses which increased by EUR 41 mn to EUR 201 mn as a result of increased volumes. Production cost of sales, which includes fixed and variable production costs, and merchandise, increased by 49% to EUR 11,941 mn, due to high crude prices and the consolidation of Petrom. Other
operating income rose by 87% to EUR 457 mn. This item includes gains on the disposal of assets, exchange gains, income from subsidies, discounts and licenses. Selling expenses climbed by EUR 428 mn or 89% to EUR 910 mn, with Petrom accounting for about one-third of the total. Administrative expenses
grew by 65% to EUR 303 mn owing mainly to the consolidation of Petrom.
Exploration, and research and development expenses
were up by EUR 58 mn to EUR 144 mn. The increase in exploration expenses from EUR 68 mn to EUR 132 mn was largely due to Petrom. Research and development costs, which chiefly come from the R&M and Chemicals segments, were down by EUR 12 mn or 35% on the previous year, due to the disposal of the chemicals’ interests.
Other operating expenses were up by EUR 399 mn to EUR 579 mn. The main items here were restructuring costs of EUR 212 mn, as well as a EUR 46 mn increase in insurance costs.
Net finance cost was negative by EUR 11 mn (2004: net income of EUR 40 mn). The EUR 50 mn deterioration in this item was chiefly attributable to the increased interest component accrued on the provision for the decommissioning and restoration obligation (due to the inclusion of Petrom) and interest on a bond issued by Petrom (EUR 14 mn). Income
from associated companies and other investments
made a significantly higher contribution to profits, at EUR 114 mn (2004: EUR 85 mn). Of this amount EUR 102 mn relate to income from associated companies (2004: EUR 76 mn). A striking feature was the earnings contribution of the Borealis group, at EUR 62 mn (2004: EUR 50 mn). OMV’s share of the profits of the gas investments, including the holding in EconGas GmbH, totaled EUR 39 mn (2004: EUR 29 mn).
Net interest expenses rose by EUR 83 mn to EUR 124 mn, owing to the recognition of increased accrued interest on the above mentioned decommissioning and restoration obligation. The interest components of pension obligation, disclosed under interest expenses, amounted to EUR 50 mn (2004: EUR 50 mn), and those of decommissioning and restoration obligation to EUR 74 mn (2004: EUR 0.4 mn).
Taxes on income increased by EUR 164 mn to EUR 488 mn. Current taxes on income were EUR 189 mn up on 2004 at EUR 461 mn, as a result of the Group's strong profit performance. Deferred tax
expense of EUR 27 mn (2004: EUR 52 mn) was recognized in 2005. The Group's effective tax rate declined by 7% to 25%. This sharp fall is partly attributable to the reduction in the corporate income tax rate in Austria from 34% to 25%, which took effect on January 1, 2005. The consolidation of Petrom has also had a favorable impact on the Group effective tax rate due to the fact that Romania cut its corporate income tax rate from 25% to 16% at the start of 2005.
OMV 2005 |18
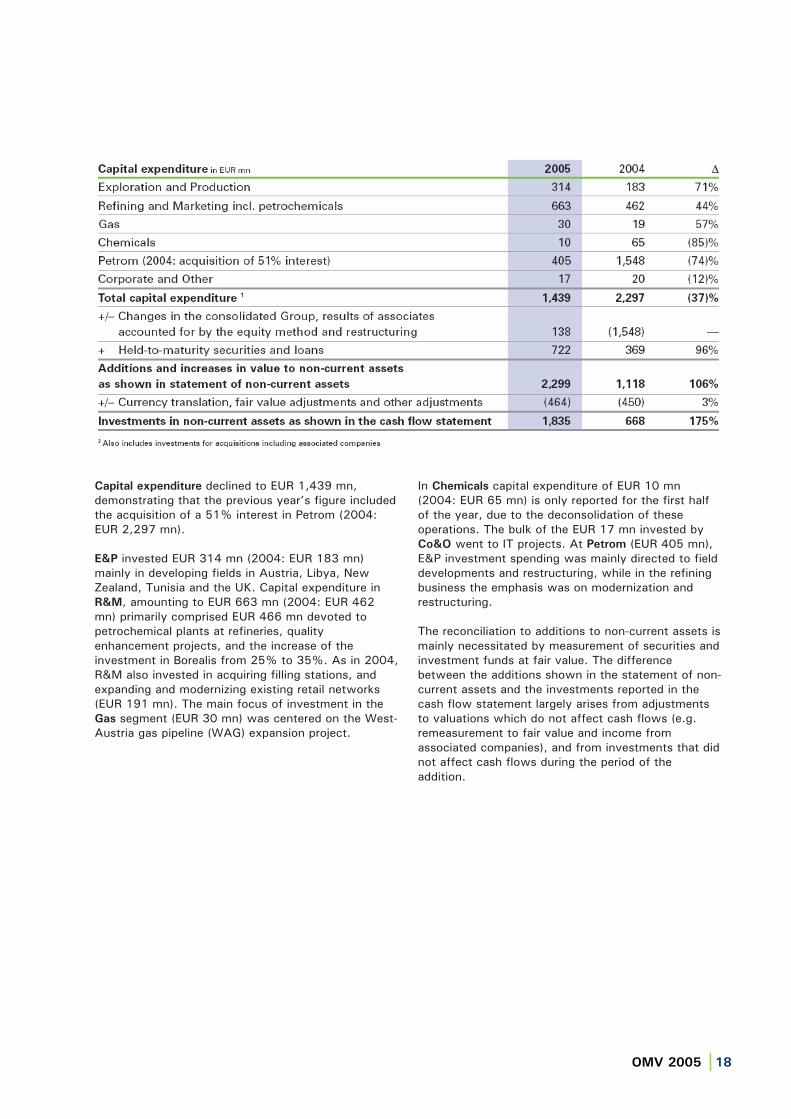
Capital expenditure declined to EUR 1,439 mn, demonstrating that the previous year’s figure included the acquisition of a 51% interest in Petrom (2004: EUR 2,297 mn).
E&P invested EUR 314 mn (2004: EUR 183 mn) mainly in developing fields in Austria, Libya, New Zealand, Tunisia and the UK. Capital expenditure in R&M, amounting to EUR 663 mn (2004: EUR 462 mn) primarily comprised EUR 466 mn devoted to petrochemical plants at refineries, quality enhancement projects, and the increase of the investment in Borealis from 25% to 35%. As in 2004, R&M also invested in acquiring filling stations, and expanding and modernizing existing retail networks (EUR 191 mn). The main focus of investment in the Gas segment (EUR 30 mn) was centered on the West- Austria gas pipeline (WAG) expansion project.
In Chemicals capital expenditure of EUR 10 mn (2004: EUR 65 mn) is only reported for the first half of the year, due to the deconsolidation of these operations. The bulk of the EUR 17 mn invested by Co&O went to IT projects. At Petrom (EUR 405 mn), E&P investment spending was mainly directed to field developments and restructuring, while in the refining business the emphasis was on modernization and restructuring.
The reconciliation to additions to non-current assets is mainly necessitated by measurement of securities and investment funds at fair value. The difference between the additions shown in the statement of non-current assets and the investments reported in the cash flow statement largely arises from adjustments to valuations which do not affect cash flows (e.g. remeasurement to fair value and income from associated companies), and from investments that did not affect cash flows during the period of the addition.
OMV 2005 |19
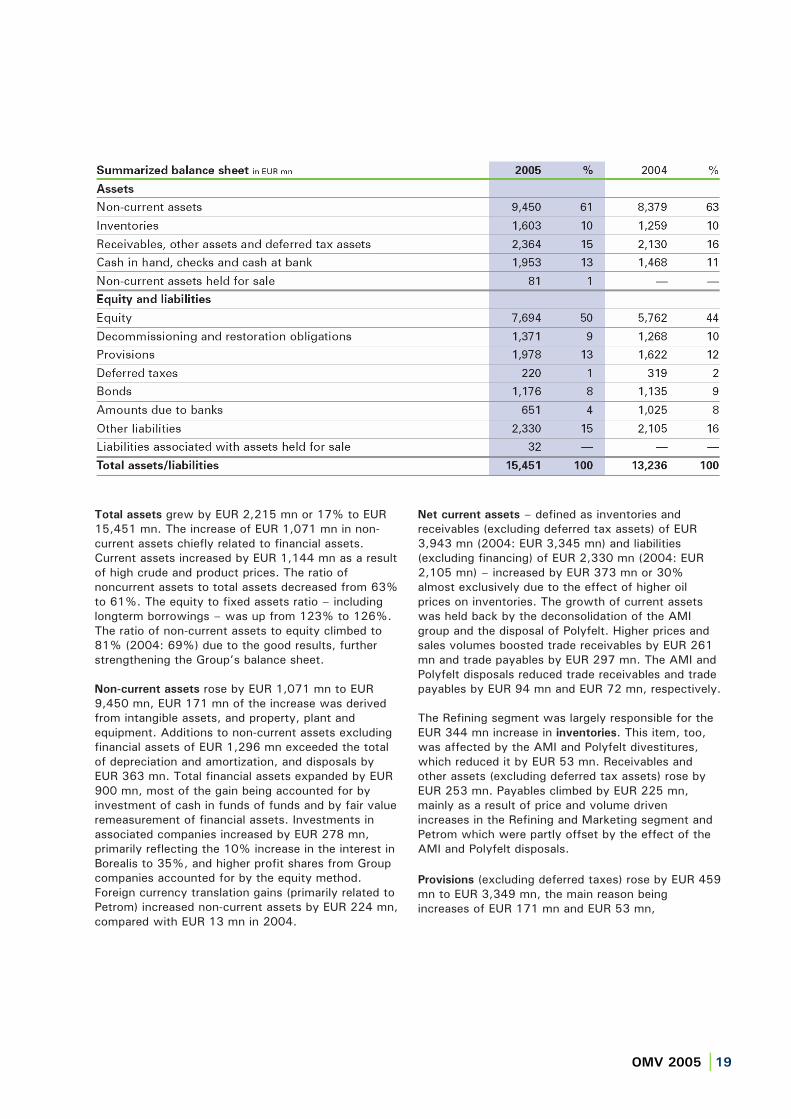
Total assets grew by EUR 2,215 mn or 17% to EUR 15,451 mn. The increase of EUR 1,071 mn in non-current assets chiefly related to financial assets. Current assets increased by EUR 1,144 mn as a result of high crude and product prices. The ratio of noncurrent assets to total assets decreased from 63% to 61%. The equity to fixed assets ratio – including longterm borrowings – was up from 123% to 126%. The ratio of non-current assets to equity climbed to 81% (2004: 69%) due to the good results, further strengthening the Group’s balance sheet.
Non-current assets rose by EUR 1,071 mn to EUR 9,450 mn, EUR 171 mn of the increase was derived from intangible assets, and property, plant and equipment. Additions to non-current assets excluding financial assets of EUR 1,296 mn exceeded the total of depreciation and amortization, and disposals by EUR 363 mn. Total financial assets expanded by EUR 900 mn, most of the gain being accounted for by investment of cash in funds of funds and by fair value remeasurement of financial assets. Investments in associated companies increased by EUR 278 mn, primarily reflecting the 10% increase in the interest in Borealis to 35%, and higher profit shares from Group companies accounted for by the equity method. Foreign currency translation gains (primarily related to Petrom) increased non-current assets by EUR 224 mn, compared with EUR 13 mn in 2004.
Net current assets – defined as inventories and receivables (excluding deferred tax assets) of EUR 3,943 mn (2004: EUR 3,345 mn) and liabilities (excluding financing) of EUR 2,330 mn (2004: EUR 2,105 mn) – increased by EUR 373 mn or 30% almost exclusively due to the effect of higher oil prices on inventories. The growth of current assets was held back by the deconsolidation of the AMI group and the disposal of Polyfelt. Higher prices and sales volumes boosted trade receivables by EUR 261 mn and trade payables by EUR 297 mn. The AMI and Polyfelt disposals reduced trade receivables and trade payables by EUR 94 mn and EUR 72 mn, respectively.
The Refining segment was largely responsible for the EUR 344 mn increase in inventories. This item, too, was affected by the AMI and Polyfelt divestitures, which reduced it by EUR 53 mn. Receivables and other assets (excluding deferred tax assets) rose by EUR 253 mn. Payables climbed by EUR 225 mn, mainly as a result of price and volume driven increases in the Refining and Marketing segment and Petrom which were partly offset by the effect of the AMI and Polyfelt disposals.
Provisions (excluding deferred taxes) rose by EUR 459 mn to EUR 3,349 mn, the main reason being increases of EUR 171 mn and EUR 53 mn,

OMV 2005 |20
respectively, in the provisions for current corporate tax and for personnel reduction programs. Provisions for decommissioning and restoration costs increased by EUR 102 mn, chiefly as a result of discount unwinding. Deferred taxes fell by EUR 99 mn.
The changes in financing structure stem from the Group’s excellent operating performance, which led to a fall of EUR 333 mn in interest-bearing debt and bonds, despite heavy investment (this amount is adjusted for translation-related changes in financial liabilities). Interest-bearing debts fell by EUR 374 mn, while cash in hand, checks and cash at bank rose by EUR 485 mn, Petrom accounted for EUR 188 mn of the increase.
Balance sheet structure in EUR mn
Gearing ratio
In 2004 the gearing ratio fell to 12% as a result of capital increases at OMV Aktiengesellschaft and Petrom, as well as a strong trading performance and the 49% minority interests in Petrom, which likewise widened the equity base. Another outstanding performance in 2005 led to a further reduction in debt.
As of December 31, 2005, long and short-term borrowings and bonds stood at EUR 1,827 mn (2004: EUR 2,160 mn) while cash in hand, checks and cash at bank (including current securities and investments) totaled EUR 1,953 mn (2004: EUR 1,468 mn). Cash and cash equivalents thus exceeded financial liabilities by EUR 126 mn at year end, whereas net debt at the end of 2004 had been EUR 692 mn. As of December 31, 2005, the gearing ratio, defined as net debt
divided by equity, was (2)% (2004: 12%).
Gearing ratio

OMV 2005 |21
Cash flow
Net cash from operating activities increased by EUR 1,069 mn or 103% to EUR 2,108 mn. The reconciliation of net income for the year to net cash from operating activities (before changes in working capital) resulted in a net upward adjustment of EUR 751 mn for 2005 (2004: EUR 331 mn). Depreciation and amortization of EUR 794 mn (2004: EUR 480 mn), deferred taxes of EUR 18 mn (2004: EUR 51 mn) and losses from the disposal of non-current assets of EUR 11 mn (2004: gains of EUR 114 mn) added overall to the cash flow. Long-term provisions (including employee benefit, and decommissioning and restoration obligations) resulted in a decrease of EUR 3 mn (2004: EUR 5 mn), and write-ups of non-current assets and other non-cash items in a reduction of EUR 68 mn (2004: EUR 81 mn). The other non-cash items principally relate to shares of associates’ profits less dividends, at EUR 54 mn (2004: EUR 51 mn).
Funds tied up in working capital as of December 31, 2005 were slightly down at EUR 139 mn (2004: EUR 18 mn). Increases in receivables of EUR 374 mn (2004: EUR 259 mn) and increases in inventories of EUR 386 mn (2004: EUR 35 mn) were chiefly attributable to higher prices. They were only partly financed by increases in liabilities at EUR 323 mn (2004: EUR 252 mn) and increases in short-term provisions at EUR 249 mn (2004: EUR 104 mn).
Net investment outflows of EUR 1,835 mn (2004: EUR 668 mn) were partly offset by inflows in form of proceeds from the sale of non-current assets amounting to EUR 149 mn (2004: EUR 210 mn).
Consolidation of a company previously accounted for by the equity method added EUR 6 mn to cash flow, whereas acquisitions of subsidiaries net of cash acquired had led to cash outflows amounting to EUR 461 mn in 2004. Proceeds from the sale of Group companies less cash and cash equivalents – adjusted for repayments of intragroup loans – were EUR 358 mn (2004: nil). Net cash from financing activities
totaled EUR 1,334 mn (2004: EUR 888 mn).
Long-term borrowings of EUR 352 mn (2004: EUR 297 mn) were repaid from cash flow, whereas the increases in long and short-term borrowings were only EUR 120 mn (2004: EUR 757 mn). Cash outflows for dividend payments amounted to EUR 134 mn (2004: EUR 108 mn). Cash outflows from financing activities
were EUR 366 mn (2004: cash inflows of EUR 1,028 mn).
Cash flows in EUR mn
Risk management
OMV is an integrated international oil group. Its operations extend from hydrocarbon exploration and production (E&P), and processing (Refining) through to trading and marketing (Supply, Marketing and Gas).
Along with the entire oil and gas industry, the Group is exposed to a variety of risks, including operational and market risks. OMV takes the view that in the long-term some of the risks associated with the downstream business are naturally hedged by opposite trends in the upstream operations. However, the balancing effects of integration in terms of opposing industry risks often lag and may even be completely absent in the short-term. As a result, OMV’s risk management activities focus on the specific net risk exposure associated with a given portfolio.
The Group’s enterprise wide risk management (EWRM) system has enhanced risk awareness and management skills across all areas of the organization, including subsidiaries in 17 different countries. Twice-yearly EWRM reports the main risks and their potential impact, in addition to detailing recent developments and actions taken. In compliance with the Austrian Code of Corporate Governance, the effectiveness of the system is reviewed by an external auditor on an annual basis. In October, the EWRM risk identification and assessment system was applied at Petrom for the first time.
In addition, OMV researches and analyzes information on the political environments in each of its geographic markets, and assesses country risk before entering new countries.
OMV 2005 |22
A Group-wide environmental risk reporting system is used to evaluate existing and potential obligations. Group emission risks are aggregated and monitored on an ongoing basis, and then reviewed by an operating committee.
During the year, financial risks associated with currencies – especially dollar/euro exchange rate risk – were analyzed, taking Petrom’s positions into account. This did not result in any hedging operations. To balance the Group’s interest rate portfolio, parts of dollar and euro denominated loans were converted from fixed to variable rates, according to predefined
rules. Credit risk associated with the Group’s principal counterparties continues to be managed by Group Treasury on the basis of country and bank limits. Commodity price risk management, based on a business at risk model, ensures that income streams are adequate to finance planned investments, and that the Group retains a good investment grade rating. The Executive Board is now responsible for decisions regarding the use of hedging instruments, following a recommendation by the Operating Committee. Due to strong cash generation in the Group, no additional steps were taken in 2005 to hedge against risks.
Health, safety and environment
In 2005, health, safety and environmental activities focused on integrating Petrom into OMV’s HSE management system and setting new targets for Group HSE performance up to 2010. The first year of involvement in Petrom’s operations was considered an evaluation and system design phase, including the introduction of Group reporting. Emphasis was placed on detailed assessment of environmental status, medical services, process risks and safety practices at all production sites. Short-term action plans and long-term programs were drawn up on the basis of these findings, and were included in the EUR 3 bn investment program for the period through to 2010.
We regret to have to report 11 fatalities, of which three concerned Petrom employees, seven Petrom
contractors and one OMV contractor. This figure is unacceptable to the OMV Group, and therefore top priority will be given to safety in 2006, with a strong focus on Petrom and its contractors. OMV’s safety record has improved by 66% in terms of the lost time incident rate (LTIR) since 2001.
Due to its pioneering role with regard to environmentally friendlier products, during the year under review the Group launched a number of innovative products designed to reduce emissions. Since October 1, 2005, OMV has been selling biodiesel with a 5% biofuel component at all its filling stations in Austria and Germany.
Outlook for 2006
In 2006 management will focus on further driving the integration of Petrom. In 2005, more than 100 experienced OMV employees were assigned to Petrom, initial restructuring projects were launched, and some quick wins were realized. Modernization will continue at Petrom for some years to come. Extensive investment will enable the implementation of state-of-the-art technologies, the roll-out of new systems, and further centralization of the organizational structure of the company.
We expect the main market drivers including crude prices, refining margins and the dollar exchange rate to remain highly volatile in 2006.
We see crude prices staying at high levels overall, although with considerable short-term fluctuations. Regarding the USD exchange rate, we see the dollar weakening slightly in comparison to last year.
Refinery margins were exceptionally strong in 2005, driven in part by the autumn hurricanes. We expect them to be lower in 2006, and they have already come under pressure at times – especially at the start of 2006. However, we anticipate a recovery over the course of the year. The spread between Brent and Ural prices – which has been unusually wide since 2004 – is expected to hold at around the 2005 levels.
Petrom’s results will no longer be presented as a separate business segment in the accounts from 2006. EBIT will instead be reported within the E&P, R&M and Gas segments.
E&P has already achieved its 2008 volume targets in 2005. The revised strategy for the segment targets oil and gas production of 500,000 boe/d by 2010. The main investment priorities for 2006 will be appraising
OMV 2005 |23
the Strasshof gas field in Austria, as well as developing fields in New Zealand and Yemen, together with projects in Kazakhstan and Romania, and bringing the Pohokura gas field on stream in New Zealand. The environment for further acquisitions is very challenging and competitive due to high oil prices. However, we are continuously evaluating takeover targets. For 2006 we expect almost unchanged production volumes.
We expect R&M to face lower refining margins, and see retail margins remaining tight due to continued high prices. We are looking for increased refining output, despite a scheduled four-week turnaround at the Arpechim plant in Romania, due to the cracker expansion which came on stream at Schwechat in 2005 and improved capacity utilization at Petrom’s refineries. The continued strong expansion of the retail network in growth markets, and improved quality at Petrom stations should give a boost to the Marketing segment’s sales volumes. However, we do not foresee volume growth being sufficient compensation for the anticipated fall in refining margins. The focus of investment in 2006 will be on modernizing the Petrom refineries, commencing the construction of a thermal cracker at Schwechat to enable more heavy crudes to be processed, and
further expansion of the filling station network. A major refinery restructuring concept will be initiated at Bayernoil, with the objective of aligning the company’s complex network of refineries with future market demands.
In the Gas segment, the strategically most important project remains the Nabucco pipeline, aimed at bringing gas from the Near East to Central Europe. This project is still in the development phase, during which all technical, legal, commercial and financial issues are being investigated.
Annual average investments of EUR 1.7 bn are planned over the next few years in order to maintain growth momentum and continue to modernize Petrom’s operations. Approximately EUR 600 mn per year will be allocated to Petrom. All investment decisions are centered on a value based approach, which is essential if we are to meet our target of a 13% ROACE over the course of a business cycle, given average market indicators.
To sum up, despite an environment expected on balance to be somewhat more challenging than last year, we will strive to achieve a similar result to that realized in 2005.
Vienna, March 8, 2006
The Executive Board
Wolfgang Ruttenstorfer Gerhard Roiss Chairman Deputy Chairman
David C. Davies Helmut Langanger
Abbreviations and definitions
OMV 2005 |24
ACC Austrian Commercial Code
bbl, bbl/d barrels (1 barrel equals approximately 159 liters), barrels per day
bn billion
boe, boe/d barrels of oil equivalent, boe per day
bcf, bcm billion standard cubic feet (60 °F/16 °C), billion cubic meters (32 °F/0 °C)
CAPEX capital expenditure
capital employed equity including minorities plus net debt and provisions for pensions, less securities used for asset coverage of pension provisions
cbm, cf standard cubic meters, standard cubic feet
CFP cash flow from operating activities per share
Co&O Corporate and Other
EBIT earnings before interest and tax
equity ratio stockholders’ equity divided by balance sheet total expressed as a percentage
EU European Union
EUR euro
EPS earnings per share
E&P Exploration and Production
finding cost total exploration expenses divided by changes in proved reserves (extensions, discoveries and revisions of previous estimates)
gearing ratio net debt divided by stockholders’ equity expressed as a percentage
IAS, IFRS International Accounting Standards, International Financial Reporting Standards
mn million
monomers collective term for ethylene and propylene
net debt bank debt less liquid funds (cash and cash equivalents)
net income net operating profit after interest, tax and extraordinary items
NOPAT net operating profit after tax; profit on ordinary activities after taxes plus net interest on net borrowings and interest on pensions, less extraordinary result plus/minus tax effect of adjustments
NGL natural gas liquids; natural gas which is extracted in liquid form during the production of hydrocarbons payout ratio total dividend payment divided by net income after minorities expressed as a percentage
PCF, price cash flow ratio; share price divided by cash flow from operating activities per share
production cost cost of material and personnel during production excluding royalties (OPEX)
PRT, PRRT Petroleum Revenue Tax, Petroleum Resource Rent Tax
ROfA, return on fixed assets; EBIT divided by average intangible and tangible assets expressed as a percentage
ROACE, return on average capital employed; NOPAT divided by average capital employed expressed as a percentage
ROE, return on equity; net income for the year divided by average stockholders’ equity expressed as a percentage
R&M Refining and Marketing including petrochemicals
SEC United States Securities and Exchange Commission
SFAS Statement on Financial Accounting Standards
t, toe metric ton, ton of oil equivalent
USD US dollar
WACC weighted average cost of capital
For more abbreviations and definitions please visit www.omv.com > Communication > Glossary.
Annual accounts 2005
OMV 2005 |25
Annual accounts of OMV Aktiengesellschaft
Balance sheet Statement of income Statement of untaxed reserves Statement of fixed assets
26282930
Notes to the accounts of OMV Aktiengesellschaft
Accounting and valuation principles Stock option plan Notes to the balance sheet Notes to the statement of income Governing bodies and employees Dividend recommendation
323337434546
List of investments Auditors’ opinion Contacts
474849
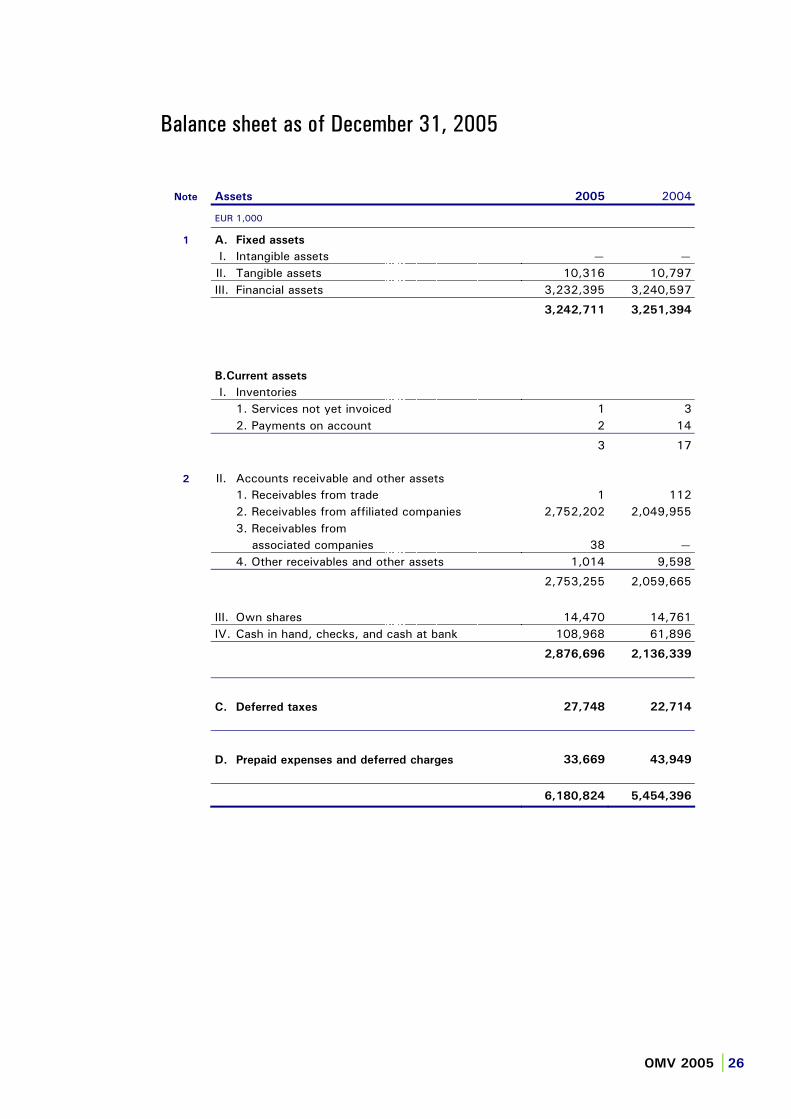
Balance sheet as of December 31, 2005
OMV 2005 |26
Note Assets 2005 2004
EUR 1,000
1 A. Fixed assets
I. Intangible assets — — II. Tangible assets 10,316 10,797 III. Financial assets 3,232,395 3,240,597
3,242,711 3,251,394
B.Current assets
I. Inventories 1. Services not yet invoiced 1 3 2. Payments on account 2 14
3 17
2 II. Accounts receivable and other assets 1. Receivables from trade 1 112 2. Receivables from affiliated companies 2,752,202 2,049,955 3. Receivables from associated companies 38 — 4. Other receivables and other assets 1,014 9,598
2,753,255 2,059,665
III. Own shares 14,470 14,761 IV. Cash in hand, checks, and cash at bank 108,968 61,896
2,876,696 2,136,339
C. Deferred taxes 27,748 22,714
D. Prepaid expenses and deferred charges 33,669 43,949
6,180,824 5,454,396

OMV 2005| 27
Note Liabilities 2005 2004
EUR 1,000
3 A. Stockholders’ equity
I. Capital stock 300,001 218,100 II. Capital reserves 1. appropriate 1,006,560 1,034,475 2. unappropriated 334 334 III. Revenue reserves 2,818,519 2,058,072IV. Treasury stock 14,470 14,761 V. Unappropriated income 269,148 131,414 [thereof income brought forward in 2005] [—] [67]
4,409,032 3,457,156
4 B. Untaxed reserves
1. Valuation reserve for special depreciation allowances 5,669 5,669 2. Other untaxed reserves — 17,572
5,669 23,241
5 C. Provisions
1. Provisions for severance payments 5,276 3,354 2. Provisions for pensions 5,851 — 3. Provisions for taxes 20,840 27,846 4. Other provisions 51,835 25,390
83,802 56,590
6 D. Liabilities
1. Bonds [thereof convertible: TEUR 549,978] 799,978 800,000 2. Amounts due to banks 257,416 301,282 3. Accounts payable from trade 12,334 71,364 4. Accounts payable to affiliated companies 365,372 556,568 5. Accounts payable to associated companies — 73 6. Other liabilities 247,112 188,122
1,682,212 1,917,409
E. Deferred income 109 —
6,180,824 5,454,396
7 Contingent liabilities 542,690 539,612
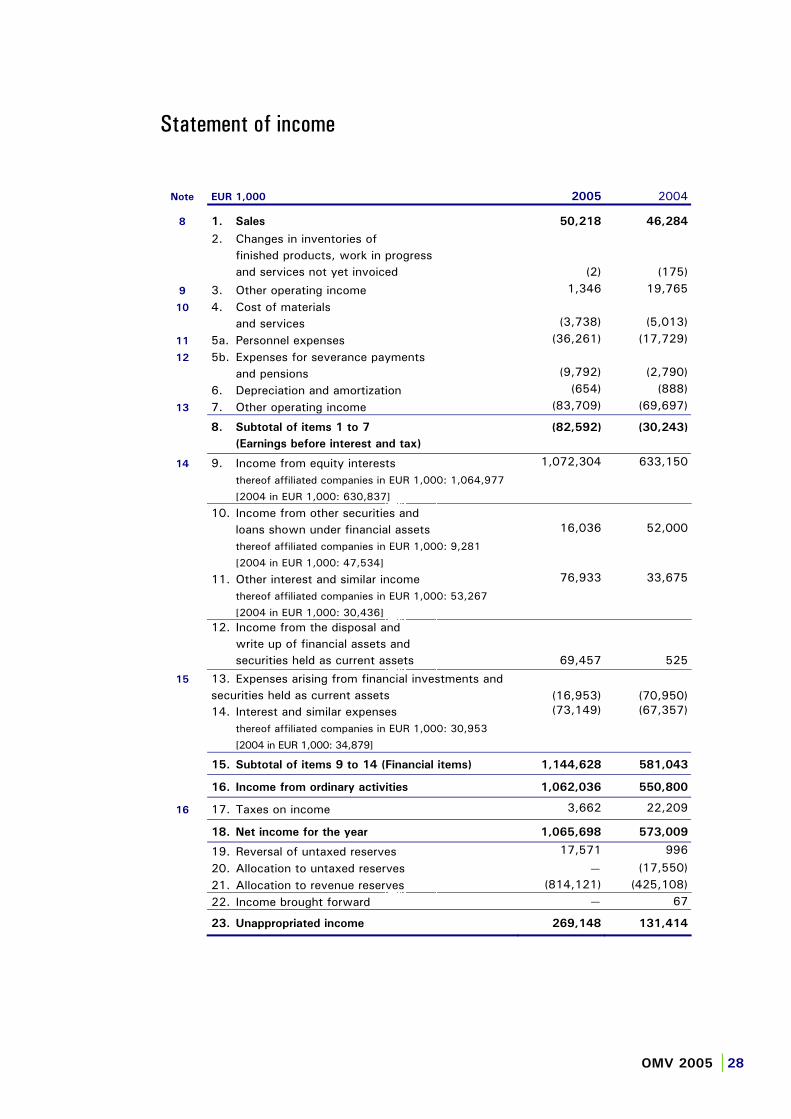
Statement of income
OMV 2005 |28
Note EUR 1,000 2005 2004
8 1. Sales 50,218 46,284
2. Changes in inventories of finished products, work in progress and services not yet invoiced (2) (175)
9 3. Other operating income 1,346 19,765
10 4. Cost of materials and services (3,738) (5,013)
11 5a. Personnel expenses (36,261) (17,729)
12 5b. Expenses for severance payments and pensions (9,792) (2,790)
6. Depreciation and amortization (654) (888)
13 7. Other operating income (83,709) (69,697)
8. Subtotal of items 1 to 7
(Earnings before interest and tax)
(82,592) (30,243)
14 9. Income from equity interests 1,072,304 633,150
thereof affiliated companies in EUR 1,000: 1,064,977
[2004 in EUR 1,000: 630,837]
10. Income from other securities and loans shown under financial assets 16,036 52,000
thereof affiliated companies in EUR 1,000: 9,281
[2004 in EUR 1,000: 47,534]
11. Other interest and similar income 76,933 33,675
thereof affiliated companies in EUR 1,000: 53,267
[2004 in EUR 1,000: 30,436]12. Income from the disposal and write up of financial assets and securities held as current assets 69,457 525
15 13. Expenses arising from financial investments and securities held as current assets (16,953) (70,950) 14. Interest and similar expenses (73,149) (67,357)
thereof affiliated companies in EUR 1,000: 30,953
[2004 in EUR 1,000: 34,879]
15. Subtotal of items 9 to 14 (Financial items) 1,144,628 581,043
16. Income from ordinary activities 1,062,036 550,800
16 17. Taxes on income 3,662 22,209
18. Net income for the year 1,065,698 573,009
19. Reversal of untaxed reserves 17,571 996
20. Allocation to untaxed reserves — (17,550) 21. Allocation to revenue reserves (814,121) (425,108) 22. Income brought forward — 67
23. Unappropriated income 269,148 131,414

Statement of untaxed reserves
OMV 2005 |29
EUR 1,000
As of January 1,
2005
Additions/ Consumptions
Reversals As of December 31,
2005
Valuation reserve for special depreciation allowances I. Tangible assets
1. Land and buildings 5,669 — — 5,669
5,669 — — 5,669
Other untaxed reserves 1. Investment allowance under section 10 Income Tax Act
2000 21 — 21 — 2. Transfer reserve under section 12 Income Tax Act 17,550 — 17,550 —
17,571 — 17,571 5,669
23,240 — 17,571 5,669

Statement of fixed assets under section 226 para 1 ACC
OMV 2005 |30
EUR 1,000
As of January 1, 2005
Additions Transfers
I. Intangible assets
1. Concessions, patents similar rights and licenses 4 — — 2. Goodwill — — —
4 — —
II. Tangible assets 1. Land and buildings 21,039 — — 2. Plant and equipment 1,602 — — 3. Other fixed assets, tools and equipment 5,462 172 — 4. Payments on account and assets under construction — — —
28,103 172 —
III. Financial assets 1. Investments in affiliated companies 2,881,642 7,095 (243,807) 2. Loans to affiliated companies 299,563 39,700 — 3. Investments 253,833 3,559 243,807 4. Securities (loan stock rights) of fixed assets 34,176 83,211 5. Other loans 77,879 2,600 —
3,547,093 136,165 —
3,575,200 136,337 —
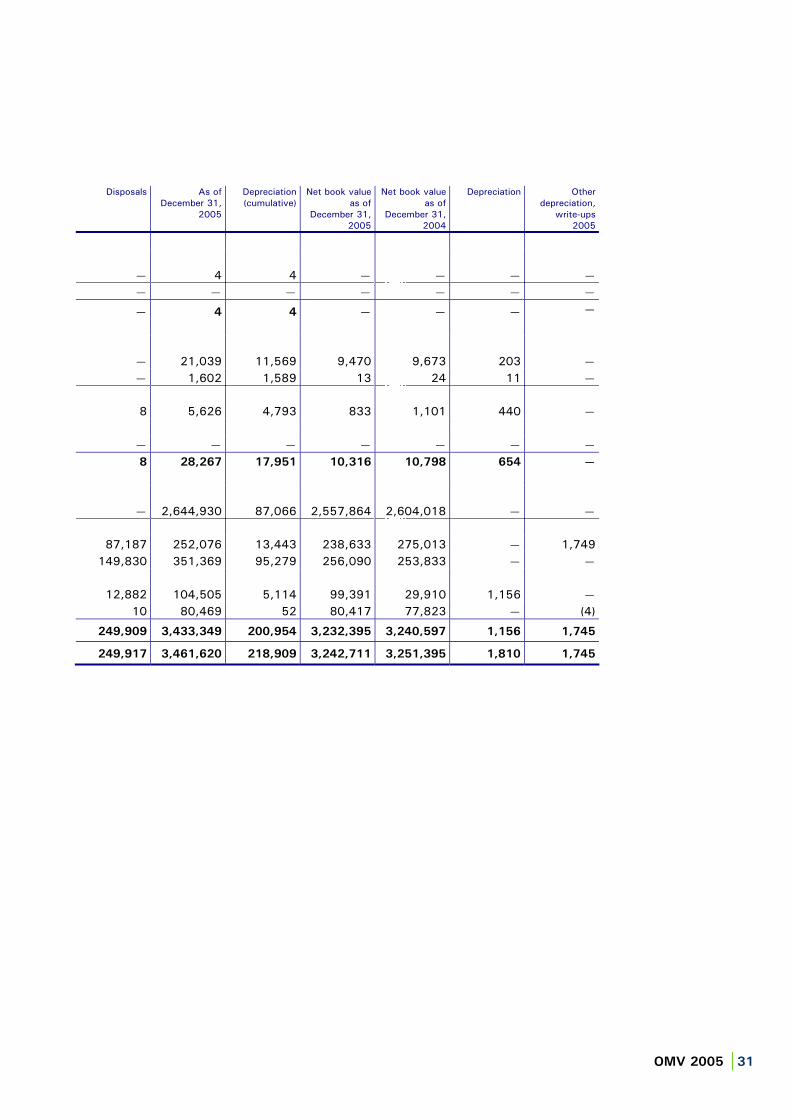
OMV 2005 |31
Disposals As of December 31,
2005
Depreciation (cumulative)
Net book value as of
December 31, 2005
Net book value as of
December 31, 2004
Depreciation Other depreciation,
write-ups 2005
— 4 4 — — — — — — — — — — —
— 4 4 — — — —
— 21,039 11,569 9,470 9,673 203 — — 1,602 1,589 13 24 11 —
8 5,626 4,793 833 1,101 440 —
— — — — — — — 8 28,267 17,951 10,316 10,798 654 —
— 2,644,930 87,066 2,557,864 2,604,018 — —
87,187 252,076 13,443 238,633 275,013 — 1,749 149,830 351,369 95,279 256,090 253,833 — —
12,882 104,505 5,114 99,391 29,910 1,156 — 10 80,469 52 80,417 77,823 — (4)
249,909 3,433,349 200,954 3,232,395 3,240,597 1,156 1,745
249,917 3,461,620 218,909 3,242,711 3,251,395 1,810 1,745
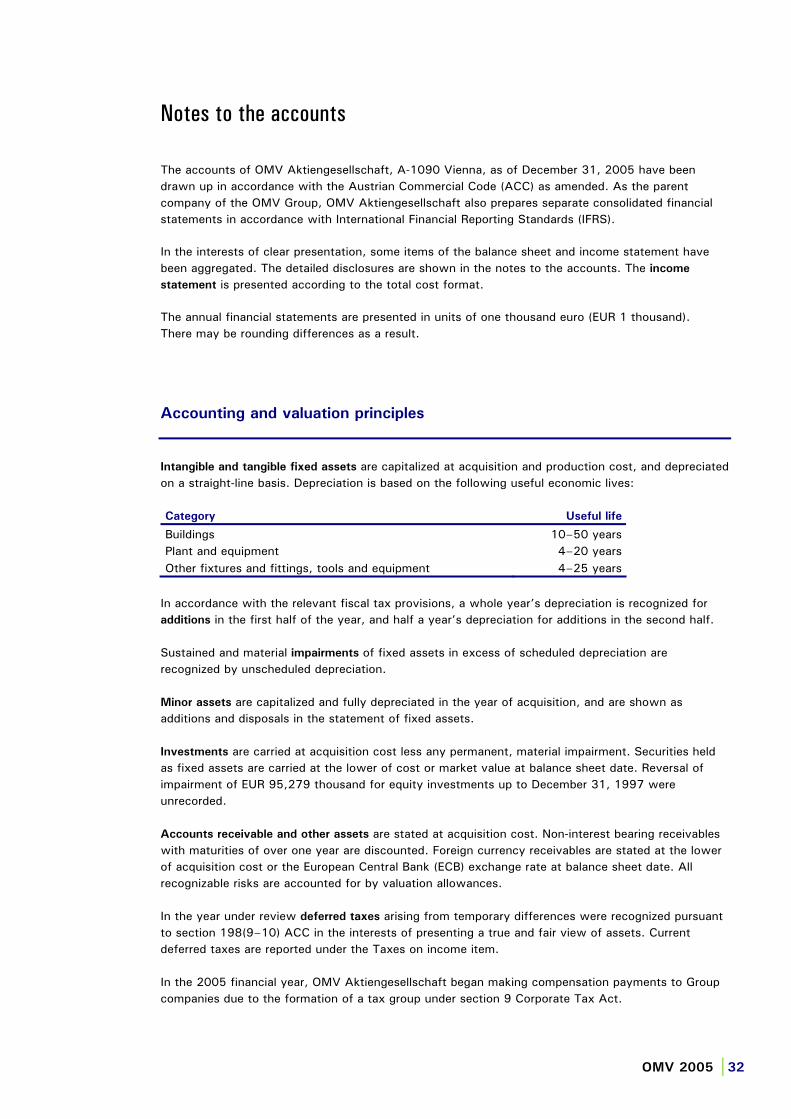
Notes to the accounts
OMV 2005 |32
The accounts of OMV Aktiengesellschaft, A-1090 Vienna, as of December 31, 2005 have been drawn up in accordance with the Austrian Commercial Code (ACC) as amended. As the parent company of the OMV Group, OMV Aktiengesellschaft also prepares separate consolidated financial statements in accordance with International Financial Reporting Standards (IFRS).
In the interests of clear presentation, some items of the balance sheet and income statement have been aggregated. The detailed disclosures are shown in the notes to the accounts. The income
statement is presented according to the total cost format.
The annual financial statements are presented in units of one thousand euro (EUR 1 thousand). There may be rounding differences as a result.
Accounting and valuation principles
Intangible and tangible fixed assets are capitalized at acquisition and production cost, and depreciated on a straight-line basis. Depreciation is based on the following useful economic lives:
Category Useful life
Buildings 10–50 years Plant and equipment 4–20 years Other fixtures and fittings, tools and equipment 4–25 years
In accordance with the relevant fiscal tax provisions, a whole year’s depreciation is recognized for additions in the first half of the year, and half a year’s depreciation for additions in the second half.
Sustained and material impairments of fixed assets in excess of scheduled depreciation are recognized by unscheduled depreciation.
Minor assets are capitalized and fully depreciated in the year of acquisition, and are shown as additions and disposals in the statement of fixed assets.
Investments are carried at acquisition cost less any permanent, material impairment. Securities held as fixed assets are carried at the lower of cost or market value at balance sheet date. Reversal of impairment of EUR 95,279 thousand for equity investments up to December 31, 1997 were unrecorded.
Accounts receivable and other assets are stated at acquisition cost. Non-interest bearing receivables with maturities of over one year are discounted. Foreign currency receivables are stated at the lower of acquisition cost or the European Central Bank (ECB) exchange rate at balance sheet date. All recognizable risks are accounted for by valuation allowances.
In the year under review deferred taxes arising from temporary differences were recognized pursuant to section 198(9–10) ACC in the interests of presenting a true and fair view of assets. Current deferred taxes are reported under the Taxes on income item.
In the 2005 financial year, OMV Aktiengesellschaft began making compensation payments to Group companies due to the formation of a tax group under section 9 Corporate Tax Act.

OMV 2005 |33
Due to the changeover of OMV Group financial reporting to IFRS in 2005, the provisions for severance payments, jubilee payments and pensions reported in the company accounts of OMV Aktiengesellschaft are now calculated in accordance with IAS 19 instead of the discounted standard entry age method. The changeover took place on January 1, 2005. The resultant differences added EUR 1,783 thousand to provisions for severance payments and EUR 5,785 thousand to those for pensions, and reduced the provisions for jubilee payments by EUR 25 thousand; they were fully recognized as income or expense for the financial year in question.
OMV Aktiengesellschaft has both defined contribution and defined benefit pension plans. In the case of the defined contribution plans, OMV Aktiengesellschaft no longer has any obligations beyond payment of the agreed premiums, and therefore no provision is made. However, commitments are made to participants in defined benefit plans to pay specific pensions, and the related risk to be borne by the Company.
Provisions for pensions, severance payments and jubilee payments are calculated using the projected unit credit method, which spreads the estimated benefit payments over the entire duration of employment, and thus takes future salary increases into account. In calculating pensions and severance payments provisions, actuarial gains and losses falling within a corridor of 10% of the greater of projected benefit obligations and plan assets — measured in both cases at the beginning of the year — are not recognized. Actuarial gains and losses falling outside this corridor are distributed according to the average remaining years of service of the active participants in the plan. Interest expense accruing on pension provisions together with income from plan assets is disclosed under the financial result.
The Company’s pension obligations are fulfilled by payments to an external pension fund. These are reported as expenses for pensions.
Liabilities arising from personnel separations are recognized if the amounts are fixed and a detailed plan, approved by management, is in existence before the balance sheet date, and is irrevocable. The 2004 ASVG Reform led to an overall reduction in obligations arising from personnel separations.
All risks recognizable in the light of sound commercial judgement and contingent liabilities are provided for.
Liabilities are stated at the higher of nominal value or the amount repayable. Foreign currency liabilities are stated at the higher of cost or the European Central Bank (ECB) exchange rate at balance sheet date.
Stock option plan
On the basis of resolutions of the respective annual stockholders’ meetings, since 2000 the Company has operated long-term performance related remuneration plans for the Executive Board and certain senior executives of Group companies. Under these plans the above persons are granted options to acquire OMV stock (or the monetary equivalent of such rights) at preferential terms, subject to own investments, on condition that the Company’s stock price rises by at least 15%. The table below is adjusted for the ten-for-one stock split undertaken in 2005.
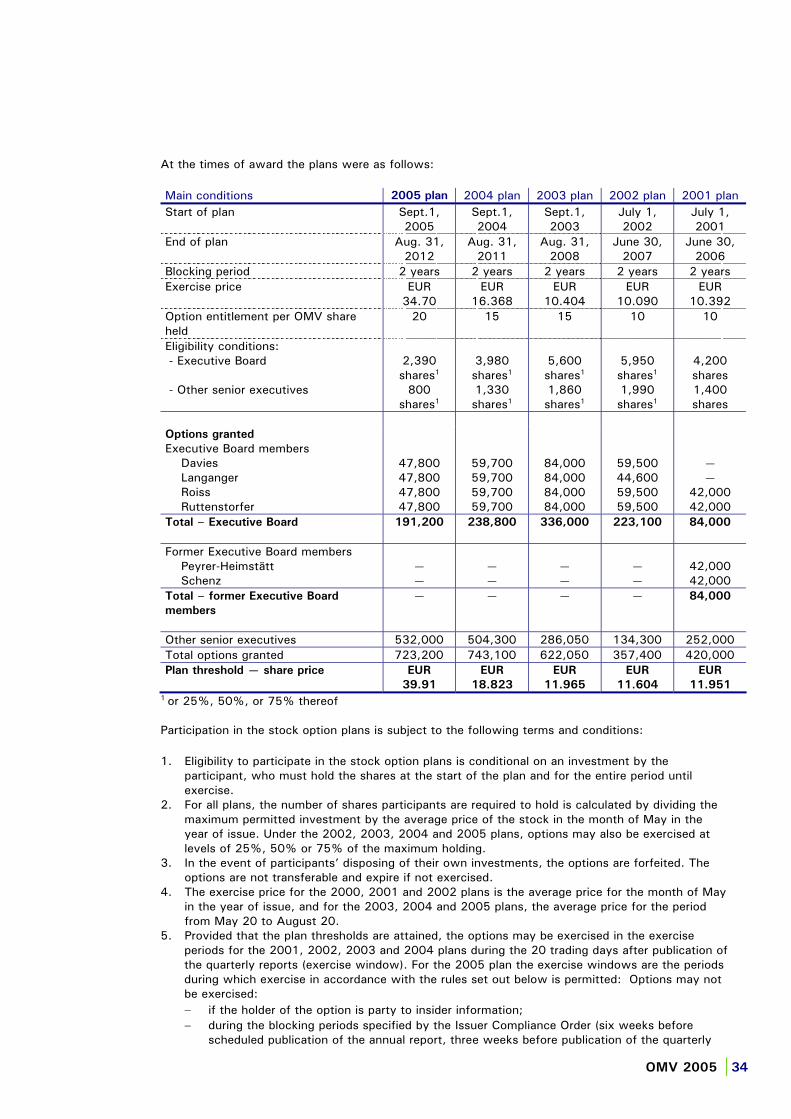
OMV 2005 |34
At the times of award the plans were as follows:
Main conditions 2005 plan 2004 plan 2003 plan 2002 plan 2001 plan Start of plan Sept.1,
2005 Sept.1,2004
Sept.1,2003
July 1, 2002
July 1, 2001
End of plan Aug. 31, 2012
Aug. 31, 2011
Aug. 31, 2008
June 30, 2007
June 30, 2006
Blocking period 2 years 2 years 2 years 2 years 2 years Exercise price EUR
34.70 EUR
16.368 EUR
10.404 EUR
10.090 EUR
10.392 Option entitlement per OMV share held
20 15 15 10 10
Eligibility conditions: - Executive Board
- Other senior executives
2,390 shares1
800shares1
3,980 shares1
1,330 shares1
5,600 shares1
1,860 shares1
5,950 shares1
1,990 shares1
4,200 shares1,400 shares
Options granted
Executive Board members Davies Langanger Roiss Ruttenstorfer
47,800 47,800 47,800 47,800
59,700 59,700 59,700 59,700
84,000 84,000 84,000 84,000
59,500 44,600 59,500 59,500
——
42,000 42,000
Total – Executive Board 191,200 238,800 336,000 223,100 84,000
Former Executive Board members Peyrer-Heimstätt Schenz
——
——
——
——
42,000 42,000
Total – former Executive Board
members
— — — — 84,000
Other senior executives 532,000 504,300 286,050 134,300 252,000 Total options granted 723,200 743,100 622,050 357,400 420,000 Plan threshold — share price EUR
39.91
EUR
18.823
EUR
11.965
EUR
11.604
EUR
11.951 1 or 25%, 50%, or 75% thereof
Participation in the stock option plans is subject to the following terms and conditions:
1. Eligibility to participate in the stock option plans is conditional on an investment by the participant, who must hold the shares at the start of the plan and for the entire period until exercise.
2. For all plans, the number of shares participants are required to hold is calculated by dividing the maximum permitted investment by the average price of the stock in the month of May in the year of issue. Under the 2002, 2003, 2004 and 2005 plans, options may also be exercised at levels of 25%, 50% or 75% of the maximum holding.
3. In the event of participants’ disposing of their own investments, the options are forfeited. The options are not transferable and expire if not exercised.
4. The exercise price for the 2000, 2001 and 2002 plans is the average price for the month of May in the year of issue, and for the 2003, 2004 and 2005 plans, the average price for the period from May 20 to August 20.
5. Provided that the plan thresholds are attained, the options may be exercised in the exercise periods for the 2001, 2002, 2003 and 2004 plans during the 20 trading days after publication of the quarterly reports (exercise window). For the 2005 plan the exercise windows are the periods during which exercise in accordance with the rules set out below is permitted: Options may not be exercised:
if the holder of the option is party to insider information; during the blocking periods specified by the Issuer Compliance Order (six weeks before scheduled publication of the annual report, three weeks before publication of the quarterly

OMV 2005 |35
report or any other blocking periods established by compliance officers on a case-by-case basis);if the Executive Board prohibits exercise for the duration of a period explicitly determined by the Board.
6. Evidence of the participant’s own investment in the Company must be furnished when exercising an option. The options may be exercised by purchasing the shares, by requesting payment of the difference between the current share price and the exercise price in cash, or by requesting payment in the form of shares, if OMV's share price is at least 15% above the exercise price at the
time of exercise.
Movements in options under the stock option plans for the 2005 and 2004 financial years were as follows:
2005 2004 Options Weighted
average exercise price
Options Weighted average
exercise price
Number EUR Number EUR Outstanding options as of Jan. 1 Options granted Options exrecised Lapsed options Outstanding options as of Dec. 31 Exercisable at year end
1,516,350 723,200
(479,400) —
1,760,150 293,850
13.297 34.700 10.309
—22.904 10.404
1,297,050 743,100
(523,800) —
1,516,350 151,200
10.251 16.368 10.113
—13.297 10.102
During the year under review, 479,400 options granted under the 2001, 2002 and 2003 plans were exercised. In the case of 453,200 options the difference between the current stock price and the exercise price was paid; the amount due in respect of 450 options was paid in stock. The exercise of 26,200 options took the form of the purchase of stock. In 2005, the weighted average stock price at the time of exercise was EUR 43.18. The intrinsic value of the shares available for exercise was EUR 11,488 thousand at balance sheet date.
During 2004, 523,800 options granted under the 2000, 2001 and 2002 plans were exercised. In all cases exercise took the form of payment of the difference between the current stock price and the exercise price; the amount due in respect of 33,300 options was paid in shares. In 2004, the weighted average stock price at the time of exercise was EUR 16.49. The intrinsic value of the shares available for exercise as of December 31, 2004 was EUR 1,825 thousand.
2005 2004 Exercise of options by plan participants
Optionsexercised
Average exercise price
Optionsexercised
Average exercise price
Executive Board members: Davies Langanger Roiss Ruttenstorfer
59,500 —
110,200 59,500
10.090 —
10.329 10.090
—44,600 75,300 42,000
—10.090 10.258 10.392
Total, Executive Board
Former Executive Board members: Schenz
229,200
—
10.205
—
161,900
42,000
10.247
10.392 Total, former Executive Board
members
Total, other senior executives
—
250,200
—
10.404
42,000
319,900
10.392
10.090 Total number of options exercised 479,400 10.309 523,800 10.113

OMV 2005 |36
No compensation expense arising from the exercise of options granted under the 2000 plan was reported under personnel expenses during the year under review (2004: EUR 415 thousand). Expense arising from the 2001 plan was EUR 199 thousand (2004: EUR 1,135 thousand), that arising from the 2002 plan EUR 4,296 thousand (2004: EUR 1,784 thousand), and that arising from the 2003 plan EUR 11,265 thousand (2004: nil).
As of December 31, 2005 outstanding options under the various plans were as follows:
Exercise price Outstanding options Maturities in years Exercisable at year end
10.404 16.368 34.700
293,850 743,100 723,200
2,75,76,7
293,850 ——
1,760,150 293,850
Valuation of the options is according to the Black-Scholes-model. The expected average stock price volatility was calculated on the basis of the volatility exhibited by the price over the past three years. The possibility of premature exercise has been accounted for by determining the risk-free interest rate on the basis of market rates at balance sheet date.
Fair value at balance sheet date was calculated on the basis of the outstanding options, while the fair value as of the time of award is based on the total number of options granted. Assuming that the conditions for exercise are fulfilled during the exercise period, the fair value of the stock option plans is as follows:
2005 plan 2004 plan 2003 plan 2002 plan 2001 plan
Valuation as of Dec. 31,
2005
Dec. 31,
2005
Dec. 31,
2005
Fair value of plan (EUR 1,000) 13,639 22,141 10,825 Calculation variables: - Market price of stock (EUR) - Risk-free rate - Remaining term of options (including blocking period) - Avarage dividend yield - Stock price valatility
49.50 3.270% 6.7 years
2.4%30%
49.50 3.223% 5.7 years
2.4%30%
49.50 3.009% 2.7 years
2.2%30%
Exercised Exercised
Valuation at time of award Sept. 1,
2005
Sept. 1,
2004
Sept. 1,
2003
July 1,
2002
July 1,
2001
Market value of plan (EUR 1,000)
10,987 3,605 882 541 743
Calculation variables: - Market price of stock (EUR) - Risk-free rate - Remaining term of options (including blocking period) - Average dividend yield - Stock price volatility
44.50 3.00%7 years
2.6%30%
18.56 3.83%7 years
3.2%22%
10.57 3.7%
5 years
4.8%21%
10.00 4.8%
5 years
4.6%21%
10.22 5.25%5 years
4%21%
Provision is made for the expected future cost of unexercised options on the basis of the fair values at balance sheet date. In the case of new plans, the expense is spread over the two-year blocking period. At balance sheet date some 1,319,606 own shares were held as cover for 1,760,150 options. A provision amounting to EUR 6,975 thousand (2004: nil) has been made as the number of own shares does not fully cover the fair value of the options (calculated according to the Black-Scholes-model).
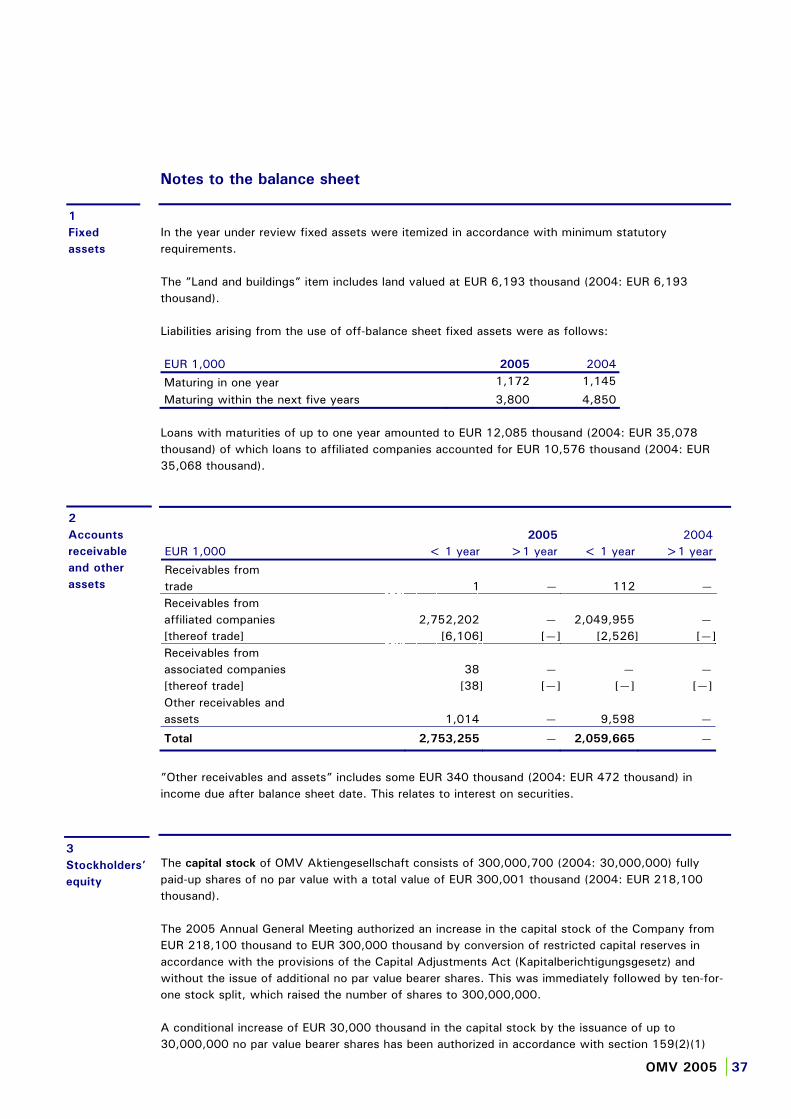
OMV 2005 |37
Notes to the balance sheet
In the year under review fixed assets were itemized in accordance with minimum statutory requirements.
The ”Land and buildings” item includes land valued at EUR 6,193 thousand (2004: EUR 6,193 thousand).
Liabilities arising from the use of off-balance sheet fixed assets were as follows:
EUR 1,000 2005 2004
Maturing in one year 1,172 1,145
Maturing within the next five years 3,800 4,850
Loans with maturities of up to one year amounted to EUR 12,085 thousand (2004: EUR 35,078 thousand) of which loans to affiliated companies accounted for EUR 10,576 thousand (2004: EUR 35,068 thousand).
2005 2004 EUR 1,000 < 1 year >1 year < 1 year >1 year
Receivables from trade 1 — 112 — Receivables from affiliated companies 2,752,202 — 2,049,955 — [thereof trade] [6,106] [—] [2,526] [—]Receivables from associated companies 38 — — — [thereof trade] [38] [—] [—] [—] Other receivables and assets 1,014 — 9,598 —
Total 2,753,255 — 2,059,665 —
”Other receivables and assets” includes some EUR 340 thousand (2004: EUR 472 thousand) in income due after balance sheet date. This relates to interest on securities.
The capital stock of OMV Aktiengesellschaft consists of 300,000,700 (2004: 30,000,000) fully paid-up shares of no par value with a total value of EUR 300,001 thousand (2004: EUR 218,100 thousand).
The 2005 Annual General Meeting authorized an increase in the capital stock of the Company from EUR 218,100 thousand to EUR 300,000 thousand by conversion of restricted capital reserves in accordance with the provisions of the Capital Adjustments Act (Kapitalberichtigungsgesetz) and without the issue of additional no par value bearer shares. This was immediately followed by ten-for-one stock split, which raised the number of shares to 300,000,000.
A conditional increase of EUR 30,000 thousand in the capital stock by the issuance of up to 30,000,000 no par value bearer shares has been authorized in accordance with section 159(2)(1)
1
Fixed
assets
2
Accounts
receivable
and other
assets
3
Stockholders’
equity
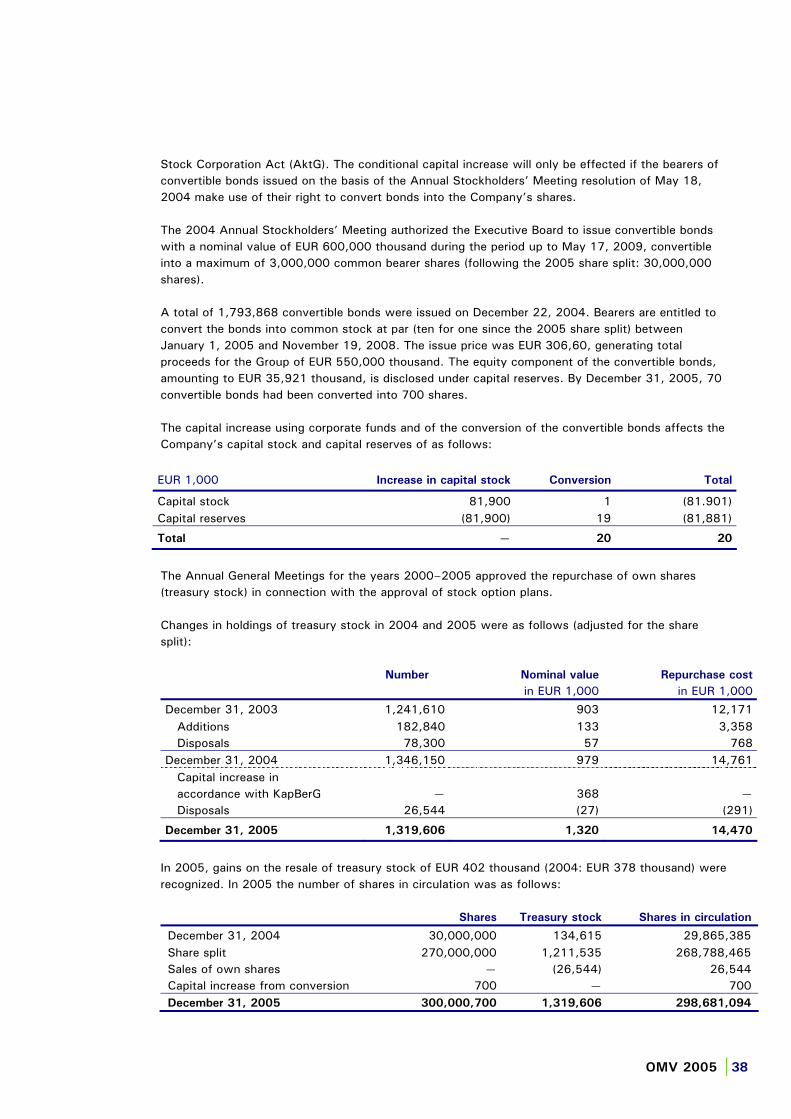
OMV 2005 |38
Stock Corporation Act (AktG). The conditional capital increase will only be effected if the bearers of convertible bonds issued on the basis of the Annual Stockholders’ Meeting resolution of May 18, 2004 make use of their right to convert bonds into the Company’s shares.
The 2004 Annual Stockholders’ Meeting authorized the Executive Board to issue convertible bonds with a nominal value of EUR 600,000 thousand during the period up to May 17, 2009, convertible into a maximum of 3,000,000 common bearer shares (following the 2005 share split: 30,000,000 shares).
A total of 1,793,868 convertible bonds were issued on December 22, 2004. Bearers are entitled to convert the bonds into common stock at par (ten for one since the 2005 share split) between January 1, 2005 and November 19, 2008. The issue price was EUR 306,60, generating total proceeds for the Group of EUR 550,000 thousand. The equity component of the convertible bonds, amounting to EUR 35,921 thousand, is disclosed under capital reserves. By December 31, 2005, 70 convertible bonds had been converted into 700 shares.
The capital increase using corporate funds and of the conversion of the convertible bonds affects the Company’s capital stock and capital reserves of as follows:
EUR 1,000 Increase in capital stock Conversion Total
Capital stock 81,900 1 (81.901) Capital reserves (81,900) 19 (81,881)
Total — 20 20
The Annual General Meetings for the years 2000–2005 approved the repurchase of own shares (treasury stock) in connection with the approval of stock option plans.
Changes in holdings of treasury stock in 2004 and 2005 were as follows (adjusted for the share split):
Number Nominal value
in EUR 1,000 Repurchase cost
in EUR 1,000
December 31, 2003 1,241,610 903 12,171 Additions 182,840 133 3,358 Disposals 78,300 57 768 December 31, 2004 1,346,150 979 14,761 Capital increase in accordance with KapBerG — 368 — Disposals 26,544 (27) (291)
December 31, 2005 1,319,606 1,320 14,470
In 2005, gains on the resale of treasury stock of EUR 402 thousand (2004: EUR 378 thousand) were recognized. In 2005 the number of shares in circulation was as follows:
Shares Treasury stock Shares in circulation
December 31, 2004 30,000,000 134,615 29,865,385 Share split 270,000,000 1,211,535 268,788,465 Sales of own shares — (26,544) 26,544 Capital increase from conversion 700 — 700 December 31, 2005 300,000,700 1,319,606 298,681,094

OMV 2005 |39
Changes in untaxed reserves increased the “Taxes on income” item by EUR 4,387 thousand (2004: reduction of EUR 5,631 thousand) in the year under review.
Due to the changeover to IFRS, the note is presented in accordance with IAS 19. The indexed pension commitments have been transferred to an external pension fund managed by APK-Pensionskasse AG. Defined benefit plans are generally based on years of service and the employee’s average compensation over the last five calendar years of employment. These pension plans are non-contributory. Changes in defined benefit plans and provisions for jubilee payments were as follows:
Pensions Severance
payments
Jubilee
payments
EUR 1,000 Dec. 31, 2005 Dec. 31, 2005 Dec. 31, 2005
Present value of benefit obligations funded by an external fund 19,321 — — Fair value of plan assets (9,827) — —Unrecognized actuarial gains/losses (3,643) — — Provision for benefit obligation funded by an
external fund 5,851 — —
Present value of benefit obligation not funded by an external fund — 5,098 439 Unrecognized actuarial gains/losses — 178 — Provision for benefit obligation not covered by
contributions to an external fund — 5,276 439
ACC provision as of December 31, 2004 — 3,354 491 Adjustment to IFRS treatment 5,785 1,783 (25) Provision at start of year 5,785 5,137 466 Expense for the period 649 532 21 Contribution to the fund (489) — — Disbursements — (175) (18) Group transfer (94) (218) (30) Provision at year end 5,851 5,276 439
Interest expense 712 200 22 Current service cost 441 346 (1) Expected return on plan assets (504) — — Recognized actuarial gains/losses — (14) — Expense for the period 649 532 21
4
Untaxed
reserves
5
Provisions
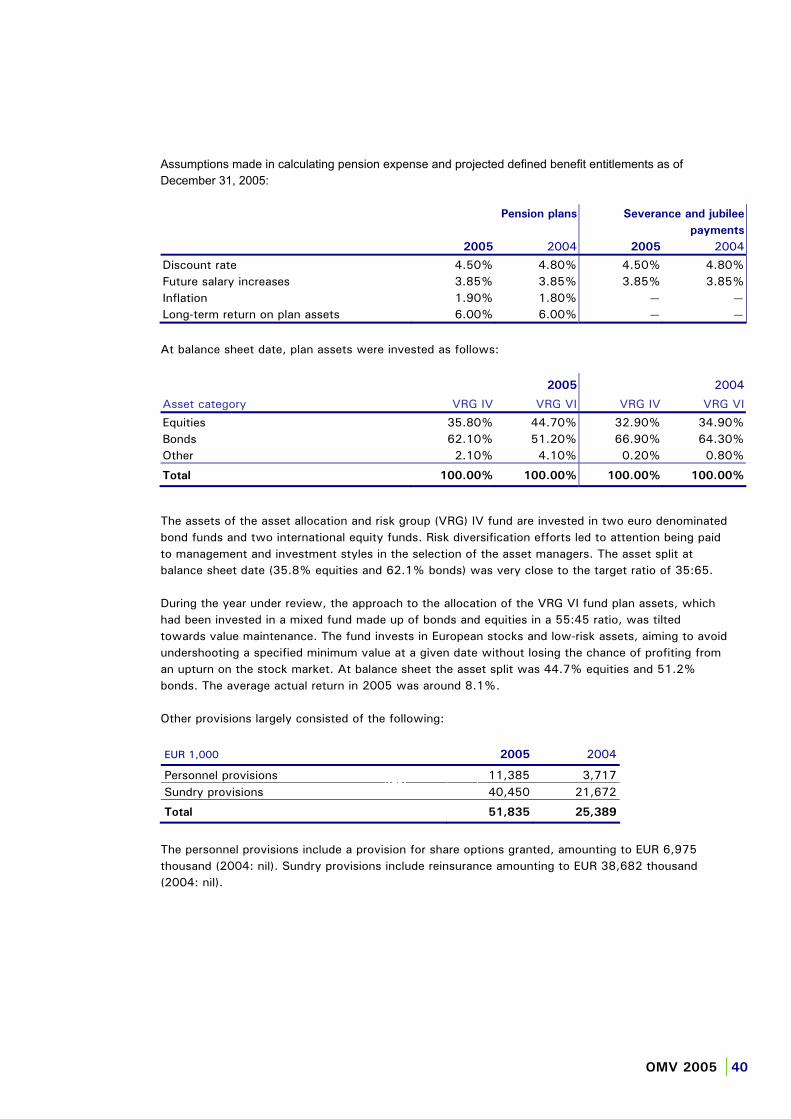
OMV 2005 |40
Assumptions made in calculating pension expense and projected defined benefit entitlements as of
December 31, 2005:
Pension plans Severance and jubilee
payments
2005 2004 2005 2004
Discount rate 4.50% 4.80% 4.50% 4.80%Future salary increases 3.85% 3.85% 3.85% 3.85%Inflation 1.90% 1.80% — —Long-term return on plan assets 6.00% 6.00% — —
At balance sheet date, plan assets were invested as follows:
2005 2004
Asset category VRG IV VRG VI VRG IV VRG VI
Equities 35.80% 44.70% 32.90% 34.90%Bonds 62.10% 51.20% 66.90% 64.30%Other 2.10% 4.10% 0.20% 0.80%
Total 100.00% 100.00% 100.00% 100.00%
The assets of the asset allocation and risk group (VRG) IV fund are invested in two euro denominated bond funds and two international equity funds. Risk diversification efforts led to attention being paid to management and investment styles in the selection of the asset managers. The asset split at balance sheet date (35.8% equities and 62.1% bonds) was very close to the target ratio of 35:65.
During the year under review, the approach to the allocation of the VRG VI fund plan assets, which had been invested in a mixed fund made up of bonds and equities in a 55:45 ratio, was tilted towards value maintenance. The fund invests in European stocks and low-risk assets, aiming to avoid undershooting a specified minimum value at a given date without losing the chance of profiting from an upturn on the stock market. At balance sheet the asset split was 44.7% equities and 51.2% bonds. The average actual return in 2005 was around 8.1%.
Other provisions largely consisted of the following:
EUR 1,000 2005 2004
Personnel provisions 11,385 3,717 Sundry provisions 40,450 21,672
Total 51,835 25,389
The personnel provisions include a provision for share options granted, amounting to EUR 6,975 thousand (2004: nil). Sundry provisions include reinsurance amounting to EUR 38,682 thousand (2004: nil).

OMV 2005 |41
Other liabilities include personnel separation expenses and interest expense of which EUR 7,050 thousand are due after balance sheet date (2004: EUR 5,713 thousand).
Liabilities with maturities of more than five years amount to EUR 120,000 thousand (2004: EUR 450,000 thousand). These relate to amounts due to banks.
Securities with a total book value of EUR 14,535 thousand have been pledged against borrowings of EUR 16,333 thousand.
Contingent liabilities are as follows:
EUR 1,000 2005 2004
Guaranties 542,690 539,612 [thereof for affiliated companies] [467,260] [450,401]
Total 542,690 539,612
[thereof for affiliated companies] [467,260] [450,401]
OMV Aktiengesellschaft has given an undertaking to OMV Clearing und Treasury GmbH, which runs the Group’s clearing operations, to maintain its liquidity for the duration of its membership of the Group.
OMV Aktiengesellschaft is liable for redemption of the USD 320 million US dollar bond (EUR 271,255 thousand) issue by OMV (U.K.) Limited.
In connection with the disposal of Chemie Linz GmbH (now DSM Chemie Linz), the Company assumed liability for contingent environmental liabilities.
The disposal of PCD Polymere GmbH led to the assumption by the Company, inter alia, of liability for contingent environmental liabilities. The total amount of the contingent liabilities in question is limited to EUR 101.7 mn.
6
LiabilitiesEUR 1,000 2005 2004
< 1 year > 1 year < 1 year > 1 year
Bonds — 799,978 — 800,000 Long-term special financing 19 — 36 10 Amounts due to banks 116,505 140,892 28,934 272,302 Accounts payable from trade 5,534 6,800 65,652 5,712 Accounts payable to affiliated companies 63,244 302,128 260,440 296,128 [thereof trade] [2,333] [—] [2,912] [—]Accounts payable to associated companies — — 73 — [thereof trade] [—] [—] [—] [—]Other liabilities 246,448 664 187,587 534 [thereof taxes] [239,532] [—] [181,662] [—][thereof social security expenses] [160] [—] [122] [—]
Gesamt 431,750 1,250,462 542,722 1,374,686
7
Contingent
liabilities
under section
199 ACC
OMV 2005 |42
During 2005, sale of the 50% interest in Agrolinz Melamine International GmbH (AMI) resulted in the assumption of liabilities up to a maximum of 67.5% of the purchase price.
The following other financial commitments are not reported under liabilities or contingent liabilities:
During the year under review, OMV Aktiengesellschaft assumed liability on behalf of OMV FINANCE LIMITED for a EUR 850,000 mn multicurrency revolving credit facility.
OMV Aktiengesellschaft has issued guarantees and letters of comfort on behalf of certain exploration, production and distribution companies in respect of the fulfillment of concession and license agreements, and of various other agreements of indeterminate amount. In connection with the disposal of PCD Polymere GmbH, OMV Aktiengesellschaft has taken out an option to acquire real estate owned by PCD Polymere GmbH in Schwechat.
OMV Aktiengesellschaft is liable in the event of default by the successor companies on pensions, additional contributions to rectify shortfalls in the funding of obligations transferred to external pension funds, and bridging payments to separated employees.
A EUR 50 mn interest rate swap was taken out for the OMV bond. The fair value of EUR 19 thousand at balance sheet date was carried as a provision.
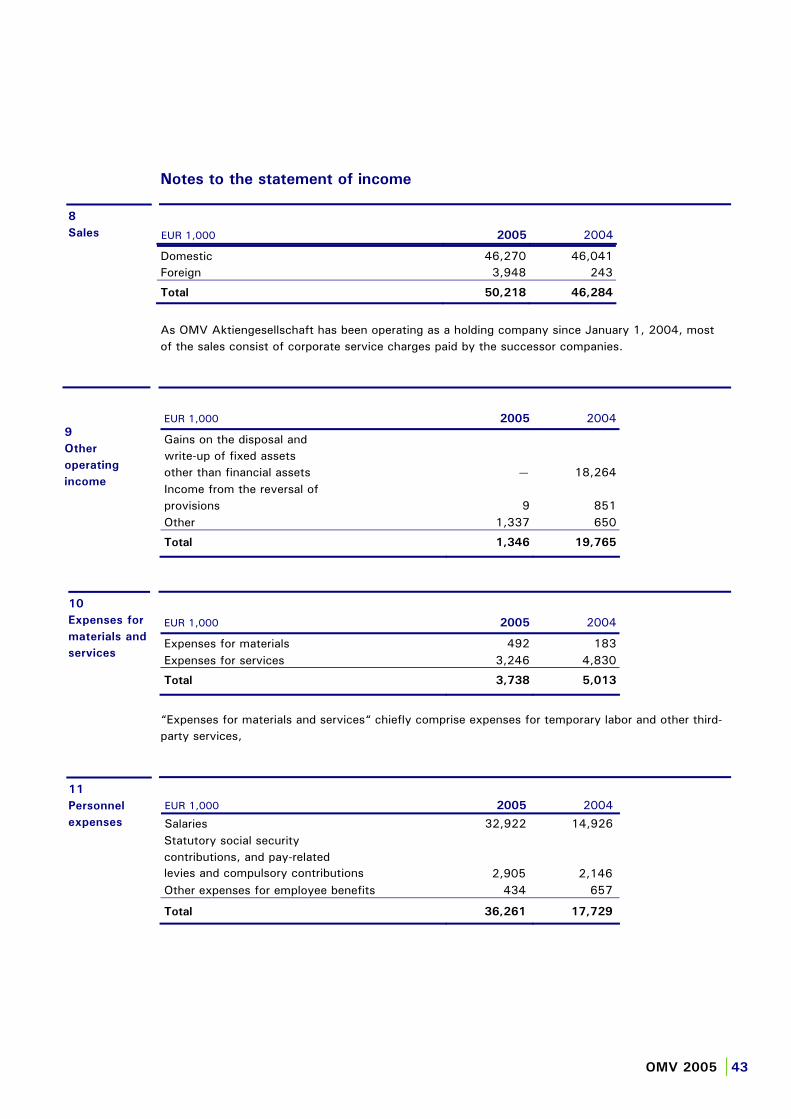
OMV 2005 |43
Notes to the statement of income
EUR 1,000 2005 2004
Domestic 46,270 46,041 Foreign 3,948 243
Total 50,218 46,284
As OMV Aktiengesellschaft has been operating as a holding company since January 1, 2004, most of the sales consist of corporate service charges paid by the successor companies.
EUR 1,000 2005 2004
Gains on the disposal and write-up of fixed assets other than financial assets — 18,264 Income from the reversal of provisions 9 851 Other 1,337 650
Total 1,346 19,765
EUR 1,000 2005 2004
Expenses for materials 492 183 Expenses for services 3,246 4,830
Total 3,738 5,013
“Expenses for materials and services“ chiefly comprise expenses for temporary labor and other third-party services,
EUR 1,000 2005 2004
Salaries 32,922 14,926 Statutory social security contributions, and pay-related levies and compulsory contributions 2,905 2,146 Other expenses for employee benefits 434 657
Total 36,261 17,729
8
Sales
9
Other
operating
income
10
Expenses for
materials and
services
11
Personnel
expenses
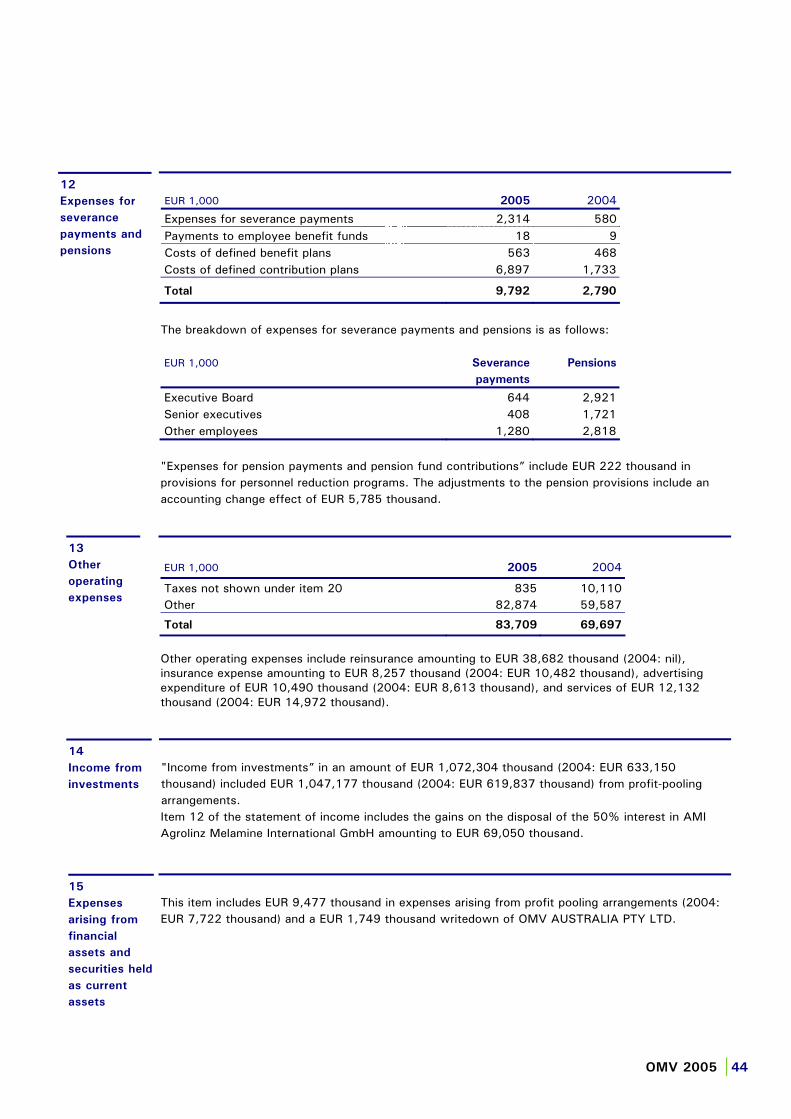
OMV 2005 |44
EUR 1,000 2005 2004
Expenses for severance payments 2,314 580 Payments to employee benefit funds 18 9 Costs of defined benefit plans 563 468 Costs of defined contribution plans 6,897 1,733
Total 9,792 2,790
The breakdown of expenses for severance payments and pensions is as follows:
EUR 1,000 Severance
payments
Pensions
Executive Board 644 2,921 Senior executives 408 1,721 Other employees 1,280 2,818
"Expenses for pension payments and pension fund contributions” include EUR 222 thousand in provisions for personnel reduction programs. The adjustments to the pension provisions include an accounting change effect of EUR 5,785 thousand.
EUR 1,000 2005 2004
Taxes not shown under item 20 835 10,110 Other 82,874 59,587
Total 83,709 69,697
Other operating expenses include reinsurance amounting to EUR 38,682 thousand (2004: nil), insurance expense amounting to EUR 8,257 thousand (2004: EUR 10,482 thousand), advertising expenditure of EUR 10,490 thousand (2004: EUR 8,613 thousand), and services of EUR 12,132 thousand (2004: EUR 14,972 thousand).
"Income from investments” in an amount of EUR 1,072,304 thousand (2004: EUR 633,150 thousand) included EUR 1,047,177 thousand (2004: EUR 619,837 thousand) from profit-pooling arrangements. Item 12 of the statement of income includes the gains on the disposal of the 50% interest in AMI Agrolinz Melamine International GmbH amounting to EUR 69,050 thousand.
This item includes EUR 9,477 thousand in expenses arising from profit pooling arrangements (2004: EUR 7,722 thousand) and a EUR 1,749 thousand writedown of OMV AUSTRALIA PTY LTD.
12
Expenses for
severance
payments and
pensions
13
Other
operating
expenses
14
Income from
investments
15
Expenses
arising from
financial
assets and
securities held
as current
assets

OMV 2005 |45
EUR 1,000 2005 2004
Current taxes 1,428 (18,017) Deferred taxes (5,090) (4,192)
Total (3,662) (22,209)
Taxes on income comprise EUR 8,110 thousand in current income tax expense of and EUR 5,090 thousand in deferred tax credits, yielding an amount of EUR 3,020 thousand in income tax payable on the profit on ordinary activities. Tax income of EUR 11,069 thousand relate to previous years.
The profile of our liabilities in terms of fixed and variable interest rates, currencies and maturities was analyzed in order to achieve balanced risk exposure. Target ratios were set, and derivatives used to adjust exposure if bands are transgressed. For instance, fixed interest can be converted into variable interest loans or vice versa by means of interest rate swaps. During the fourth quarter of 2005, EUR 100 mn and USD 50 mn were used to convert fixed interest into variable interest debt. The interest rate difference between the swap and the loan is recognized as an adjustment to interest expense.
2005 2005 2005
EUR 1,000 Nominal value Fair value Carrying value
IRS, Societe Generale EUR 50.000 (19) (19) IRS, Barclays EUR 50.000 162 — IRS, ÖVAG USD 42.402 25 — Payer swaption USD 21.200 (48) —
No such derivative instruments were employed in 2004.
The average number of employees was:
2005 2004
Salaried staff 99 102 Non-salaried staff — —
Total 99 102
During the year under review the total remuneration of the Executive Board amounted to EUR 11,232 thousand (2004: EUR 4,492 thousand), comprising EUR 3,719 thousand (2004: EUR 3,191 thousand) in basic salaries and other remuneration, EUR 382 thousand (2004: EUR 294 thousand) in pension contributions, benefits in kind and expenses, as well as EUR 7,131 thousand from the exercise of stock options. In 2005 performance related compensation was equivalent to 435% (2004: 135%) and other remuneration to 19% (2004: 16%) of basic remuneration.
16
Taxes on
income
Interest rate
risk
management
Governing
bodies and
employees
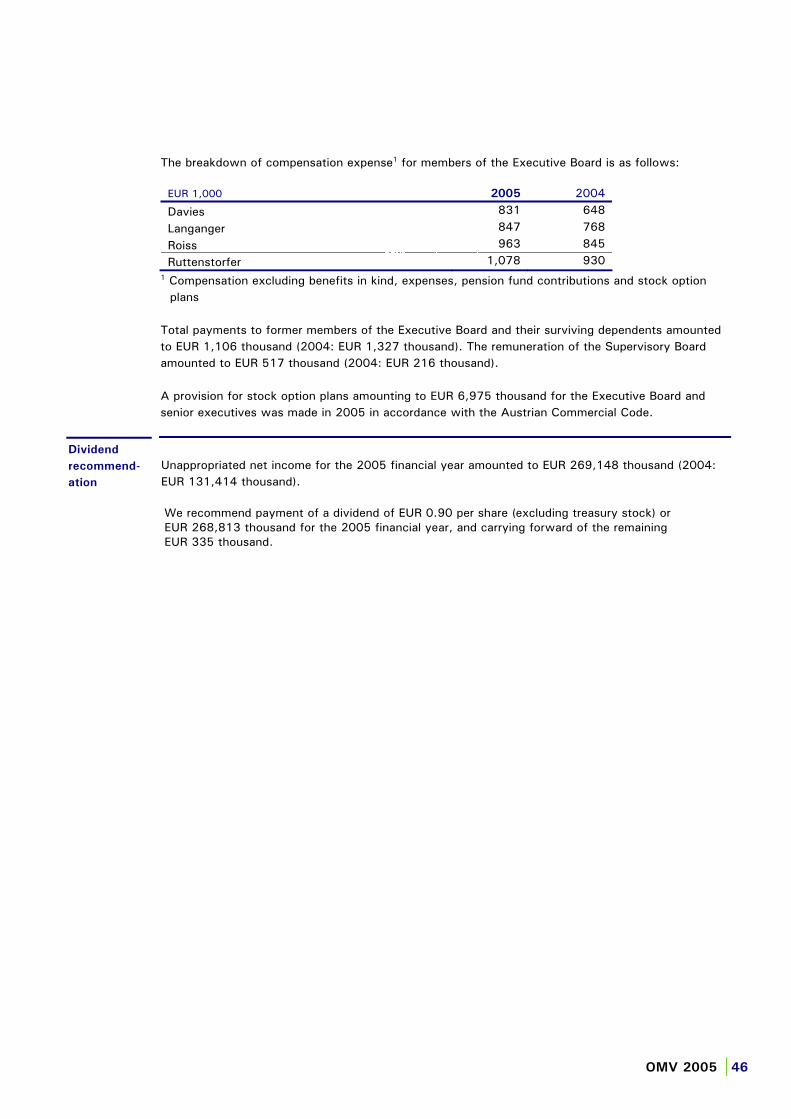
OMV 2005 |46
The breakdown of compensation expense1 for members of the Executive Board is as follows:
EUR 1,000 2005 2004
Davies 831 648
Langanger 847 768
Roiss 963 845
Ruttenstorfer 1,078 930 1 Compensation excluding benefits in kind, expenses, pension fund contributions and stock option
plans
Total payments to former members of the Executive Board and their surviving dependents amounted to EUR 1,106 thousand (2004: EUR 1,327 thousand). The remuneration of the Supervisory Board amounted to EUR 517 thousand (2004: EUR 216 thousand).
A provision for stock option plans amounting to EUR 6,975 thousand for the Executive Board and senior executives was made in 2005 in accordance with the Austrian Commercial Code.
Unappropriated net income for the 2005 financial year amounted to EUR 269,148 thousand (2004: EUR 131,414 thousand).
We recommend payment of a dividend of EUR 0.90 per share (excluding treasury stock) or EUR 268,813 thousand for the 2005 financial year, and carrying forward of the remaining EUR 335 thousand.
Dividend
recommend-
ation
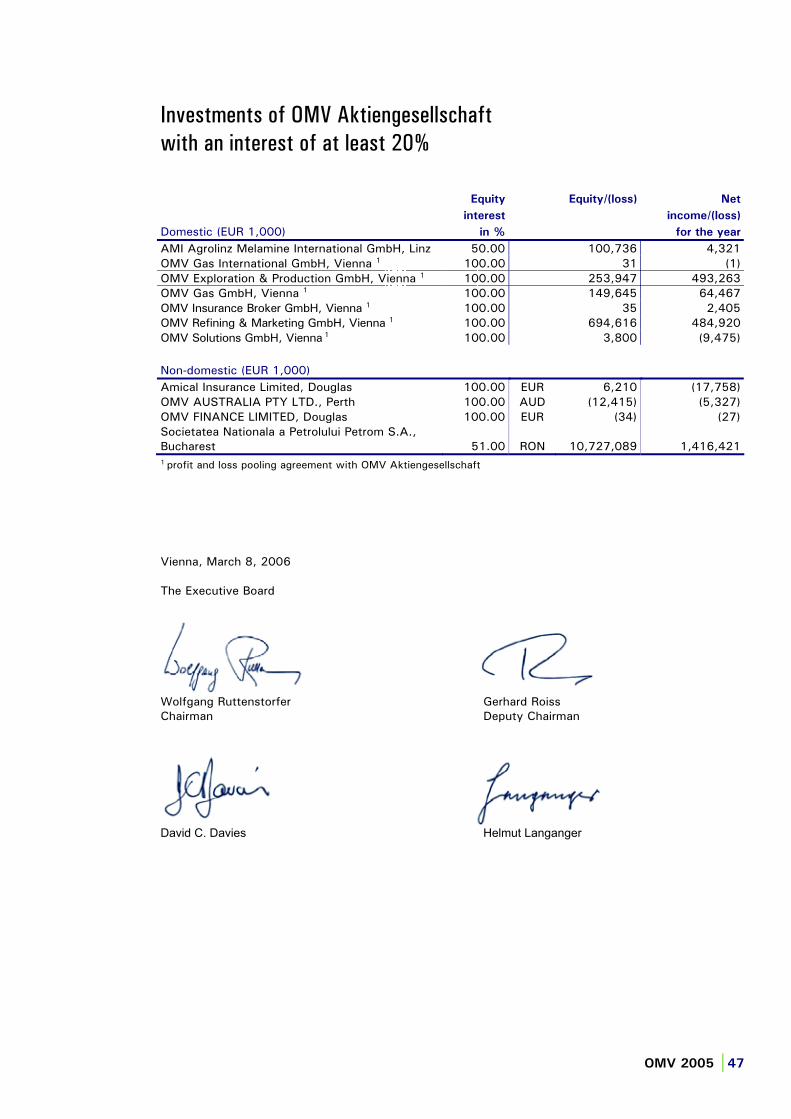
Investments of OMV Aktiengesellschaft
with an interest of at least 20%
OMV 2005 |47
Domestic (EUR 1,000)
Equity
interest
in %
Equity/(loss) Net
income/(loss)
for the year
AMI Agrolinz Melamine International GmbH, Linz 50.00 100,736 4,321 OMV Gas International GmbH, Vienna 1 100.00 31 (1) OMV Exploration & Production GmbH, Vienna 1 100.00 253,947 493,263 OMV Gas GmbH, Vienna 1 100.00 149,645 64,467 OMV Insurance Broker GmbH, Vienna 1 100.00 35 2,405 OMV Refining & Marketing GmbH, Vienna 1 100.00 694,616 484,920 OMV Solutions GmbH, Vienna 1 100.00 3,800 (9,475)
Non-domestic (EUR 1,000)
Amical Insurance Limited, Douglas 100.00 EUR 6,210 (17,758) OMV AUSTRALIA PTY LTD., Perth 100.00 AUD (12,415) (5,327) OMV FINANCE LIMITED, Douglas 100.00 EUR (34) (27) Societatea Nationala a Petrolului Petrom S.A., Bucharest 51.00 RON 10,727,089 1,416,421 1 profit and loss pooling agreement with OMV Aktiengesellschaft
Vienna, March 8, 2006
The Executive Board
Wolfgang Ruttenstorfer Gerhard Roiss Chairman Deputy Chairman
David C. Davies Helmut Langanger
Auditor’s report
OMV 2005 |48
We have audited the financial statements, including the accounting records of OMV Aktiengesellschaft, Vienna, for fiscal year from January 1, 2005 to December 31, 2005. Management is responsible for the preparation and content of the financial statements and the accounting records and the directors’ report in accordance with Austrian regulations. Our responsibility is to express an opinion on these financial statements based on our audit and to state whether the management report is in accordance with the financial statements.
We conducted our audit in accordance with Austrian Standards on Auditing and the applicable Austrian laws and regulations. Those standards require that we plan and perform the audit to obtain reasonable assurance whether the financial statements are free from misstatement and whether we can state that the management report is in accordance with the financial statements. In determining audit procedures we considered our knowledge of the business activity, the economic and legal environment of the company and expectations about potential errors. The audit involves procedures to obtain evidence about amounts and disclosures in the financial statements predominantly on a sample basis. An audit also includes assessing the accounting principles used and significant estimates made by management as well as evaluating the overall financial statement presentation. We believe that our audit provides a reasonable basis for our opinion.
Our audit has not led to any objections. In our opinion, the financial statements are in accordance with legal requirements and present fairly in all material respects, the financial position of the OMV Aktiengesellschaft as of December 31, 2005 and of the results of its operations and its cash flows for the fiscal year from January 1, 2005 to December 31, 2005 in accordance with Austrian generally accepted accounting principles. The management report is in accordance with the financial statements.
Vienna, March 8, 2006
Deloitte Wirtschaftsprüfungs GmbH
Mag. Michael SCHOBER Mag. Walter MÜLLER Certified Public Accountants

Contacts
OMV 2005 |49
OMV Aktiengesellschaft
Otto-Wagner-Platz 5 1090 Vienna, Austria Tel.: +43 (01) 40 440-0 Fax: +43 (01) 40 440-20091 [email protected]
OMV Investor Relations
Ana-Barbara Kun iOtto-Wagner-Platz 5 1090 Vienna, Austria Tel.: +43 (01) 40 440-21600 Fax: +43 (01) 40 440-29496 [email protected]
AMI Agrolinz Melamine
International GmbH
St.-Peter-Straße 25 4021 Linz, Austria Tel.: +43 (0732) 6 914-0 Fax: +43 (0732) 6 914-3581 [email protected]
OMV Exploration & Production GmbH
Gerasdorfer Straße 151 1210 Vienna, Austria Tel.: +43 (01) 40 440-23793 Fax: +43 (01) 40 440-29486 [email protected]
OMV Gas International GmbH
floridotowerFloridsdorfer Hauptstraße 1 1210 Vienna, Austria Tel.: +43 (01) 27 500-28000 Fax: +43 (01) 27 500-28299 [email protected]
OMV Refining & Marketing GmbH
Lassallestraße 3 1020 Vienna, Austria Tel.: +43 (01) 40 440-0 Fax: +43 (01) 40 440-622013 [email protected]
OMV Solutions GmbH
Lassallestraße 3 1020 Vienna, Austria Tel.: +43 (01) 40 440-0 Fax: +43 (01) 40 440-27900 [email protected]
S.C. Petrom S.A.
Calea Dorobantilor 239, Sector 1 010567 Bucharest, Romania Tel.: +40 (21) 2 125 001 Fax: +40 (21) 3 155 166 [email protected]


