14
OMV Petrom S.A. OMV Petrom Q3/19 Results Christina Verchere, CEO October 30, 2019

OMV Petrom S.A.
OMV Petrom Q3/19 Results Christina Verchere, CEO
October 30, 2019

| OMV Petrom Q3/19 Results2
Legal DisclaimerThis presentation does not, and is not intended to, constitute or form part of,and should not be construed as, constituting or forming part of, any actualoffer to sell or issue, or any solicitation of any offer to purchase or subscribefor, any shares issued by the Company or any of its subsidiaries in anyjurisdiction or any inducement to enter into investment activity; nor shall thisdocument or any part of it, or the fact of it being made available, form thebasis of, or be relied on in any way whatsoever. No part of this presentation,nor the fact of its distribution, shall form part of or be relied on in connectionwith any contract or investment decision relating thereto; nor does itconstitute a recommendation regarding the securities issued by theCompany. The information and opinions contained in this presentation andany other information discussed in this presentation are provided as at thedate of this presentation and are therefore of a preliminary nature, have notbeen independently verified and may be subject to updating, revision,amendment or change without notice. Where this presentation quotes anyinformation or statistics from any external source, it should not be interpretedthat the Company has adopted or endorsed such information or statistics asbeing accurate.
No reliance may be placed for any purpose whatsoever on the informationcontained in this presentation, or any other material discussed verbally. Norepresentation or warranty, express or implied, is given as to the accuracy,fairness or currentness of the information or the opinions contained in thisdocument or on its completeness and no liability is accepted for any suchinformation, for any loss howsoever arising, directly or indirectly, from anyuse of this presentation or any of its content or otherwise arising inconnection therewith.
This presentation may contain forward-looking statements. These statementsreflect the Company’s current knowledge and its expectations and projectionsabout future events and may be identified by the context of such statementsor words such as “anticipate,” “believe”, “estimate”, “expect”, “intend”, “plan”,“project”, “target”, “may”, “will”, “would”, “could” or “should” or similarterminology. By their nature, forward-looking statements are subject to anumber of risks and uncertainties, many of which are beyond the Company’scontrol that could cause the Company’s actual results and performance todiffer materially from any expected future results or performance expressedor implied by any forward-looking statements.
None of the future projections, expectations, estimates or prospects in thispresentation should in particular be taken as forecasts or promises nor shouldthey be taken as implying any indication, assurance or guarantee that theassumptions on which such future projections, expectations, estimates orprospects have been prepared or the information and statements containedherein are accurate or complete. As a result of these risks, uncertainties andassumptions, you should in particular not place reliance on these forward-looking statements as a prediction of actual results or otherwise. Thispresentation does not purport to contain all information that may benecessary in respect of the Company or its shares and in any event eachperson receiving this presentation needs to make an independentassessment.
The Company undertakes no obligation publicly to release the results of anyrevisions to any forward-looking statements in this presentation that mayoccur due to any change in its expectations or to reflect events orcircumstances after the date of this presentation.
This presentation and its contents are proprietary to the Company and neitherthis document nor any part of it may be reproduced or redistributed to anyother person.
| OMV Petrom Q3/19 Results3
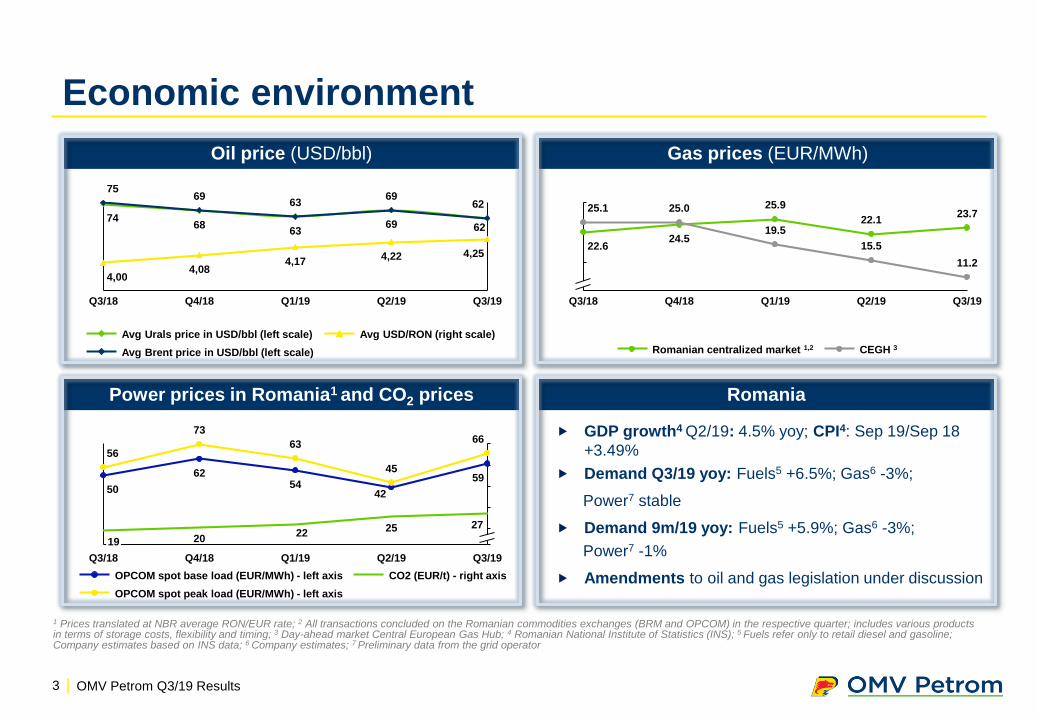
Power prices in Romania1 and CO2 prices
Economic environment
50
6254
42
59
56
73
63
45
66
2019
Q3/18 Q4/18
22
Q1/19
25
Q2/19
27
Q3/19
OPCOM spot base load (EUR/MWh) - left axis CO2 (EUR/t) - right axis
OPCOM spot peak load (EUR/MWh) - left axis
22.6
23.7
Q3/19Q4/18
25.1
Q3/18
24.5
25.0 25.9
19.5
Q1/19
22.1
15.5
Q2/19
11.2
Romanian centralized market 1,2 CEGH 3
Romania
Oil price (USD/bbl) Gas prices (EUR/MWh)
1 Prices translated at NBR average RON/EUR rate; 2 All transactions concluded on the Romanian commodities exchanges (BRM and OPCOM) in the respective quarter; includes various products in terms of storage costs, flexibility and timing; 3 Day-ahead market Central European Gas Hub; 4 Romanian National Institute of Statistics (INS); 5 Fuels refer only to retail diesel and gasoline; Company estimates based on INS data; 6 Company estimates; 7 Preliminary data from the grid operator
GDP growth4 Q2/19: 4.5% yoy; CPI4: Sep 19/Sep 18
+3.49%
Demand Q3/19 yoy: Fuels5 +6.5%; Gas6 -3%;
Power7 stable
Demand 9m/19 yoy: Fuels5 +5.9%; Gas6 -3%;
Power7 -1%
Amendments to oil and gas legislation under discussion
7468
6369
62
7569
6369
62
4,004,08
4,174,22 4,25
Q2/19Q1/19Q3/18 Q4/18 Q3/19
Avg Urals price in USD/bbl (left scale) Avg USD/RON (right scale)
Avg Brent price in USD/bbl (left scale)
| OMV Petrom Q3/19 Results4
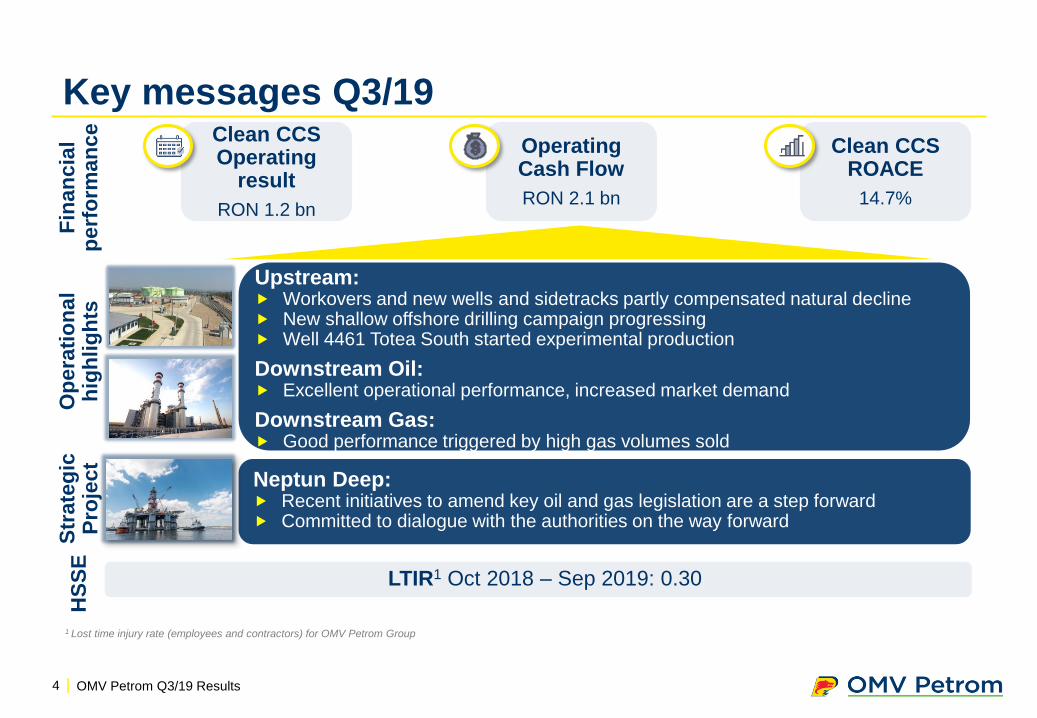
Clean CCS ROACE
14.7%
Clean CCS Operating
result
RON 1.2 bn
Operating Cash Flow
RON 2.1 bn
Key messages Q3/19
1 Lost time injury rate (employees and contractors) for OMV Petrom Group
LTIR1 Oct 2018 – Sep 2019: 0.30
HS
SE
Fin
an
cia
l p
erf
orm
an
ce
Op
era
tio
nal
hig
hlig
hts
Upstream: Workovers and new wells and sidetracks partly compensated natural decline New shallow offshore drilling campaign progressing Well 4461 Totea South started experimental production
Downstream Oil: Excellent operational performance, increased market demand
Downstream Gas: Good performance triggered by high gas volumes sold
Neptun Deep: Recent initiatives to amend key oil and gas legislation are a step forward Committed to dialogue with the authorities on the way forward
Str
ate
gic
P
roje
ct
| OMV Petrom Q3/19 Results5
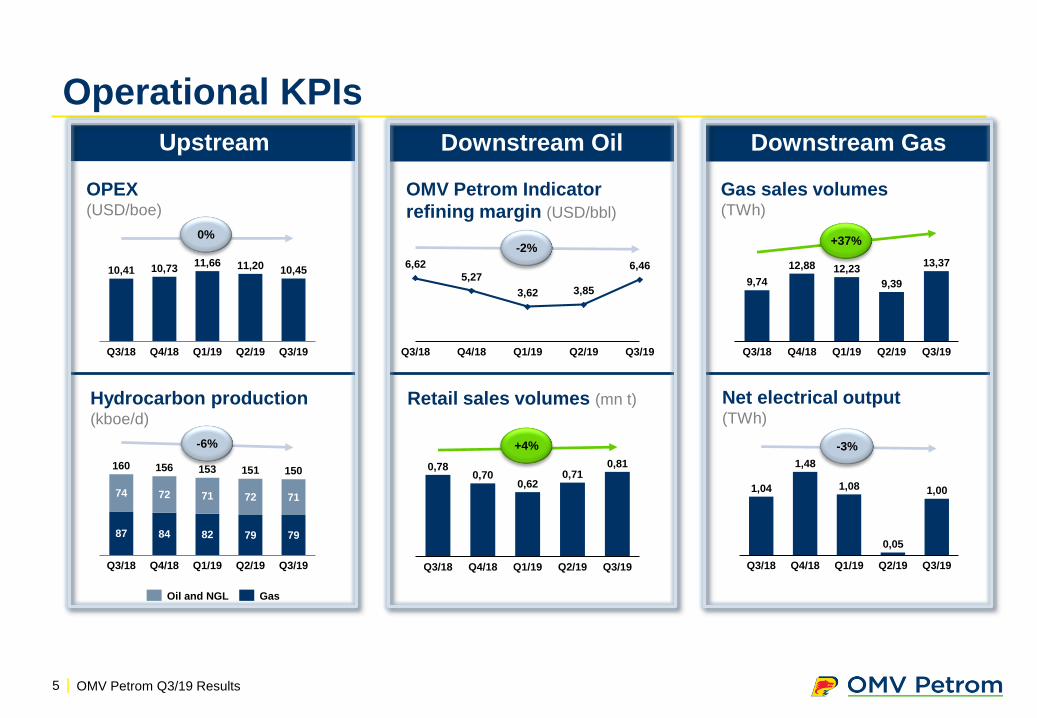
OPEX (USD/boe)
Operational KPIs
87 84 82 79 79
74 72 71 72 71
Q2/19Q3/18 Q3/19
153
Q4/18 Q1/19
160 156 151 150
-6%
Hydrocarbon production (kboe/d)
GasOil and NGL
10,41 10,7311,66 11,20 10,45
Q2/19Q4/18Q3/18 Q1/19 Q3/19
0%
OMV Petrom Indicator
refining margin (USD/bbl)
Retail sales volumes (mn t)
0,780,70
0,620,71
0,81
Q4/18Q3/18 Q1/19 Q2/19 Q3/19
+4%
6,62
5,27
3,62 3,85
6,46
Q1/19Q3/18 Q4/18 Q2/19 Q3/19
-2%
Gas sales volumes (TWh)
Net electrical output(TWh)
9,74
12,88 12,23
9,39
13,37
Q3/19Q3/18 Q4/18 Q1/19 Q2/19
+37%
1,04
1,48
1,08
0,05
1,00
Q3/19Q4/18Q3/18 Q1/19 Q2/19
-3%
Upstream Downstream Oil Downstream Gas
-6% -3%
-2%+37%
+4%
0%
| OMV Petrom Q3/19 Results6
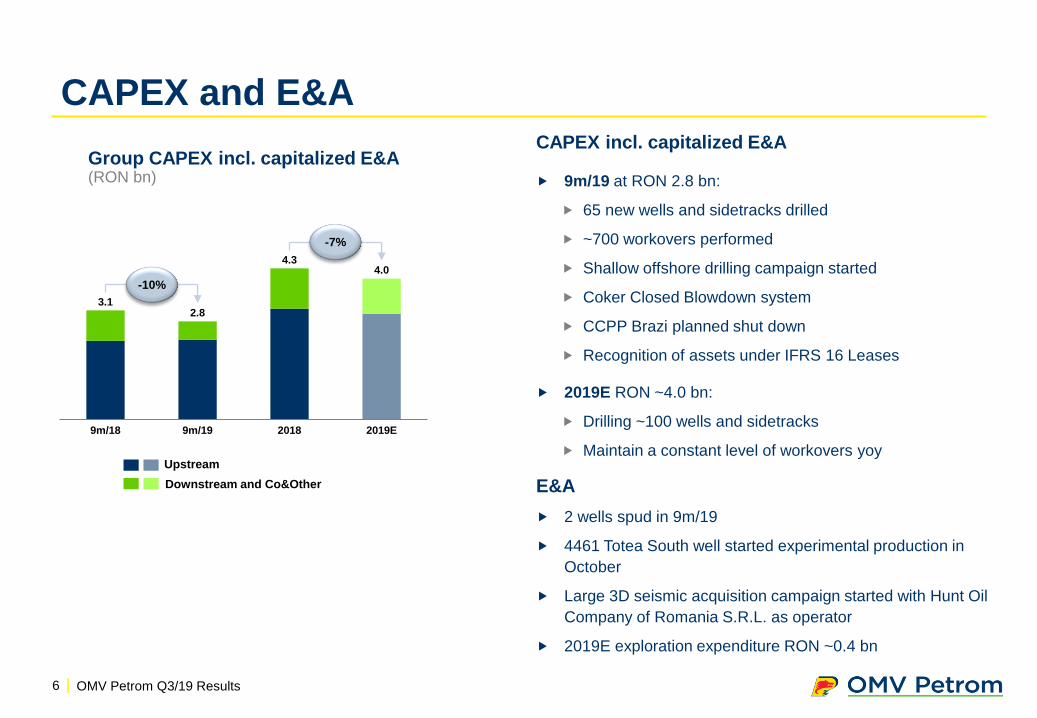
CAPEX and E&A
2019E
4.0
9m/18 9m/19 2018
3.12.8
4.3
-10%
-7%
Upstream
Downstream and Co&Other
Group CAPEX incl. capitalized E&A (RON bn)
E&A
2 wells spud in 9m/19
4461 Totea South well started experimental production in
October
Large 3D seismic acquisition campaign started with Hunt Oil
Company of Romania S.R.L. as operator
2019E exploration expenditure RON ~0.4 bn
CAPEX incl. capitalized E&A
9m/19 at RON 2.8 bn:
65 new wells and sidetracks drilled
~700 workovers performed
Shallow offshore drilling campaign started
Coker Closed Blowdown system
CCPP Brazi planned shut down
Recognition of assets under IFRS 16 Leases
2019E RON ~4.0 bn:
Drilling ~100 wells and sidetracks
Maintain a constant level of workovers yoy
-10%
-7%

OMV Petrom S.A.
OMV Petrom Q3/19 Results Alina Popa, CFO
October 30, 2019
| OMV Petrom Q3/19 Results8
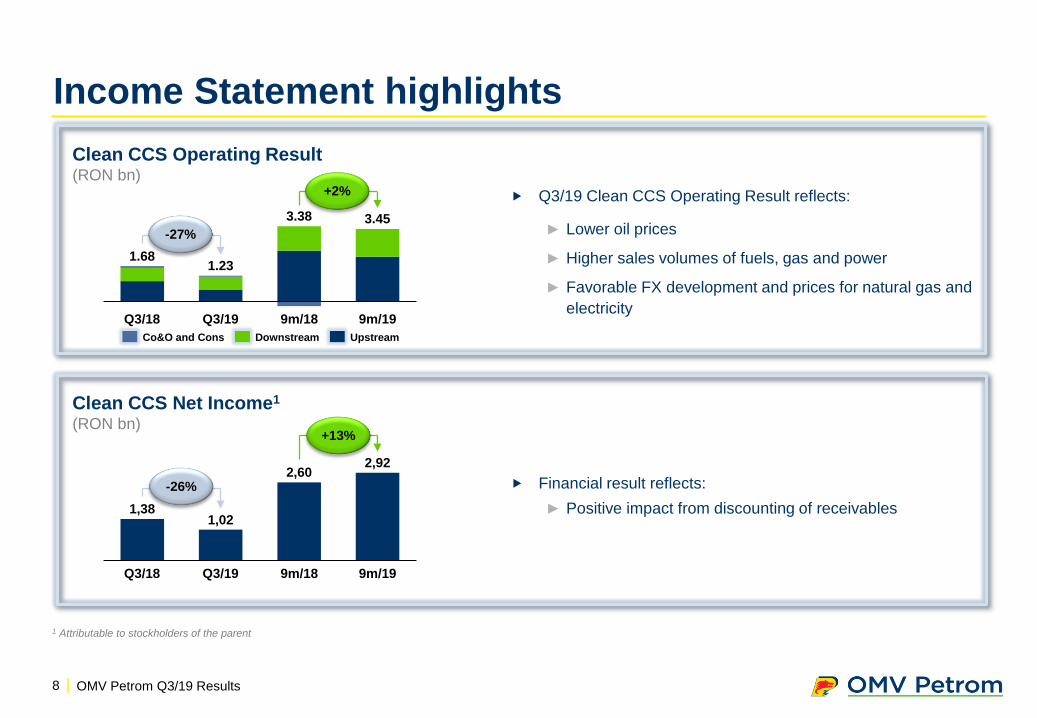
Q3/19 Clean CCS Operating Result reflects:
► Lower oil prices
► Higher sales volumes of fuels, gas and power
► Favorable FX development and prices for natural gas and
electricity
Clean CCS Net Income1
(RON bn)
Income Statement highlights
Clean CCS Operating Result (RON bn)
1 Attributable to stockholders of the parent
Financial result reflects:
► Positive impact from discounting of receivables
9m/19Q3/18 Q3/19 9m/18
1.681.23
3.38 3.45
-27%
+2%
UpstreamCo&O and Cons Downstream
-27%
+2%
1,381,02
2,602,92
Q3/18 Q3/19 9m/18 9m/19
-26%
+13%+13%
-26%
| OMV Petrom Q3/19 Results9
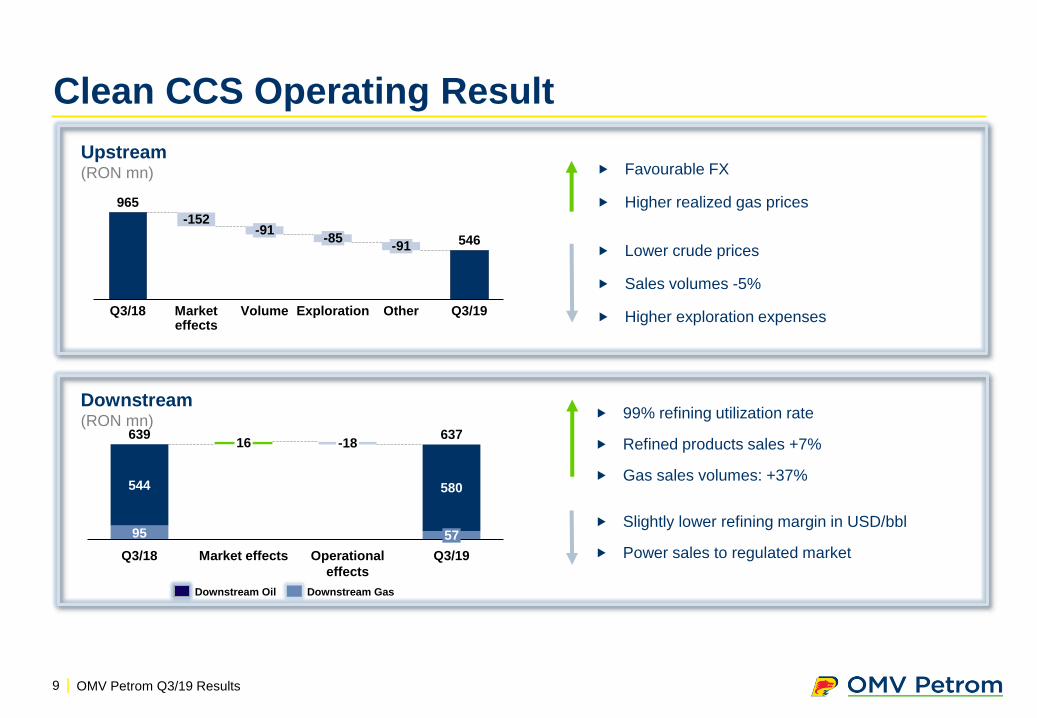
Clean CCS Operating Result
95
544 580
637
57
16
Q3/18 Q3/19Market effects
-18
Operational
effects
639
Downstream Oil Downstream Gas
99% refining utilization rate
Refined products sales +7%
Gas sales volumes: +37%
Slightly lower refining margin in USD/bbl
Power sales to regulated market
Favourable FX
Higher realized gas prices
Lower crude prices
Sales volumes -5%
Higher exploration expenses
Upstream(RON mn)
Downstream(RON mn)
965
546
Q3/18
-152
Market effects
-91
Exploration
-85-91
OtherVolume Q3/19
| OMV Petrom Q3/19 Results10
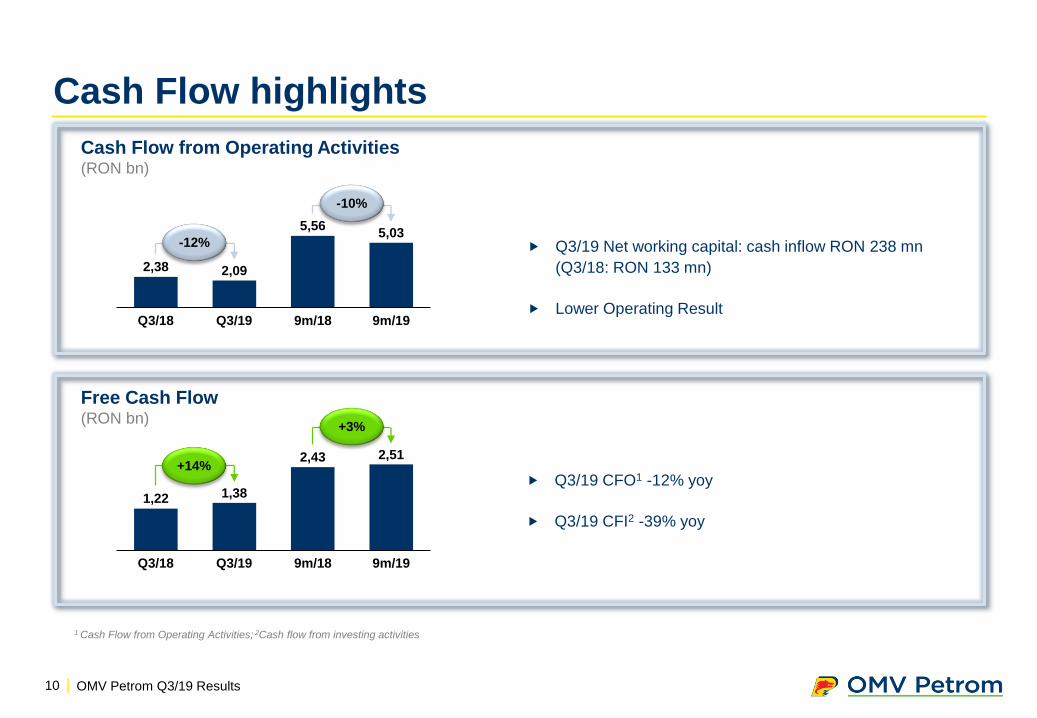
Free Cash Flow (RON bn)
Cash Flow highlights
Q3/19 Net working capital: cash inflow RON 238 mn
(Q3/18: RON 133 mn)
Lower Operating Result
Cash Flow from Operating Activities (RON bn)
1 Cash Flow from Operating Activities; 2Cash flow from investing activities
Q3/19 CFO1 -12% yoy
Q3/19 CFI2 -39% yoy
2,38 2,09
5,565,03
Q3/18 9m/18Q3/19 9m/19
-12%
-10%-10%
-12%
1,22 1,38
2,43 2,51
9m/18 9m/19Q3/18 Q3/19
+14%
+3%
+14%
+3%
| OMV Petrom Q3/19 Results11
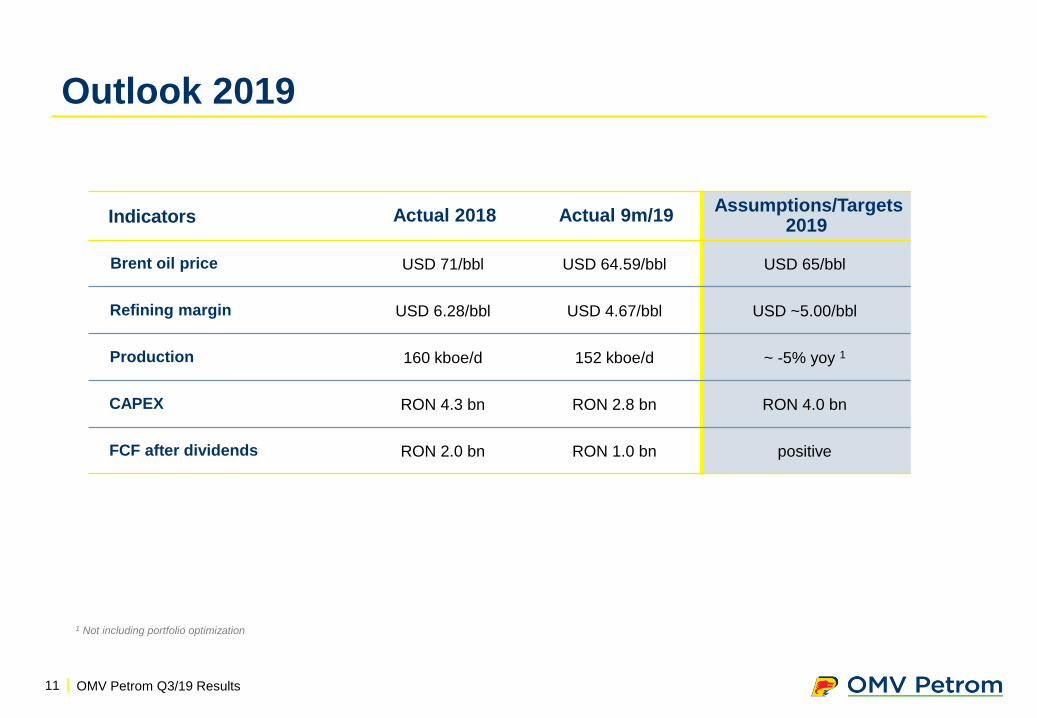
Outlook 2019
1 Not including portfolio optimization
Indicators Actual 2018 Actual 9m/19Assumptions/Targets
2019
Brent oil price USD 71/bbl USD 64.59/bbl USD 65/bbl
Refining margin USD 6.28/bbl USD 4.67/bbl USD ~5.00/bbl
Production 160 kboe/d 152 kboe/d ~ -5% yoy 1
CAPEX RON 4.3 bn RON 2.8 bn RON 4.0 bn
FCF after dividends RON 2.0 bn RON 1.0 bn positive

OMV Petrom S.A.
Q&A

OMV Petrom S.A.
Back-up
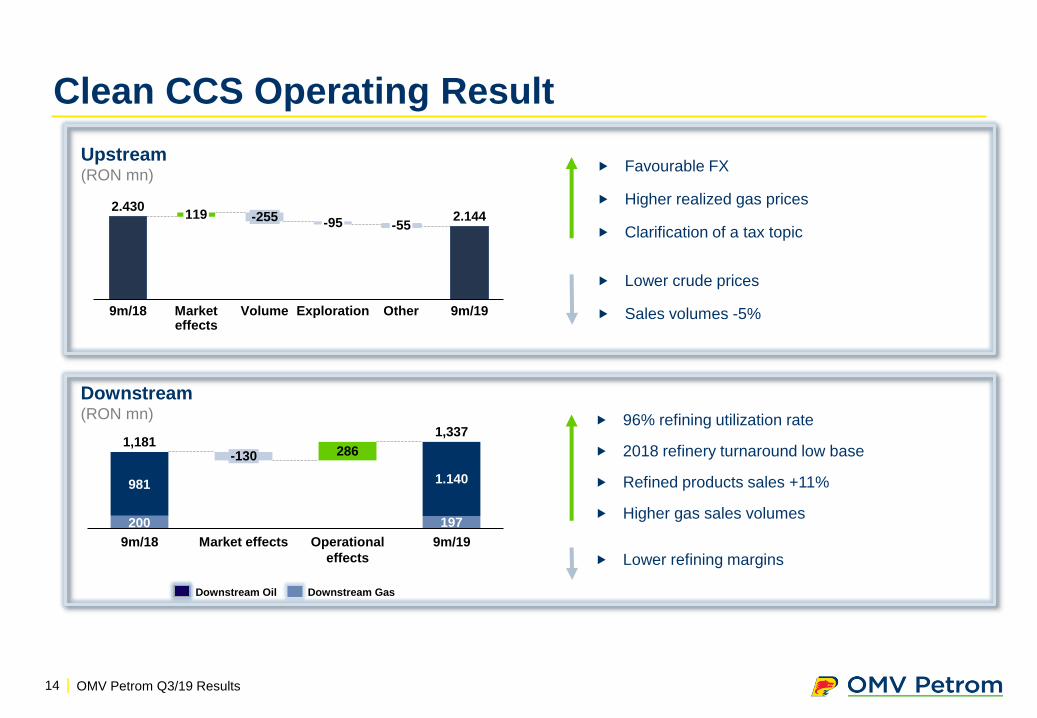
| OMV Petrom Q3/19 Results14
Clean CCS Operating Result
200 197
981
286
1.140
9m/18 Operational
effects
-130
Market effects 9m/19
1,1811,337
Downstream GasDownstream Oil
96% refining utilization rate
2018 refinery turnaround low base
Refined products sales +11%
Higher gas sales volumes
Lower refining margins
Favourable FX
Higher realized gas prices
Clarification of a tax topic
Lower crude prices
Sales volumes -5%
Upstream(RON mn)
Downstream(RON mn)
2.4302.144
9m/19Market effects
9m/18
119 -255
Volume
-95 -55
Exploration Other


