29 PROCEEDINGS OF THE ROYAL SOCIETY OF QUEENSLAND VOL. 128 This work is licensed under a Creative Commons Attribution-NonCommercial-NoDerivatives 4.0 International Licence. Individual articles may be copied or downloaded for private, scholarly and not-for-profit use. Quotations may be extracted provided that the author and The Royal Society of Queensland are acknowledged. Queries regarding republication of papers, or parts of papers such as figures and photographs, should be addressed to the Secretary of The Royal Society of Queensland ([email protected]). On a Fine Day in Shorncliffe the Sea Came Boiling Upwards Across the Bathers … Colin Lynam 1 Abstract Australia’s historical scientific archives are open for investigation by citizen scientists, such as myself. They hold our unique primary scientific records, data and references, and they are found in universities, museums, state libraries and government agencies, national archives and on researchers’ PCs. While our paper archives have recently been exposed to digitisa- tion, modern digital scientific information is not being upgraded and collated into our modern digital knowledge-management ‘data mining’ global computational systems. I am writing this awareness article, flavoured with 40 years of seismological engagement and as a purposeful con- tribution in support of World Digital Preservation Day (22 November 2020), ‘At Risk Digital Materials’. This paper establishes that Queensland has an incomplete ‘public’ history of local tsunami hazard occurrence. Further, it announces the discovery of a new meteotsunami meteoro- logical hazard occurrence on 3 June 1917. By retrieving the various types of archived data, this paper questions and reflects on our society’s lack of tsunami hazard preparedness, highlighting an obvious decline in scientific rigour in communicating such knowledge about our environment. This discussion of meteotsunamis illustrates the multivariate complexity of weather systems, with climate-change-related phenomena capable of creating coastal tsunami-like hazards com- monly causally linked to undersea earthquakes and/or landslip or tectonic fault movement. Keywords: tsunami hazard, meteotsunami, tsunamigenic, earthquake, archival preservation, FAIR data re-use 1 Principal Consultant, Earthquake Services, 32 Coventry Place, Wishart, QLD 4122, Australia ([email protected]). Web: https://www.researchgate.net/profile/Colin_Lynam Introduction Is it really possible for suburban Brisbane, Australia, to feel the damaging inundation effects of tsunami sea waves from a local, tsunamigenic earthquake, as suggested by the title of this paper? How likely is it that a devastating tsunami, generated by a large earthquake off the shores of South America, or even caused by a local weather event, could occur here? Most of Australia’s population lives along the coastal and littoral waterways, like those of the Gold Coast (Figure 1) and Sydney Harbour. How much inundation can we tolerate? Surely our government agencies, charged with our safety, would have considered this? Unfortu- nately, they have not. The simple, underlying reason is that objective scientific knowledge is not a valued, integral part of government strategy. There is a paucity of measurement data research on this topic, and this paper suggests the ways in which this came about. The latest Queensland Government advice from the Minister for Emergency Services (Hon. Craig Crawford) is documented in the Tsunami Guide for Queensland: We realise, since a hazard such as a tsunami has not impacted Queensland in recent memory, that this does not mean that it cannot happen. Tsunami are rare, highly directional events. Because our historical records are short, and damaging tsunami are relatively rare in this region, there are large uncertainties in how
Transcript
29Proceedings of The royal socieTy of Queensland Vol. 128
This work is licensed under a Creative Commons Attribution-NonCommercial-NoDerivatives 4.0 International Licence. Individual articles may be copied or downloaded for private, scholarly and not-for-profit use. Quotations may be extracted provided that the author and The Royal Society of Queensland are acknowledged. Queries regarding republication of papers, or parts of papers such as figures
and photographs, should be addressed to the Secretary of The Royal Society of Queensland ([email protected]).
On a Fine Day in Shorncliffe the Sea Came Boiling Upwards Across the Bathers …
Colin Lynam1
AbstractAustralia’s historical scientific archives are open for investigation by citizen scientists, such as myself. They hold our unique primary scientific records, data and references, and they are found in universities, museums, state libraries and government agencies, national archives and on researchers’ PCs. While our paper archives have recently been exposed to digitisa-tion, modern digital scientific information is not being upgraded and collated into our modern digital knowledge- management ‘data mining’ global computational systems. I am writing this awareness article, flavoured with 40 years of seismological engagement and as a purposeful con-tribution in support of World Digital Preservation Day (22 November 2020), ‘At Risk Digital Materials’. This paper establishes that Queensland has an incomplete ‘public’ history of local tsunami hazard occurrence. Further, it announces the discovery of a new meteotsunami meteoro-logical hazard occurrence on 3 June 1917. By retrieving the various types of archived data, this paper questions and reflects on our society’s lack of tsunami hazard preparedness, highlighting an obvious decline in scientific rigour in communicating such knowledge about our environment. This discussion of meteotsunamis illustrates the multivariate complexity of weather systems, with climate-change-related phenomena capable of creating coastal tsunami-like hazards com-monly causally linked to undersea earthquakes and/or landslip or tectonic fault movement.
1 Principal Consultant, Earthquake Services, 32 Coventry Place, Wishart, QLD 4122, Australia ([email protected]). Web: https://www.researchgate.net/profile/Colin_Lynam
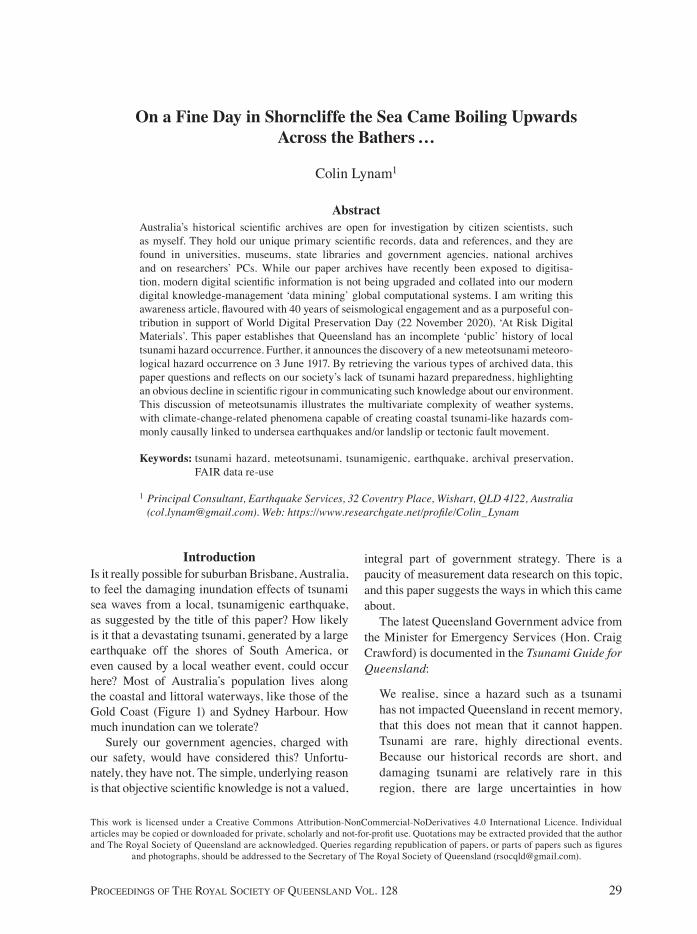
IntroductionIs it really possible for suburban Brisbane, Aus t ralia, to feel the damaging inundation effects of tsunami sea waves from a local, tsunamigenic earthquake, as suggested by the title of this paper? How likely is it that a devastating tsunami, generated by a large earthquake off the shores of South America, or even caused by a local weather event, could occur here? Most of Australia’s population lives along the coastal and littoral waterways, like those of the Gold Coast (Figure 1) and Sydney Harbour. How much inundation can we tolerate?
Surely our government agencies, charged with our safety, would have considered this? Unfor tu-nately, they have not. The simple, underlying reason is that objective scientific knowledge is not a valued,
integral part of government strategy. There is a paucity of measurement data research on this topic, and this paper suggests the ways in which this came about.
The latest Queensland Government advice from the Minister for Emergency Services (Hon. Craig Crawford) is documented in the Tsunami Guide for Queensland:
We realise, since a hazard such as a tsunami has not impacted Queensland in recent memory, that this does not mean that it cannot happen. Tsunami are rare, highly directional events. Because our historical records are short, and damaging tsunami are relatively rare in this region, there are large uncertainties in how
30 Colin lynam
often they might occur in Queensland. Further, scientists still do not have a good understanding of the frequency of key tsunami generating pro-cesses such as large earthquakes and volcanic eruptions (Chesnais et al., 2019).
The Queensland Government’s publication men-tions only the effect of the 1960 Chilean earthquake tsunami. Nor does the Minister announce a strategy for the scientific research needed to correct the paucity of knowledge in his purview for this natu-ral hazard. It is within his brief to fund necessary research to fill this identified and acknowledged lack of scientific knowledge. Interestingly, the statistics from the Queensland State Disaster Council for 2018–2019 (Tot & Pringle, 2019) issued regular ‘Weather Warning’ alerts for:
• 80 tsunamis; • 194 tropical cyclones; • 84 storm tides; • 88 high seas/ocean winds; and• 943 severe thunderstorms.
All of these weather-related phenomena (see Glossary) affect sensors for tide gauges, baro meters, pluviographs or seismographs and are visible in those record repositories, as well as various satellite sensor platforms.
A recent Engineers Australia (EA) seminar expounded on how a cavalier society deals with this resulting lack of factual knowledge:
Hundreds of thousands of Queenslanders live on coastal floodplains, often unwittingly until they are actually flooded. In the past 10 years
floods in South East Queensland, Bundaberg and Townsville as well as elsewhere have brought into question urban planning decisions, build-ing designs, emergency planning and flood miti gation strategies. Yet there continues to be pres sure to put more dwellings in floodplains, often replacing existing development with higher density development (Mirfenderesk et al., 2020; Bavas, 2019).
I draw attention here to seismologists, who also have worked actively in this area of science. I have noted elsewhere in regard to Figure 2 that:
I came across the 1957 correspondence and 2 seismograms from the late Father Joe McKey from St Mary’s Church in Warwick. One of these seismograms appears below and shows how well the 1957 Magnitude 7.1 BIAK (Indonesia) earthquake was captured on Fr. McKey’s home built ‘Milne Shaw’ seismograph. The other interesting recorded phenomenon to note is the enlarged microseismic background noise at the top of the seismogram, for which Father McKey’s research is recognised. This was a Tropical low moving SE from inland NSW, strong high in Tasman Sea, strong NEE gradient. Complex lows formed near coast (Lynam, 2018).
Seismograms record earthquakes and micro-seism background earth noise, due to ocean weather such as tropical cyclones and lows. The University of Queensland was tracking cyclones back in 1954 on its seismograms, before the advent of radar in meteorology (Upton, 1956).
Figure 1. Gold Coast, Queensland – highly built-up coastal and littoral floodplain susceptible to tsunami or storm surge inundation.
31Sea at Shorncliffe came Boiling UpwardS acroSS the BatherS
Figure 2. Annotated 1957 seismogram from ‘Milne Shaw’ seismograph built by Fr. Joe McKey, showing M 7.1 Biak region, Indonesia, 22 June 1957, at 23:50:35 UTC, and (upper record) noise effects from a low-pressure weather system from EW polarity.
Evidentiary Material (Part 1)This paper presents a sequence of some known tsu-nami events affecting Queensland, to demonstrate that these are very real and hazardous threats. Let me illustrate my contention with some recently uncovered instances of tsunami events in South East Queensland. These events are not widely known by seismologists, the Australian tsunami research community, or government.
I have deliberately represented my ‘specimen’ evidence with a graphical format, because I am writing this manuscript in a digital medium, but the primary evidence is in an analogue (newspaper) referenced format. If it were a botanical or geo-logical specimen, it would be presented as an inset photograph. Instead, for the reader’s convenience, I have used the scanned, ‘secondary source’ infor-mation provided by the Trove newspaper scanning project of the Australian National Library.
Tsunami Event, 7 June 1918 (Earthquake mb5.6, Offshore Fraser Island, Queensland)This anecdotal digitised newspaper clip extracted from the newspaper The Daily Standard refers to an observed tsunami caused by an offshore Queensland earthquake, mb5.6, at 4.15 am (AEST) on 7 June 1918. It is Queensland’s largest histori-cally and scientifically documented earthquake (no local seismographs). There is a further anecdotal record of this same tsunami, 400 km further north and offshore from Mackay.
The Daily Standard, 7 June 1918, p. 5 (Anon., 1918a):
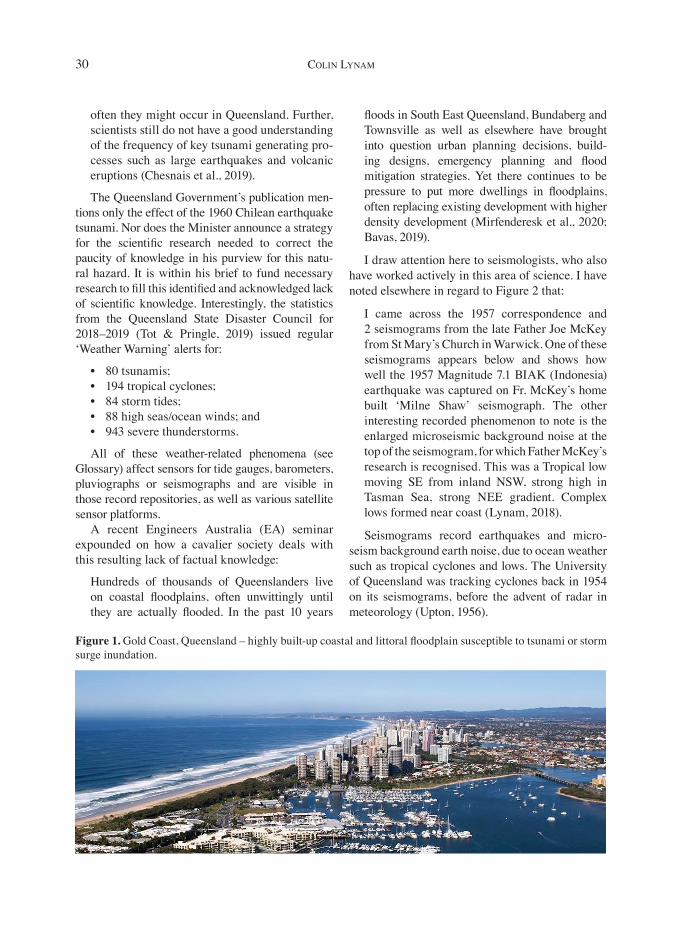
“Sandgate and Redcliffe residents report that quite a severe shock was felt in that region, and that the disturbance was so great as to create something of a tidal wave, the extent of which may be gauged from the fact that the sea washed right across the picture show enclosure at the head of the Sandgate jetty” (see Figure 3 below).
The Townsville Daily Bulletin, 11 June 1918, p. 4 (Anon., 1918b):
“The schooner Clyde arrived in port on Satur-day afternoon in charge of Cap tain Romer. When off Flat Top early on Friday morning, the Clyde encountered a tremen dous swell, which was probably caused by the earth tremors which were experienced at Mackay, and further south on Friday morning [Flat Top Island 21.162°S 149.246°E (5 km E of Mackay)].”
The earthquake epicentre was located offshore of Queensland, approximately north-east of Fraser Island and east of Heron Island. The Richter mag-nitude ~mb5.6 earthquake, generated a very wide swathe of felt effects across Central and South East Queensland. A survey of the public’s felt effects from this earthquake was conducted soon
32 Colin lynam
afterwards by Dr W. H. Bryan and Professor H. C. Richards from the former Department of Geology at The University of Queensland (Hedley, 1925). These original paper records are located in The University of Queensland Seismograph Stations Collections (now defunct). The nearest seismo-graph recording of this tremor was at Riverview Jesuit Observatory, Sydney, 1000 km to the south of Brisbane.
Unfortunately, all the tide gauge records for this same date in 1918 from the Pile Light pilot station (Brisbane River) are missing from their Queensland State Archives repository. I assume that the charts were borrowed and never returned: “I looked at the contents of B/3131 that covers 1910–1919 and there are no items dated in 1918 – your reference that all for 1918 were sent to British Admiralty may be right” (G. Dobeli, Queensland State Archives, pers. comm., 27 November 2017).
In the early 1970s, high-grade programmable (Hewlett-Packard) calculators became common instead of the standard mechanical Friden electric calculators, closely followed by larger university computer systems. Predictive approximation of tsunami travel times over ocean pathways were part of that era of transforming scientific metho-dology. Roger Braddock (Griffith University) was
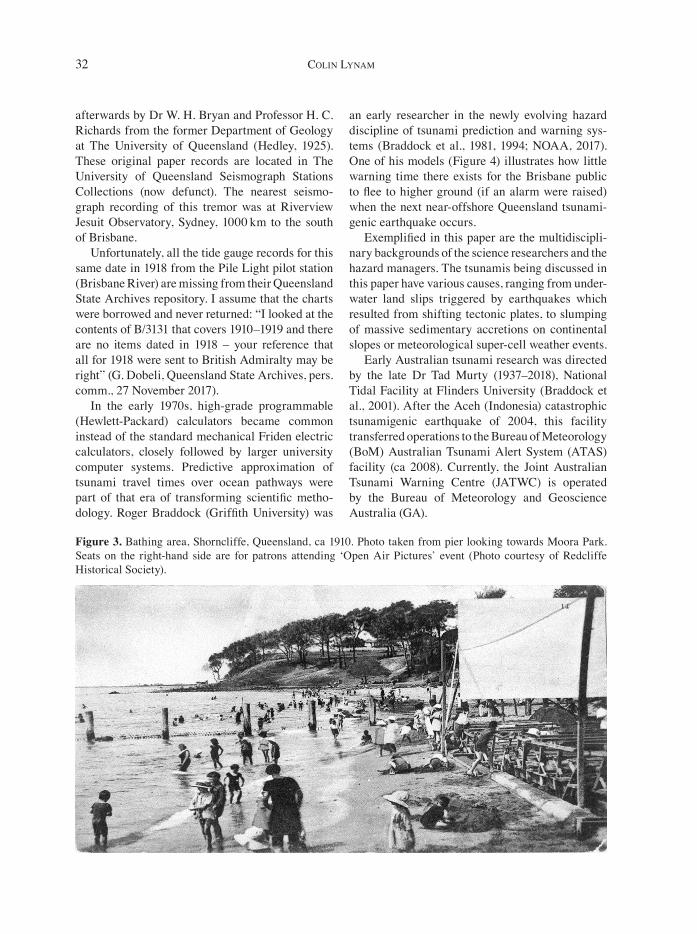
an early researcher in the newly evolving hazard discipline of tsunami prediction and warning sys-tems (Braddock et al., 1981, 1994; NOAA, 2017). One of his models (Figure 4) illustrates how little warning time there exists for the Brisbane public to flee to higher ground (if an alarm were raised) when the next near-offshore Queensland tsunami-genic earthquake occurs.
Exemplified in this paper are the multidiscipli-nary backgrounds of the science researchers and the hazard managers. The tsunamis being discussed in this paper have various causes, ranging from under-water land slips triggered by earthquakes which resulted from shifting tectonic plates, to slumping of massive sedimentary accretions on continental slopes or meteorological super-cell weather events.
Early Australian tsunami research was directed by the late Dr Tad Murty (1937–2018), National Tidal Facility at Flinders University (Braddock et al., 2001). After the Aceh (Indonesia) catastrophic tsunamigenic earthquake of 2004, this facility transferred operations to the Bureau of Meteorology (BoM) Australian Tsunami Alert System (ATAS) facility (ca 2008). Currently, the Joint Australian Tsunami Warning Centre (JATWC) is operated by the Bureau of Meteorology and Geoscience Australia (GA).
Figure 3. Bathing area, Shorncliffe, Queensland, ca 1910. Photo taken from pier looking towards Moora Park. Seats on the right-hand side are for patrons attending ‘Open Air Pictures’ event (Photo courtesy of Redcliffe Historical Society).
33Sea at Shorncliffe came Boiling UpwardS acroSS the BatherS
Figure 4. The tsunami travel time chart for Brisbane. The hypothetical epicentre (G) is located at 27.5°S and 154°E. Only the 1000 m, 3000 m and 5000 m bathymetric contours are shown on the chart, and the wave fronts are spaced at 20-minute intervals. Divergent zones are indicated by D1 and D2, and C indicates the location of the caustic (Source: Rynn, 1994).
Before establishing JATWC, BoM published a preparatory Australian tsunami statistics paper (Rynn & Davidson, 1999), and the seismologist author noted “false-tsunami”: “These include meteo-ro logical effects (such as hurricanes, cyclones, east coast lows and Southern Ocean Lows and tidal effects (such as tidal bores).”
In Queensland, recent research (Clarke et al., 2019; Rigby, 2017; Mollison et al., 2020) reveals evidence of massive seafloor slumping along our coast in the geological past. It can happen again:
Submarine landslides are present in water depths of approximately 400 to 3500 m along the entire length of continental margin, but are increasingly prevalent northward of Coffs
Harbour without clustering at any particular water depth. Two hundred sixty individual sub-marine landslide scars that are greater than 1 km in width have been identified. Of these, 36 have been calculated to produce a tsunami flow depth equal to or greater than 5 m at the coastline for an assumed landslide downslope velocity of 20 ms−1. Landslides that are both thick (> 100 m) and wide (> 5 km) have the greatest potential to generate the largest coastal flow depths of (> 10 m) (Clarke et al., 2019).
Tsunami Event, 27 August 1883 (Krakatoa Volcano Explosion, Indonesia)Further investigation reveals that this phenom-enon is not an unusual event. In a publication of The Royal Historical Society of Queensland, titled Chronicles of Coochiemudlo (Jones, 1993), we read of an August 1883 Moreton Bay (Qld) tsu-nami reportedly associated with the devastating explosion of the Krakatoa volcano in Indonesia on 27 August 1883. The tsunami waves had radiated around the oceans of the world:
“During the last week of August 1883, a cataclysmic event hit the island. What was described as a wall of water like a chalk mountain, surges down the Bay, flooding low lying contiguous areas as it swept towards Innes Island at great speed. Four men were washed overboard from a southern bound boat and were lost from view. On the western side of the island the wave tore through the mangroves before smashing into the cliff. On the eastern side the (Murwong) Beach bore the full force of the wave as it crashed through the casuarinas, and continued on its way to the southward, ripping off branches, snapping trunks, uprooting trees and leaving a trail of destruction.
“When the inundation had drained away, the island resembled a battlefield, with debris strewn all along (Norfolk) Beach and out into Moreton Bay.”
Other tsunami waves have been recorded on tide gauges along Australia’s east coast and docu-mented in newspapers. Some were triggered by
34 Colin lynam
large tsunamigenic earthquakes occurring as far distant as South American tectonic subduction plates. Such occurrences have actually caused minor damage in Australian ports. The coinci-dence of the arrival of a tsunami with a king tide is definitely a future disaster waiting to happen.
Sydney: “The Gauge is fixed at Fort Dennison the tidal wave of the harbour marked on the diagram made its appearance at 5:20 am on the 11th of May, 1887 and the oscillations gradu-ally increased to a maximum of 42 inches [1.067 m] and on the 13th they gradually died away.
“Note: The ‘Boomerang’ steamer was being taken on the A.S.N & Co slip at noon when one of the waves came in and lifted her suddenly off the cradle, and then receding, left her high and dry.”
Brisbane: “Several tidal disturbances have been observed in Moreton Bay. No gauge there for information.”s
Other tsunami events noted for Sydney: On 20 August 1868: “Greatest oscillation (crest to hollow) of 34 inches [0.864 m] and 25- minute interval between waves.”Another on 15–17 August 1878: “Greatest oscillation 31 inches [0.787 m] with average intervals of 25 minutes.”
(Josephson, 1878)
Tsunami Event, 11–13 May 1877 (Mw9 Iquique Earthquake, Chile)The Fort Dennison Tide Gauge (11 May 1877) dis-tinctively presents the tsunami’s effect on Sydney Harbour (Figure 5). This tsunami chart was pre-served in a scientific journal and illustrates the ongoing tsunami disturbance amplitude overlaying the daily high and low tide gauge measure ments. It is compared to the gauge at Newcastle (Josephson, 1878).
Tsunami Event, 22 May 1960 (Mw9.5 1960 Valdivia earthquake, Chile)Extract from Tsunami 94 Workshop, Brisbane, 25 August 1994:
“On May 22nd 1960, the ML8.3 Richter Magn itude earthquake from offshore Chile generated a radiating tsunami across the Pacific Ocean, travelling at 350 km / hr and reached the Australian coastline 17,000 km away some 17 hours later.“Brisbane – Boats moved from moorings in Cabbage Tree Creek, Shorncliffe. A 24-inch rise in sea level measured at the Pile Light gauge showing 16 rises over a 12-hour period.“Evans Head – 3 trawlers ran aground in freak waves.“Newcastle – Trawler sank. 8 launches ripped from moorings in Throsby Creek.“Sydney – Overturned several launches. Smashed barge into Spit Bridge. Set moored logs adrift in Balmain shipyards and swept them down Parramatta river. Swept away beach Clontarf Reserve Point Par. Exposed submarine cable.“Wilson’s Promontory – Large waves dis-turbed coastal areas.”
(Rynn, 1994)
Readers may be surprised by tsunamis’ speed: ~1000 km/h over deep (~5 km) ocean paths. Here I quote some pertinent points about tsunamis from Geoscience Australia’s fact sheet (Geoscience Aus-tralia, 2020):
• Tsunamis can travel at speeds up to 950 km/h in deep water, which is equivalent to the speed of a passenger jet.
• Several significant tsunamis have impacted Australia’s north-west coast region. The largest runup resulted from the 2006 Java tsunami that was recorded at 7.9 m AHD at Steep Point, Western Australia. The largest reported off-shore wave height was 6 m near Cape Leveque from the August 1977 Sunday tsunami.
• The tsunami that reached the Australia coast at Steep Point on 17 July 2006 was generated by a magnitude 7.7 earthquake south of Java. The tsunami caused widespread erosion of roads and sand dunes, extensive vegetation damage and destroyed several campsites up to 200 metres inland (Geoscience Australia, 2020; Pelinovsky, 1997; Gregson & Van Reeken, 1997).
35Sea at Shorncliffe came Boiling UpwardS acroSS the BatherS
Figure 5. Effects from tsunami (11 May 1887) at tide gauges for Fort Dennison (Sydney) and Newcastle.
Evidentiary Material (Part 2)Meteorological Tsunami (Meteotsunami) in South East Queensland – A Proposed New Typology of Weather-related HazardArchival evidence is presented of another form of tsunami with a weather-related causal driver (not seismic) – the ‘meteotsunami’ – whose occur-rence has been classified using a recently published climate hazard typology. Climate change researchers (Zscheischler et al., 2020) have identified this type
of climatic hazard in their new typology of com-pound weather systems, as ‘multivariate events’, which are defined by the co-occurrence of mul-tiple climate drivers and/or hazards in the same geographic region, causing a societal impact (Table 1). These meteo tsunami events will be clas-sified according to the researchers’ extreme-event typology. It will hopefully mesh the climatology research on ‘east coast lows’ with more tide gauge data analysis.
Table 1. Proposed climate event typology of the meteotsunami (Zscheischler et al., 2020).
Event ModulatorAssociated weather systems
Precondition Climatic drivers Hazard(s) Potential
impact
Compound precipitation and wind extremes
— Tropical and extra-tropical cyclones, severe storms
— NSW ‘east coast low’
Heavy precipitation, extreme winds, coastal erosion, meteotsunami
Infrastructure
36 Colin lynam
Only a few meteotsunamis have previously been described in Australia. They are reported in synoptic weather reports, newspaper archives and tide gauge reports in South East Queensland and Western Australia. The impact is felt as a sudden sequence of ocean waves with the climatic driver(s) causing a sudden onset of larger wave height near to the shore. Meteotsunamis are likely to sweep rock fisherman into the sea or cause rapid coastal erosion. For example, on 14 August 2014, port faci-lity damage was reported in Freemantle (Western Australia):
Strong currents generated by the Meteotsunami resulted in a ship being moved away from the quay and breaking the mooring bollard, which in turn released the next ship upstream which broke its mooring lines, moved upstream and struck a railway bridge which sustained severe damage (Metters, 2019; Pattiaratchi &Wijeratne, 2014).
The east coastal Australian meteotsunamis are caused by an intense low-pressure trough or micro-cyclonic or ‘super cell’ weather feature, explosively moving over large near-shore water. This asso-ciated weather system phenomenon is also known to meteorologists as an ‘east coast low’ (ECL) (Bureau of Meteorology, 2007; Rynn et al., 1999). It is similar to the intense weather mechanism that gives rise to water spouts or tornadoes. The phe-nomenon begins as wind-shear gravity air-pressure waves that abruptly induce a significant volume of water displacement, and this energy manifests as a deep long-wave period of 10 to 15 minutes, with a wave sequence of some 10–20 distinct waves travelling inshore and heightening as the sea floor shallows. These events are increasingly important because their hazard and their instance will be likely to increase with climate change extremes and threaten marine infrastructure (Pattiaratchi, 2016). In July 2020 we watched two such ECLs rapidly develop off the New South Wales coastline and cause coastal erosion.
The regular occurrence of these events (2–3 events per annum at any given location) in Western Australia involves a large spatial area – for example, a single system can influence water l evels over a region of several hundred kilometres as the intense thunderstorm travels along the coast.
In Queensland, this weather feature was observed by the State Coastal Management Branch:
The Gold Coast, with its low tidal range, has a relatively increased vulnerability to storm tide inundation compared with, for example, Mackay, where the tidal range is quite high. Significant non-cyclonic weather events such as monsoonal surges or deep extra-tropical sys-tems are capable of producing smaller but often more prolonged increases in coastal water levels. The available Gold Coast analyses include an allowance for easterly trough low weather sys-tems, based on the climatological analyses in McMonagle (1981) where the northern New South Wales coastline was examined in some detail. Future studies may consider the effect that low impact but higher frequency events might have on the overall statistics of water level variation (Harper, 1998).
Occurrence of these meteotsunami events around Australia is barely known, as no coordi-nated analysis between weather observers or tidal record observers has been undertaken routinely. These wave energy packets scour the shallow estu-aries and then crash their engorged mass onto the shore, with wave runups of 10–100 m above the high tide mark (HAT) (highest astronomical tide). The waves scour and carry sediment and expose buried wrecks. Their suddenness is a hazard to the public and infrastructure.
A New Instance of Meteotsunami on 6 June 1917 (Causal Trigger: Local ‘Super Cell’ Weather System)The Brisbane Courier, Friday, 8 June 1917, p. 6 (Anon., 1917b):
“OCEAN PHENOMENON. “SUDDEN MOUNTAINOUS SEAS IN CALM WEATHER.“BOATING PARTIES’ SENSATIONAL EXPERIENCE.“An ocean phenomenon occurred on Wednes-day night. At dusk the sea was quite calm along the south-eastern coast, but at 6 o’clock, without any apparent reason, the air being comparatively still, a heavy swell suddenly
37Sea at Shorncliffe came Boiling UpwardS acroSS the BatherS
set in, and by midnight great breakers were rolling in heavily on the beaches. The state of the sea was officially recorded as “4.” The booming of the mountainous breakers on Moreton and Stradbroke Islands was so plainly heard in Wynnum and Manly, 17 to 20 miles away, that the sleep of a number of residents was disturbed and yesterday the roar of the surf was more plainly heard than has been the case for many years. At the time the sea suddenly rose six motor boats were anchored off the Yellow Patch. They were the Gee Whiz and Wynnum (owned by Mr. Crouch of Wynnum), Ethel (manned by Arthur Ackworth and Joseph Clett), Rewa (owned by Mr. W. Crouch of Bulimba), and two sharpies (belonging to Messrs. Lihou Bros., of Sandgate). The Ethel’s engines broke down, and the Rewa and the two sharpies attempted to tow her away from the shore, but were not successful. As they were in danger themselves, they were forced to leave the Ethel, and battled against the heavy sea until they reached Bribie Passage in the early hours of yesterday morning. The Wynnum was washed ashore at Yellow Patch and smashed, but the Ethel managed to reach Cowan-Cowan. The crews of all the boats were landed safely. A dinghy belonging to the Rewa, with a net, was lost, but as there is a boat lying upside down at Yellow Patch it is thought to be the dinghy. The boat, which was completely wrecked, was 30ft. in length, with an 8 hp engine, and was valued at about £300. She was not insured. The sea was so heavy that the pilot steamer Matthew Flinders was unable to return from the North-West Channel to the Cape, and took shelter at Caloundra. The cause of the sudden agitation of the sea can, of course, only be surmised at present. It may have been due to the tropical disturbance that has been in existence off the Queensland coast for several days, or to a tidal wave caused by some submarine upheaval.”
I have located the Brisbane tide gauge chart for 6 June 1917 in the Queensland State Archives, but the copy of its traces is seriously faded and not interpretable (Queensland State Archives Series
ID 16939, Tidal Records, 2020). Instead, I will util-ise physical observation data (Table 2) to summarise and compare it with the known documented South East Queensland meteotsunami of 3–4 December 2016, which was detected on 34 tide gauges in South East Queensland (Metters, 2019; Anon., 2017). By this comparative process, I hope to reasonably jus-tify and record this new meteotsunami occurrence, in the absence of a related tide gauge record.
The evidence for this new meteotsunami is derived from two newspaper clips. One is from The Brisbane Courier, “Ocean Phenomenon”, above, which gives a detailed observational account of several fishermen’s experiences of the marine phenomena occurring on Wednesday, 6 June 1917 at 6.00 pm. The other is a contemporaneous weather description found in The Telegraph, which is more descriptive than that available in BoM records. The anecdotal account describes the noticeable rapid onset of large surf, the force of the currents, the related weather conditions and the duration of over 12 hours, together with the loud-sounding noise of waves.
Proposed Meteotsunami, 6 June 1917 – Weather Synopsis for Brisbane, 6 June 1917The Telegraph, Wednesday, 6 June 1917, p. 4 (Anon., 1917a):
“Weather Reports.“Intense Anticyclone.
“The small anticyclonic nucleus which existed over south eastern Queensland and north east-ern New South Wales has not moved in the last 24 hours, but it has contracted consider-ably … An interesting feature of the chart is the sudden development of a tropical dis-turbance. Last Saturday’s chart gave some indication of the formation of a depression between the far northern coast of Queensland and the Solomon Islands. Instead of approach-ing our north eastern coast, it appears to have moved on a south easterly course at a great distance from our seaboard, and to-day, there is no doubt whatever that it exists with a con-siderable degree of intensity between Sandy Cape and New Caledonia, the centre at 9 a.m. to-day being approximately west-south-west
38 Colin lynam
from Noumea … It is interesting to note that it has made progress in spite of the intense anti-cyclone before referred to, and if the l atter should maintain its position and inten-sity during the next 21 hours, the course of the tropical disturbance will in all probability be deflected southward, and our coastal regions south of Sandy Cape may experience showery and somewhat squally conditions under the influence of its south-east quadrant.”
Meteotsunami of 3–4 December 2016 (Causal Trigger: Local ‘Super Cell’ Weather System) The scientific description of this event is explained by Metters (2019):
Meteorological tsunami (or meteotsunami) have characteristics similar to earthquake generated tsunami, however the driving force behind them are air pressure disturbances associated with fast moving weather systems. A meteotsunami gener ated by a fast moving severe thunder storm was reported along the east coast of Australia in December 2016. The meteotsunami wave speed, it’s [sic] driving force and general character-istics are described here. The meteotsunami was
recorded in coastal South-East Queensland water level stations in Moreton Bay, Brisbane River, and Gold Coast and in Gold Coast waterways. The driving mechanism behind the meteotsunami is described as the change in atmospheric pressure as the thunder storm travelled across the coast. The pressure step ranged from 5.5 hPa to 9.9 hPa over 18 to 99 minutes. The meteotsunami signal travelled up to 10.6 m/s within the Brisbane River and slowed as it travelled upstream to 5.8 m/s in the upper reaches and into the Bremer River. Meteotsunami wave height ranged from 0.13 m to 0.46 m.The quantitative measurements of Figure 6
show a tide gauge sea level and barometric pressure recorded meteotsunami of 3–4 December 2016; the chart illustrates four traces:
• Chart 1: The actual tide gauge plot (24-hour high and low tides) with the superimposed disturbance of the meteotsunami over 10–12 hours, and a maximum of 0.41 m wave height.
• Chart 2: Where the diurnal tide effect is fil-tered, illustrating the meteotsunami effect.
Figure 6. Meteotsunami records for South East Queensland (3–4 December 2016) – water level and atmospheric pressure at Southport Beach, non-filtered and high-pass filtered.
39Sea at Shorncliffe came Boiling UpwardS acroSS the BatherS
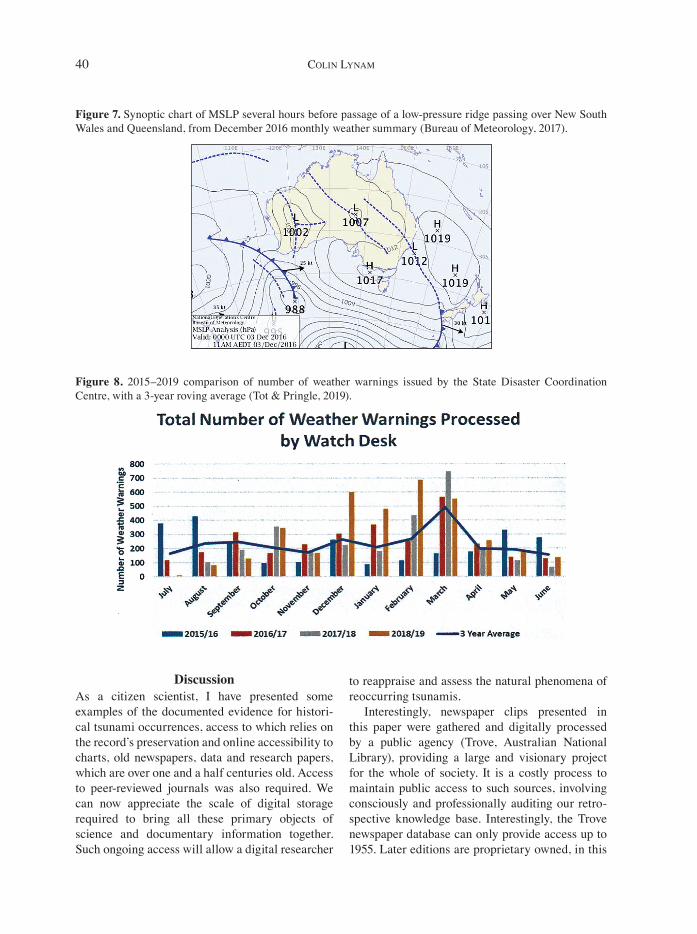
A Bureau of Meteorology weather synoptic chart (Figure 7) shows the progress of a low-pressure trough that caused thunderstorms in the Brisbane region. A YouTube video gives an awesome presen-tation of the weather phenomena that caused the meteotsunami of 3 December 2016 (PCR Aerial Photography, 2016).
The significance of recognising these meteo-tsunami phenomena in South East Queensland is their causal relationship with the growing inci-dence of super cell thunderstorms and east coast lows (October–January) as mentioned in the intro-duction. The plot in Figure 8 shows their steady increase over the last three years.
Table 2. Comparative descriptors of common features of two meteotsunami events in South East Queensland.
Even
t dat
e
Tid
e ga
uge
reco
rd
Dur
atio
n
Wav
e he
ight
&
peri
od
Are
al e
xten
t
Phen
omen
a re
port
s
Lite
ratu
re c
ited
3–4 December 2016, 2.00 pm
36 tide records
10 hours 0.4 m; 10–50 minutes
Burnett Heads to Tweed border and 50 km up Brisbane River
Synoptic weather: The first storm (supercell thunderstorm) swept through Brisbane’s CBD, Brisbane Airport, Nudgee, Samford and Albany Creek about 5.25 pm, before moving north-east all the way through to waters off Bribie Island. Another storm cell hit Boonah, Laidley, Gatton, Esk’s west and south-west, and Burpengary and Brighton about 5.50 pm.
DSITI publication, February 2017 (Anon., 2017).Meteorology report, ABC News (McLeish & Staff, 2016). BoM December 2016 climate report (Bureau of Meteorology, 2017).
6 June 1917, 6.00 pm
None readable
12 hours 1.25–2.5 mState of sea: “4”
Caloundra to Stradbroke Island
Without any apparent reason, the air being comparatively still, a heavy swell suddenly set in, and by midnight great breakers were rolling in heavily on the beaches. The state of the sea was officially recorded as “4”. The booming of the mountainous breakers on Moreton and Stradbroke islands was so plainly heard in Wynnum and Manly, 17 to 20 miles away, that the sleep of a number of residents was disturbed. Synoptic weather: “The small anticyclonic nucleus which existed over SE Queensland and NE New South Wales has not moved in the last 24 hours, but it has contracted considerably.”
The Brisbane Courier, Friday, 8 December 1917 (Anon., 1917b).The Telegraph, Wednesday, 6 June 1917 (Anon., 1917a).
40 Colin lynam
Figure 7. Synoptic chart of MSLP several hours before passage of a low-pressure ridge passing over New South Wales and Queensland, from December 2016 monthly weather summary (Bureau of Meteorology, 2017).
Figure 8. 2015–2019 comparison of number of weather warnings issued by the State Disaster Coordination Centre, with a 3-year roving average (Tot & Pringle, 2019).
DiscussionAs a citizen scientist, I have presented some examples of the documented evidence for histori-cal tsunami occurrences, access to which relies on the record’s preservation and online accessibility to charts, old newspapers, data and research papers, which are over one and a half centuries old. Access to peer-reviewed journals was also required. We can now appreciate the scale of digital storage required to bring all these primary objects of science and documentary information together. Such ongoing access will allow a digital researcher
to reappraise and assess the natural phenomena of reoccurring tsunamis.
Interestingly, newspaper clips presented in this paper were gathered and digitally processed by a public agency (Trove, Australian National Library), providing a large and visionary project for the whole of society. It is a costly process to maintain public access to such sources, involving consciously and professionally auditing our retro-spective knowledge base. Interestingly, the Trove newspaper database can only provide access up to 1955. Later editions are proprietary owned, in this
41Sea at Shorncliffe came Boiling UpwardS acroSS the BatherS
era of newspaper closure. Will that knowledge ever be preserved? The Trove project’s funding ceased in 2016 (Jones & Verhoeven, 2016).
I have discussed cases where the public service is not meticulously preserving its own scientific data suites for future analysis. Professional engi-neers have also expressed similar concerns that data preservation and archiving are not occur-ring. It has been observed by the professional body Engineers Australia (formerly The Institution of Engineers Australia, or IEAust) that:
According to a paper released by IEAust’s National Committee on Coastal and Ocean Engineering, there is a worrying trend in the Australian public sector which is seeing data collection programs lapse as governments devolve their work to the private sector (Gordon, 1993).
Similarly, in 1994, Mr Rob Tucker, a previous chairman of IEAust’s Coastal and Ocean Com-mittee wrote:
Australian governments are developing a casual attitude to data monitoring – partly because there have been so few disasters over the past two centuries and we are complacent about the risks (Tucker, 1994).
A Royal Society of Queensland researcher, David Marlow, observed in his recent paper:
A public sector shorn of such capabilities can no longer contribute as it should to government decision making. The end result will inevi tably be misdirected governmental priorities and flawed governmental decisions. When scientific advice – almost always cautious, given scientists’ natural reliance on demonstrable evidence – is discarded, there is the risk of wide-spread and often permanent environmental damage and inadequate management of increasingly stressed ecosystems. Society in general will suffer as problems unnecessarily persist, because oppor-tunities have been lost and resources and funding wasted. The problems themselves become less amenable to solution, because of the loss of focus in addressing them – and the loss of skilled per-sonnel to address them.
However, the cruellest cost is wasted time –
priceless, irrecoverable time – where genuine progress to a better future for the state or the nation is erased as if it had never existed (Marlow, 2019).
The Australian Government’s regulated record-keeping process is designed for business records (fiscal and HR administrative files) which are uti-lised by all agencies, but it is driven more by the cost savings derived from less floor space for paper file storage. There is a concern that all levels of government emphasise the digitisation of their business records in order to conform to regula-tions requiring conversion of paper records into knowledge- management information systems. Such a business focus is very skewed and not widely comprehended.
Government regulatory prescriptive archival retention guidelines (legal file destruction) are devised by respective record-keeping agencies whose expertise originates from old public service filing systems. One would be hard pressed to find a preservation or retention category that reflects the longitudinal preservation value of the daily scientific tide chart and the daily seismograph or synoptic weather charts. These are, nevertheless, all classified as public documents. To deliberately destroy such records, by neglect or wanton vandal-ism, is a criminal offence.
Is this short-sightedness the result of faulty archival directives, or a public service cultural arte-fact? In a study on the introduction of computers to the Queensland Public Service, the State Planning Officer (Mr Ken S. Pope) observed: “I found the public service to be rigid and highly structured. This explains to some extent the delays I received in trying to get the computer going (Pope 1997: pers. comm., 4 November)” (Kelk, 2001).
A study of the Commonwealth Bureau of Meteorology (Gardner, 1997) best explains the causal origins of lack of scientific expertise in the modern ‘shop front’ public service. This brief snippet does little justice to that author’s interest-ing work:
Unfortunately for the Bureau, the fact that it came under the purview of the Public Service Board (PSB), even though it had its own Act of Parliament, meant that it could not obtain per-mission to employ research scientists, despite
42 Colin lynam
an intense lobbying effort supported by its minister and departmental secretary. The PSB mandarins were less than amenable. They were not prepared to follow the precedent set by the employment of research scientists within the Department of Supply and allow bureau staff access to the same arrangements, apparently because it was judged to be inappropriate at the time (confidential comment to Gardner, 1997).
ConclusionEarthquake and tsunami observational research is sorely needed in Queensland, for scientific, engineering and urban hazard planning reasons. Engineers and scientists must be better prepared (at undergraduate level) to preserve and consciously curate and protect their project data by moving it to digital archive-compatible information plat-forms. They must proactively re-educate their chief archival and information technology (IT) officers on the long-term (100-year) preservation requirements for existing scientific data repositories, analogue charts and databases, and the related metadata used to calibrate those charts. They must also implement an information management audit plan, document-ing which IT operational programming and digital data backups were used in their research. Such a schema was introduced as mandatory in 2019 for the Commonwealth Grants Scheme administered by the Australian Government Depart ment of Education and Training (Dodd, 2020). It must be carried for-ward with each new hardware system changeover.
In summary then, unlike politicians or public servants, both engineers and academic scientists operate under codes of conduct or ethics:
All practitioners are expected by the community to act responsibly in their professional duties associated with the coastal zone. This includes the concept of being fit and proper, by virtue of training and experience, to undertake such work whether for reward or not. They are expected to devote the requisite time to each particular undertaking so as to render an outcome that would be considered “competent”. In particu-lar, it is their duty to maintain awareness of the current state of the art of their profession and to obtain specialist advice whenever necessary. Engineers are required by their Institution to act
in a manner that accelerates achievement of sus-tainability (NCCOE, 2004).
Learned Societies, such as The Royal Society of Queensland, are also setting high standards by pro-viding new digital platforms (Queensland Science Network) for citizen scientists to preserve collec-tion data and filed analysis, for re-use by other researchers.
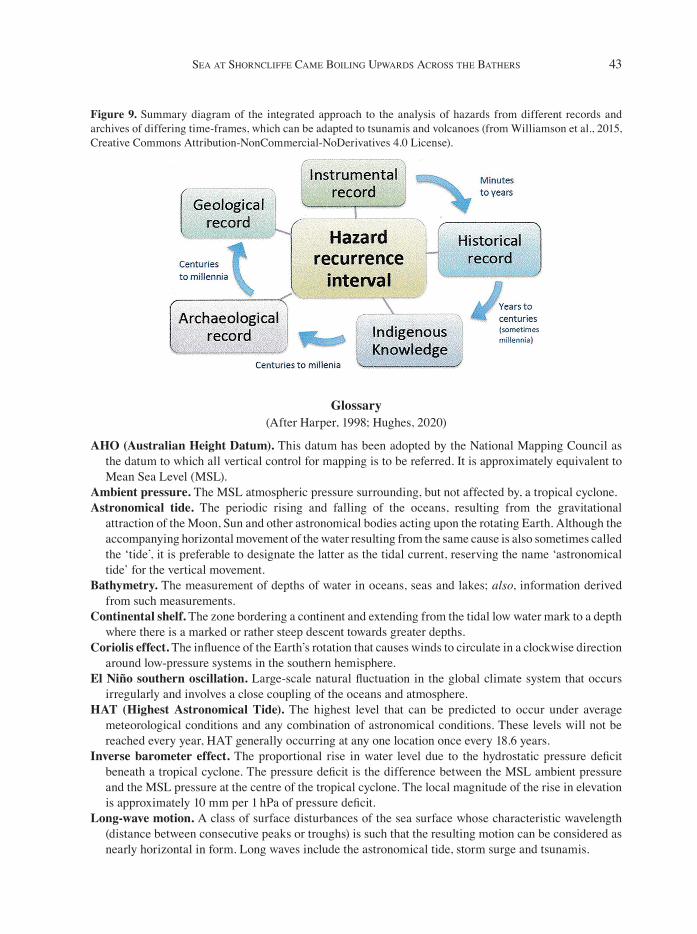
What does an international standard for pre-serving observational data look like? This paper has exemplified, in a small way, the rich know-ledge inter-relatedness of tsunami data, climate data sources, newspaper records and observational sources, both historical and future, which will allow modern climate researchers to build a Hazard Recurrence Interval schema, through data-mining techniques enabled by super-computer facilities. This know ledge schema can be utilised by the wider academic community and even the general public, in multiple disciplines of study. Figure 9 graphi-cally represents the global aspirational develop-ment currently taking place. In addition to the climate typology classification already discussed, there are systems developed by the International Atmos pheric Circulation Reconstruction (ACRE) researchers (e.g. Williamson et al., 2015), as well as the Euro pean FAIR data principles (Findable, Accessible, Inter operable and Re-usable) being adapted inter nationally. Resistance to their adap-tation (David, 2020) derives from not recognis-ing basic record-keeping practice and adapting the data re-use ethos that is contrary to old academic ‘secrecy’ practice. That is another story realm for a later day.
As a quick and final prompt, I reiterate that stor-age is not preservation because (Harrower et al., 2017):
• What you store can be corrupted or the stor-age media can fail, causing data loss.
• As technology and software change, data can become technologically inaccessible.
• Files ‘saved’ on their own may not be find able by search procedures; they need metadata to allow us to find them.
• Any kind of file needs context to make it meaningful, such as dates, subjects, titles, authors, and name of platform.
43Sea at Shorncliffe came Boiling UpwardS acroSS the BatherS
Figure 9. Summary diagram of the integrated approach to the analysis of hazards from different records and archives of differing time-frames, which can be adapted to tsunamis and volcanoes (from Williamson et al., 2015, Creative Commons Attribution-NonCommercial-NoDerivatives 4.0 License).
Glossary(After Harper, 1998; Hughes, 2020)
AHO (Australian Height Datum). This datum has been adopted by the National Mapping Council as the datum to which all vertical control for mapping is to be referred. It is approximately equivalent to Mean Sea Level (MSL).
Ambient pressure. The MSL atmospheric pressure surrounding, but not affected by, a tropical cyclone.Astronomical tide. The periodic rising and falling of the oceans, resulting from the gravitational
attraction of the Moon, Sun and other astronomical bodies acting upon the rotating Earth. Although the accompanying horizontal movement of the water resulting from the same cause is also sometimes called the ‘tide’, it is preferable to designate the latter as the tidal current, reserving the name ‘astronomical tide’ for the vertical movement.
Bathymetry. The measurement of depths of water in oceans, seas and lakes; also, information derived from such measurements.
Continental shelf. The zone bordering a continent and extending from the tidal low water mark to a depth where there is a marked or rather steep descent towards greater depths.
Coriolis effect. The influence of the Earth’s rotation that causes winds to circulate in a clockwise direction around low-pressure systems in the southern hemisphere.
El Niño southern oscillation. Large-scale natural fluctuation in the global climate system that occurs irregularly and involves a close coupling of the oceans and atmosphere.
HAT (Highest Astronomical Tide). The highest level that can be predicted to occur under average meteorological conditions and any combination of astronomical conditions. These levels will not be reached every year, HAT generally occurring at any one location once every 18.6 years.
Inverse barometer effect. The proportional rise in water level due to the hydrostatic pressure deficit beneath a tropical cyclone. The pressure deficit is the difference between the MSL ambient pressure and the MSL pressure at the centre of the tropical cyclone. The local magnitude of the rise in elevation is approximately 10 mm per 1 hPa of pressure deficit.
Long-wave motion. A class of surface disturbances of the sea surface whose characteristic wavelength (distance between consecutive peaks or troughs) is such that the resulting motion can be considered as nearly horizontal in form. Long waves include the astronomical tide, storm surge and tsunamis.
44 Colin lynam
MSLP (Mean Surface Level Pressure). The surface pressure reduced to sea level. Solid lines are isobars, i.e. lines of equal MSLP. These charts show surface pressure patterns – areas of high and low pressure which are associated with different weather types. Usually, low-pressure systems (cyclones or depressions) bring unsettled weather whilst high-pressure systems (anticyclones) are associated with settled weather. In the northern hemisphere the air rotates counterclockwise around the low-pressure centres and clockwise around the high-pressure centres (the opposite applies in the southern hemisphere). Wind speed is roughly proportional to the distance between isobars: so closely packed isobars mean strong winds, and vice versa.
Radius of maximum winds. The distance from the centre of a tropical cyclone, where winds are calm, to the point where the surface wind speeds are greatest (at the position of maximum radial pressure gradient).
Return period. Also known as average recurrence interval or ARI. The return period of an event, normally expressed in years, is the average time between successive events of equal or greater magnitude. The actual time between such events may be greater or less than this period due to the randomness of the process. The inverse of the return period is the average annual probability of exceedance, which remains constant from one year to the next, regardless of whether a given event has or has not occurred.
Sea is generated by local winds at the time of observation. It is characterised by short, discontinuous crest lengths that are closely spaced and often associated with white capping.
Spring tidal range. The difference in height between MHWS (mean high water springs) and MLWS (mean low water springs). MHWS is the long-term average of the heights of two successive high waters during those periods of 24 hours (approximately once per fortnight) when the range of tide is greatest, at full and new moon. MLWS is the long-term average value of two successive low waters over the same period as defined for MHWS.
Storm surge. A rise above normal water level on the open coast due to the combined effects of surface wind stress and atmospheric pressure fluctuations caused by severe weather events (e.g. tropical cyclones).
Storm tide. The combined action of storm surge and astronomical tide.Swell has travelled to the coast after being generated by winds at a distant location. It is characterised by
long, continuous crest lengths. At times, particularly during storms, there may be a coincidence of both sea and swell.
Tropical cyclone. Also known as a hurricane or typhoon. An intense, large-scale low-pressure storm system of tropical origin with cyclonically rotating mean winds at the sea surface (clockwise in the southern hemisphere) in excess of gale force (63 km/hr, 34 kt, or 17.5 m/s).
Tsunami. Tsunami is a Japanese word: tsu meaning harbour and nami meaning wave. A transient long-period wave typically caused by an underwater disturbance such as an earthquake, volcanic eruption or landslide. Tsunamis can travel very long distances across oceans and affect remote coasts, often being amplified as they enter shallow waters, and are capable of significant inundation. Tsunamis are sometimes incorrectly termed tidal waves.
Wave runup. The rush of water up against a structure or beach on the breaking of a wave. The amount of runup is the vertical height above still-water level to which the rush of water reaches. In the present report, runup is measured from the quasi-steady wave setup level.
Wave setup. A quasi-steady super-elevation of the water surface due to the onshore mass transport of water caused entirely by the action of breaking waves. Wave setup is sometimes included in calculations of wave runup.
45Sea at Shorncliffe came Boiling UpwardS acroSS the BatherS
Literature CitedAnon. (1917a, 6 June). Weather Reports. The Telegraph, p. 4 https://trove.nla.gov.au/newspaper/article/
177908752?browse=ndp%3Abrowse%2Fplace%2FQueensland%2FT%2Ftitle%2F840%2F1917%2F06 Anon. (1917b, 8 June). OCEAN PHENOMENON. The Brisbane Courier, p. 6. http://nla.gov.au/nla.
news-article20142767 Anon. (1918a, 7 June). EARTH TREMOR. QUEENSLAND SHAKEN. The Daily Standard (2nd ed.),
p. 5. http://nla.gov.au/nla.news-article179406752 Anon. (1918b, 11 June). The Townsville Daily Bulletin, p. 4. http://nla.gov.au/nla.news-article59888972 Anon. (2017). Fact Sheet – Meteotsunami in Queensland. Coastal Impact Unit, Queensland Department
of Science Information Technology and Innovation. Retrieved 5 May 2020, from https://www.publications.qld.gov.au/dataset/tsunami-modelling-east-queensland-coast
Bavas, J. (2019, 27 July). Queensland tsunami modelling shows how coastal communities will be impacted. ABC News. https://www.abc.net.au/news/2019-07-27/queensland-tsunami-modelling/11330678
Braddock, R. D. (1994, 25 August). Physical Response to Ocean Earthquake – estimated travel times [Workshop presentation, p. 67]. National Tsunami Workshop, Brisbane.
Braddock, R. D., Doilibi, P., & Voss, G. (1981). Constructing tsunami travel time charts, Marine Geodesy, 5(2), 131–144.
Braddock, R., Murty, Y., & Matsutomi, H. (2001). Selected papers from Tsunami Symposium, held as part of the IAPSO conference in Melbourne, Australia, 2–4 July 1997. Natural Hazards, 24(3), 197–318. https://doi.org/10.1023/A:1017301827393
Briggs, C. (2017, 8 February). Researchers discover underwater landslide ‘30 times the volume of Uluru on Great Barrier Reef’. ABC News. http://www.abc.net.au/news/2017-02-08/researchers-discover- underwater-landslide-30-times-volume-uluru/8248756
Bureau of Meteorology. (2007). About East Coast Lows – NSW Regional Office. Retrieved 24 April 2020, from http://www.bom.gov.au/nsw/sevwx/facts/ecl.shtml
Bureau of Meteorology. (2017). Monthly Climate Summary for Brisbane (Product code IDCKGC14L0). http://www.bom.gov.au/climate/current/month/qld/archive/201612.brisbane.shtml
Chesnais, M., Green, A., Sexton, J., Davies, G., Boswood, P., & Power, H. (2019). Tsunami Guide for Queensland. The QFES Hazard and Risk Unit. Retrieved 23 April 2020, from https://www.disaster.qld.gov.au/qermf/Documents/Tsunami-Guide-For-Queensland.pdf
Clarke, S. L, Hubble, T. C. T., Miao, G., Airey, D. W., & Ward, S. N. (2019). Eastern Australia’s submarine landslides: implications for tsunami hazard between Jervis Bay and Fraser Island. Landslides, 16(11), 2059–2085.
Dali’Osso, F., & Dominey-Howes, D. (2016). ‘Reducing the loss’: Using high-resolution vulnerability assessments to enhance tsunami risk reduction strategies. The Australian Journal of Emergency Management, 25(4), 24–30.
David, R., Mabile, L., Specht, A., Stryeck, S., Thomsen, M., Yahia, M., Jonquet, C., Dolle, L., Jacob, D., Bailo, D., Bravo, E., Gachet, S., Gunderman, H., Hohlbecq, J., Ionnidis, V., Le Bras, Y., Lerigoleur, E., Cambon-Thomsen, A., & the Research Data Alliance-SHARing Reward and Credit (SHARC) Interest Group. (2020). FAIRness Literacy: The Achilles’ Heel of Applying FAIR Principles. Data Science Journal, 19(1), 32.
Dodd, T. (2020, 28 January). Group of Eight universities in push to make research data public. The Australian. https://www.theaustralian.com.au/higher-education/group-of-eight-universities-in-push-to-make- research-data-public/news-story/9b80f0251275b2f236c93a6b5213fdeb
Environment and Science, Queensland Government. (2016). Tsunami Modelling along the East Queensland Coast and Meteotsunami in Queensland (Licensed under Creative Commons Attribution 4.0). Retrieved 23 April 2020, from https://www.publications.qld.gov.au/dataset/tsunami-modelling- east-queensland-coast
46 Colin lynam
Gardner, J. (1997). Stormy Weather: A History of Research in the Bureau of Meteorology (Metarch Papers, No. 11). Bureau of Meteorology.
Geoscience Australia. (2020). What is a tsunami? GeoscienceAustralia. https://www.ga.gov.au/scientific- topics/community-safety/tsunami
Gordon, A. D. (1993). At What Price Data? National Committee on Coastal and Ocean Engineering, The Institution of Engineers Australia. Prepared for submission to Federal Resource Assessment Commission Coastal Zone Inquiry.
Gregson, P. J., & Van Reeken, L. A. (1997). Tsunami Observations for Western Australia. In Proceedings of the Australian Earthquake Engineering Society, 1997, University of Queensland Brisbane (pp. 27-1–27-5). Australian Earthquake Engineering Society. http://aees.org.au/wp-content/uploads/2013/11/Papers-21-to-30.pdf
Harper, B. (1998). Storm Tide Threat in Queensland: History, prediction and relative risk (Conservation Technical Report No. 10). Queensland Department of Environment and Heritage.
Harrower, N., & Cassidy, K. (2017, 18 November). Why Storage is not Preservation: A Conversation, surrounded by Conservation (A blog dialogue by DRI’s Kathryn Cassidy @angrybunnie and Natalie Harrower @natalieharrower, set in Oxford University’s Museum of Natural History). Digital Repository of Ireland. https://dri.ie/why-storage-not-preservation-conversation-surrounded-conservation
Hedley, C. (1925). The Queensland Earthquake of 1918. Transactions of the Royal Geographic Society, Queensland, 1(16), 151–156.
Hughes, M. (2020). Coastal waves, water levels, beach dynamics and climate change, Coastadapt factsheet. Bureau of Meteorology. Retrieved 15 August 2020, from https://coastadapt.com.au/sites/default/files/factsheets/T3I4_Coastal_waves.pdf
The Institution of Engineers Australia. (1994). Loss of data collection could blow out engineering costs. Engineering Times, March 1994, 3.
Jones, E. F. (1993). Coochiemudlo Islands in the Nineteenth Century. In J. Pearn (Ed.), Chronicle of Coochiemudlo, selected vignettes of the Social and Natural History of Coochiemudlo Island, Moreton Bay, Queensland. The Royal Historical Society of Queensland.
Jones, M., & Verhoeven, D. (2016, 26 February). Treasure Trove: why defunding Trove leaves Australia poorer. The Conversation. http://theconversation.com/treasure-trove-why-defunding-leaves-australia- poorer-55217
Josephson, J. P. (1878). Some facts about the Great Tidal Wave, May 1877. Journal and Proceedings of the Royal Society of New South Wales, 12, 103–115.
Kelk, M. J., (2001). A History of the Factors Involved in Decisions on the Adoption of Computers to the Queensland Government and the Subsequent Initial Problems: 1956–1984 [Master’s thesis]. Queensland University of Technology.
Lynam, C. J. (2018). In the 1950’s, a priest from Warwick (Qld) was inspired to discover cyclone related microseismic research on his home-built instruments. Newsletter of the Seismological Association of Australia Inc., MarApr 2018, 7.
Marlow, D. (2020). Creating and then abolishing bodies of scientific knowledge, expertise and analytical capability: An Australian political malaise. Proceedings of The Royal Society of Queensland, 124, 27–48.
McLeish, K., & Staff. (2016, 4 December). Brisbane storm: Teen struck by lightning, thousands with out power in Queensland storms. ABC News. https://www.abc.net.au/news/2016-12-03/storms- lash-queensland-as-heatwave-continues/8089680
Metters, D. (2019). Towards a meteotsunami early warning system: Estuary travel speed and general characteristics of a meteorological tsunami on the east coast of Australia [Online]. In Australasian Coasts and Ports 2019 Conference: Future directions from 40 [degrees] S and beyond, Hobart, 1013 September 2019 (pp. 1301–1307). Engineers Australia. https://search.informit.com.au/ documentSummary;dn=801428431137365;res=IELENG
Mirfenderesk, H., Molino, S., & Boswood, P. (2020, 12 February). Challenges of Coastal Living –
47Sea at Shorncliffe came Boiling UpwardS acroSS the BatherS
Floodplain manage ment, sea level rises and tsunamis: Towards a more flood resilient future (Seminar at Griffith University Gold Coast campus). Engineers Australia. https://www.engineersaustralia.org.au/event/2019/12/challenges-coastal-living-floodplain-management-sea-level-rises-and-tsunamis
Mollison, K. C., Power, H. E., Clarke, L. C., Baxter, A. T., Lane, E. M., & Hubble, T. C. (2020). The Sedimentology and tsunamigenic potential of the Byron Bay submarine landslide off New South Wales, Australia. Geological Society, London, Special Publications, 500, 27–40.
NCCOE (National Committee for Coastal and Ocean Engineering). (2004). Guidelines for Responding to the Effects of Climate Change in Coastal and Ocean Engineering 2004 update. Engineers Australia.
NOAA (National Oceanic and Atmospheric Administration). (2017). Estimated Tsunami Travel Times to Coastal Locations (Map). https://maps.ngdc.noaa.gov/viewers/ttt_coastal_locations/
Pattiaratchi, C. (2016). Developing better predictions for extreme water levels: Annual project report 2015–2016. Department of Industry, Innovation and Science; Business Cooperative Research Centres Programme, Canberra. https://www.bnhcrc.com.au/sites/default/files/managed/downloads/t1n03_pattiaratchi_uwa_bnhcrc_project_report_2016_final_edited_and_approved_mpr_1.pdf
Pattiaratchi, C., & Wijeratne, E. (2014, 10 September). Explainer: how weather can trigger dangerous tsunamis. The Conversation. https://theconversation.com/explainer-how-weather-can-trigger-dangerous- tsunamis-29584
PCR Aerial Photography. (2016, 3 December). December 3rd 2016 Supercell Storm over South East Brisbane [Video]. YouTube. https://www.youtube.com/watch?v=Th_E7PlubwY
Pelinovsky, E. (1997). Preliminary Estimates of Tsunami-Risk for Australia. In Proceedings of the Australian Earthquake Engineering Society, 1997, University of Queensland, Brisbane (pp. 25-1–25-4). Australian Earthquake Engineering Society. http://aees.org.au/wp-content/uploads/2013/11/Papers-21-to-30.pdf
Queensland State Archives. (2020). Tidal Records (Series ID 16939). http://www.archivessearch.qld.gov.au/Search/SeriesDetails.aspx?SeriesId=16939
Rigby, M. (2017, February). Researchers discover underwater landslide ‘30 times the volume of Uluru’ on Great Barrier Reef. ABC News. https://www.abc.net.au/news/2017-02-08/researchers- discover-underwater-landslide-30-times-volume-uluru/8248756
Rynn, J. M. (1994). Brief Notes on Tsunamis in “Tsunami 94” workshop in Pacific Tsunami Workshop, Brisbane, 25 August 1994. Bureau of Meteorology Queensland Regional Office.
Rynn, J. M., & Davidson, J. (1999). Contemporary Assessment of Tsunami Risk Implications for Early Warnings for Australia and Its Island Territories, The International Journal of The Tsunami Society, 17(2), 107–126.
Tot, R., & Pringle, A. (2019). Annual Activity Report, 1 July 2018 to 30 June 2019. Queensland State Disaster Coordination Centre. http://www.qfes.qld.gov.au
Tucker, R. K. (March 1994). Loss of data collection could blow out engineering costs, Engineering Times, 3.Upton, P. S. (1956, December). Microseisms Associated with Tropical Cyclones over the northeast
Australian Region [Paper presentation]. Tropical Cyclone Symposium, Brisbane. https://espace.library.uq.edu.au/view/UQ:300022
Williamson, F., Allen, R., Switzer, A. D., Chan, J. C. L., Wasson, R. J., D’Arrigo, R., & Gartner, R. (2015). New directions in hydro-climatic histories: observational data recovery, proxy records and the atmospheric circulation reconstructions over the earth (ACRE) initiative in Southeast Asia. Geoscience Letters, 2(2), 1–12.
World Digital Preservation Day (2020). At Risk Digital Materials. Digital Preservation Coalition. https://www.dpconline.org/events/world-digital-preservation-day
Zscheischler, J., Martius, O., Westar, S., Bevacqua, E., Raymond, C., Horton, R. M., van den Hurk, B., AghaKouchak, A., Jeziquel, A., Mahecha, M. D., Maraun, D., Ramos, A. M., Ridder, N. N., Thiery, W., & Vignotto, E. (2020). A typology of compound weather and climate events. Nature Reviews Earth & Environment, 1, 333–347.
48 Colin lynam
Author ProfileColin Lynam retired from The University of Queensland Seismograph Stations (UQSS) in 2002 when this facility officially ceased operation. It had run a full ASRO observatory at Charters Towers (1957–1998) and a standard observatory at Gardens Point and then Mt Nebo, Brisbane (1935–2018). This was a unique era to be working in seismology as those observers became the United Nation’s policeman’s eyes of the Comprehensive Nuclear-Test-Ban Treaty Organization (CTBTO), continuing even today. It was also the era in which the first global seismograph station networks were deployed, and UQSS became aware of our own earthquake history and community awareness. Colin is an active citizen scientist, contributing a science communication blogging service for the Australian Earthquake Engineering Society (Engineers Australia) and communicating/writing with expert groups within The Royal Society of Queensland.


![Flow boiling heat transfer of HFO1234yf and HFC32 ... boiling heat transfer of... · boiling heat transfer coefficient is calculated from the pool boiling correlation of Cooper [7].](https://static.documents.pub/doc/80x56/6060f16e796df51c036c4972/flow-boiling-heat-transfer-of-hfo1234yf-and-hfc32-boiling-heat-transfer-of.jpg)


