38
A PRIMER ON ALTERNATIVE INVESTMENTS AUGUST 2018
A PRIMER ON ALTERNATIVE INVESTMENTS AUGUST 2018

ALTERNATIVE INVESTMENTS

■ Alternative Investments includes wide range of investments from traditional rare coins to
Bitcoins and from investing in farm lands to investing in start-ups
WHAT ARE ALTERNATIVE INVESTMENTS?
Alternative Investments
Private Equity
Venture Capital
Hedge Fund
Real Estate
Others
• Art and Paintings
• Natural Resources
• Horse Breeding

PRIVATE EQUITY

■ Investment made in non-public companies through privately negotiated transactions
■ For long term
■ To enhance value of the companies through operational improvement and financial
restructuring
■ Through Illiquid investments
■ Continuous Acquisition and Disposal of Investments
■ Relatively, a new industry, came in forefront in US in 1970s in Europe in 1980s
WHAT IS PRIVATE EQUITY?

EXAMPLES - GLOBAL
Private Equity Funds Private Held Companies
Note: Logos are intellectual property of respective companies, used only for educational purpose

EXAMPLES - INDIA
Private Equity Funds Private Held Companies
Note: Logos are intellectual property of respective companies, used only for educational purpose

TYPES OF PRIVATE EQUITY
Maturity of Company
Co
mp
an
y S
ize
Venture Capital
Growth
Buyout
Distressed / Turnaround
• Initial Public Offering
• Trade sale
• Sell to another fund
Note: Chart is for representative purpose

DIFFERENT CHARACTERISTICS
Venture capital Growth equity Buyouts
Portfolio company stage Early Stage Expansion Mature
Revenue Negligible Growing Self-sustaining
Management involvement Moderate - Heavy Moderate Heavy
Financing rounds 3-5 1-3 Often 1
Use of leverage Rarely Can be done Almost always
Valuation New financing
rounds Comparables Comparables
Failure rate Significant Sometimes Infrequent
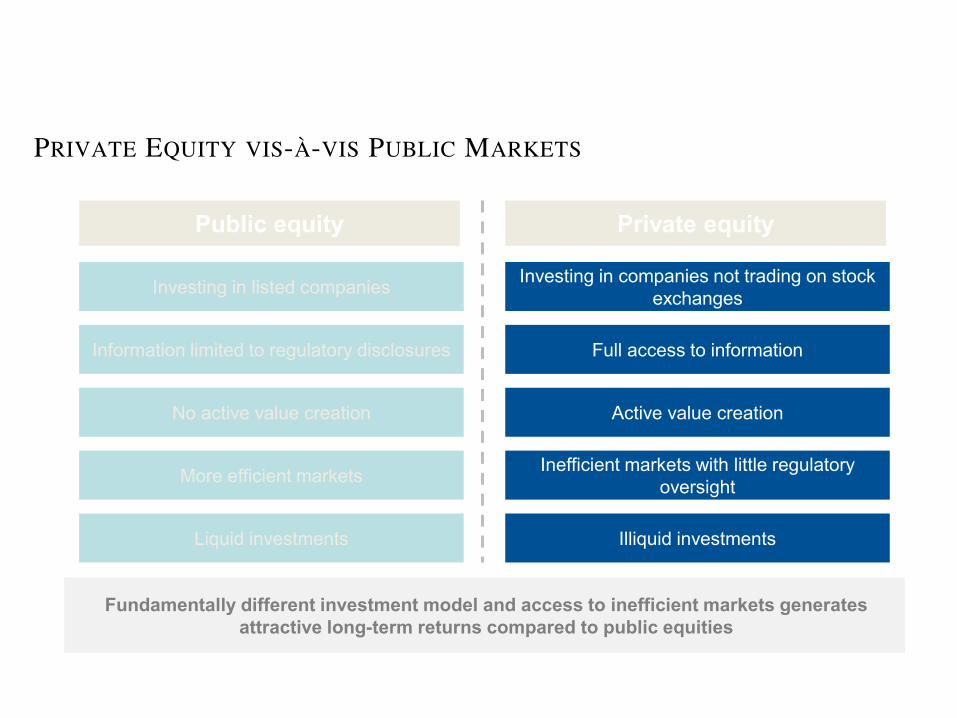
PRIVATE EQUITY VIS-À-VIS PUBLIC MARKETS
Public equity Private equity
Full access to information
Active value creation
Inefficient markets with little regulatory oversight
Information limited to regulatory disclosures
No active value creation
More efficient markets
Investing in companies not trading on stock exchanges
Investing in listed companies
Illiquid investments Liquid investments
Fundamentally different investment model and access to inefficient markets generates
attractive long-term returns compared to public equities

CASE STUDY – INVESTMENT TO EXIT
-
5,000
10,000
15,000
20,000
2007 2008 2009 2010 2011 2012 2013 2014 2015 2016 2017 2018
Acquis it ion by W almart at USD 20.8 bn valuat ion
Founded by Sachin and Binny Bansal
Angel round Ashish Gupta ~$150k
Ser ies A Accel USD 1 mn
Ser ies B and C T iger Global USD 50 & 950 mn
Ser ies D Naspers * USD 1 bn
Ser ies E Morgan Stanley, Sof ina, Vulcan * USD 360 mn
Ser ies F, G, H DST, GIC, QIA, Greenoak, Steadview * $ 210, 1000 & 700 mn
Peak Valuat ion
PE funding Tencent, Microsof t , eBay, Sof t Bank USD 1.4 bn & 1.5 bn
* Funded also by some of the existing investors
All information from public sources
Mark down by MS, T. Rowe Price
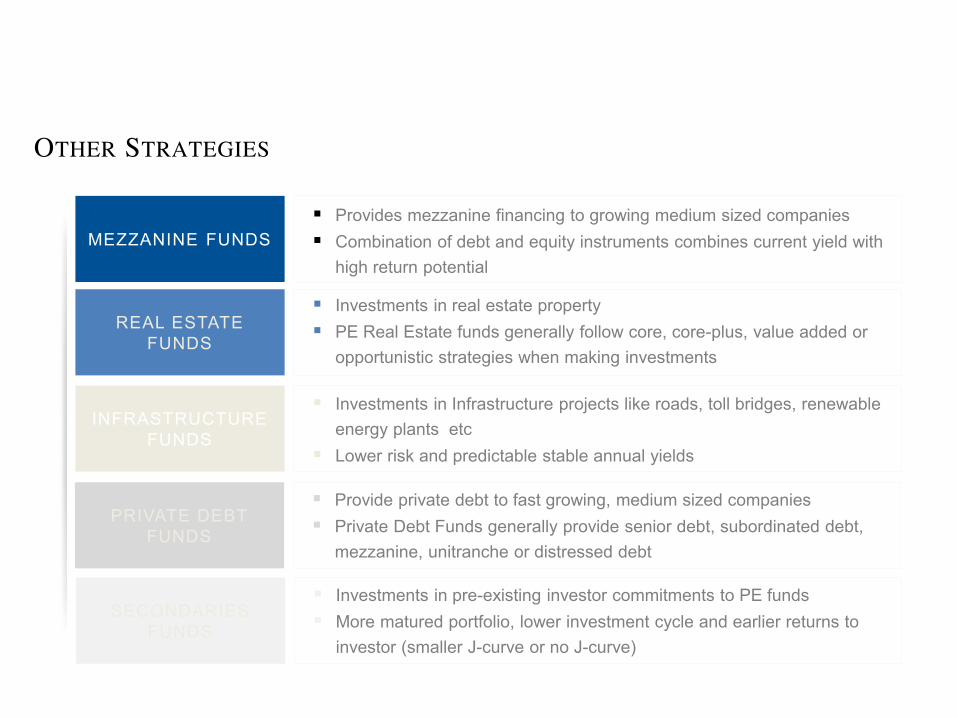
OTHER STRATEGIES
MEZZANINE FUNDS
Provides mezzanine financing to growing medium sized companies
Combination of debt and equity instruments combines current yield with
high return potential
REAL ESTATE FUNDS
Investments in real estate property
PE Real Estate funds generally follow core, core-plus, value added or
opportunistic strategies when making investments
INFRASTRUCTURE FUNDS
Investments in Infrastructure projects like roads, toll bridges, renewable
energy plants etc
Lower risk and predictable stable annual yields
PRIVATE DEBT FUNDS
Provide private debt to fast growing, medium sized companies
Private Debt Funds generally provide senior debt, subordinated debt,
mezzanine, unitranche or distressed debt
SECONDARIES FUNDS
Investments in pre-existing investor commitments to PE funds
More matured portfolio, lower investment cycle and earlier returns to
investor (smaller J-curve or no J-curve)

FEW JARGONS USED IN PRIVATE EQUITY
Firm/Individual who manage the investments of the Private Equity Fund and are
responsible for performance of the fund General Partner
Investors who invest in the Private Equity Fund. Mainly these are institutions
such as pension funds, insurance companies etc. Limited Partner
Refers to the year in which the firm raised capital and started investing Vintage
Refers to the minimum IRR over which General Partner earns a share in the profit made through investments (known as Carry)
Hurdle Rate
Returns are generally measured as multiple of capital invested (MoIC) Multiples
Originated from the term “Gun Powder”. Refers to the capital which is committed but is yet to be invested
Dry Powder

J-CURVE IN PRIVATE EQUITY
■ Private Equity returns typically follow a “J-Curve” over the investment period
■ Funds tend to experience negative returns in first few years due to write downs and costs
■ Liquidity events are around the end of the fund life cycle
-15
-10
-5
0
5
10
15
20
25
1 2 3 4 5 6 7 8 9 10 11 12
LIFECYCLE OF A PRIVATE EQUITY FUND
Investment Period Operational Enhancement and Harvest Mode
Years
%
IRR
Note: Chart is for representative purpose

PRIVATE EQUITY HAS GENERATED HIGHER RETURNS
■ Private equity as an asset class has generated better returns, net of all fees and
expenses, compared to public market investments over range of time periods
■ Private equity investments provide access to industries, companies and products
which are not easily available in public markets
6
15
13
11 12
4
13 13
8 7
1 3 5 10 20
US
10
17
13 11
15
-11
10 7
4 5
1 3 5 10 20
Europe
2
14
9
12 11
-9
2 2 3 3
1 3 5 10 20
Asia Pacific
End-to-end pooled IRR % (as of June 2016) End-to-end pooled IRR % (as of June 2016) End-to-end pooled IRR % (as of June 2016)
Investment horizon (in years) Investment horizon (in years) Investment horizon (in years)
US buyout funds S&P 500 mPME Developed Europe
buyout funds
MSCI Europe
mPme
Asia Pacific buyout
and growth funds
MSCI AC Asia
pacific mPME
Note: Bain & Company – Global Private Equity Report 2017

WHY INVEST IN PRIVATE EQUITY
■ The impact of private equity on portfolio efficiency and the ability to generate sustainable
alpha has been proven
■ Private equity portfolio can generate higher and more consistent returns
■ Low Correlation with the broader indices
■ Access to private companies which are not yet listed in public domain
■ Corporate strategic purpose

STRUCTURE OF PRIVATE EQUITY
General Partner (Private Equity Firm)
Limited Partners (Investors)
Pension Funds
Sovereign Wealth Funds
Insurance Companies
Family Offices
Endowments / Foundations
Private Equity Fund (Limited Partnership)
NewCo 1 (Investment)
NewCo 2 (Investment)
NewCo 3 (Investment)
NewCo 4 (Investment)
Manages the Fund

PRIVATE EQUITY FEE STRUCTURE
Initial Capital – 2,000 cr
At the end of Investment Period –
6,000 cr
8 year holding period
IRR – 15%
INR 320 cr over 8 years Management Fee @ 2%
Calculated at 8% of invested capital Hurdle Threshold @ 8%
~INR 800 cr at the end of 8th year Carried Interest
Note: Calculation is for representative purpose

WHY COMPANIES SEEK PRIVATE EQUITY CAPITAL
Private Equity Entry Holding Period Exit
Operational Support
Management Structuring
M&A Support
Corporate Governance Support
Strategy Formation Strategy Formation
Capital Structure Optimization
Financial Support
Higher Valuation
IPO / Trade sale guidance
Strategy Formation Better Positioning

HOW DOES A PRIVATE EQUITY FIRM CREATE VALUE?
EBITDA
Growth Leverage
Multiple
Expansion
Superior
Returns
■ Alignment of interest between management and business owners
■ Upside sharing with the management
■ Strengthening top management of the company
■ Cost rationalization initiatives
■ Long term focus without distraction of quarterly performance
■ Assistance in entering newer markets and products
■ Inorganic growth via acquisition

VALUE ADDITION BY PE FUND – ERIS LIFESCIENCES
Entry Valuation
RevenueGrowth
OperationalImprovement
MultipleExpansion
Exit Valuation 7x
■ One of the fastest growing Indian pharma company
■ Favourable chronic mix drove strong revenue growth and operating leverage
USD185 mn
USD 266 mn
USD 563 mn
USD 188 mn
USD 1,202
mn
■ Revenue Growth: 26%
■ Operational Improvement: 55%
■ Multiple Expansion: 19%
Source: Preqin Insights – Alternative Assets in India

INVESTMENT PROCESS OF PRIVATE EQUITY
Source
Lead Term Sheet
Due
Diligence
Negotiate
Purchase
Agreement
Closing
■ In-house Team
■ Investment Banks
■ Personal Network
■ Lawyers
■ Accountants
■ Industry Associates
■ Create financial
projections and
returns model
■ Propose valuation
and transaction
structure
■ Execute binding
Letter of Intent
(“LOI”)
■ Evaluate
competitive
Landscape
■ Validate financial
statement; confirm
growth plan
■ Assess
management
■ Seek to uncover
business and Legal
risks
■ Negotiate purchase
price and related
terms, including
roll-over equity,
earn-out etc
■ Employment
contracts for key
management
■ Finalise the
agreements
■ Signing of the
agreements
■ Movement of funds
1-2 weeks 4-6 weeks 6-8 weeks 4-8 weeks 1-2 weeks
An investment cycle is 4 months to 6 months long from inception to final close

PRIVATE EQUITY GLOBAL INDUSTRY LANDSCAPE

INDUSTRY SIZE
2,248 2,269 2,470
2,776
3,061 3,302
3,818 3,945
4,260
4,582
4,925
2007 2008 2009 2010 2011 2012 2013 2014 2015 2016 2017
Private Capital AUM Annual Capital Raised
683 714
325 319
385
442
578
621
671
728 756
2007 2008 2009 2010 2011 2012 2013 2014 2015 2016 2017
USD Bn USD Bn
2x
Reached Pre-crisis level
Source: 2018 Preqin Global Private Equity and Venture Capital Report

INDUSTRY SIZE
Private Equity AUM
USD Bn
635 682 675 619 599 560 674 689 754 838
978
842 748 910
1114 1207 1387
1515 1553 1634
1744
1851
2007 2008 2009 2010 2011 2012 2013 2014 2015 2016 2017
Dry Powder
Unrealized Value 471
188 191
71
272
108
64
9.2
North America Europe Asia Rest of World
Private Equity Capital Raised - 2017
Aggregate Capital Raised (USD bn)
No of Funds
Source: 2018 Preqin Global Private Equity and Venture Capital Report

LARGEST PRIVATE EQUITY FUNDS CLOSED IN 2017
Fund Fund Size (bn) Geographic Focus
Apollo Investment Fund IX 24.7 USD Europe, North America
CVC Capital Partners Fund VII 16.0 EUR Europe, North America
Silver Lake Partners V 15.0 USD North America
KKR Americas Fund XII 13.9 USD North America, Central America,
South America
Vista Equity Partners Fund VI 11.0 USD North America
Clayton Dubilier & Rice X 9.4 USD Europe, North America
KKR Asian Fund III 9.3 USD Asia, Australasia
BC European Cap X 7.0 EUR Europe, North America
Bain Capital Fund XII 8.0 USD Global
Strategic Partners VII 7.5 USD Europe, North America
Source: 2018 Preqin Global Private Equity and Venture Capital Report

PRIVATE EQUITY INDIAN INDUSTRY LANDSCAPE

Page
Private Equity AUM
USD Bn
5.7 7.1 7.3
6.2 7.4
5.7 6.1 4.9
6.9 7
3.8
4.6
6.3
6.1
8.1 10.2
13 14.3
16.8 16.5
2007 2008 2009 2010 2011 2012 2013 2014 2015 2016
Dry Powder
Unrealized Value
1.4 Hedge Funds
Real Estate 10.2
Infrastructure 4.4
Private Debt 3.3
23.5 Private Equity
Total AUM 42.8
Strategy AUM (USD Bn)
ASSET UNDER MANAGEMENT IN INDIA
Hedge Funds
Real Estate
Infrastructure
Private Equity
Source: Preqin Insights – Alternative Assets in India

PRIVATE EQUITY RETURNS IN INDIAN CONTEXT
■ Historically, India has suffered due to below average returns when compared to global
average
Pre 2003
2003 - 05
2005 - 09
2010 - 14
Vintage Max USD net IRR (%)
39.7%
89.2%
16.1%
147%
Min USD net IRR (%)
7.0%
-5.6%
-11.2%
15.7%%
Median USD net IRR
(%)
18.2%
11.9%
8.0%
6.3%
Source: Preqin Insights – Alternative Assets in India

INCREASE IN LIQUIDITY EVENTS FOR FUNDS
■ However, Private Equity exits in India have increased significantly
6.6
4.1
6.8 6.8 6.0
9.4 9.6
15.7
2010 2011 2012 2013 2014 2015 2016 2017
123 88 115 164 193 213 197 211
63%
Annual PE/VC
exits in India
(USD bn)
No. of Exits
Source: Indian Private Equity Report 2018

INDIAN PRIVATE EQUITY LANDSCAPE
138
193
240 253
274
2013 2014 2015 2016 2017
Number of firms participating in India ■ New funds and asset types have emerged in
market: AIFs, Venture Debt, Distressed
Asset Fund
Main Participants include:
■ Global PE Firms include Apax Partners,
Bain Capital, Carlyle, KKR, Soft Bank
Investors in Private Equity
■ SWFs including ADIA, GIC, Temasek
■ Pension Funds including CDPQ, CPPIB,
OTPPB etc.
■ Other platers such as family offices, smaller
local funds, hedge funds
Source: Indian Private Equity Report 2018

OUTLOOK ON PRIVATE EQUITY IN INDIA
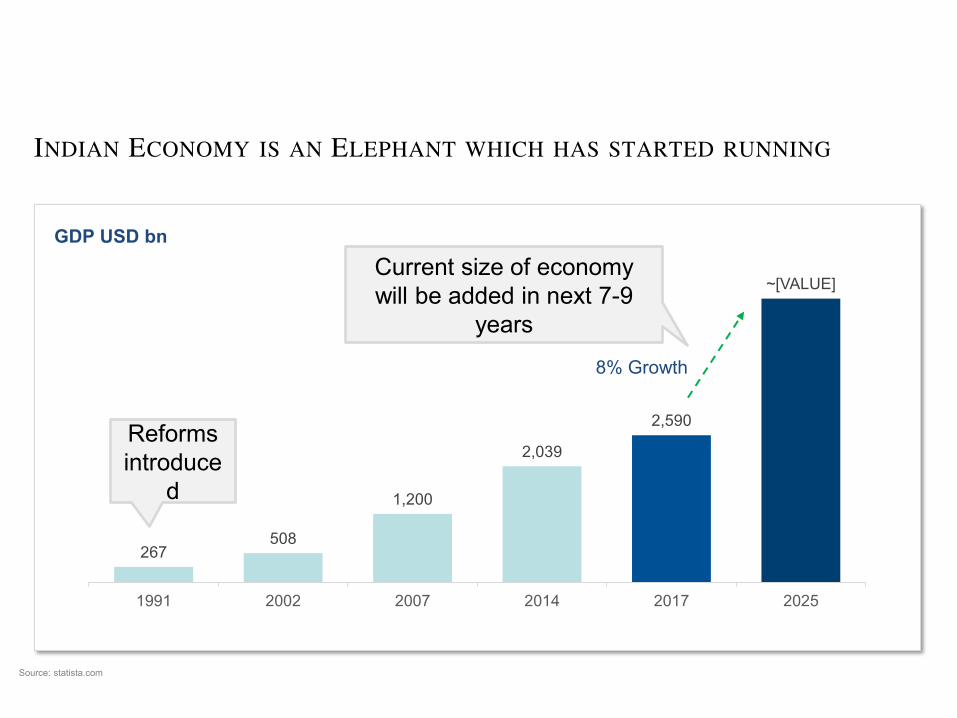
INDIAN ECONOMY IS AN ELEPHANT WHICH HAS STARTED RUNNING
267 508
1,200
2,039
2,590
~[VALUE]
1991 2002 2007 2014 2017 2025
GDP USD bn
8% Growth
Reforms introduce
d
Current size of economy will be added in next 7-9
years
Source: statista.com

PRIVATE EQUITY IS EVOLVING IN INDIA
Majority, Buyouts, Large Strategic Deals
Minority Stakes
Across Cycle, Pre-IPO Stage Early Stage Investments
Stiff competition, Bidding Process Selective Investments
Open to primary + secondary to match larger ticket sizes
Mostly Primary infusion
Strategic roles, large investments and stakes creating sector
platforms
PE/VCs playing the role of financial advisor
Past Trends Emerging Trends

PRIVATE CAPITAL AUM BY GEOGRAPHY
US
2,759
UK
495
CHINA
265
FRANCE
138
CANADA
118
HONG KONG
108
INDIA
42
Private Capital AUM (USD Bn)
Source: Preqin Insights – Alternative Assets in India

ROLE FOR CHARTERED ACCOUNTANTS IN PRIVATE EQUITY

CHARTERED ACCOUNTANTS CAN HELP THE INDUSTRY IN NEXT STAGE OF GROWTH
Conceptualization
Setting up of an
Alternative
Investment Fund Structuring Implementation
Sourcing Deals / Due Diligence
Operations of PE
Fund
Valuation / Taxation Advisory
Operations improvement of
portfolio companies

DUE DILIGENCE
• Verifying accounting controls
• Validate historical financials
Accounting Market
• Evaluate market size and projected growth
• Assess competition
Business
• Review product / service offering
• Understand customers, profitability, and overall business drivers
Legal / Tax
• Diligence for identifying legal liabilities
• Assessing past and current taxation issues


