1 On brands and word-of-mouth Renana Peres School of Business Administration Hebrew University of Jerusalem, Jerusalem, Israel 91905 [email protected]Ron Shachar Arison School of Business, IDC Herzliya, Israel [email protected]Mitch Lovett University of Rochester [email protected]October 2011 Acknowledgment: We thank our industry collaborators: Brad Fay from the Keller Fay Group, Nina Stratt from NMIncite, and Ed Lebar from Young and Rubicam Brad Asset Valuator for sharing their data. We thank Kristin Luck and the Decipher Inc. team for programming and managing the survey. We thank Eitan Muller and Barak Libai for fruitful discussions, as well as the participants of the Marketing Science conference and the Yale Customer insight conference. We gratefully thank our research assistants - at Wharton : Christina Andrews, Linda Wang, Chris Webber-Deonauth, Derric Bath, Grace Choi, Rachel Amalo, Yan Yan, Niels Mayrargue, Nathan Pamart, and Fangdan Chen; at the Hebrew University: Yair Cohen, Dafna Presler, Oshri Weiss and Liron Zarezky. This research was supported by the Marketing Science Institute, The Wharton Interactive Marketing Initiative (WIMI), Kmart International Center for Marketing and Retailing at the Hebrew University of Jerusalem; the Israel Science Foundation, and the Marketing Department at the Wharton School.
Transcript
1
On brands and word-of-mouth
Renana Peres
School of Business Administration Hebrew University of Jerusalem, Jerusalem, Israel 91905
Acknowledgment: We thank our industry collaborators: Brad Fay from the Keller Fay Group, Nina Stratt from NMIncite, and Ed Lebar from Young and Rubicam Brad Asset Valuator for sharing their data. We thank Kristin Luck and the Decipher Inc. team for programming and managing the survey. We thank Eitan Muller and Barak Libai for fruitful discussions, as well as the participants of the Marketing Science conference and the Yale Customer insight conference. We gratefully thank our research assistants - at Wharton : Christina Andrews, Linda Wang, Chris Webber-Deonauth, Derric Bath, Grace Choi, Rachel Amalo, Yan Yan, Niels Mayrargue, Nathan Pamart, and Fangdan Chen; at the Hebrew University: Yair Cohen, Dafna Presler, Oshri Weiss and Liron Zarezky.
This research was supported by the Marketing Science Institute, The Wharton Interactive Marketing Initiative (WIMI), Kmart International Center for Marketing and Retailing at the Hebrew University of Jerusalem; the Israel Science Foundation, and the Marketing Department at the Wharton School.
Brands and word-of-mouth (WOM) are cornerstones of marketing, yet, their relationship was
largely ignored. In order to explore this relationship we present a theoretical framework whose
fundamentals are consumers and what stimulates them to engage in WOM. It argues that
consumers spread the word on brands as a result of three drivers: functional, social, and
emotional. Through these motives and needs we identify a set of brand characteristics (e.g. level
of differentiation) that play a role in stimulating WOM.
To examine our theoretical framework empirically, we constructed a unique data set on the
online and offline WOM and the characteristics of the 697 most talked-about national US brands.
Using MCMC estimation we find that (i) brand characteristics play an important role in
generating WOM, and (ii) that the impact of the characteristics differs between offline
conversations and online brand mentions. We also find that while the social and functional
drivers are the most important for online WOM, the emotional driver is the most important for
offline WOM. These results portray an interesting picture of WOM and have meaningful
managerial implications (e.g. investment in WOM).
3
Introduction
Brands and word-of-mouth are cornerstones of marketing. Yet, their relationship has largely
been ignored. Here, we lay theoretical foundations for the role of brand characteristics in
stimulating word-of-mouth (WOM, hereafter) and use a new, comprehensive dataset to study this
role. The empirical results are both interesting and useful. We find that brand’s characteristics,
above and beyond its category or product type, are strongly related to WOM about it. We also
find that the characteristics play a different role in online WOM (e.g., discussion boards) versus
offline WOM (e.g., face to face conversations).
Although WOM has always been central to marketing scholars and practitioners, major gaps
exist in our understanding of its underlying mechanisms. Specifically, the relationship between
brand characteristics and the WOM they generate is still an open question. Previous studies have
focused on other important issues relating to WOM: the influence of specific individuals in the
network (e.g., Goldenberg et al 2006; Katona, Zubcsek and Sarvary 2011), the relative
importance of communication vs. structural influences (e.g. Bell and Song 2007; Iyengar , Van
den Bulte, and Valente 2011), information flow in the social network (e.g. Borgatti and Cross
2003; Wu et al 2004; Yang et al 2011), financial outcomes of WOM (e.g. Chevalier and Mayzlin
2006; Trusov, Bucklin and Pauwels 2009) and motivations to engage in WOM activity (e.g.
Sundaram, Mitra and Webster 1998). However, a central aspect of marketing, the role of brands,
has received surprisingly little attention.1
1 Indeed, a couple of issues involving actual brands were addressed: (1) the impact of WOM on the choice or purchase of brands (Chevalier and Mayzlin 2006; Godes and Mayzlin 2009; Grewal, Cline and Davies 2003; Herr, Kardes and Kim 1991) and (2) WOM as an outcome of the relationship with the brand (Bowman and Narayandas 2001; Keiningham et al 2007). However, the brand itself was not the focus of these studies.
Furthermore, to the best of our knowledge, the role of
brand characteristics as antecedents of WOM has not been studied. Nevertheless, this role is not
only critical but also highly relevant for marketing scholars and marketing practitioners.
4
While the role of brand characteristics in generating WOM was largely ignored, several
studies explored the influence of product characteristics on WOM and can, thus, provide some
initial insight for the study of the impact of brand characteristics. These characteristics includes
involvement (Dichter 1966), originality and usefulness (Moldovan, Goldenberg, and
Chattopadhyay 2011), awe-inspiring (Berger and Milkman 2011), visibility (Berger and
Schwartz 2011), familiarity (Sundaram and Webster 1999).2
Our study aims to extend these earlier empirical efforts in four major directions. First, we
focus on the role of brand characteristics (e.g. elements of the brand personality) rather than just
characteristics generic to products. Second, unlike previous studies that focused on a small
subset of characteristics (e.g. familiarity or involvement) we present a comprehensive theoretical
framework that encompasses a broad range of relevant characteristics and, thus, enables us to
understand their relative roles in generating word of mouth. Third, we construct a dataset that is
not only large but is also quite heterogeneous – i.e., approximately 700 of the most talked about
brands in the US. Fourth, we measure WOM not only online or offline, but in both
communication channels.
3
In order to study the role of brand characteristics we introduce a theoretical framework that
maps brand characteristics into the drivers of WOM. In other words, we build our framework
from the most fundamental element – consumers and what stimulates them to engage in WOM.
The theoretical framework, presented in the next section, is based on the literature on the drivers
2 Dichter (1966) studied involvement and used depth interviews to demonstrate that higher involvement with a product serves as a motivation in spreading WOM; Moldovan, Goldenberg, and Chattopadhyay (2011) studied the role of originality and usefulness for new product concepts; Berger and Milkman (2011) showed that awe-inspiring New York Times articles are more likely to be forwarded through email; Berger and Schwartz (2011) showed that buzz agents are more likely to distribute WOM on products that are cued more by the environment, or are more publicly visible; Sundaram and Webster (1999) discussed the impact of brand familiarity on word of mouth. 3 Previous studies measured WOM from a single channel, mainly through lab experiments (e.g. Cheema and Kaikati 2010), questionnaires and depth interviews (e.g. Sundaram, Mitra, Webster 1998), online sources (e.g. Godes and Mayzlin 2004), or Buzz agents (Berger and Schwartz 2011; Godes and Mayzlin 2009).
5
of people to engage in WOM activity. It argues that consumers spread the word on brands as a
result of three drivers: functional, social, and emotional. The functional driver is related to the
need to obtain information, and the tendency to provide information; the social driver relates to
social signaling: expressing uniqueness, self-enhancement, and a desire to socialize or belong;
the emotional driver is related to emotion sharing. Each of these drivers is composed of different
needs, or motives that play a role in consumer decision making. Each of these motives, in turn,
suggests a set of brand characteristics that play a role in stimulating WOM.
Consider for example the social driver. One of its underlying motives is the need to express
uniqueness: it is easier to signal one's uniqueness through a highly differentiated brand than an
undifferentiated brand. As a result, we argue that a brand with a higher degree of differentiation
is likely to have greater WOM. This example might be useful also in clarifying three terms that
we use throughout the paper: (1) driver, (2) needs or motives, and (3) brand characteristics. In
this case the driver is “social”, one of the needs or motives underlying this driver is “need to
express uniqueness”, and one brand characteristic that addresses this need is “brand’s level of
differentiation”. As another example, consider information seeking (Sundaram, Mitra and
Webster 1998), which is one of the motives of the functional driver. In this case the relevant
characteristics may include the complexity of the brand and its age. The higher the complexity
and/or the newer the brand, the higher is the consumer’s need for information. As a result, our
framework suggests that new brands and brands perceived to be more complex generate greater
WOM. As a final example consider the emotional driver which is mostly about emotion sharing
(Berger and Milkman 2011). One of its underlying motives is sharing excitement. As a result, we
suggest that brands perceived as more exciting are more likely to be shared via WOM.
6
In order to examine our theoretical framework empirically, we collected data on the 697
most talked-about national US brands. These brands come from 16 different categories (e.g.,
food, media and entertainment, cars, financial services, sports), and include product and service
brands, corporate brands and product-specific brands. For each of these brands we compiled data
on WOM and, following our theoretical framework, on their characteristics.
The data on brand characteristics come from several sources. We surveyed a representative
sample of the US containing 4,769 respondents. This survey captures consumers’ perceptions of
various brand-attributes, such as complexity, excitement, and visibility. In addition, we used the
proprietary Young and Rubicam data from their Brand Asset Valuator panel. This data includes
information on attributes such as the degree of differentiation.
The data on WOM for each of these brands come from two different sources: the Keller Fay
Group for offline WOM and Nielsen-McKinsey Buzzmetrics for online WOM. Keller Fay’s data
(Keller 2007) include a weekly measure of the offline WOM (i.e., face-to-face and phone
conversations) for over 1000 brands mentioned from January 2007 to August 2010. The data
from Buzzmetrics include a daily measure of the online WOM (i.e., blogs, user forums, and
Twitter messages) for each of these brands between 2008 and 2010. We focus on approximately
the top 700 of these brands.
Our analysis of this cross-sectional data indicates that brand characteristics play an
important role in generating WOM. Age, complexity, type-of-good, knowledge, differentiation,
quality, visibility, excitement, satisfaction, and perceived risk are associated with WOM in either
online or offline channel of communication or in both. Furthermore, we find that each of the
drivers identified in our theoretical framework (functional, social, and emotional) has a
significant role in WOM.
7
The results also reveal significant and insightful differences between online and offline
WOM at the brand characteristics level. For example, while the level of brand differentiation
plays a role in online WOM, it does not impact offline conversations. Another example relates to
age and complexity that are significant offline and insignificant online. These differences at the
level of the brand characteristic are indicative of interesting differences with respect to the
impact of the three overall drivers. We find that while the social and functional drivers are the
most important for online WOM, the emotional driver is the most important for offline WOM.
These results portray an interesting picture of WOM. Offline conversations, which are mostly in
one-on-one settings, are more personal and intimate by nature and thus allow people to share
emotions such as excitement and satisfaction. Online WOM, which usually involves
“broadcasting” to many people (e.g. twitter), is more appropriate for social signaling (e.g.,
uniqueness).
Our work not only reveals new findings, it also has managerial implications. Brand
managers can use our results to assess how much to invest in WOM. For instance, our model can
identify brands that, given their characteristics, underperform in terms of WOM. Such evidence
might suggest that greater investment in WOM is needed. Alternatively, a brand that
overperforms but still gets low levels of WOM may simply not be able to generate a dramatic
improvement in WOM. For example, we find that brands that are in the market for a long time,
or that are perceived as simple are not expected to generate as much WOM offline. Our results
offer some insights even to managers of these brands. Specifically, such managers might still be
able to stimulate WOM by altering some of the more flexible brand’s characteristics such as its
visibility (e.g., “Intel Inside”).
Theoretical framework
8
Although brands and their characteristics have been studied extensively, their impact on
WOM was not explored. Thus, in order to identify the characteristics relevant for WOM a
theoretical framework is required. We start from the most fundamental element – consumers and
what stimulates them to engage in WOM. Building on previous research, we argue that
consumers spread the word on brands for three fundamental purposes: functional, social, and
emotional. In brief: the functional driver is the motive to provide and supply information; the
main social driver is the motive to send social signals to the environment; and the emotional
driver is the motive to share positive or negative feelings about brands in order to express these
emotions or balance emotional arousal. Hence, in our theoretical framework, brands, and their
characteristics, operate through these three basic drivers to generate WOM.
Interestingly, these three drivers are mentioned (in one form or another) both by
practitioners and by academic scholars. Starting with the practitioner side, some aspects of the
functional driver are discussed by Rosen (2002) who claims that people engage in WOM in order
to get the necessary information needed to survive, to interpret the world in order to function,
and to benefit economically (see also Keller 2006). Two aspects of the social driver discussed in
the practitioner literature are that WOM is driven by the need to create a positive impression on
others (Bueno 2007) and by the desire to signal social status (eMarketer 2011). The emotional
driver is mentioned in this literature by the suggestions that WOM is motivated by surprise and
amusement (Bueno 2007), the need to relieve tension (Rosen 2002), consumers’ love and
affection for brands (Roberts 2004), and extremely strong emotional attachments (McConnell
and Huba 2006).
The academic research identifies eight specific motives to engage in WOM, and most of
them can fit nicely into the three drivers discussed above. In brief, the motives that fit nicely (and
9
the driver that is relevant for them) are: information demand and information supply (for the
functional driver); expressing uniqueness, self-enhancement, and the desire to converse (for the
social driver); and expressing emotions (for the emotional driver). The other motives discussed
by academic scholars – risk reduction and involvement – might fit into more than one driver
(specifically, into both the functional and emotional).
In the rest of this section we discuss in more detail the relevant literature, the three
fundamental drivers and the eight underlying motives. Furthermore, for each driver/motive we
identify the relevant brand characteristics that shape their role in WOM for brands.
The Functional Driver Information demand In many conversations individuals exchange useful and practical information (e.g., what is the
best route from New York to New Haven) and often brands are the subject of that information
exchange.4
Following previous work we suggest that consumers use WOM, at least partially, to improve
their decisions and thus their interest in WOM would grow with the expected functional value of
information.
5
Previous studies provide some evidence on the role of these two characteristics. With respect
This value is likely to be higher when (i) the brand is new and consumers still need
information on various aspects of its purchase, usage, and maintenance, and (ii) the brand is
complex and thus information about it is difficult to obtain and comprehend. This leads us to the
first two brand characteristics that might affect WOM – age and complexity.
4 Sundaram, Mitra and Webster (1998) describe this exchange as resulting from “advice seeking,” while practitioners have argued humans have a basic need to obtain the information in order to avoid hazards and make sense of the world (Bueno 2007; Rosen 2002). 5 An extensive literature discusses the role of WOM in the flow of information among consumers (Brown and Reingen 1987) and in consumer decision-making (e.g. Chen, Wang and Xie 2011; Gupta and Harris 2010; Herr, Kardes and Kim 1991), especially for new products (see Peres, Muller and Mahajan 2010 for review).
10
to age (or more specifically life cycle stage), Godes and Mayzlin (2004) found that later episodes
of a TV series gain less WOM in online discussion groups, while Easingwood, Mahajan and
Muller (1983) demonstrated that the influence of social contagion on product adoption declines
as the product ages. As for level of complexity, Walsh and Mitchell (2010) found a positive
connection between the level of information overload of a brand (a concept closely relating to
complexity) and the brand's WOM.
The demand for information might also depend on the type of product – be it an experience
search, or credence good (Anand and Shachar 2011). WOM can be useful for exploring
unobservable attributes of experience goods (e.g., service) and keeping up to date on observable
attributes of search goods (e.g., new contracts with AT&T). Whether search goods, experience
goods, or credence goods stimulate more WOM, however, is an open empirical question.
Information supply In addition to seeking information, there are motives and constraints specific to the supply of
information. Fundamentally, altruism (i.e., the desire to help others by sharing information, Ho
and Dempsey 2010; Sundaram, Mitra and Webster 1998) and reciprocity (i.e., the desire to
reciprocate for previous favors or in anticipation of favors, Cialdini 2001) are the main motives
relating to information supply. Another motivation is the attempt through conversation to better
evaluate the personal value of a brand. This motive may be more prominent for experience goods,
since experiences may be more ambiguous.
Of course, in order to supply information, individuals need to know about the brand. Thus,
the next two brand characteristics that might affect WOM are familiarity with and knowledge
about the brand. Indeed, Sundaram and Webster (1999) provide evidence that brand familiarity is
associated with higher WOM.
The match between the supply and demand of information could differ over the life of a
11
brand. For example, based on the above, we should expect relatively low WOM for (a) very new
brands (since there isn’t enough knowledge to address inquiries) and (b) very “old” brands (since
there isn’t enough interest).
The Social Driver Expressing uniqueness
WOM is a means for self-expression (Che, Lurie and Weiss 2011). One of the most
fundamental aspects that people seek to express is their uniqueness, either through consumption
and possession (Berger and Heath 2007) or WOM (Cheema and Kaikati 2010; Ho and Dempsey
2010). Brands that are highly differentiated from others enable consumers to project such a
unique identity. In other words, the higher the degree of differentiation of a brand, the easier it is
for an individual to project uniqueness by engaging in WOM about it. Thus, the brand
characteristic we associate with the expression of uniqueness is the brand’s perceived degree of
differentiation.
Self enhancement Another social motive to engage in WOM is self-enhancement. Wojnicki and Godes (2011)
show that consumers strategically use WOM in order to signal or enhance their perceived
expertise. To achieve this purpose, positive WOM is more effective than negative, since experts
are expected to identify high quality products better than novices. This suggests that the more
esteem consumers have for the brand and the higher its perceived quality, the more likely they
are to engage in WOM about it. Along these lines, Amblee and Bui (2008) find that brand
reputation improves its chances for online WOM. Thus, the brand characteristic we related to
self-enhancement is the esteem or quality associated with the brand.
Desire to converse The third social motive that can lead to WOM is the basic human desire to socialize, and
12
thus converse, with others (Rosen 2002; Rubin et al 1988; Trenholm and Jensen 2004). It turns
out that brand’s visibility eases individuals’ ability to use it in a conversation. Specifically,
Berger and Schwartz (2011) point out that “since conversations may be driven by whatever
comes to mind…,” products that are cued more by the surrounding environment are expected to
stimulate more WOM. Furthermore, Berger and Schwartz (2011) find, using data on 300 buzz
marketing campaigns that visibility leads to higher WOM. Thus, brand visibility or observability
is another characteristic we expect to affect WOM.
The Emotional Driver Expressing emotions
Consuming a brand or thinking about it can invoke emotions that consumers might like to
share with others (Nardi et al 2004; Peters and Kashima 2007; Rime et al 1998) in order to
express or ease emotional arousal (Berger 2011). For example, Berger and Milkman (2011)
found that New York Times articles that evoked high arousal emotions were more likely to be
shared with others than articles that were merely useful, and interesting. Two emotions that can
be closely related to brand characteristics and lead to WOM are excitement and satisfaction.
When consumers are excited about a brand or when they are extremely satisfied or dissatisfied
with a brand they are likely to experience emotional arousal that leads them to speak with others.
The level of consumer satisfaction with a brand reflects the enjoyment or disappointment
resulting from using or purchasing it (Westbrook and Oliver 1991). Previous studies suggested
that brands that evoke both very high (Roberts 2004) and very low (Richins 1983) satisfaction
levels receive higher levels of WOM than brands with moderate levels of satisfaction. In other
words, people feel the need to share as an expression of affection (i.e., high satisfaction and
positive WOM) or when they are very dissatisfied with an experience.
13
Hybrid Motives While the above motives (e.g. expression emotions) fit nicely into one of the three drivers
(functional, social and emotional), the next two (involvement and risk reduction) do not.
Involvement can be regarded as functional, since people tend to invest higher search resources in
high involvement products, but it can be classified also as emotional, since the purchase and its
outcomes might stir the individual emotionally. Similarly, perceived risk has a functional
component – the uncertainty about the brand's actual performance – and an emotional component
of anxiety and potential embarrassment.
As will be explained later, some of our empirical analysis would intend to evaluate the
relative importance of the three fundamental drivers. The classification of two motives as both
functional and emotional complicates this analysis. To address this issue, we execute the analysis
in various forms (with and without the hybrid motives) to demonstrate robustness. We elaborate
on this issue later.
Product involvement Besides its importance for consumer decision-making (Zaichkowsky 1985), involvement has
a potential role in generating WOM (Dichter 1966; Sundaram, Mitra and Webster 1998).
Individuals are likely to seek more information on high involvement products and thus this
motive can be classified as a functional driver, but at the same time, some commonly used scales
of involvement use items such as “means a lot to me,” “exciting,” “fascinating,” which reflect
the emotional side of involvement (Zaichkowsky 1985) and thus this motive can be also
classified as part of the emotional driver.
Risk reduction Brands that are perceived as risky might evoke a higher level of WOM (Lutz and Reilly
1974; Sundaram, Mitra and Webster 1998). Perceived risk can be mapped into both the
14
functional and emotional drivers. Rogers (1995) discussed three aspects of risk – the actual
performance of the brand, the extra expenses that might be incurred, and the social
embarrassment that might be caused by the brand. While each of these risks might motivate
consumers to seek information in order to resolve them, they might also induce anxiety that
consumers may want to express. In fact, Sundaram, Mitra and Webster (1998) focused on this
emotional aspect of risk.
Figure 1 illustrates our theoretical framework including the three fundamental drivers--functional,
social, and emotional--along with the underlying motives and associated brand characteristics.
We propose that these brand characteristics affect the level of WOM. In the following section,
we describe the measures and data collection procedures we use for these brand characteristics
and for WOM on both online and offline channels.
The collection of channel specific (i.e., online and offline) information on WOM is important
since there is a vast literature in marketing demonstrating the differences between these two
arenas. Specifically, there are considerable differences between the two in brand perceptions and
behavior. Studies discuss differences in brand importance (Degeratu, Rangaswamy and Wu
2000), brand perceptions (Keller 2010), satisfaction and loyalty (Danaher, Wilson and Davis
2003), the response to advertising (Goldfarb and Tucker 2011), and price sensitivity (Chu,
Chintaguna and Cebollada 2008). The extant evidence on differences across these two channels
suggests that the effect of brand characteristics on WOM may also differ between them. While
the focus of this study is not on understanding these differences, per se, we will study the effect
of brand characteristics on online and offline WOM separately in order to avoid mis-
specification of the model.
----Insert Figure 1 around here -----
15
Data
In order to study the role of brand characteristics in stimulating WOM we have used several
sources to build a comprehensive data set, which contains information on WOM as well as brand
characteristics for 697 major US national brands spanning 16 broad product categories (the full
list of brands and categories as well as its construction is given in the Web Appendix (part 1).6
department stores, financial services, food and dining, health products, home design and
decoration, household products, media and entertainment, sports and hobbies, technology
products and stores, telecommunication, and travel services. The heterogeneity of brands in the
list is very high including both corporate and product brands, These include consumer brands
such as Coca Cola and Dove, services such as Expedia, Charles Schwab and Burger King,
sports-teams such as the Boston Celtics, and television shows such as CSI. For each brand, we
collected data on WOM, brand characteristics, and relevant control variables. Figure 2 describes
the complete set of data sources we use. They are described in detail in the next subsections.
Word-of-Mouth Data Word-of-mouth can be distributed and consumed through a variety of channels, which are
grouped here into two main categories – offline channels such as face to face and telephone
conversations, and online channels such as blogs, emails, user reviews, virtual social networks,
user forums and microblogs (e.g. Twitter). We collect data on both of these main channels and
conduct our analysis on these two categories separately.
6 This list was compiled based on our WOM data to contain the most talked about brands in the US between the years 2007-2010.
16
1. Offline word-of-mouth – The TalkTrack project of the Keller and Fay group is the most
accepted measure of offline WOM by the industry (for example, by the word-of-mouth
association, WOMMA). This is a diary-style survey on a representative sample of the US
population. Every week, 700 different respondents are asked to conduct a 24-hour diary in which
they document every face-to-face or phone conversation they have had in which a brand is
mentioned. Then, they list the brands mentioned in the conversation. Note that a list of brands is
not provided to respondents – i.e., they can mention any brand. For each brand we aggregate the
number of mentions between January 2007 and August 2010 and include both phone and face-to-
face conversations. The average number of mentions in our data is 805 and the brand with the
highest number (15,038) is Coca Cola. The category with the highest number of total mentions
on the set of 697 brands in our data is “beverages” with 13% of the mentions.
2. Online word-of-mouth – The source for the online WOM data is the Nielsen McKinsey Incite
tool, (formerly BuzzMetrics). This is a search engine that has conducted daily searches through
blogs, discussion groups, and microblogs since July of 2008 and for each of these sources
processes all available posts.7
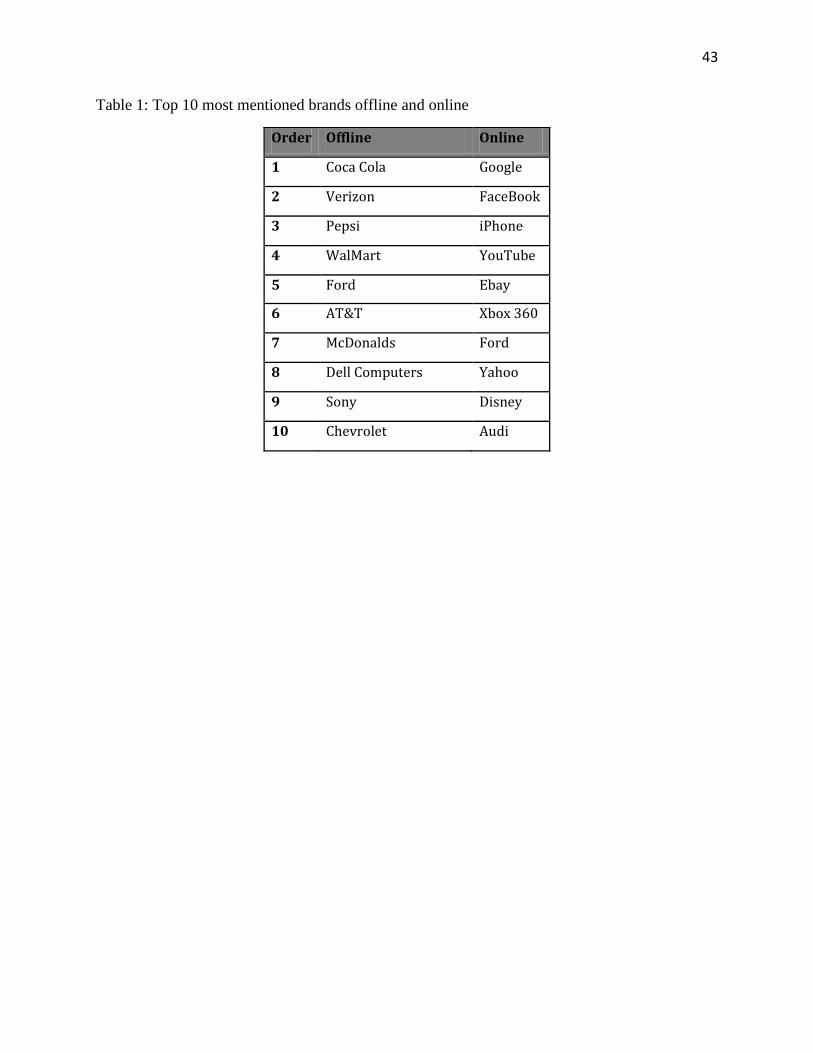
Table 1 displays the top 10 brands online and offline. Notice that these include both product
brands such as iPhone and Xbox 360 and corporate brands such as Sony and AT&T. Only one
brand, Ford, appears in both lists, illustrating the differences between these two WOM channels.
As in the case of the offline data, we have aggregated the data
across time (July 2008 to March 2010) and online sources. The average number of online
mentions in our data is approximately 430,000 and the brand with the highest number
(14,579,172) is Google. The category with the highest number of total mentions is “media and
entertainment” with 32% of the mentions.
7 Operating this search engine requires building queries that include the brand and related words, in order to retrieve the relevant information on the brand and distinguish it from unrelated mentions of the same name (e.g., some brand names are also everyday words such as the TV show House, or GAP stores).
17
Table 2 presents the distribution of mentions across the 16 categories. For each category it shows
the number of brands and the average number of mentions per brand for offline and online.
-----Insert Table 1 about here ------
---- Insert Table 2 about here -----
The way we obtain the brand mentions is different between the two channels. In the offline
data we use a sample of individuals, while in the online data we use a sample of posts. This
means that for the online data (like previous studies that used online WOM data) we do not
observe the receiving side of the communication but rather only the “sender”. For some purposes
this would mean a selection bias. For instance, for measuring individual level propensities to
engage in WOM, our sample has problems. However, for our purposes – i.e., to measure
aggregate brand mentions online – this sample is appropriate. After presenting our results, we
discuss some ways future research may leverage more refined measures to provide a more
disaggregate picture of WOM behaviors.
Brand Characteristics In order to operationalize the brand characteristic variables identified in Figure 1, we use
existing measurement scales (e.g. Aaker’s brand personality) whenever possible. In order to
collect the data, we conducted a large-scale original data collection on the top of a number of
existing public and proprietary databases. We combine these sources as described in Figure 2.
The first source is the proprietary database of Young and Rubicam called “Brand Asset
Valuator” (YRBAV hereafter). This dataset has been used by both practitioners (Gerzema and
Lebar 2008) and academic scholars (Mizik and Jacobson 2008). It measures brand equity on four
perceived dimensions (referred to as “pillars” by Y&R): Energized-Differentiation, Relevance,
18
Esteem, and Knowledge. This dataset is constructed from a quarterly panel survey that measures
a broad array of perceptions and attitudes for a large number of brands, including 629 of the 697
brands we consider. Based on this survey Y&R build the four “pillars” for each brand.
The second major source of data is based on a survey we developed and administered to a
representative sample of the US population via Decipher, Inc.8
In addition, we used several other secondary sources. First, we used data from Interbrand on
the brands that were ranked in the top (places 1-100) of their list over the last few years. Second,
we use the American Customer Satisfaction Index (ACSI) to measure brand-level satisfaction.
Third, we used a range of secondary data sources to code several other variables, such as age and
type of good.
We collected data from 4,769
respondents on product involvement, brand familiarity, and brand’s excitement as well as three
of the six variables generally recognized as being involved in the diffusion of innovation
(Ostlund 1974; Rogers 1995). Specifically, we collect measures of complexity, observability
(which we term visibility to adhere to a similar construct discussed in Berger and Schwartz
2011), and perceived risk.
The rest of this subsection describes our variables, scales, and measures in detail.
1. Age – We define Age as the time elapsed from the commercial launch of the brand to the
reference current date, August 1st 2010. We obtained the data from brand publications and from
historical business and press data.
2. Type of good – We used the classification of Nelson (1974) and Laband (1986) to divide the
brands into search, experience and credence goods. We operationalize this measure, as originally
8 Decipher, Inc., a California-based company that specializes in developing and managing large-scale surveys. The questionnaire starts with screening questions about the level of familiarity with the category and the brands. Then, the system chooses several brands with which the respondent indicated familiarity, and asks about the product and brand attributes. The system dynamically allocated brands to respondents, until we reached 35-40 responses on each of our 697 brands. An annotated version of this complex questionnaire is described in the Web Appendix (part 2).
19
defined, at a subcategory level, which is between the category and brand levels. For example,
health clubs and sports teams are subcategories within the category of sports and hobbies. Using
the definitions from the literature, two independent judges separately classified the subcategories.
The inter-coder agreement was 72% and the judges resolved all disagreements by consensus.
3. Complexity – We measured complexity in our survey using a 7-points scale based on Moore
and Benbasat (1991) and Speier and Venkatesh (2002). This scale includes items on (i) the
learning efforts needed to get used to the brand, (ii) the time required to fully understand its
advantages, (iii) the difficulty of the product concept, and (iv) the mental effort to use the brand
(see the Web Appendix (part 2) for the exact questions).
4. Knowledge– We used two variables to measure the level of knowledge about the brand. The
first, Familiarity, is a single-item 5-points scale included in our survey in which respondents
were asked to what extent they are familiar with the brand. The second variable, Knowledge, is
one of YRBAV’s pillars. It is a single-item 7-points scale, in which people are asked to indicate
their level of intimate understanding of the brand. These two variables, although similar, differ in
how detailed or intimate the knowledge is. The correlation between these variables is 0.80.
5. Differentiation – To measure differentiation we used two YRBAV’s pillars – Energized-
Differentiation, and Relevance. Energized-Differentiation is a weighted average of items asking
to what extent the product is different, distinctive, unique, dynamic, and innovative. Relevance,
on the other hand, measures the percentage of people who stated that the brand is personally
appropriate for them. In some sense, Relevance is an anti-differentiation variable. If the brand is
personally appropriate for many people, it is not effective in expressing uniqueness. Therefore
we expect that brands with a high relevance score will generate low WOM.
6. Quality – We measure quality through the last YRBAV’s pillar, Esteem. This variable
20
captures the extent to which people hold a brand in high esteem. It is measured through items
asking about the leadership, reliability, and quality of the brand.
7. Visibility – We used our survey and the observability construct of Rogers and a five-items 7-
points scale based on Moore and Benbasat (1991). The items ask how often people have been
seen using the brand and whether the brand is commonly seen in the environment.
8. Excitement – We included in our survey a subset of Aaker’s (1997) 5-points excitement scale.
The full scale includes items that overlap with other variables in our analysis (e.g., age and
differentiation). The subset avoids such overlap and includes items such as exciting and spirited.
It should be noted that our qualitative results do not change if we use the full excitement scale.
9. Satisfaction –We use the American Customer Satisfaction Index, the standard measure of
satisfaction for American corporate brands (Fornell et al 1996). The measure is a 0-100 index,
collected each quarter using 250 customer telephone interviews per brand on a rolling set of
brands with each receiving at least one measure each year. Of our list of brands, 209 have an
ACSI score. We later discuss how we handle this missing data challenge.
10. Perceived risk - Rogers defines perceived risk as the functional, financial, and emotional
uncertainty associated with the product (where emotional uncertainty is the feeling of social
embarrassment that might be associated with using the brand). Most studies using this scale have
narrowed it to only those items that are relevant for the product category that they have
considered (e.g. Chong and Pervan 2007). Since we are interested in a large number of brands
we do not restrict our attention but rather use the full three item, (7-points) scale. We collect this
variable in our survey.
11. Involvement –There are numerous scales for measuring involvement, focusing on specific
facets of this construct. We use the three-item 5-points scale by Ratchford (1987). The items
21
measure the importance of the purchase decision, the amount of thought invested in the decision,
and the risk of making the wrong decision.9
Control variables
Following prior studies, we measure this variable
(via our survey) at the category level. In a preliminary check, we also measured involvement at
the brand level and observed a very low variation between brands within a category.
One might argue that people are talking about brands simply because these brands are
widely used or have existing brand equity (e.g., have high media coverage or ad budgets). In
order to account for these effects we include two control variables.
1. Brand Equity - We use data from Interbrand for measuring brand equity and to capture
advertising and media coverage effects. Based on Interbrand’s list of top 100 brands during any
of the years 2008-2010 we code a binary variable indicating whether the brand is in the list or not.
We expect brand equity to increase WOM.
2. Usage – We use a measure from YRBAV’s survey on the percentage of people who
answered that they use the brand frequently or occasionally.
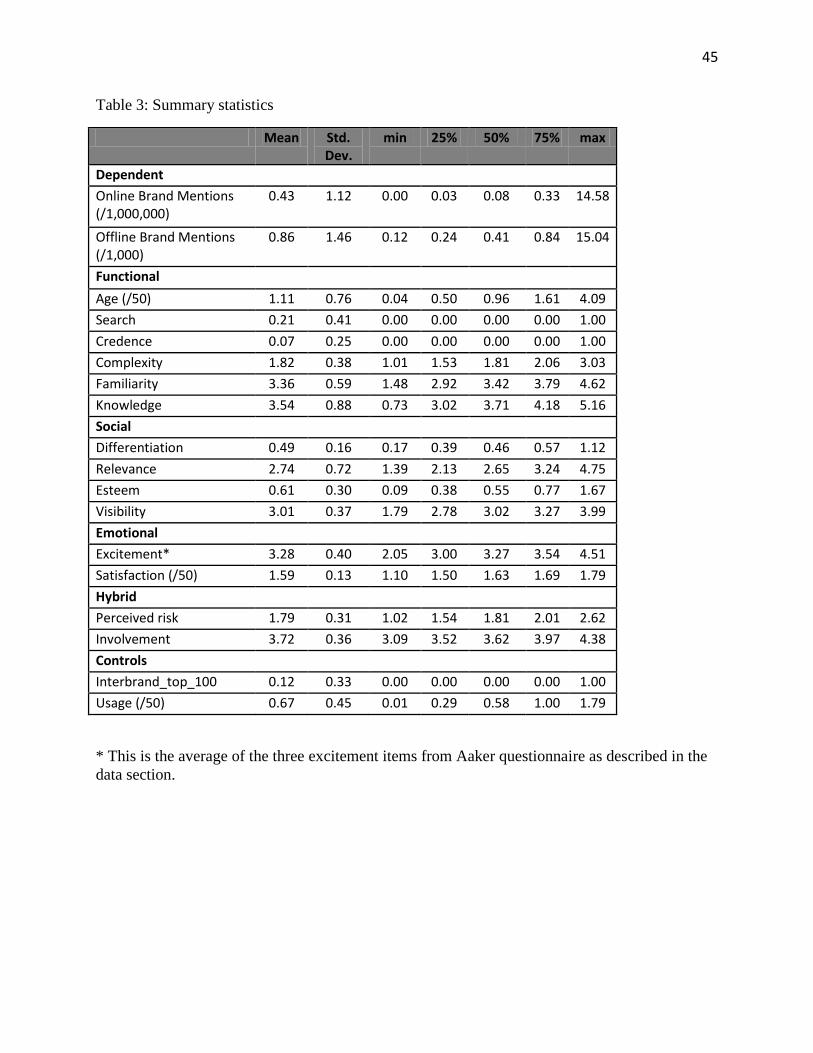
Data summary Overall, our dataset contains two dependent variables—online and offline brand mentions
(WOM)—and sixteen explanatory variables. Summary statistics for the dependent and
explanatory variables are displayed in Table 3. Table 4 presents the correlations for the
explanatory variables. These correlations use the full set of brands in our analysis except for
correlations with Satisfaction, which are calculated using only the 209 brands for which
Satisfaction is observed.
9 To be clear, this decision-related risk is about the relative advantage of the leading option over the set of alternatives. It is not about the perceived risk of the future performance.
22
Our data is aggregate and based on multiple sources. This means that we do not observe how
the brand perceptions of a specific individual are translated into her specific WOM. However,
these multiple sources also mean that our dependent and independent variables are answered by
different sets of individuals. This separation of implies our analyses are protected from common
methods variance. In particular, false correlations due to a single measurement system or
sampling variation cannot explain our results.
Estimation and Results
The next three subsections describe the empirical model and the estimation results. The first
subsection presents the formal empirical model and estimation procedure. The second discusses
the results for the full model, describing the findings for both online and offline channels by the
three drivers--functional, social, and emotional. Finally, we present results on the relative
importance of the three drivers for the online versus offline channels.
Empirical Model and Estimation Procedures
The formal model describes a set of brands i=1,2,...,N, each belonging to one of K categories
indexed by k.
The dependent variables are counts of brand mentions. Counts are typically treated as having a
non-normal distribution, with their mean and variance linked through the underlying distribution
(e.g., Poisson). Following such standard practices for count data, we use a negative binomial
distribution to model the mentions. Specifically, the probability density of WOM brand mentions
from channel m for brand i in category k is:
ik NegBin k iky ~ f ( + X , )m m m mγ β α ,
23
where NegBinf is the density of the negative binomial with dispersion parameter mα , which varies
by online and offline channels and mean k ik+ Xm mγ β . The mean incorporates (i) the vector ikX
that includes the variables of interest and controls, (ii) the channel-specific linear parameters mβ
, and (iii) the channel-specific category level effects kmγ .
One variable, Satisfaction, has a large number of missing values. The reasons are
unrelated to the variable's role in WOM, but dropping all observations with missing values
would reduce our sample size too severely (by 2/3). As a result, we assume a prior for the
missing data and use a missing-at-random (MAR) assumption in order to impute values for the
missing observations. Specifically, denote by I the set of observations that are incomplete (i.e.,
missing values for Satisfaction), and by C the set of observations that are complete and let the
prior of i I∈ follow a normal distribution parameterized by the first two moments of the
complete data:
~ ( , ( ))I C Cik NX f X V X ,
where the function Nf is the normal density, IikX is the incomplete observations of Satisfaction;
CikX are the complete observations of Satisfaction, CX is the mean of the complete data, and
( )CV X is the variance of the complete data. Note that while the prior is only based on the
complete Satisfaction data, the posterior distribution is influenced by the full model likelihood.
As a result, and since the observations in I are incomplete only with respect to one variable, the
posterior distribution of IikX also depends on the relationship to all the other variables.
To complete the model we describe the other priors, starting with the category-level
effect. Our brand observations come from a large variety of categories. Different categories may
24
generate more or less WOM on average. Some of this heterogeneity might be explained by the
(only) category level variable in the analysis, Involvement. The rest is random from our
perspective. Thus, we use a multi-level model, allowing the category level effects to be a
function of involvement, an overall average, and a random effect.10
kmγ
Specifically, the prior
distribution for the kth category-level effect on channel m WOM, , is
2k N k~ f ( Z , )m m
mγ δ σ ,
where is a row-vector of parameters, 2mσ is a parameter, and the vector kZ includes an
intercept and the Involvement variable. We place priors on the parameters
{ }1 2 10 0 0 0, , , , , , ,
mm mmA a b A vδθ β δ σ η− −= as follows: 1~ ( , )m m
Nf Aβ β −
; 0 0~ ( , )mGAMf a bα ;
2 2 1| ~ ( , )mm
m N mf Aδδ σ δ σ −
; 22
0 0~ ( , )m f vχ
σ η−
The distribution Nf is the multivariate normal distribution of same dimension as the mean vector
and GAMf is the gamma distribution. We refer to this joint prior on the parameters mθ as ( )mπ θ
and note that we use standard values for the prior arguments to generate diffuse priors.
Thus, the complete posterior likelihood, mL , is proportional to
( )2NegBin k ik N k
1 1
f ( + X , ) ( , ( )) f ( Z , )n K
m m m C C m mN ik ik m
i k
f X V Xγ β α δ σ π θ= =
∏ ∏
We estimate the model using Markov Chain Monte Carlo posterior simulation. Details related to
the estimation are presented in the Web Appendix (part 3).
10 For robustness, we also examined the relationships when including fixed effects in a classical estimation setting. The results are qualitatively similar, but not as complete. For example, we cannot evaluate the effect of Involvement.
25
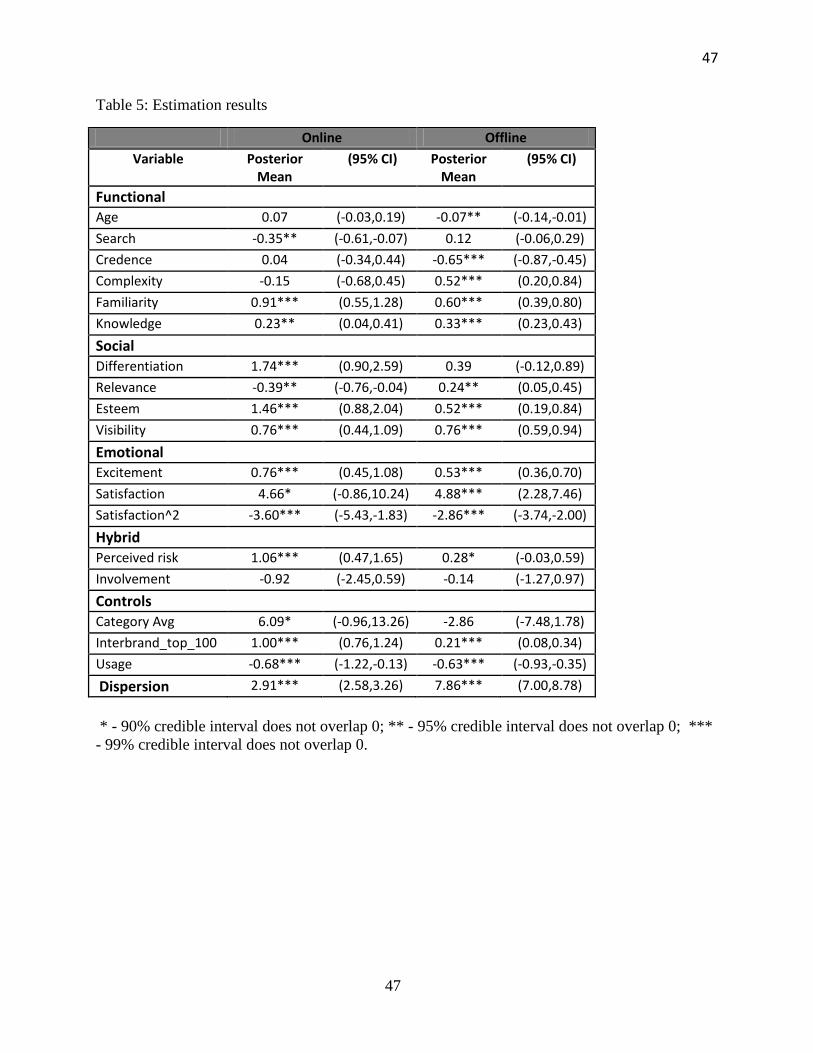
Results from the Full Model We organize our discussion of the full model by the three fundamental drivers of WOM. Within
each driver, we note differences in the two channels and summarize the findings for that driver.
These full model results are presented in Table 5.
The Functional Driver
The motives underlying the functional driver consist of information demand and supply. For
information demand, the effects of both Age and Complexity have the expected sign (negative
and positive, respectively) and the estimates are statistically significantly different from zero for
offline, but not for online. In other words, people talk more (i.e., in the offline world) about
brands that are newer and more complex, but online brand mentions are not related to these
variables. One possible explanation for the online-offline difference could hinge on the
advantages of offline conversations in clarifying complex and advance issues because such
conversations are truly interactive and allow questions-and-responses and clarifications. In
contrast, in online conversations, while also interactive, it takes greater time to respond and
clarifications (say of an unclear terminology) may require lengthy writing and be difficult. As a
result, exploring new or complex features of a brand may be easier offline than online (Berger
and Iyengar 2011). Alternatively, one might argue that the lack of effect online is due to not
observing individuals passively reading (i.e., receiving, but not posting) information (see Yang et
al. 2011 on the differences between WOM generation and consumption). By considering both
online and offline data together, we can empirically see the potential effects of this possible
shortcoming of the typical online data sources (Godes and Mayzlin 2004; Trusov, Bucklin and
Pauwels 2009).
26
Turning to the type of good variables, the coefficients on Search and Credence are the effect
on WOM as compared to experience goods (i.e., experience goods are the excluded category).
Note that these variables might represent either the demand for information or its supply. We
find that the type of good matters, but the effect varies across online and offline channels. For
online channels, search goods are mentioned statistically less often than experience goods; for
offline, credence goods are mentioned statistically less often than experience goods. The lower
online WOM for search goods may seem somewhat surprising, since often it is the Internet,
rather than offline conversation, that is viewed as the place where individuals search for product
information. However, such search activity is limited (Johnson et al 2004) and may be primarily
passive browsing which would not necessarily translate into more online brand mentions (Rafaeli,
Ravid and Soroka 2004). Instead, our findings suggest that experience goods get more attention
(than search ones) in the online environment. This might be due to either people’s wish to
explore what they might expect to experience in products and services whose value is not clear a
priori (i.e., demand effect) or consumers’ attempt to better evaluate the personal value of a brand
by posting about it in a hope of getting some feedback (i.e., a supply effect).
As for information supply, we find, as expected, significant positive effects for both
Familiarity and Knowledge meaning that people share more information about brands they are
familiar with and knowledgeable about. This tendency is qualitatively the same across the two
types of channels.
The Social Driver
We begin our discussion with the desire to express uniqueness. Two YRBAV’s pillars
represent this need to engage in WOM: (i) Energized-Differentiation and (ii) Relevance. The
effects of these two variables are significant and have the expected sign in the online arena but
27
not in the offline one. While the comparison between online and offline might sound surprising
at first, it is actually telling an intuitive and interesting story about WOM. Two fundamental
differences between online and offline might explain these findings. First, the scope of people
one “meets” in the online world is much larger than in the offline one. Furthermore, while offline
WOM is with people who know the individual quite well and have already formed a view about
her and her personality, online WOM is mostly with people who have not yet formed such a
perception. Thus, the desire to express ones personality and especially ones uniqueness is much
stronger in the online world. Second, in offline interactions an individual has many ways to
communicate uniqueness (e.g. clothes) and “brand name dropping” is less valuable for this
purpose.
Interestingly, while the effect of Energized-Differentiation in the offline model is
insignificant, the effect of Relevance is positive (i.e., opposite than we expected) and significant.
Recall that this variable measures the percentage of people who stated that the brand is
the offline WOM in a clear fashion. Unlike online communications, offline WOM can be more
“mandatory” – i.e., the individual meets a friend and they “need” to chat. In such a case,
discussing brands with high Relevance is attractive, since they are relevant to many people's lives
and thus make easy conversation starters or small talk.
The second motive we listed under the social driver is the desire to enhance one's self by
associating with high quality products (Wojnicki and Godes 2011). Here we expected our
measure of quality, Esteem, to be positively related with WOM. The results are consistent with
these expectations for both models (online and offline). In other words, we find that the higher
the perceived quality of a brand, the more likely are individual to mention it in a conversation
28
and we interpret this finding as indicating that in some cases individuals use WOM for self-
enhancement.
The final social driver is simply the desire to converse and it is measured by Visibility. We
again find highly significant effects in the expected direction for both channels. In other words,
the more visible a brand is, the more likely it will become part of a conversation. This result is
consistent with Berger and Schwartz (2011) and generalizes their finding to a larger set of brands
and categories, as well as for both online and offline channels.
The Emotional Driver
The emotional driver includes two motives – Excitement and Satisfaction. As expected we
find that more exciting brands receive more WOM.11
The role of Satisfaction is more complicated. Previous studies (Anderson, 1998; Richins 1983)
have suggested that at extremely low levels of satisfaction people have a greater tendency to
complain while at extremely high levels of satisfaction people are much more likely to
recommend to friends. Thus, we expected a U-shaped effect of satisfaction. Wojnicki and Godes
(2011) show a more intricate effect of satisfaction on WOM be exploring the interaction of
satisfaction with the motive of self enhancement in generating WOM. However, in both online
and offline channels we find a monotonic concave effect – as satisfaction increases, WOM
decreases. In Figure 3, we plot the effect of Satisfaction over the range 40 to 100 on the ACSI
index (noting that the observed values range between 55 and 89). This result means that the
This result is strongly significant for both
online and offline channels. We interpret this result to mean that when consumers are excited
about a brand they are likely to experience emotional arousal that leads them to speak with others.
11 Recall that our analysis is based on a subset of the full excitement scale in order to avoid overlap with other variables included in our analysis (e.g., age and differentiation). Our qualitative results do not change if we use the full excitement scale.
29
higher WOM at low satisfaction levels is supported by the data, but the higher WOM for high
satisfaction levels is not. It is possible that earlier findings about the high WOM at high
satisfaction level were due to the exclusion of variables such as Esteem and Excitement that are
related to satisfaction and are included in our model. In other words, our analysis studies the role
of Satisfaction over and beyond the effect of these variables.
The Hybrid Motives
As discussed above, two characteristics (perceived risk and involvement) do not fit nicely
into only one driver and thus are considered as “hybrid” (i.e., they contain elements of both the
emotional and functional drivers).
As expected, the effect of Perceived Risk is positive. It is highly significant in the online
model, but only marginally significant in the offline model. As discussed in the theoretical
framework, the positive effect can be due either to the demand for information (functional
driver) or to the anxiety associated with such brands.
We expected Involvement to have a positive effect for the emotional and functional drivers.
However, Involvement is measured at the category level, and with only 16 categories, the limited
variation did not allow us to effectively estimate the effect. We do not find a significant effect in
any of the models.
Controls and Dispersion
Both our control variables are highly significant – while brands in the Interbrand top 100
brands have higher WOM, brands with higher usage have less WOM. The sign of the Interbrand
effect was expected. The rationale behind the effect of Usage (for which we did not have a clear
expectation) is less clear. Finally, the dispersion parameter is higher in the offline than the online
channel reflecting the larger dispersion in the number of online mentions. This is a characteristic
30
of the measurement system and modeling approach and not reflective of any actual differences
across the two channels.
Results on Relative Importance of the Three Drivers of WOM To compare the importance of the three drivers, we ask what happens to the fit of the model
when each of these drivers is excluded from the analysis. In other words, we examine models
with subsets of the variables corresponding to all combinations of the drivers. To compare these
submodels, we present the model log marginal likelihoods (LML).12
Before proceeding to the results we highlight two points about this exercise. First,
Satisfaction requires a missing data model, which induces much larger variation in the LML, and,
as a result, does not allow us to compare across subsets of drivers. Therefore, we exclude it from
this analysis. This exclusion could lead the importance of the emotional driver to be understated.
Second, the hybrid motives could belong to both the functional and emotional drivers. Thus, we
use submodels with and without the hybrid drivers to examine the overall role of the three
fundamental drivers.
Table 6 presents and describes the results of this analysis.13
12 Because our theory suggests all the drivers could play a role, rather than using the LMLs to select a model, we use them to indicate the relative importance of the different drivers.
The most notable finding here is
the difference between online and offline channels. We find that for the online model the order
of importance of the drivers is social, functional, and then emotional. Overall, the importance of
the social and functional drivers is significantly greater than that of the emotional driver. For the
offline model the order is emotional, functional, and lastly social, with the importance of
emotional drivers significantly greater than the other two drivers. In other words, while the
emotional driver is the most important in offline conversations, the social one is the major force
in offline brand mentions. These results portray an interesting and insightful picture of WOM.
13 The individual coefficient estimates are presented in the Wen Appendix (part 4).
31
One way of interpreting them is the following. Offline conversations, which are mostly in one-
on-one settings, are more personal and intimate by nature and thus allow people to share
emotions such as excitement and satisfaction. Online WOM, which usually involves
“broadcasting” to many people (e.g. twitter) is more appropriate for social signaling (e.g. of
uniqueness).
Discussion
Although brands and WOM are two fundamental marketing concepts, their relationship has
largely been ignored. Here, we show that they are closely related and demonstrate that brand
characteristics play an important role in shaping WOM. Furthermore, these results are consistent
with the theoretical framework we present according to which the brand characteristics affect
WOM through three drivers – functional, social and emotional. Each of these drivers is a
collection of related motives: the demand and supply of information (functional); the need to
express uniqueness, self-enhancement, and the desire to converse (social); sharing emotions such
as excitement and satisfaction (emotional). We also find that the role of brand characteristics in
online WOM is quite different than their role in offline WOM. For example, while the order of
importance of the three drivers in the online channel is social, functional and emotional, the
order for the offline channel is emotional, functional and social.
The results portray a nuanced, intricate picture for the brand-WOM relationship in two
aspects: First, all three drivers -- functional, social and emotional -- play a role in the WOM
dynamics. In other words, WOM is not an outcome of only one characteristic (e.g. perceived risk
or visibility), motive (e.g. self-enhancement) or driver. All the different facets of the brand are
involved in generating WOM.
32
Second, the role of brand characteristics differs across the WOM channels. For example,
new and more complex brands are talked about more offline, but we find no support for these
relationships online. In contrast, more differentiated brands have significantly more online brand
mentions while we find no support for such a relationship offline. Furthermore, as pointed above,
the channels differ in what fundamental drivers are most important to WOM.
These results are important for marketing executives and brand managers since they shed
light on the link between investments in brands and their market outcomes. First, our work can
provide insights as to whether the actual WOM on a brand fulfills its potential, as expected from
the brand’s characteristics. That is, for each brand, our model predicts an average level of WOM
based on its attributes. By comparing this expected level of WOM to the actual level, we can see
if the actual level is above or below the expected WOM. If it is lower, one possible reason
(although not the only one) can be that the firm did not invest enough resources in pursuing
WOM for this brand.14
Second, in a similar sense, the average level of WOM can provide a sense for how much of a
role WOM is likely play in the overall marketing communications mix for the brand. For
example, some categories, such as financial products, tend to have lower average WOM and
knowing this should shape how brands in these categories set marketing communications
strategy. Furthermore, some brands should expect to have a significant WOM online or offline,
but not on both channels. Knowing this can help marketing managers plan more effective
integrated marketing communications.
For example, from our set of brands we find that Pillsbury, Swansons,
Zest, AOL, Motorola, Dell, Microsoft, and Mercedes Benz all underperform compared to what
we would expect based on their brand characteristics.
14 Of course, it is quite possible that there is an alternative reason hidden in the brand specific random effect.
33
Third, our finding can assist managers in building their brands. Consider the case of
visibility. A firm that developed a new type of digital music player for cars may have a
technological option to embed this player deep in the dashboard, or make it a more visible
component of the interior. Since visibility enhances WOM and our model can project the
magnitude of the effect, a brand manager may be able to weigh in the total costs and benefits of
the design choice. Intel’s “Intel Inside” campaign from 1991 did exactly this – increased the
visibility of the microprocessor and contributed to the firm’s WOM (Intel is on our list of 700
brands).
Another example is differentiation – marketing textbooks discuss the tradeoffs between
points of differentiation and points of parity. Their balance depends on a variety of
considerations. Our result indicating that differentiated brands enhance WOM, add a new
perspective to this tradeoff.
The motto of WOMMA's (Word of Mouth Marketing Association professional association)
annual summit is “Create Talkable Brands.” However, the best practices discussed there are
mostly brand promotional strategies over real and virtual social networks. Our findings go one
step back to the stage of creating and building the brands, and provide insights as to how the
brand's perceived characteristics affect its WOM. With these findings, brand managers can craft
the brand's characteristics, understand what channels to pursue, and diagnose problems in the
WOM flow.
Of course, our study has its limitations. Since we use cross-sectional, observational data we
cannot empirically establish a sense of causality. What we can do is examine both whether the
expected effect of each brand characteristic is present, once controlling for all other factors, and
34
which effects are most important. As yet, no study has considered such joint effects for brands
and their characteristics on WOM.
Another point to keep in mind is that we relied on measures of aggregate brand mentions
rather than ones disaggregated by source. While this aggregation allows us to speak on WOM
across many different brands, categories and channels, one might get a clearer picture as to
mechanisms underlying specific channel effects through more disaggregate data. For instance,
online user forums with threaded conversations of questions and replies might have more
important role for information demand than less interactive online sources such as blogs,
microblogs, and reviews. Future research could use finer grained data to study these and other,
more nuanced, questions.
Along these lines, this work lays the ground for future research in several directions:
1. Channel effects - In this paper we focused on the relationship between brand characteristic
and WOM, and presented results from online and offline channels as a way to test the
generalizability of our findings. However, channel effects convey many opportunities for future
research. Instead of the gross division to offline and online, more channels can be explored.
Various online channels – i.e., emails, Twitter, Blogs and User groups – are different in nature
and can show different patterns of WOM. The WOM flow across channels over time is also an
interesting issue - do peaks in buzz on a certain brand start on face-to-face conversations and
then continue to the online world? Or does it start in Twitter and then make its way to Blogs, and,
finally, reaches user forums. Gaining a better understanding of these dynamics of WOM across
channels can help shape strategies for generating WOM, responding to WOM issues, and for
identifying leading and lagging indicators of WOM.
35
2. Valence - In this study, we counted the overall mentions of WOM, regardless of whether
they were positive, negative, neutral or mixed. Previous studies explored the implications and
contexts of negative WOM (e.g. Moldovan et al 2011; Shin, Hanssens and Gajula 2011);
however, the antecedents and mechanisms of negative WOM received little research attention. A
key question is how our results vary when separating the WOM into sentiment types. Do
functional, social, and emotional drivers play a different role for different valence types? The
valence-channel interaction is also of interest. Insights on this topic can be of interest for firms
regarding the efforts they should invest in various channels to manage the sentiment of WOM.
3. Individual level insights – This study examines WOM behaviors at the brand level, using
aggregate measures of WOM. As a result, we cannot make claims on the WOM behaviors of
individuals. For example, we demonstrated differences between brand mentions on the online
and offline channels. Do these online-offline differences result from the same people talking
about different brands in different channels, or do different groups, with different interests prefer
specific channels? Answering such questions requires a significantly different and new data that
track the WOM process at the individual level. To our knowledge, no such dataset exists, but
building such a dataset could greatly enhance the ability to understand WOM behaviors at the
individual level.
The goal of our paper is to better understand the intricate relationships between brands and
WOM. We believe that such an understanding can benefit both research on WOM and research
on brands. The research on WOM will benefit from understanding the antecedents of WOM, its
patterns, and channel interactions. Branding research will benefit since WOM is an indicator for
market response. This paper takes a first step in linking these two literatures and providing
insight into fruitful areas of future research.
36
References
Aaker, Jennifer L. (1997), “Dimensions of brand personality,” JMR, Journal of Marketing
Research, 34 (3), 347-356.
Anand, Bharat N. and Ron Shachar (2011), “Advertising, the Matchmaker,” RAND Journal of Economics, 42(2), 205-245.
Amblee, Naveen, and Tung Bui (2008), “Can Brand Reputation Improve the Odds of Being Reviewed On-Line,” International Journal of Electronic Commerce, 12(3), 11-28.
Anderson, Eugene (1998), “Customer Satisfaction and Word-of-Mouth,” Journal of Service Research, 1 (1), 5–17.
Bell, David, and Sangyoung Song (2007), “Neighborhood Effects and Trial on the Internet: Evidence from Online Grocery Retailing,” Quantitative Marketing and Economics, 5(4), 361-400.
Berger, Jonah (2011), “Arousal Increases Social Transmission of Information,” Psychological Science, 22(7), 891-893.
Berger, Jonah, and Katherine L. Milkman (2012), “What Makes Online Content Viral?” Journal of Marketing Research, Forthcoming.
Berger, Jonah, and Raghuram Iyengar (2011), “How Interest Shapes Word of Mouth Over Different Channels,” Working paper.
Berger, Jonah, and Eric Schwartz (2011), “What Drives Immediate and Ongoing Word of Mouth,” Journal of Marketing Research, 48(5), 869-880.
Berger, Johan, and, Chip Heath (2007), “Where consumers diverge from others: Identity signaling and product domains,” Journal of Consumer Research, 34 (August), 121-134.
Borgatti, Stephen P. and Rob Cross (2003), “A Relational View of Information Seeking and Learning in Social Networks”, Management Science, 49(4), 432-445.
Bowman, Douglas and Das Narayandas (2001), “Managing Customer-Initiated Contacts with Manufacturers: The Impact on Share of Category Requirements and Word-of-Mouth Behavior,” Journal of Marketing Research, 38 (3) 281-297.
Brown, Jacqueline J. and Peter H. Reingen (1987), “Social Ties and Word-of-Mouth Referral Behavior,” Journal of Consumer Research 14 (3), 350-362.
Bueno, Bolivar J. (2007), Why We Talk: Seven Reasons Your Customers Will - Or Will Not - Talk About Your Brand, Kingston: New York, Creative Crayon Publishers.
Che, Hai, Nicholas H. Lurie, and Allen M. Weiss (2011), “Roles, Incentives, and Contribution Behavior in Online Communities,” Working paper.
Chen, Yubo, Qi Wang and Jinhong Xie (2011), “Online Social Interactions: A Natural Experiment on Word of Mouth Versus Observational Learning,” Journal of marketing research, 48(2), 238-254.
Cheema, Amar, and Andrew M. Kaikati (2010), “The Effect of Need for Uniqueness on Word of Mouth,” Journal of Marketing Research, 47 (3), 553-563.
Chevalier, Judith A., and Dina Mayzlin (2006), “The Effect of Word of Mouth on Sales: Online Book Reviews,” Journal of Marketing Research, 43 (3), 345–354.
Chong, Sandy, and Graham Pervan (2007), “Factors Influencing the Extent of Deployment of Electronic Commerce for Small-and Medium-Sized Enterprises,” Journal of Electronic Commerce in Organizations, 5(1), 1-29.
Chu, Junhong, Pradeep K. Chintagunta, and Javier Cebollada (2008), “A Comparison of Within-household Price Sensitivity across Online and Offline Channels”, Marketing Science, 27(2), 283-299.
Cialdini, Robert B. (2001), Influence: Science and Practice, fourth Edition Allyn & Bacon.
Danaher, Peter J., Isaac W. Wilson, and Robert A. Davis (2003), “A Comparison of Online and Offline Consumer Brand Loyalty,” Marketing Science, 22(4) 461-476.
Degeratu, Alexandru M., Arvind Rangaswamy, and Jianan Wu (2000), “Consumer choice behavior in online and traditional supermarkets: The effects of brand name, price, and other search attributes,” International Journal of Research in Marketing, 17(1), 55-78.
Dichter, Ernest (1966), “How Word-of-mouth Advertising Works,” Harvard business Review, 16 (November-December), 147-166.
Easingwood, Christopher J. Vijay Mahajan, and Eitan Muller (1983), “A Non uniform Influence Innovation Diffusion Model of New Product Acceptance,” Marketing Science, 2(3), 273-295.
eMarketer (2011) “Why do Affluent Consumers Connect with Brands on Social Networks?”, May 11. Available at: http://www.emarketer.com/Article.aspx?R=1008379
Fornell, Claes, Michael D. Johnson, Eugene W. Anderson, Jaesung Cha and Barbara Everitt Bryant (1996), “The American Customer Satisfaction Index: Nature, Purpose, and Findings,” The Journal of Marketing, 60 (4) 7-18.
Gerzema, John, and Ed Lebar (2008), The Brand Bubble- The Looming Crisis in Brand Value and How to Avoid It, San Francisco: Jossey-Bass.
Godes, David, and Dina Mayzlin (2004), “Using online conversations to study word of mouth Communication,” Marketing Science, 23(4), 545–560.
Godes, David, and Dina Mayzlin (2009), “Firm-Created Word-of-Mouth Communication: Evidence from a Field Test”, Marketing Science, 28(4), 721–739.
Goldenberg, Jacob, Donald, Lehmann, Daniella Shidlovski, and Michal Master Barak (2006), “The Role of Expert versus Social Opinion Leader in New Product Adoption,” MSI Working Paper Volume 06-124 67-84.
Goldenberg, Jacob, Barak Libai, Sarit Moldovan, and Eitan Muller (2007), “The NPV of bad news,” International Journal of Research in Marketing, 24(3), 186-200.
Goldfarb, Avi, and Catherine Tucker (2011), “Online Advertising,” Advances in Computers, Forthcoming.
Grewal, Rajdeep, Thomas W. Cline, and Anthony Davies (2003), "Early-Entrant Advantage, Word-of-Mouth Communication, Brand Similarity, and the Consumer Decision-Making Process,” Journal of Consumer Psychology, 13 (3), 187-197.
Gupta, Pranjal, and Judy Harris (2010), “How e-WOM recommendations influence product consideration and quality of choice: A motivation to process information perspective,” Journal of Business Research, 63 (9-10), 1041-1049.
Herr, Paul M., Frank R. Kardes, and John Kim (1991), “Effects of Word-of-Mouth and Product-Attribute Information on Persuasion: An Accessibility-Diagnositicity Perspective,” Journal of Consumer Research, 17 (4), 454-462.
Ho, Jason Y.C. and Melanie Dempsey (2010), “Viral marketing: Motivations to forward online content,” Journal of Business Research, 63, (9-10), 1000-1006.
Iyengar Raghuram, Christophe Van den Bulte, Thomas W. Valente (2011), “Opinion Leadership and Social Contagion in New Product Diffusion,” Marketing Science, 30 (2), 195-212.
Johnson, Eric J., Wendy W. Moe, Peter S. Fader, Steven Bellman, and Gerald L. Lohse (2004), “On the Depth and Dynamics of Online Search Behavior,” Management Science, 50(3) 299-308.
Katona, Zsolt, Peter Zubcsek, and Miklos Sarvary (2011), “Network Effects and Personal Influences: Diffusion of an Online Social Network,” Journal of Marketing Research, 48(3) 425-443.
Keller, Ed (2006), “The Steak Is the Sizzle, A Study on Product Attributes that Drive Word-of-Mouth Success,” The Keller Fay Group in Cooperation with BzzAgent.,White paper, available at:
Keller, Ed (2007), “Unleashing the power of word of mouth: Creating brand advocacy to drive growth,” Journal of Advertising Research, 47(4), 448–452.
Keller , Kevin Lane (2010), “Brand Equity Management in a Multichannel, Multimedia Retail Environment,” Journal of Interactive Marketing, 24 (2), 58-70.
Keiningham, Timothy L., Bruce Cooil, Tor Wallin Andreassen and Lerzan Aksoy (2007), “A Longitudinal Examination of Net Promoter and Firm Revenue Growth,” Journal of Marketing, 71(3), 39-51.
Laband David N. (1986), “Advertising as Information: An Empirical Note,” The Review of Economics and Statistics, 68(3), 517-552.
Lutz, Richard J. and Patrick J. Reilly (1974), “An Exploration of the Effect of Perceived Social and Performance Risk on Consumer Information Acquisition,” in Advances in Consumer Research, Vol. 1 Scott Ward and Peter Wright, eds., Assoc. for Consumer Research, 393-405.
Mcconnell, Ben and Jackie Huba (2007), Citizen Marketers: When People Are the Message, USA: Kaplan Publishing.
Mizik, Natalie, and Robert Jacobson (2008), “The Financial Value Impact of Perceptual brand Attributes,” Journal of Marketing Research, 45(1), 15-32.
Moldovan, Sarit, Jacob Goldenberg, and Amitava Chattopadhyay (2011), “The Different Roles of Product Originality and Usefulness in Generating Word of Mouth,” International Journal of Research in Marketing, 28(2) 109-119.
Moore Gary C. and Izak Benbasat (1991), “Development of an Instrument to Measure the Perceptions of Adopting an Information Technology Innovation,” Information Systems Research, 2(3), 192-222.
Nardi Bonnie A. Diane J. Schiano, Michelle Gumbrecht, and Luke Swartz (2004), “Why We Blog,” Communications of the ACM, 47(12), 41–46.
Nelson Phillip (1974), “Advertising as Information,” Journal of Political Economy, 82(4), 729-754.
Ostlund, Lyman E. (1974), “Perceived Innovation Attributes as Predictors of Innovativeness,” Journal of Consumer Research, 1(August), 23-29.
Peters, Kim, and Yoshihisab Kashima, (2007), “From social talk to social action: Shaping the social triad with emotion sharing,” Journal of Personality and Social Psychology, 93(5), 780 –797.
Peres, Renana, Eitan Muller, and Vijay Mahajan (2010), “Innovation Diffusion and New Product Growth: Critical Review and Research Directions,” International Journal of Research in Marketing, 27(2), 91–106.
Rafaeli, Sheizaf, Gilad Ravid, and Vladimir Soroka (2004), “De-Lurking in Virtual Communities: A Social Communication Network Approach to Measuring the Effects of Social and Cultural Capital,” Proc. of the 37th Annual Hawaii International Conference on System Sciences (HICSS'04), p. 70203, - Track 7.
Ratchford, Brian T. (1987), “New Insights About the FCB Grid,” Journal of Advertising Research, 27(4), 24-38.
Richins, Marsha L. (1983), “Negative Word-of-Mouth by Dissatisfied Consumers: a Pilot Study,” Journal of Marketing, 47 (1), 68-78.
Rimé, Bernard , Catrin Finkenauer, Olivier Luminet, , Emmanuelle Zech, and Pierre Philippot (1998), “Social Sharing of Emotion: New Evidence and New Questions,” European Review of Social Psychology, Vol. 9, Wolfgang Stroebe and Miles Hewstone eds, John Wiley & Sons Ltd, 145 -189.
Roberts, Kevin (2004), Lovemarks, New York, NY: powerHouse Books.
Rogers (1995), The Diffusion of Innovations, New York: Free Press.
Rosen, Emanuel (2002), The Anatomy of Buzz, New York: Doubleday.
Rubin, Rebecca. B., Elizabeth M. Perese, and Carole A. Barbato (1988), “Conceptualization and Measurement of Interpersonal Communication Motives,” Human Communication Research, 14(4), 602–628.
Shin, Hyun S., Dominique M. Hanssens, and Bharath Gajula (2011), “Positive vs. Negative Online Buzz as Leading Indicators of Daily Price Fluctuation,” Working paper.
Speier, Cheri, and Viswanath Venkatesh (2002), “The Hidden Minefields in the Adoption of Sales Force Automation Technologies,” Journal of Marketing, 66 (3), 98-111.
Sundaram, D.S. Kaushik Mitra, and Cynthia Webster (1998), “Word-Of-Mouth Communications: A Motivational Analysis”, in Advances in Consumer Research, Vol. 25, Joseph W. Alba, and J. Wesley Hutchinson, eds. Provo, UT: Assoc. for Consumer Research, 527-531.
Sundaram D.S., and Cynthia Webster (1999), “The Role of Brand Familiarity on the impact of Word of Mouth Communication on Brand Evaluation, “ in Advances in Consumer Research, Volume 26, Eric J. Arnould and Linda M. Scott, eds. Provo, UT : Assoc. for Consumer Research, 664-670.
Trenholm, Sarah, and Arthur Jensen (2004), Interpersonal Communication, New York, Oxford University Press.
Trusov, Michael, Randolph E. Bucklin, and Koen Pauwels (2009), “Effects of Word-of-Mouth versus Traditional Marketing: Findings from an Internet Social Networking Site,” Journal of Marketing, 73 (5), 90-102.
Walsh, Gianfranco, and Vincent-Wayne Mitchell (2010), “The effect of consumer confusion proneness on word of mouth, trust, and customer satisfaction,” European Journal of Marketing, 44 (6), 838 – 859.
Westbrook, Robert A. and Richard L. Oliver (1991), “The Dimensionality of Consumption Emotion Patterns and Consumer Satisfaction,” Journal of Consumer Research, 18 (1), 84 –91.
Wojnicki, Andrea and Godes, David (2011), “Signaling Success: Strategically-Positive Word of Mouth,” Working paper.
Wu Fang, Bernardo A. Huberman, Lada A. Adamic, and Joshua R. Tyler (2004), “Information flow in social groups,” Physica A: Statistical and Theoretical Physics, 337 (1, 1), 327-335.
Yang, Sha, Mantian Hu, Henry Assael, and Russell S. Winer, “Modeling the Interdependent Effect of word-of-mouth reception and transmission,” Working paper.
Zaichkowsky, Judith L. (1985), “Measuring the involvement construct,” Journal of Consumer Research, 12(3), 341–352.
Table 1: Top 10 most mentioned brands offline and online
Order Offline Online
1 Coca Cola Google
2 Verizon FaceBook
3 Pepsi iPhone
4 WalMart YouTube
5 Ford Ebay
6 AT&T Xbox 360
7 McDonalds Ford
8 Dell Computers Yahoo
9 Sony Disney
10 Chevrolet Audi
44
Table 2: Distribution of total mentions and mentions per brand, offline and online
% Total mentions Average mentions per brand
Category Number of brands
Online Offline Online Offline
Beauty products 52 1% 5% 53,205 526 Beverages 66 3% 13% 150,536 1,129 Cars 47 17% 10% 1,005,732 1,213 Children's products 19 0% 2% 70,730 579 Clothing products 51 3% 7% 150,952 777 Department stores 15 4% 5% 695,945 1,779 Financial services 39 2% 4% 113,656 621 Food and dining 105 4% 12% 115,139 620 Health 27 1% 3% 140,630 534 Home design 13 1% 2% 114,670 654 Household Products 24 0% 2% 28,327 475 Media and entertainment 103 32% 9% 893,706 476 Sports and hobbies 21 8% 3% 1,110,863 707 Technology 56 17% 12% 847,929 1,248 Telecommunications 25 7% 9% 776,423 1,961 Travel services 34 1% 3% 60,305 543 Note that 1. The sample contains only the most talked about brands. 2. The online numbers contain mentions from all the available sources, while the offline numbers only contain mentions from a weekly representative sample of 700 people. Importantly, as a result, the numbers for offline cannot be directly compared to those for online.
Table 6: Relative Importance of the Functional, Social and Emotional drivers
Online Offline LML* LML Models with the Hybrid motives Social -8394.2 -5537.6 Emotional -8437.6 -5231.2 Functional -8431.1 -5414.6 Social & Emotional -8389.2 -5489.3 Functional and Emotional -8404.4 -5408.0 Functional & Social -8349.7 -5815.0 Models without the Hybrid motives
Social -8388.0 -5462.9 Emotional -8482.0 -5220.6 Functional -8437.8 -5301.2 Social & Emotional -8394.8 -5386.0 Functional and Emotional -8406.9 -5398.7 Functional & Social -8383.5 -5678.6
* LML indicates log marginal likelihood with higher (less negative) values indicating better fit to the data.
This table indicates that for submodels containing only one driver, online the social driver fits best (LML=-8394) and functional second best (LML=-8431), while offline, the emotional driver fits best (LML=-5231) and functional second best (LML=-5415). Similarly the same relationship holds for submodels containing one driver and including the hybrid motives. For submodels containing two drivers, online the functional and social drivers fit best (LML=-8350) followed by social and emotional drivers (LML=-8389), while offline the functional and emotional drivers fit best (LML=-5408) followed by the social and emotional drivers (LML=-5489). For the submodels including two drivers and the hybrid motives, the order remains the same except offline the submodel containing the social and emotional drivers (LML=-5386) is now higher than the one containing functional and emotional (LML=-5399).