ON CONSUMER PREFERENCES AND THE WILLINGNESS TO PAY FOR TERM LIFE INSURANCE ALEXANDER BRAUN HATO SCHMEISER FLORIAN SCHREIBER WORKING PAPERS ON RISK MANAGEMENT AND INSURANCE NO. 145 EDITED BY HATO SCHMEISER CHAIR FOR RISK MANAGEMENT AND INSURANCE SEPTEMBER 2014
Transcript
ON CONSUMER PREFERENCES AND THE
WILLINGNESS TO PAY FOR TERM LIFE INSURANCE ALEXANDER BRAUN HATO SCHMEISER FLORIAN SCHREIBER WORKING PAPERS ON RISK MANAGEMENT AND INSURANCE NO. 145
EDITED BY HATO SCHMEISER
CHAIR FOR RISK MANAGEMENT AND INSURANCE
SEPTEMBER 2014
On Consumer Preferences and the Willingness to
Pay for Term Life Insurance
Alexander Braun, Hato Schmeiser, and Florian Schreiber∗
Abstract
We run a choice-based conjoint (CBC) analysis for term life insurance on a sample of 2,017 Ger-man consumers using data from web-based experiments. To do so, we extend the traditional CBCapproach by incorporating individual pricing factors such as age and health status to the experimen-tal design. Individual-level part-worth utility profiles are estimated by means of a hierarchical Bayesmodel. Drawing on the elicited preference structures, we then compute relative attribute importancesand different willingness to pay measures. In addition, we present comprehensive simulation resultsfor a realistic competitive setting that allows us to assess product switching as well as market ex-pansion effects. On average, brand, critical illness cover, and underwriting procedure turn out to bethe most important nonprice product attributes. Hence, if a policy comprises their favored specifica-tions, customers accept substantial markups in the monthly premium. Furthermore, preferences varyconsiderably across the sample. While some individuals are prepared to pay relatively high monthlypremiums, a large fraction exhibits no willingness to pay for term life insurance at all, presumably dueto the absence of a need for mortality risk coverage. We also illustrate that utility-oriented productoptimization is well-suited to gain market shares, avoid competitive price pressure, and access addi-tional profit potential. Finally, based on estimated demand sensitivities and a set of cost assumptions,it is shown that the traditional pricing approaches, which still prevail in the insurance industry, areclearly inferior to the preference-based methodology that we employ throughout this paper.
Keywords: Willingness to Pay, Term Life Insurance, Choice-Based Conjoint AnalysisJEL classification: C83; D12; G22
1 Introduction
Being able to adequately gauge consumer preferences and willingness to pay (WTP) is crucial for strat-
egy formulation, product design, demand assessment, sales management, and, most notably, pricing
decisions.1 Accordingly, over the past decades, there has been substantial conceptual and methodological
progress in the area of preference elicitation and WTP measurement. Unsurprisingly, the central deter-
minants of consumer behavior are now well-understood for a broad range of goods and services. This
development, however, seems to have bypassed the insurance sector, where prices are still largely set
based on cost considerations. By the same token, there is a fairly limited amount of empirical research
∗Alexander Braun ([email protected]), Hato Schmeiser ([email protected]), and Florian Schreiber([email protected]) are at the Institute of Insurance Economics, University of St. Gallen, Tannenstrasse 19,CH-9000 St. Gallen. We are grateful to Lukas Steinmann, Stephan Schreckenberg, and their colleagues at Swiss Re fortheir regular advice as well as their valuable comments and suggestions throughout the course of this research project.1The WTP or reservation price can be defined as the utmost amount of money that an individual is prepared to spend ona given good or service (see, e.g., Wertenbroch and Skiera, 2013). While some authors have suggested to view WTP as arange (see, e.g., Wang et al., 2007), we follow the more common conceptualization of treating it as a point estimate.
Working Papers on Risk Management and Insurance, No. 145 – September 2014
dealing with the question of how individuals actually evaluate risk transfer instruments.
In welfare theory, WTP is frequently employed to estimate the benefits of public health care systems
(see, e.g., Johannesson, 1996; Hammitt and Graham, 1999; Olsen et al., 2004), safeguards against envi-
ronmental hazards such as accidents, diseases, and disasters (see, e.g., Jones-Lee, 1974; Savage, 1993;
Hammitt and Liu, 2004), as well as mortality risk mitigation (see, e.g., Shepard and Zeckhauser, 1984;
Cropper and Sussman, 1988; Johannesson et al., 1997; Eeckhoudt and Hammitt, 2001; Alberini et al.,
2006). Furthermore, there is a large strand of the development economics literature aimed at assess-
ing the WTP for health coverage in rural areas across Africa (see, e.g., Asenso-Okyere et al., 1997;
Dong et al., 2003; Ichoku et al., 2010), Asia (see, e.g., Asgary et al., 2004; Zhang et al., 2006; Chen et al.,
2011), India (see, e.g., Mathiyazaghan, 1998; Dror et al., 2007), as well as Latin America (see, e.g.,
Vargas Bustamante et al., 2008; Eckhardt et al., 2011). Besides, preferences and WTP have been stud-
ied for crop insurance (Sherrick et al., 2003; Heenkenda, 2011), livestock insurance (see, e.g., Shaik et al.,
2008; Buchenrieder and Fischer, 2009; Khan et al., 2013), flood insurance (Botzen and Van den Bergh,
2012), health insurance (Booske et al., 1999; Kerssens and Groenewegen, 2005; Van den Berg et al., 2008),
long-term care insurance (Costa-Font and Font, 2009; Jacobs-Lawson et al., 2010), interest rate guaran-
tees in unit-linked life insurance (Gatzert et al., 2011), weather insurance (Fraser, 1992; Musshoff et al.,
2008), as well as auto, home, and household insurance (Hansen et al., 2013).
A thorough investigation of consumer preferences for term life insurance, however, has not been con-
ducted to date. The only explicit figures in this regard come from a recent set of practitioner studies
by Swiss Re (2012). Considering the product’s importance in most developed economies, this is quite
astonishing. In Germany, for example, the term life premium volume amounted to about EUR 3,145
million in 2012 with 7.48 million policies in force. However, sales peaked in 2006 and have been declining
since with no signs of recovery. As a result, competition with regard to prices and contract design is
intensifying. In this new market environment, insurance companies with a comprehensive understanding
of consumer preferences will have a competitive advantage. The paper at hand is intended to substantiate
this notion. We extend traditional choice-based conjoint (CBC) analysis, a powerful preference elicita-
tion method grounded in random utility theory (RUT), and link respondents’ individual risk factors such
as age and health status to the experimental design. The hierarchical Bayes (HB) model underlying
this approach allows us to estimate individual-level part-worth utility profiles from choice data that we
collected through web-based experiments with 2,017 consumers in Germany. Based on the respective
results, we then identify the most important product attributes from the customers’ perspective, es-
timate WTP figures for incremental contract adjustments as well as complete term life policies, assess
demand effects in a realistic competitive setting, and construct price-revenue as well as price-profit curves.
This manuscript is organized as follows. Section 2 begins with a brief review of CBC analysis and
RUT. We then discuss the selection of product attributes and levels, describe the sample composition,
outline the design of the discrete-choice experiments, explain the estimation routine for the part-worth
utilities, and define key concepts such as relative attribute importances, WTP measures, and market
2
Working Papers on Risk Management and Insurance, No. 145 – September 2014
simulations. Moreover, an extensive presentation of our empirical results can be found in Section 3.
Finally, in Section 4, we summarize our main findings and conclude the paper.
2 Data and Methodology
2.1 Choice-Based Conjoint Analysis
Extant research in the insurance literature favored direct stated preference approaches such as the contin-
gent valuation framework, in which customers are asked to explicitly specify their WTP via an open-ended
question format (see Abrams, 1964; Mitchell and Carson, 1989). In the context of infrequently-purchased,
durable, and rather abstract product categories that are associated with a more elaborate decision pro-
cess, however, this method is known to generate inaccurate WTP estimates (see, e.g., Backhaus et al.,
2005; Voelckner, 2006; Miller et al., 2011). Consequently, it is not suitable for insurance policies. Typical
indirect stated preference methods come from the family of conjoint analyses, that found its way into
the marketing literature about four decades ago (see Green and Rao, 1971; Johnson, 1974) and has since
received considerable attention in academia and practice.2 In particular, it has been regularly employed
in WTP studies (see Breidert et al., 2006). Among the different conjoint preference elicitation tasks,
CBC designs, in which consumers are required to select complete product profiles over sets of alterna-
tives, are recommended for price-related research (see, e.g., Orme, 2009). This is due to the fact that,
in contrast to ratings or rankings, choice tasks are cognitively less challenging, especially when the com-
plexity of the marketplace is high. Apart from that, they more closely mirror the real purchase situation,
in which the consumer is also confronted with a range of products (see, e.g., Huber, 1997).3 Since each
alternative shown in a given choice set is associated with distinct advantages and drawbacks, individuals
are instigated to trade off product attributes against each other. Hence, through their selection, they
convey preference information that can be employed for the estimation of part-worth utility profiles. In
contrast to fast-moving consumer goods (FMCG) such as chocolate bars or soft drinks, however, the
prices of life insurance products are directly related to individual risk factors. Thus, traditional CBC
analysis based on uniform prices is unsuitable for such products. In order to overcome this issue, we incor-
porate these characteristics into our experiment and assign the respondents to ten different CBC analyses.
A frequently discussed limitation is the artificial nature of the choice tasks, which may give rise to hy-
pothetical bias (see Cummings et al., 1995; Harrison and Rutstrom, 2008). To deal with this issue, some
authors have proposed incentive-aligned CBC analyses, relying on the well-known Becker et al. (1964)
mechanism that obliges participants to actually purchase the product under consideration, if their inferred
WTP is higher than a randomly drawn purchase price (see Ding et al., 2005; Ding, 2007; Dong et al.,
2For an overview of common applications in market research refer to Green et al. (2001) or Gustafsson et al. (2003). Usageregarding insurance products is very limited to date, with a few exceptions relating to health insurance (Chakraborty et al.,1994; Kerssens and Groenewegen, 2005; Sricharoen and Buchenrieder, 2008; Van den Berg et al., 2008), livestock insurance(Buchenrieder and Fischer, 2009), crop insurance (Sherrick et al., 2003; Heenkenda, 2011), and value-added services in theinsurance industry (Von Watzdorf and Skorna, 2010).
3As the WTP is a context-sensitive concept, the suitability of measurement methods critically hinges on their ability toemulate the actual evaluation process for the product under consideration.
3
Working Papers on Risk Management and Insurance, No. 145 – September 2014
2010). Yet, such purchase obligations are virtually infeasible for term life insurance contracts. Moreover,
this issue should be negligible in the context of our study because even in the presence of hypothetical
bias, the revealed demand effects commonly still lead to correct pricing decisions (see Miller et al., 2011).
Thus, we refrained from adding an incentive alignment component to our CBC design.
2.2 Theoretical Foundations
CBC analysis is theoretically underpinned by RUT (see Thurstone, 1927; Von Neumann and Morgenstern,
1944). Let C denote the set of all relevant alternatives, yi a discrete-choice variable for individual i, and
M the total number of alternatives shown in a given choice task ci ⊂ C. Each individual i associates
alternative a with a latent utility Uia. Under the assumption that all individuals are utility maximizers,
alternative a is chosen (i.e., yi = a), if and only if its utility exceeds that of all other available alternatives:
Uia = max(Ui1, Ui2, ..., UiM ). To account for the probabilistic nature of choice, RUT describes utilities
by means of a deterministic component Via and a stochastic component ǫia, which captures unobserved
aspects as well as measurement error (see, e.g., Train, 2009):
Uia = Via + ǫia. (1)
The condition under which a is selected can then be expressed as follows:
Uia > Uim
Via + ǫia > Vim + ǫim
ǫia − ǫim > Vim − Via ∀ m 6= a. (2)
Therefore, the probability of individual i choosing alternative a equals
Pr(yi = a) = Pr(Uia > Uim) = Pr(ǫia − ǫim > Vim − Via) = 1 − Pr(ǫia − ǫim ≤ Vim − Via). (3)
By assuming that the ǫ are independent and adhere to a Gumbel (type-I extreme value) distribution, it
is possible to derive the Lucean choice model (see, e.g., McFadden, 1974),
Pr(yi = a) =exp(Via)
∑|C|m=1
exp(Vim), (4)
which is characterized by the independence from irrelevant alternatives (IIA) property.4 We may now
condition on the choice task ci and explicitly specify Via and the Vim in terms of product attributes to
derive the multinomial logit (MNL) model that lies at the heart of the CBC approach:
Pr(yi = a|ci) =exp(xaβi)
∑M
m=1exp(xmβi)
. (5)
4IIA implies that “the odds of choosing alternative a in relation to alternative b must be constant, regardless of what otheralternatives are present” (Louviere and Woodworth, 1983).
4
Working Papers on Risk Management and Insurance, No. 145 – September 2014
Here, the x are row vectors that include the Q predictors for the characteristics (attribute levels) of the
alternatives that appear in choice task ci and βi = (βi1, ..., βiQ)′ represents the column vector of unknown
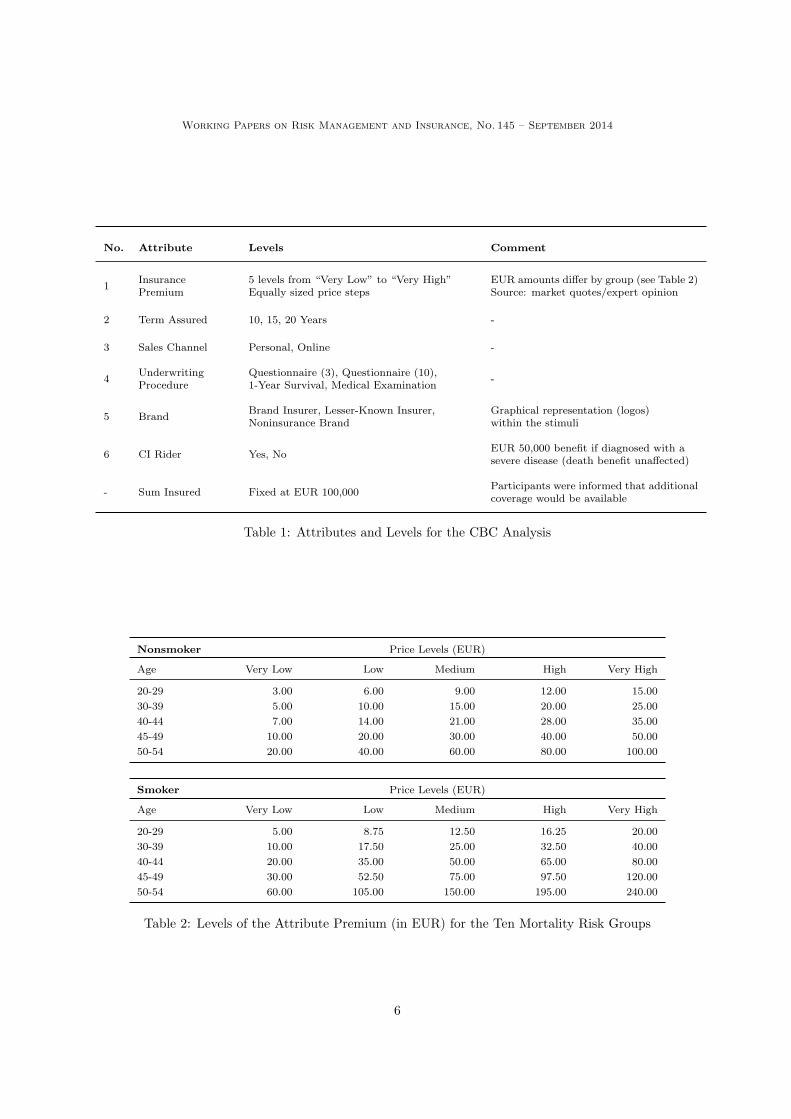
There is no generally accepted approach for the determination of appropriate product attributes and
levels to be used in a CBC research design. We decided to conduct focus group discussions with industry
professionals from Swiss Re, based on which we adopted the six attributes (i) insurance premium, (ii) term
assured, (iii) sales channel, (iv) underwriting procedure, (v) brand, and (vi) critical illness (CI) rider. The
sums insured for the policies were held fixed at EUR 100,000. When specifying the corresponding levels,
we adhered to the guidelines suggested by Orme (2002), particularly concise labeling, independence, and
mutual exclusivity. An overview of all attributes and levels can be found in Table 1.
Selecting levels for the monthly insurance premium was a particularly challenging task. First of all,
we aimed to avoid distortions due to the range and number-of-levels effects (see Verlegh et al., 2002).
Thus, as suggested in the extant literature, we determined a realistic range bounded by the minimum
and maximum price of comparable policies offered in Germany (see, e.g., Miller et al., 2011). This was
achieved by interviewing market experts and evaluating quotes for a large number of products from the
online comparison platform www.check24.de. Apart from that, term life insurance differs from common
consumer goods in that there is a direct link between the individual’s age and physical condition on the
one hand, and the product’s costs on the other hand. More specifically, fair premiums for old policyholders
with impaired health are substantially higher than for young and fit ones. Accordingly, we needed to
ensure that each individual is confronted with a price range that matches his or her mortality risk. For
this purpose, we allocated the survey participants to ten different groups that were characterized by
an age bracket and a smoking status. Throughout the choice experiments, each of those groups saw
product profiles based on the corresponding price levels (“very low” to “very high”) as shown in Table 2.
Moreover, we offered policies with 10, 15, or 20 year terms that could be purchased online or face-to-
face from a salesperson. With regard to the underwriting procedure, we allowed for questionnaires with
three and ten questions, an innovative twelve-month waiting period until the coverage becomes effective,
as well as the traditional full-fledged medical examination. The brand of the contract provider was
represented by three major categories: large insurers with a well-known brand (Allianz, Axa, Debeka,
Hannoversche, R+V), lesser-known insurers with a rather insignificant footprint in the German market
(Cardif, Heidelberger Leben, Itzehoer, Mecklenburgische, MyLife), and companies with a strong brand
name that is not associated with insurance (Aldi, Amazon, Apple, IKEA, Volkswagen). Finally, the CI
rider is an innovative feature that entitles the policyholder (not the beneficiary) to a lump sum payment
if he is diagnosed with a severe disease (e.g., cancer) as defined in the contract’s terms and conditions.
5Note that, in contrast to conditional logit models, MNL predictors are usually respondent characteristics rather thanproduct attributes, whereas the coefficients vary across alternatives instead of individuals (see, e.g., McFadden, 1986).
5
Working Papers on Risk Management and Insurance, No. 145 – September 2014
No. Attribute Levels Comment
1InsurancePremium
5 levels from “Very Low” to “Very High”Equally sized price steps
EUR amounts differ by group (see Table 2)Source: market quotes/expert opinion
2 Term Assured 10, 15, 20 Years -
3 Sales Channel Personal, Online -
4UnderwritingProcedure
Questionnaire (3), Questionnaire (10),1-Year Survival, Medical Examination
Graphical representation (logos)within the stimuli
6 CI Rider Yes, NoEUR 50,000 benefit if diagnosed with asevere disease (death benefit unaffected)
- Sum Insured Fixed at EUR 100,000Participants were informed that additionalcoverage would be available
Table 1: Attributes and Levels for the CBC Analysis
Nonsmoker Price Levels (EUR)
Age Very Low Low Medium High Very High
20-29 3.00 6.00 9.00 12.00 15.00
30-39 5.00 10.00 15.00 20.00 25.00
40-44 7.00 14.00 21.00 28.00 35.00
45-49 10.00 20.00 30.00 40.00 50.00
50-54 20.00 40.00 60.00 80.00 100.00
Smoker Price Levels (EUR)
Age Very Low Low Medium High Very High
20-29 5.00 8.75 12.50 16.25 20.00
30-39 10.00 17.50 25.00 32.50 40.00
40-44 20.00 35.00 50.00 65.00 80.00
45-49 30.00 52.50 75.00 97.50 120.00
50-54 60.00 105.00 150.00 195.00 240.00
Table 2: Levels of the Attribute Premium (in EUR) for the Ten Mortality Risk Groups
6
Working Papers on Risk Management and Insurance, No. 145 – September 2014
2.4 Sample Selection and Discrete-Choice Experiments
We collected data for a sample of 2,017 German consumers who identified themselves as insurance decision
makers.6 All participants were between 20 and 54 years old and population-representative with regard to
domicile state and gender. In addition, half of them actually own a term life insurance contract. As dis-
cussed in the previous section, respondents were allocated to ten groups according to their stated age and
smoking habits. To enhance estimation quality, a roughly equal distribution across groups was targeted
by means of a ten percent quota and met up to a maximum error margin of 0.8 percentage points. We
established contact with the individuals through the consumer panel of a well-respected market research
firm, seeking to maximize response rates and minimize the amount of missing data. Participation in the
study was incentivized by bonus points that can be spent for consumption purposes.
The online survey relied on the latest CBC system of Sawtooth Software, Inc. and underwent a
technical pretest before the two-week field phase. At the outset, we asked for completion of categorization
questions with regard to age, gender, smoking habits, and domicile state. This introductory part was
followed by the choice experiments. After a short explanation of the hypothetical buying situation, the
mechanics of term life insurance, as well as the product attributes, participants were confronted with
twelve choice tasks, each of which comprised two complete policy profiles and the possibility to opt out
of the purchase (none option). While the attribute order within each conjoint stimulus remained fixed,
the pairwise comparisons were generated according to the balanced overlap method. The latter is a
randomized experimental design that accounts for the principles of minimal overlap, level balance, as
well as orthogonality and thus curtails psychological context and order effects (see Sawtooth Software,
2013).7 As recommended by Orme (2002), we refrained from prohibiting any attribute level combinations
to avoid estimation problems and confounded utilities. At the end of the survey, we included a set of
additional questions to capture basic socioeconomic information about the respondents.
2.5 Estimation of Individual-Level Part-Worth Utility Profiles
We estimated part-worth utilities from the observed choices by means of the HB routine implemented in
Sawtooth CBC/HB 5.0 (see Sawtooth Software, 2009).8 The corresponding set-up is hierarchical in the
sense that it comprises two levels. On the individual or lower level, the choice data is explained by the
MNL model in Equation (5). In addition, there is an aggregate or upper level comprising the prior for
the individual-level part-worth utilities. More specifically, the βi in Equation (5) are assumed to come
from a multivariate normal distribution with mean vector α and covariance matrix D that describes the
heterogeneity across respondents. For computational ease, the HB approach relies on another multivari-
6In the context of this study, “insurance decision makers” are defined as persons, who either purchase insurance policiesthemselves or participate in the decision to do so. This criterion was applied to ensure that respondents understandthe product type under consideration and can therefore make sufficiently informed decisions between the conjoint stimuli.Robustness of the results was confirmed with a purely population-representative sample comprising another 938 individuals.
7The reader is referred to Huber and Zwerina (1996) for a more detailed description of these conjoint design principles.8The suitability of HB models for conjoint studies has been documented in several pieces of high-class research (see, e.g.,Arora et al., 1995; Lenk et al., 1996; Arora et al., 1998; Huber, 1998; Arora and Huber, 2001; Train, 2009).
7
Working Papers on Risk Management and Insurance, No. 145 – September 2014
ate normal and the inverse Wishart distribution as conjugate hyperpriors for α and D.
The software runs a robust iterative process with initial values of zero to estimate the unknown pa-
rameters. The Metropolis-Hastings Algorithm is employed to draw the βi, while α and D are determined
by means of Gibbs sampling.9 An important property of the HB model is the incorporation of shrinkage,
implying that the individual-level estimates become more efficient, because they inform each other via
the upper level. We ran 20,000 burn-in iterations of the Markov chain and 50,000 post-convergence itera-
tions for the subsequent sampling of the posterior distributions. After the Bayesian updating of the prior
distribution with our choice data was complete, we imposed monotonicity constraints on the posterior
part-worth utilities for the attribute premium using the tying after estimation procedure.10 The reason
is that monotonically falling price-utility curves are a necessary condition for the computation of the
maximum WTP measure that will be introduced in the next section.
2.6 Relative Importance, Willingness to Pay, and Shares of Preference
The MNL model in Equation (5) is unidentified. Thus, to find a unique set of estimates, one needs to
impose some form of restriction on the parameters. CBC analysis commonly relies on a normalizing con-
straint for identification such that the sum of part-worth utilities equals zero. This is achieved through
effects coding of the product attributes.11 As a corollary, conjoint utilities are interval scaled, i.e., they
do not exhibit a meaningful origin (see, e.g., Orme, 2010). For this reason, we may add any arbitrary
constant to the part-worth profile of each product attribute without affecting the predicted choice proba-
bilities. On the other hand, utilities are not comparable across attributes and ratios must not be formed.12
Since a direct interpretation of the part-worth utility profiles is complicated by their interval-scale
character, they will be employed to derive metrics with a more intuitive economic meaning. We begin
with relative importance, which measures the impact of an attribute on the overall utility of a product in
percentage terms (see Orme, 2010). Formally, the relative importance RIik of attribute k ∈ {1, 2, 3, 4, 5, 6}
(see Table 1) with levels l ∈ {1, ..., Lk} as perceived by individual i can be expressed as follows:
RIik =max
l(βikl) − min
l(βikl)
∑6
k=1
(
maxl
(βikl) − minl
(βikl)
) . (6)
The RIik follow a ratio scale, add up to 100 percent for each respondent i, and are readily compre-
hensible: the larger the utility range of an attribute, the higher its potential to increase or decrease an
individual’s choice probability for a product. Therefore, based on the RIik, one may identify key product
9Technical details on these Markov Chain Monte Carlo (MCMC) methods can be found in Chib and Greenberg (1995).10After an unconstrained HB estimation, the utility values of each offending pair are repeatedly tied until all violationshave been eliminated. This method performs well in terms of hit rates and share predictions (see Johnson, 2000).
11More specifically, the last level of every attribute is estimated as the negative of the sum of the other levels. Althoughdummy coding would also introduce an identification constraint by selecting one attribute level as the baseline categoryand setting it to zero, effects coding has emerged as the standard in the early 1990s (see Sawtooth Software, 2009).
12Furthermore, estimates from samples with different variances are not directly comparable (see Swait and Louviere, 1993).
8
Working Papers on Risk Management and Insurance, No. 145 – September 2014
features for a given market.13
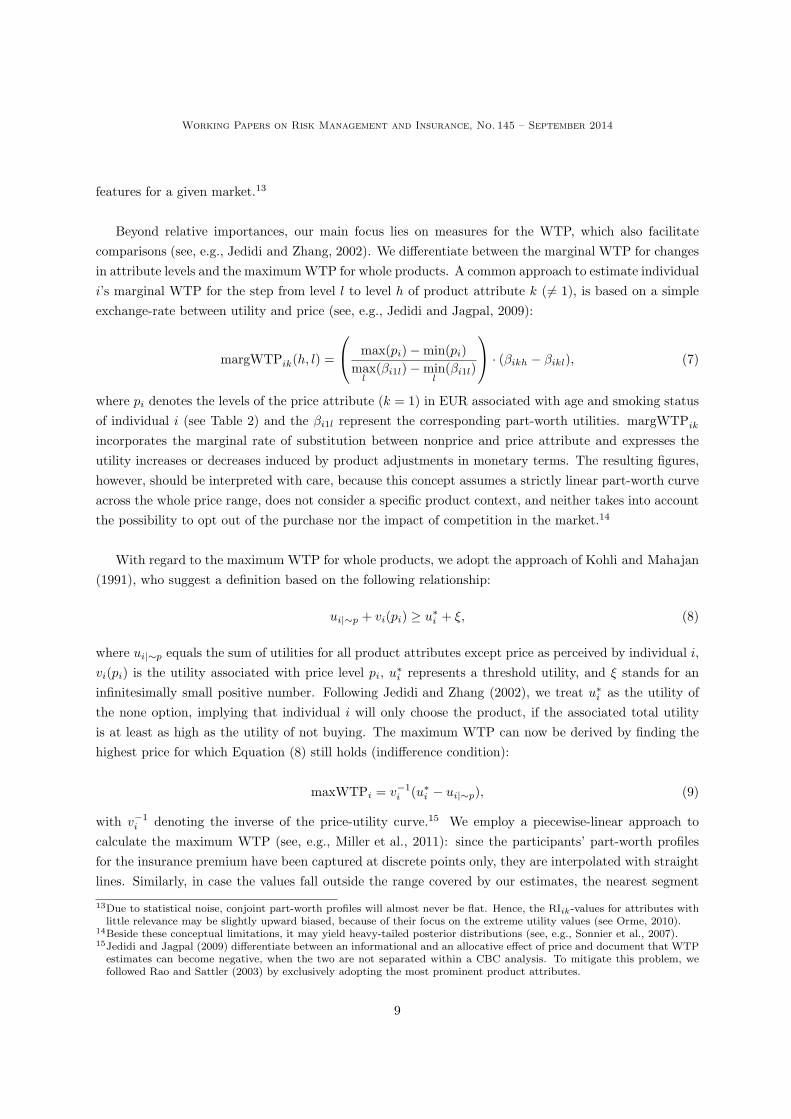
Beyond relative importances, our main focus lies on measures for the WTP, which also facilitate
comparisons (see, e.g., Jedidi and Zhang, 2002). We differentiate between the marginal WTP for changes
in attribute levels and the maximum WTP for whole products. A common approach to estimate individual
i’s marginal WTP for the step from level l to level h of product attribute k ( 6= 1), is based on a simple
exchange-rate between utility and price (see, e.g., Jedidi and Jagpal, 2009):
margWTPik(h, l) =
max(pi) − min(pi)
maxl
(βi1l) − minl
(βi1l)
· (βikh − βikl), (7)
where pi denotes the levels of the price attribute (k = 1) in EUR associated with age and smoking status
of individual i (see Table 2) and the βi1l represent the corresponding part-worth utilities. margWTPik
incorporates the marginal rate of substitution between nonprice and price attribute and expresses the
utility increases or decreases induced by product adjustments in monetary terms. The resulting figures,
however, should be interpreted with care, because this concept assumes a strictly linear part-worth curve
across the whole price range, does not consider a specific product context, and neither takes into account
the possibility to opt out of the purchase nor the impact of competition in the market.14
With regard to the maximum WTP for whole products, we adopt the approach of Kohli and Mahajan
(1991), who suggest a definition based on the following relationship:
ui|∼p + vi(pi) ≥ u∗i + ξ, (8)
where ui|∼p equals the sum of utilities for all product attributes except price as perceived by individual i,
vi(pi) is the utility associated with price level pi, u∗i represents a threshold utility, and ξ stands for an
infinitesimally small positive number. Following Jedidi and Zhang (2002), we treat u∗i as the utility of
the none option, implying that individual i will only choose the product, if the associated total utility
is at least as high as the utility of not buying. The maximum WTP can now be derived by finding the
highest price for which Equation (8) still holds (indifference condition):
maxWTPi = v−1
i (u∗i − ui|∼p), (9)
with v−1
i denoting the inverse of the price-utility curve.15 We employ a piecewise-linear approach to
calculate the maximum WTP (see, e.g., Miller et al., 2011): since the participants’ part-worth profiles
for the insurance premium have been captured at discrete points only, they are interpolated with straight
lines. Similarly, in case the values fall outside the range covered by our estimates, the nearest segment
13Due to statistical noise, conjoint part-worth profiles will almost never be flat. Hence, the RIik-values for attributes withlittle relevance may be slightly upward biased, because of their focus on the extreme utility values (see Orme, 2010).
14Beside these conceptual limitations, it may yield heavy-tailed posterior distributions (see, e.g., Sonnier et al., 2007).15Jedidi and Jagpal (2009) differentiate between an informational and an allocative effect of price and document that WTPestimates can become negative, when the two are not separated within a CBC analysis. To mitigate this problem, wefollowed Rao and Sattler (2003) by exclusively adopting the most prominent product attributes.
9
Working Papers on Risk Management and Insurance, No. 145 – September 2014
of the curve is extrapolated.
We will complete the analysis with a comprehensive simulation of consumer behavior in a competitive
environment consisting of four concrete term life products. Demand in this hypothetical market will be
predicted by the first choice method (maximum utility rule), which assumes that each individual buys
the policy with the highest overall utility (see Orme, 2010). Thus, we are able to convert our individual-
level part-worth profiles into shares of preference (shares of choice). Shares of preference are an even
more intuitive measure than classical WTP and, given suitable conditions, may track actual long-term
equilibrium market shares quite well.16 By modifying contract features and varying prices, it is then
possible to assess product switching as well as market expansion effects. Finally, we add a set of cost
assumptions and derive price-profit curves for the providers of the four term life insurance policies.
3 Empirical Results
3.1 Part-Worth Utilities
From the participants of the discrete-choice experiments, we removed those with answer times below
one minute and WTP estimates above EUR 1,000. As a result, we were left with a sample of 1,995
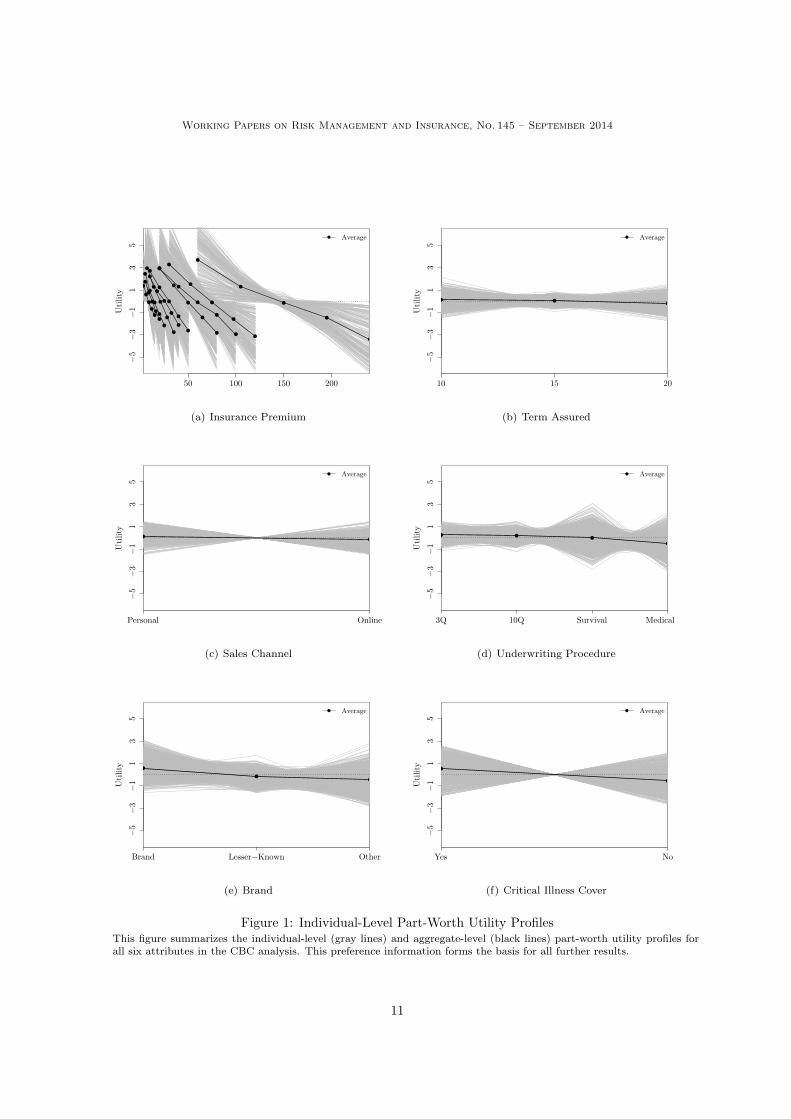
consumers.17 Figure 1 shows their individual-level part-worth profiles for the six attributes in our CBC
analysis as gray lines. The horizontal axis and the vertical axis represent the attribute levels and the
corresponding utility values, respectively. This preference information forms the basis for all further re-
sults. To facilitate the interpretation, we have highlighted the aggregate-level part-worth profiles (average
participant) by bold black lines. Across all 1,995 individuals, we obtain a mean root likelihood (RLH) of
0.759, which is approximately 2.3 times better than chance.18
In Figure 1(a), we have summarized the price-utility curves for all ten mortality risk groups. The 20
to 29 year old nonsmokers, which were confronted with the lowest premium levels in the discrete-choice
experiments, are located on the very left, while the 50 to 54 year old smokers can be found at the right
end of the graph. At first glance, we notice that the black lines in this subfigure are substantially steeper
than those for the remaining product attributes, indicating that, in the aggregate sample, the monthly
premium contributes the largest amount of utility to a term life policy. Furthermore, consider the part-
worth profiles in Figure 1(b). Although some of the individuals clearly prefer shorter over longer terms
assured and vice versa, the flat shape of the black line indicates that the average respondent is virtually
indifferent with regard to this attribute. The same is true for the sales channel, as shown in Figure 1(c),
which also exhibits almost identically-distributed preferences across its two levels. Figures 1(d), (e),
and (f), in contrast, reveal a clear tendency: the average consumer derives the highest utilities from
16Yet, as conjoint part-worth profiles do not incorporate many important real-world determinants such as advertising,promotions, and sales force effects, one should be careful not to confound these two concepts (see Orme, 2010).
17The mean response time for the discrete-choice experiments among the remaining participants amounts to 8.27 minutes.18The root likelihood measures the goodness of fit for the individual-level part-worth profiles (see, e.g., Sawtooth Software,2009, 2013). Given M alternatives per choice task, the minimum value of the RLH is 1/M , which resembles a so-calledchance model with equal probabilities for each m ⊂ M , while the best possible value is 1.0.
10
Working Papers on Risk Management and Insurance, No. 145 – September 2014
50 100 150 200
Utility
−5
−3
−1
13
5
Average
(a) Insurance PremiumU
tility
10 15 20
−5
−3
−1
13
5
Average
(b) Term Assured
Utility
Personal Online
−5
−3
−1
13
5
Average
(c) Sales Channel
Utility
3Q 10Q Survival Medical
−5
−3
−1
13
5
Average
(d) Underwriting Procedure
Utility
Brand Lesser−Known Other
−5
−3
−1
13
5
Average
(e) Brand
Utility
Yes No
−5
−3
−1
13
5
Average
(f) Critical Illness Cover
Figure 1: Individual-Level Part-Worth Utility ProfilesThis figure summarizes the individual-level (gray lines) and aggregate-level (black lines) part-worth utility profiles forall six attributes in the CBC analysis. This preference information forms the basis for all further results.
11
Working Papers on Risk Management and Insurance, No. 145 – September 2014
policies that are underwritten based on a brief (three-item) questionnaire, offered by well-known insurance
companies, and provided with a CI rider. The negative slope of the respective part-worth profiles implies
that the other levels of the attributes underwriting procedure, brand, and critical illness cover are less
desired. However, it should be noted that there is a relatively large variation around the aggregate-level
utility values of the one-year survival option, the full medical examination, the noninsurance brand, and
the critical illness cover. Hence, in these cases, consumer preferences seem to be quite heterogeneous.
3.2 Relative Attribute Importances
Based on the individual-level part-worth profiles, it is possible to compute the relative importance of each
product attribute for the 1,995 consumers in our sample. Figure 2 shows the corresponding posterior
distributions together with their means as well as the upper and lower bounds of the 95 percent highest
density interval (HDI). As can be seen in subfigure (a), the insurance premium exhibits an aggregate-
level relative importance of approximately 41.38 percent and is therefore the key feature of a term life
policy. To put it differently, price increases or reductions trigger the largest utility changes for the average
respondent. Due to the rather unemotional and standardized nature of the product, this is not surprising.
Interestingly, however, the associated distribution across individuals appears relatively symmetric and
entails a wide HDI, ranging from a relative importance of merely 3.09 up to 75.27 percent. Thus, there
are also numerous respondents with low price sensitivities. Furthermore, turning to subfigures (b) and
(c), we notice that the term assured and the sales channel exhibit aggregate-level importances of 7.86
and 6.66 percent, respectively. Apart from being the least relevant attributes for the average consumer,
they also involve the lowest preference heterogeneity: 95 percent of the probability mass lies in the
comparatively narrow interval between a relative importance of approximately 0 and 20 percent. Finally,
in subfigures (d), (e), and (f), we find notable aggregate-level importances for the brand (15.89 percent),
the underwriting procedure (14.78 percent), and the CI cover (13.44 percent). Therefore, these three
nonprice attributes are potential levers for product design that might help insurers to avoid pure price
competition. Similar to the monthly premium, however, the wider HDIs indicate a nonnegligible degree
of disagreement among the respondents.
3.3 Marginal Willingness to Pay for Changes in Attribute Levels
The marginal WTP expresses utility increases or decreases associated with changes in attribute levels in
monetary terms. We examine it by means of incremental moves from right to left along the x-axis of the
part-worth profiles in Figure 1, i.e., we focus on one-step adjustments that are perceived as improvements
by the average consumer and thus increase his WTP. Modifications in the opposite direction would lead
to an equivalent WTP reduction. To facilitate the interpretation, we have sorted the posterior distribu-
tions for the marginal WTPs in descending order of their means. Accordingly, Figure 3 (Figure 4) shows
the results for those four attribute level changes that lead to the highest (lowest) aggregate-level WTP
additions. The only distribution that we do not report is the one for a shortening of the underwriting
questionnaire from ten to three items. Its mean marginal WTP of merely EUR 0.34 is negligible.
12
Working Papers on Risk Management and Insurance, No. 145 – September 2014
Relative Importance
0.0 0.2 0.4 0.6 0.8 1.0
Mean = 0.4138
95% HDI0.0309 0.7527
(a) Insurance Premium
Relative Importance
0.0 0.2 0.4 0.6 0.8 1.0
Mean = 0.0786
95% HDI0.0042 0.1942
(b) Term Assured
Relative Importance
0.0 0.2 0.4 0.6 0.8 1.0
Mean = 0.0666
95% HDI0.0000 0.2026
(c) Sales Channel
Relative Importance
0.0 0.2 0.4 0.6 0.8 1.0
Mean = 0.1478
95% HDI0.0126 0.3165
(d) Underwriting Procedure
Relative Importance
0.0 0.2 0.4 0.6 0.8 1.0
Mean = 0.1589
95% HDI0.0101 0.4336
(e) Brand
Relative Importance
0.0 0.2 0.4 0.6 0.8 1.0
Mean = 0.1344
95% HDI2e−04 0.3519
(f) Critical Illness Cover
Figure 2: Relative Attribute ImportancesThis figure shows the distributions of the individual-level relative importances for all six attributes across the 1,995individuals in the sample, including means (aggregate-level values) and 95 percent highest density intervals.
13
Working Papers on Risk Management and Insurance, No. 145 – September 2014
Marginal WTP
−100 −50 0 50 100
Mean = 19.51
95% HDI−27.26 99.69
20.15% < 0 0 < 79.85%
(a) From Lesser-Known Insurer to Brand Insurer
Marginal WTP
−100 −50 0 50 100
Mean = 11.41
95% HDI−86.54 105.17
20.50% < 0 0 < 79.50%
(b) From no CI Cover to CI Cover
Marginal WTP
−100 −50 0 50 100
Mean = 9.95
95% HDI−27.95 81.73
38.70% < 0 0 < 61.30%
(c) From Online to Personal
Marginal WTP
−100 −50 0 50 100
Mean = 7.02
95% HDI−56.70 92.86
41.55% < 0 0 < 58.45%
(d) From Noninsurance Brand to Lesser-Known In-surer
Figure 3: Marginal Willingness to Pay for Changes in Attribute Levels IThis figure shows the distributions of the individual-level marginal willingness to pay for different changes in attributelevels with means and 95 percent highest density intervals.
In Figure 3(a) we see that, on average, people are prepared to pay a markup of EUR 19.51 if the
term life policy is offered by a well-known instead of a lesser-known insurance company. Although there
is a considerable variation on the individual level, about 80 percent of the consumers exhibit a positive
marginal WTP. The same is true for the addition of a CI cover as shown in Figure 3(b), which, however,
is associated with a lower mean of EUR 11.41 and a wider 95 percent HDI, particularly in the left tail.
The latter implies that some respondents are prepared to pay much less for a contract if this feature is
included. Moreover, Figures 3(c) and (d) display the marginal WTP distributions for the switch from
online to personal sale and from a noninsurance brand to a lesser-known insurance company. The re-
spective aggregate-level values of EUR 9.95 and EUR 7.02 as well as the fact that around 60 percent of
the probability mass lies in the positive area indicate that a majority of consumers considers these to be
valuable attribute level changes.
14
Working Papers on Risk Management and Insurance, No. 145 – September 2014
Marginal WTP
−100 −50 0 50 100
Mean = 5.26
95% HDI−49.19 77.08
41.55% < 0 0 < 58.45%
(a) From One-Year Survival to 10 Questions
Marginal WTP
−100 −50 0 50 100
Mean = 5.17
95% HDI−70.01 94.30
35.09% < 0 0 < 64.91%
(b) From Medical Exam. to One-Year Survival
Marginal WTP
−100 −50 0 50 100
Mean = 4.59
95% HDI−24.65 39.12
31.93% < 0 0 < 68.07%
(c) From 20 to 15 Years
Marginal WTP
−100 −50 0 50 100
Mean = 2.96
95% HDI−31.56 39.55
43.96% < 0 0 < 56.04%
(d) From 15 to 10 Years
Figure 4: Marginal Willingness to Pay for Changes in Attribute Levels IIThis figure shows the distributions of the individual-level marginal willingness to pay for different changes in attributelevels with means and 95 percent highest density intervals.
Next, we examine an adjustment of the underwriting procedure from the one-year survival condition
to a ten-item questionnaire. The respective results can be found in Figure 4(a). We estimate a mean
marginal WTP of EUR 5.26 and 58.45 percent of the individuals are willing to accept a price increase for
this attribute modification. Similarly, from Figure 4(b) we learn that the shift from a medical examination
to the one-year survival condition is worth EUR 5.17 to the average consumer. The corresponding fraction
of respondents with a positive marginal WTP amounts to 64.91 percent. Finally, Figures 4(c) and (d)
contain the distributions for a shortening of the term assured from 20 to 15 and from 15 to 10 years. For
these changes, we obtain the smallest aggregate-level marginal WTPs of EUR 4.59 and EUR 2.96 but also
the narrowest HDIs. In the first case, almost 70 percent of the individual-level results are greater than
zero. Despite the comparatively smaller distribution means, this is an important insight for insurance
companies, since policies with shorter terms assured can be offered at a lower cost. At the same time,
however, most customers seem to be willing to pay higher premiums for them.
15
Working Papers on Risk Management and Insurance, No. 145 – September 2014
Overall, the heterogeneity of preferences that we documented based on the part-worth profiles and
relative importances feeds through into the marginal WTPs. Taking into account that the latter are
additive across the full range of possible adjustments, it becomes clear that the three attributes with
the highest aggregate-level marginal WTPs, namely brand (EUR 26.53), CI cover (EUR 11.41), and
underwriting procedure (EUR 10.77), are also those that were found to be most important for the average
consumer in the sample.
3.4 Maximum Willingness to Pay for Complete Products
The concept of maximum WTP is linked to concrete products. More specifically, as discussed in Sec-
tion 2, we are searching for the single price, which makes the consumer indifferent between buying and not
buying the policy under consideration. Hence, we worked together with industry experts from the global
reinsurer Swiss Re in order to define a set of four generic term life insurance contracts that represents
a realistic snapshot of both current and potential future offerings in the German market. An overview
of these products, which will form the basis for the remaining analyses, is provided in Table 3. All four
of them exhibit a term assured of 15 years and a death benefit of EUR 100,000. The “budget” product
has been designed as a cost-efficient alternative. It is sold online, underwritten based on a ten-item ques-
tionnaire, provided by a noninsurance company, and does not comprise a CI rider. Furthermore, we have
a “classic” product, mimicking the traditional type of term life insurance sold in Germany. This policy
can be purchased from a salesperson, involves a full medical examination, is offered by a well-known
insurance company, and lacks the CI option. The two remaining offerings will be called “innovative”
and “premium” product. Being sold online by a lesser-known insurance company with the one-year sur-
vival condition and the CI cover, the former emphasizes rather modern contract features. The latter, in
contrast, comprises that particular level of each attribute (apart from the term assured) from which the
average consumer derives the highest utility (see Figure 1). Accordingly, it is distributed face-to-face,
relies on a three-item questionnaire, originates from a well-known insurance company, and includes the
CI feature.
Figure 5 contains the distribution of the maximum WTP for each aforementioned product. We
observe a clear order in the aggregate-level results as well as the width of the 95 percent HDI. As
could be expected, the average respondent would pay the lowest monthly premium for the budget policy
(EUR 17.63), followed by the classic (EUR 21.26) and innovative products (EUR 24.80). Due to the
fact that it comprises the most desirable features, the premium term life contract exhibits the WTP
distribution with the highest mean (EUR 34.76). Similarly, its 95 percent HDI extends furthest into
the right tail (EUR 150.76), implying that, compared to the other products, there is a larger number
of consumers with very high WTP values. Moreover, we again document a considerable variation on
the individual level, which arises due to the heterogeneity of preferences documented above. Finally, all
four distributions show a dominant peak around zero which indicates that between 45 percent (premium
16
Working Papers on Risk Management and Insurance, No. 145 – September 2014
Budget Product
Term Assured 15 years
Sales Channel Online
Underwriting 10 questions
Brand Noninsurance brand
CI Cover No
Classic Product
Term Assured 15 years
Sales Channel Personal
Underwriting Medical examination
Brand Well-known insurer
CI Cover No
Innovative Product
Term Assured 15 years
Sales Channel Online
Underwriting 1-year survival
Brand Lesser-known insurer
CI Cover Yes
Premium Product
Term Assured 15 years
Sales Channel Personal
Underwriting 3 questions
Brand Well-known insurer
CI Cover Yes
Table 3: Reference Term Life ProductsThis table summarizes the specifications (attribute levels) of the four generic term life products that form the basis forall remaining analyses. Each policy exhibits a sum assured of EUR 100,000.
product) and 65 percent (budget product) of the respondents do not have a noteworthy WTP at all.19
Although it seems to be surprising at first glance, there is a plausible explanation for this phenomenon.
Unlike typical consumer goods, term life insurance should only be considered if someone has an actual
need for coverage. In general, this will entail the existence of dependents that the policyholder wants to
protect from financial hardship in the case of his or her death.20 Hence, the purchase decision is likely to
be governed by a two-step process. Initially, consumers evaluate their personal situation and determine
whether a mortality risk transfer would be advisable. This phase might be influenced by additional
factors, such as risk aversion or a bequest motive. Thereafter, they determine the WTP and select from
the range of products that is available in the market.
3.5 Product Switching and Market Expansion Effects
Product Design
In this section, we allow for competition between the four reference products introduced above. Each type
of term life policy is assumed to be offered by a different company.21 Starting from the base case settings
in Table 3, we successively apply attribute level improvements and document the associated impact on
the shares of preference as well as the revenues of the insurance companies. Before we begin, however, it
is necessary to fix the prices at which the contracts are sold in our hypothetical market. In line with its
purpose, the budget product is assigned the premium level “very low”. The classic and the innovative
product, in contrast, will be offered at the “low” price. Finally, in order to purchase the premium product
19Note that for some respondents with extreme preference structures, we even estimated negative WTPs. Since those areno reasonable outcomes from an economic perspective, we assigned the affected individuals a WTP of zero.
20The perspective of receiving the lump sum from a potential CI coverage alone is unlikely to be a sufficient motivation.21Since consumer decisions will be simulated by means of the first choice method (see Section 2), the results of this analysisare readily transferable to situations in which multiple companies sell the same policy. In those cases, every competitorwould capture an equal fraction of the overall share of preference for the respective product.
17
Working Papers on Risk Management and Insurance, No. 145 – September 2014
Maximum WTP
0 50 100 150 200
Mean = 17.63
95% HDI0.00 89.23
65.00% < 5.00
(a) Budget Product
Maximum WTP
0 50 100 150 200
Mean = 21.26
95% HDI0.00 97.29
60.70% < 5.00
(b) Classic Product
Maximum WTP
0 50 100 150 200
Mean = 24.80
95% HDI0.00 116.71
56.00% < 5.00
(c) Innovative Product
Maximum WTP
0 50 100 150 200
Mean = 34.76
95% HDI0.00 150.76
45.60% < 5.00
(d) Premium Product
Figure 5: Maximum Willingness to Pay for the Reference ProductsThis figure contains the distributions of the individual-level maximum WTP for the budget, classic, innovative, andpremium term life products, including mean and 95 percent HDI. Due to the dominant spike around zero, the fractionof respondents that exhibit a WTP below EUR 5.00 is indicated.
with is highly desirable features, policyholders need to pay the “medium” price. Recall from Table 2 that,
depending on the mortality risk group of the consumer, the levels “very low” to “very high” represent
different EUR amounts. The results of this simulation analysis can be found in Table 4.
Panel A documents the number of buyers, shares of preference (in percent), and company revenues
(in EUR) for the base case scenario. The latter have been calculated by means of a breakdown of the
buyers into the ten price groups shown in Table 2. Consistent with our findings for the maximum WTP
in the previous section, the last column indicates that 1,155 or 57.89 percent of the respondents choose
not to buy term life insurance at all. Among those 840 consumers who actually enter the market, 317 are
attracted by the budget and 258 by the premium product. Consequently, the corresponding insurance
companies capture the largest shares of preference (15.89 and 12.93 percent) as well as the highest rev-
18
Working Papers on Risk Management and Insurance, No. 145 – September 2014
enues (EUR 6,084.94 and EUR 8,484.41).22 While being somewhat less popular than the aforementioned
alternatives, the innovative product still exhibits almost twice as many buyers as the classic product (175
vs. 90). The direct consequences are a higher share of preference (8.77 vs. 4.51 percent) as well as a
larger revenue volume (EUR 4,637.85 vs. EUR 2,097.26).
Furthermore, in Panel B, we report by how many percentage points the shares of preference change,
when the attribute level changes indicated in brackets are implemented. Examining the last column,
we notice that, owing to the improved designs, some of the individuals that previously decided not to
buy now favor one of the four policy types. Hence, all of the considered product improvements help to
expand the overall market size, although mostly by a rather small degree. The highest gains in share of
preference of 12.48 and 6.77 percentage points are associated with the addition of a CI cover to the budget
and the classic product.23 In the first case, most of the new customers switch over from the innovative
product, whereas in the second case, the premium product suffers the largest loss of buyers. Apart from
that, strengthening the brand value to become a well-known insurance company seems to be a viable
strategy for the providers of the budget and the innovative product. In doing so, they may increase their
shares of preference by 5.86 and 6.12 percentage points, respectively.24 All other modifications, such as a
three-item questionnaire instead of a medical examination for the classic product, have a minor impact.
Nevertheless, by combining several of these less effective attribute level changes, an insurance company
may still achieve a notable extension in its share of preference. Finally, when turning to Panel C, we
observe that the four dominant product design improvements identified above are also very attractive
in monetary terms. As an example consider the inclusion of a CI rider in the budget product, which
generates additional revenues of EUR 3,303.75, implying a growth rate of more than 50 percent.
Price Competition
Apart from product design, insurers may also decide to compete on price. To analyze the associated
changes in the shares of preference, we let the monthly premium for each policy vary between the levels
“very low” and “very high”, while holding those of the others constant at their base case value. The
results of this analysis can be found in Figures 6 and 7. On the left hand sides, we show the shares of
preference as shaded areas that stack to 100 percent. The products’ base case prices are indicated by
vertical dashed lines.25 In addition, the graphs on the right hand sides provide a more detailed view of
the underlying product switching and market expansion effects. Overall, three aspects stand out. First,
even the lowest monthly premium is almost always insufficient to raise the combined share of preference
above 50 percent. Hence, the negligible WTP of many consumers severely limits the potential to grow the
total market through price reductions. Second, we observe different demand sensitivities. By lowering
22Despite its fewer buyers, the revenues for the premium product exceed those for the budget product, because the formeris sold at a higher price.
23Although the CI feature clearly has an impact on the product costs, these findings reveal that insurers could add asubstantial markup to the monthly premium without suffering a loss of market share.
24Obviously it is impossible to change the brand value of a company over night. However, our results provide clear evidencethat it may be worth while for life insurers to cultivate a certain degree of popularity among consumers.
25This line is not visible for the budget product because its very low base case price lies at the left end of the graph.
19
Working Papers on Risk Management and Insurance, No. 145 – September 2014
Panel A: Base Case Budget (B) Classic (C) Innovative (I) Premium (P) None
Number of Buyers 317 90 175 258 1,155
Share of Preference (in %) 15.89 4.51 8.77 12.93 57.89
Revenues (in EUR) 6,084.94 2,097.26 4,637.85 8,484.41 –
Panel B: Changes in Shares of Preference
(B)
[10y] +1.00 0.00 –0.25 –0.10 –0.65
[3Q] +1.55 +0.20 –0.80 –0.35 –0.60
[CI] +12.48 +0.15 –5.06 –2.61 –4.96
[Personal] +0.45 –0.30 +0.35 –0.20 –0.30
[Well-known] +5.86 –1.50 –0.90 –1.85 –1.60
(C)
[10y] +0.05 +0.50 –0.15 +0.05 –0.45
[1year] +0.05 +0.95 –0.75 +0.10 –0.35
[10Q] –0.15 +0.45 –0.05 –0.20 –0.05
[3Q] –0.20 +1.40 –0.15 –1.05 0.00
[CI] –0.35 +6.77 –1.15 –4.11 –1.15
(I)
[10y] –0.40 –0.05 +1.30 –0.10 –0.75
[3Q] +0.20 0.00 +0.90 –0.65 –0.45
[Personal] +0.20 –0.10 +1.10 –0.75 –0.45
[Well-known] –1.45 –0.40 +6.12 –2.56 –1.70
(P) [10y] 0.00 +0.70 –0.70 +0.55 –0.55
Panel C: Additional Revenues
(B)
[10y] +245.75 – – – –
[3Q] +464.00 – – – –
[CI] +3,303.75 – – – –
[Personal] +239.75 – – – –
[Well-known] +1,100.50 – – – –
(C)
[10y] – +159.25 – – –
[1year] – +273.25 – – –
[10Q] – +58.75 – – –
[3Q] – +343.25 – – –
[CI] – +1,350.50 – – –
(I)
[10y] – – +233.25 – –
[3Q] – – +106.75 – –
[Personal] – – +218.50 – –
[Well-known] – – +1,253.25 – –
(P) [10y] – – – +305.25 –
Table 4: The Impact of Product Improvements on Shares of Preference and RevenuesThis table summarizes the effects of product modifications on shares of preference and revenues of the budget, classic,innovative, and premium term life products. The base case values are displayed in Panel A. Panels B and C contain thechanges in the shares of preference (in percentage points) and the corresponding revenue increases (in EUR).
20
Working Papers on Risk Management and Insurance, No. 145 – September 2014
prices below the base case levels, the providers of the innovative and premium products may attract a
substantial fraction of new buyers from their competitors and from outside the market. Eventually, the
premium product even largely crowds out the remaining policies. A low price strategy for the classic
product, in contrast, is comparatively less successful. In all three cases, demand reacts asymmetrically:
price increases are associated with much smaller share of preference losses.26 Third, only the premium
policy sustains a noteworthy share of preference in every scenario, no matter whether its own price is
increased beyond the medium level or whether either one of the other products is offered at a very low
price. Consequently, insurers that understand consumer preferences and design sought-after term life
policies may effectively evade price pressure from their competitors.
Price Levels
Cum
ula
ted S
har
es o
f P
refe
rence
s (in p
erce
nt)
Very Low Low Medium High Very High
010
2030
4050
010
2030
4050
NonePremiumInnovativeClassicBudget
(a) Budget Product
Chan
ge in S
har
es o
f P
refe
rence
s (in P
P)
−10
−8
−6
−4
−2
02
46
Classic
Innovative
Premium
None
(b) Switches from Budget Product
Price Levels
Cum
ula
ted S
har
es o
f P
refe
rence
s (in p
erce
nt)
Very Low Low Medium High Very High
010
2030
4050
010
2030
4050
NonePremiumInnovativeClassicBudget
(c) Classic Product
Chan
ge in S
har
es o
f P
refe
rence
s (in P
P)
−4
−2
02
46
810
12
None
Premium
Innovative
Budget
(d) Switches to/from Classic Product
Figure 6: The Impact of Price Variations on Shares of Preference ISubfigures (a) and (b) show the shares of preference for different price levels of the budget and the classic product,respectively. The base case prices are indicated by a vertical dashed line and the y-axes have been capped at 50 percent.The associated product switching and market expansion effects can be assessed by means of subfigures (b) and (d). Ineach case, the prices of the remaining three products are held constant at their base case level.
26As the budget product already exhibits a very low price in the base case, we can only make it more expensive, which, inturn, causes a considerable fraction of customers to switch to the innovative product or leave the market.
21
Working Papers on Risk Management and Insurance, No. 145 – September 2014
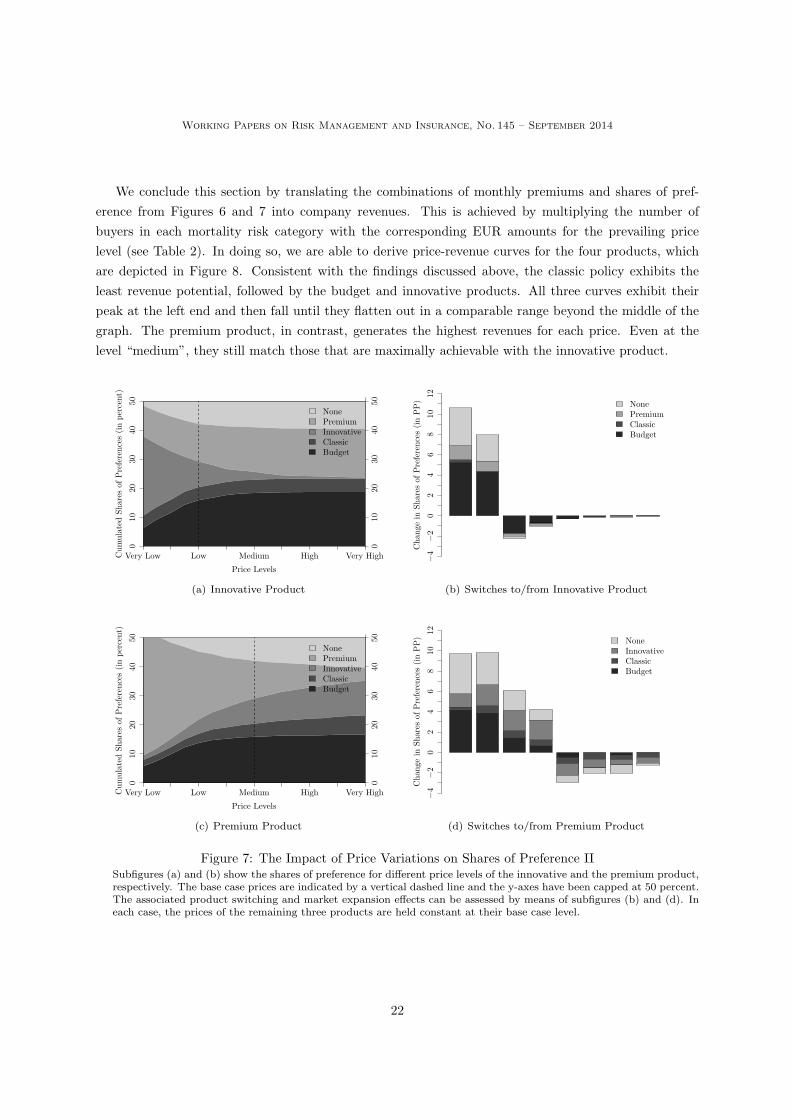
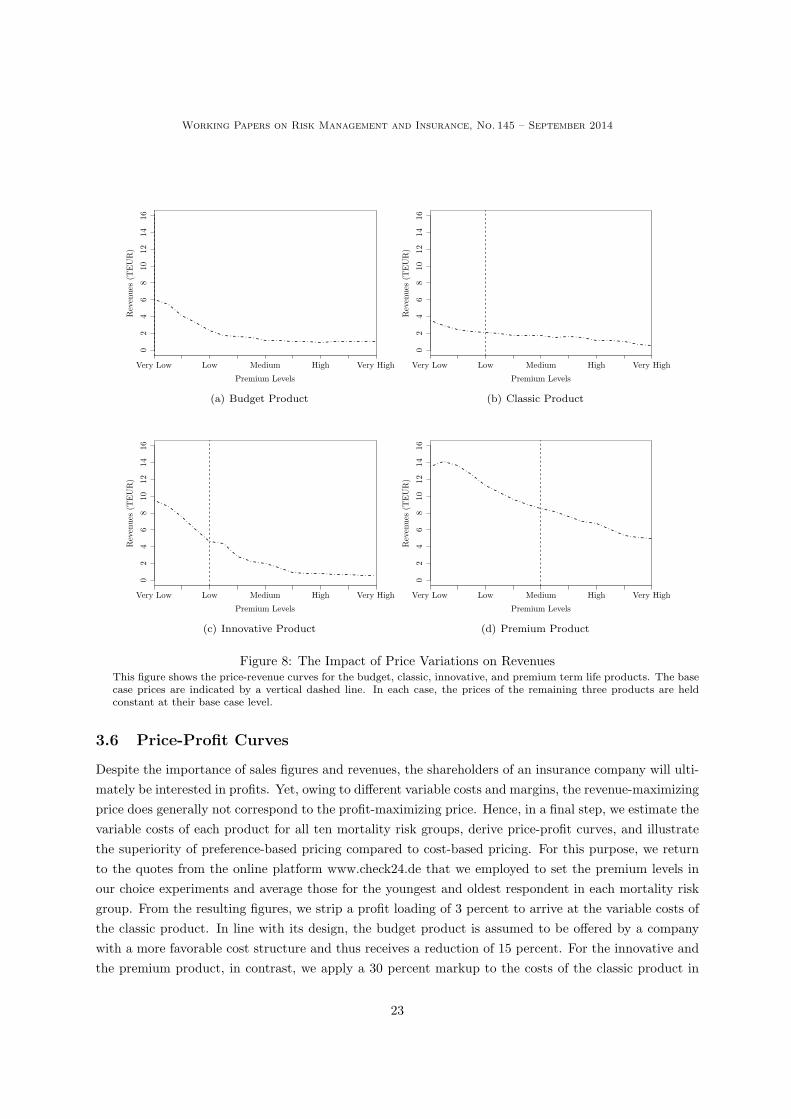
We conclude this section by translating the combinations of monthly premiums and shares of pref-
erence from Figures 6 and 7 into company revenues. This is achieved by multiplying the number of
buyers in each mortality risk category with the corresponding EUR amounts for the prevailing price
level (see Table 2). In doing so, we are able to derive price-revenue curves for the four products, which
are depicted in Figure 8. Consistent with the findings discussed above, the classic policy exhibits the
least revenue potential, followed by the budget and innovative products. All three curves exhibit their
peak at the left end and then fall until they flatten out in a comparable range beyond the middle of the
graph. The premium product, in contrast, generates the highest revenues for each price. Even at the
level “medium”, they still match those that are maximally achievable with the innovative product.
Price Levels
Cum
ula
ted S
har
es o
f P
refe
rence
s (in p
erce
nt)
Very Low Low Medium High Very High
010
2030
4050
010
2030
4050
NonePremiumInnovativeClassicBudget
(a) Innovative Product
Chan
ge in S
har
es o
f P
refe
rence
s (in P
P)
−4
−2
02
46
810
12
None
Premium
Classic
Budget
(b) Switches to/from Innovative Product
Price Levels
Cum
ula
ted S
har
es o
f P
refe
rence
s (in p
erce
nt)
Very Low Low Medium High Very High
010
2030
4050
010
2030
4050
NonePremiumInnovativeClassicBudget
(c) Premium Product
Chan
ge in S
har
es o
f P
refe
rence
s (in P
P)
−4
−2
02
46
810
12
None
Innovative
Classic
Budget
(d) Switches to/from Premium Product
Figure 7: The Impact of Price Variations on Shares of Preference IISubfigures (a) and (b) show the shares of preference for different price levels of the innovative and the premium product,respectively. The base case prices are indicated by a vertical dashed line and the y-axes have been capped at 50 percent.The associated product switching and market expansion effects can be assessed by means of subfigures (b) and (d). Ineach case, the prices of the remaining three products are held constant at their base case level.
22
Working Papers on Risk Management and Insurance, No. 145 – September 2014
Premium Levels
Rev
enues
(T
EU
R)
Very Low Low Medium High Very High
02
46
810
1214
16
(a) Budget Product
Premium Levels
Rev
enues
(T
EU
R)
Very Low Low Medium High Very High
02
46
810
1214
16
(b) Classic Product
Premium Levels
Rev
enues
(T
EU
R)
Very Low Low Medium High Very High
02
46
810
1214
16
(c) Innovative Product
Premium Levels
Rev
enues
(T
EU
R)
Very Low Low Medium High Very High
02
46
810
1214
16
(d) Premium Product
Figure 8: The Impact of Price Variations on RevenuesThis figure shows the price-revenue curves for the budget, classic, innovative, and premium term life products. The basecase prices are indicated by a vertical dashed line. In each case, the prices of the remaining three products are heldconstant at their base case level.
3.6 Price-Profit Curves
Despite the importance of sales figures and revenues, the shareholders of an insurance company will ulti-
mately be interested in profits. Yet, owing to different variable costs and margins, the revenue-maximizing
price does generally not correspond to the profit-maximizing price. Hence, in a final step, we estimate the
variable costs of each product for all ten mortality risk groups, derive price-profit curves, and illustrate
the superiority of preference-based pricing compared to cost-based pricing. For this purpose, we return
to the quotes from the online platform www.check24.de that we employed to set the premium levels in
our choice experiments and average those for the youngest and oldest respondent in each mortality risk
group. From the resulting figures, we strip a profit loading of 3 percent to arrive at the variable costs of
the classic product. In line with its design, the budget product is assumed to be offered by a company
with a more favorable cost structure and thus receives a reduction of 15 percent. For the innovative and
the premium product, in contrast, we apply a 30 percent markup to the costs of the classic product in
23
Working Papers on Risk Management and Insurance, No. 145 – September 2014
order to account for the presence of the CI rider. Finally, the variable costs for the premium product
are increased by another 30 percent in order to deliberately handicap the respective insurance company
relative to its competitors. All of the aforementioned cost assumptions have been determined based on
focus group discussions with market experts from Swiss Re. Table 5 shows the variable costs for each
product and mortality risk group.
Premium Levels
Pro
fits
(T
EU
R)
Very Low Low Medium High Very High
−0.5
00.5
11.5
22.5
33.5
Cost−Based Pricing
Preference−Based Pricing
(a) Budget Product
Premium Levels
Pro
fits
(T
EU
R)
Very Low Low Medium High Very High
−0.5
00.5
11.5
22.5
33.5
Cost−Based Pricing
Preference−Based Pricing
(b) Classic Product
Premium Levels
Pro
fits
(T
EU
R)
Very Low Low Medium High Very High
−0.5
00.5
11.5
22.5
33.5
Cost−Based Pricing
Preference−Based Pricing
(c) Innovative Product
Premium Levels
Pro
fits
(T
EU
R)
Very Low Low Medium High Very High
−0.5
00.5
11.5
22.5
33.5
Cost−Based Pricing
Preference−Based Pricing
(d) Premium Product
Figure 9: The Impact of Price Variations on ProfitsThis figure shows the price-profit curves for the budget, classic, innovative, and premium term life products. The basecase prices are indicated by a vertical dashed line. In each case, the prices of the remaining three products are heldconstant at their base case level. The profits associated with a cost-based pricing approach are highlighted by blackdots. The black diamonds mark the maximum profits, which are revealed through preference-based pricing.
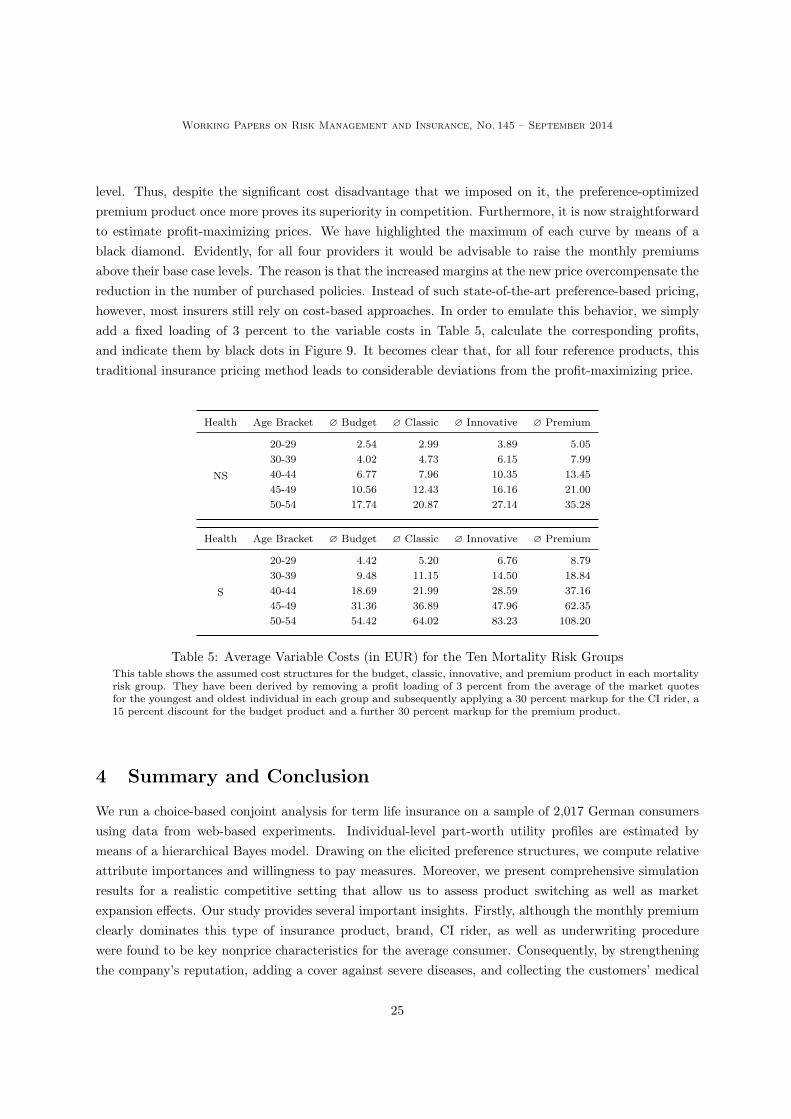
The price-profit curves can be found Figure 9. They have been derived by multiplying the number of
buyers in each mortality risk group with the respective variable costs and subtracting the result from the
revenues shown in Figure 8. At a first glance, we notice that the premium product offers by far the great-
est profit potential, which can be accessed through the higher price levels. Consistent with the revenues,
in contrast, the price-profit curves of the budget, classic, and innovative products converge to a similar
24
Working Papers on Risk Management and Insurance, No. 145 – September 2014
level. Thus, despite the significant cost disadvantage that we imposed on it, the preference-optimized
premium product once more proves its superiority in competition. Furthermore, it is now straightforward
to estimate profit-maximizing prices. We have highlighted the maximum of each curve by means of a
black diamond. Evidently, for all four providers it would be advisable to raise the monthly premiums
above their base case levels. The reason is that the increased margins at the new price overcompensate the
reduction in the number of purchased policies. Instead of such state-of-the-art preference-based pricing,
however, most insurers still rely on cost-based approaches. In order to emulate this behavior, we simply
add a fixed loading of 3 percent to the variable costs in Table 5, calculate the corresponding profits,
and indicate them by black dots in Figure 9. It becomes clear that, for all four reference products, this
traditional insurance pricing method leads to considerable deviations from the profit-maximizing price.
Health Age Bracket ∅ Budget ∅ Classic ∅ Innovative ∅ Premium
NS
20-29 2.54 2.99 3.89 5.05
30-39 4.02 4.73 6.15 7.99
40-44 6.77 7.96 10.35 13.45
45-49 10.56 12.43 16.16 21.00
50-54 17.74 20.87 27.14 35.28
Health Age Bracket ∅ Budget ∅ Classic ∅ Innovative ∅ Premium
S
20-29 4.42 5.20 6.76 8.79
30-39 9.48 11.15 14.50 18.84
40-44 18.69 21.99 28.59 37.16
45-49 31.36 36.89 47.96 62.35
50-54 54.42 64.02 83.23 108.20
Table 5: Average Variable Costs (in EUR) for the Ten Mortality Risk GroupsThis table shows the assumed cost structures for the budget, classic, innovative, and premium product in each mortalityrisk group. They have been derived by removing a profit loading of 3 percent from the average of the market quotesfor the youngest and oldest individual in each group and subsequently applying a 30 percent markup for the CI rider, a15 percent discount for the budget product and a further 30 percent markup for the premium product.
4 Summary and Conclusion
We run a choice-based conjoint analysis for term life insurance on a sample of 2,017 German consumers
using data from web-based experiments. Individual-level part-worth utility profiles are estimated by
means of a hierarchical Bayes model. Drawing on the elicited preference structures, we compute relative
attribute importances and willingness to pay measures. Moreover, we present comprehensive simulation
results for a realistic competitive setting that allow us to assess product switching as well as market
expansion effects. Our study provides several important insights. Firstly, although the monthly premium
clearly dominates this type of insurance product, brand, CI rider, as well as underwriting procedure
were found to be key nonprice characteristics for the average consumer. Consequently, by strengthening
the company’s reputation, adding a cover against severe diseases, and collecting the customers’ medical
25
Working Papers on Risk Management and Insurance, No. 145 – September 2014
information via short questionnaires, insurers may substantially boost the aggregate WTP. Secondly, we
document a considerable preference heterogeneity. While some individuals are prepared to pay relatively
high monthly premiums, a large fraction exhibits no WTP for term life insurance at all, presumably due
to the absence of a need for mortality risk coverage. This implies that the total market size can hardly
be further increased through product improvements or price reductions. Thirdly, throughout our anal-
ysis, the utility-optimized product consistently dominated all alternative offerings. Hence, insurers with
reliable preference information will be able to gain market shares, avoid competitive price pressure, and
access additional profit potential. Fourthly and lastly, the traditional pricing approaches, which still pre-
vail in the insurance industry, are shown to be clearly inferior to the preference-based methodology that
we employ throughout this paper. Therefore, those companies which continue to avoid a real paradigm
shift are likely to forgo substantial economic rents.
Despite these contributions, several open questions remain. The fact that consumer preferences for
term life insurance were found to be fairly heterogeneous indicates that it might make sense to partition the
market. In this regard, one could run a cluster analysis directly on our individual-level part-worth utility
profiles. Being based on behavioral aspects instead of demographic or socioeconomic variables, this so-
called benefit segmentation has several advantages over traditional approaches. Once the most prevalent
consumer groups have been identified, a further research project could then be aimed at assessing the
potential of product differentiation strategies and developing an optimal term life portfolio. Furthermore,
we have exclusively considered product attributes so far. Therefore, it could be insightful to learn more
about the individuals’ characteristics, both observable and latent, that drive their WTP. This would allow
to more easily differentiate potential customers from those people that cannot be drawn into the market.
Finally, one might extend our CBC analysis to other countries with a comparable term life insurance
market in order to investigate the role of the cultural environment in this purchase decision process.
26
Working Papers on Risk Management and Insurance, No. 145 – September 2014
References
Abrams, J. (1964). A New Method for Testing Pricing Decisions. Journal of Marketing, 28(3):6–9.
Alberini, A., Cropper, M., Krupnick, A., and Simon, N. B. (2006). Willingness to Pay for Mortality RiskReductions: Does Latency Matter? Journal of Risk and Uncertainty, 32(3):231–245.
Arora, N., Allenby, G., and Ginter, J. (1998). A Hierarchical Bayes Model of Primary and SecondaryDemand. Marketing Science, 17(1):29–44.
Arora, N., Ginter, J. L., and Allenby, G. M. (1995). Incorporating Prior Knowledge into the Analysis ofConjoint Studies. Journal of Marketing Research, 32(2):152–162.
Arora, N. and Huber, J. (2001). Improving Parameter Estimates and Model Prediction by AggregateCustomization in Choice Experiments. Journal of Consumer Research, 28(2):273–283.
Asenso-Okyere, W., Osei-Akoto, I., Anum, A., and Appiah, E. (1997). Willingness to Pay for HealthInsurance in a Developing Economy. A pilot study of the Informal Sector of Ghana Using ContingentValuation. Health Policy, 42(3):223–237.
Asgary, A., Willis, K., Taghvaei, A. A., and Rafeian, M. (2004). Estimating Rural Households’ Willingnessto Pay for Health Insurance. The European Journal of Health Economics, 5(3):209–215.
Backhaus, K., Wilken, R., Voeth, M., and Sichtmann, C. (2005). An Empirical Comparison of Methodsto Measure Willingness to Pay by Examining the Hypothetical Bias. International Journal of MarketResearch, 47(5):543–562.
Becker, G. M., DeGroot, M. H., and Marschak, J. (1964). Measuring Utility by a Single ResponseSequential Method. Behavioral Science, 9(1):226–232.
Booske, B. C., Sainfort, F., and Schoofs Hundt, A. (1999). Eliciting Consumer Preferences for HealthPlans. Health Services Research, 34(4):839–54.
Botzen, W. and Van den Bergh, J. (2012). Risk Attitudes to Low-Probability Climate Change Risks:WTP for Flood Insurance. Journal of Economic Behavior & Organization, 82(1):151–166.
Breidert, C., Hahsler, M., and Reutterer, T. (2006). A Review of Methods for Measuring Willingness toPay. Innovative Marketing, 2(4):8–32.
Buchenrieder, G. and Fischer, I. (2009). Laptop, Livestock Drawings and Ricewine: A Demand Analysisfor Livestock Insurance in Northern Vietnam. Savings and Development, 33(1):41–60.
Chakraborty, G., Ettenson, R., and Gaeth, G. (1994). How Consumers Choose Health Insurance. Journalof Health Care Marketing, 14(1):21–33.
Chen, W.-y., Chi, C., and Lin, Y.-h. (2011). The Willingness to Pay for the Health Care under Taiwan’sNational Health Insurance System. Applied Economics, 43(9):1113–1123.
Chib, S. and Greenberg, E. (1995). Understanding the Metropolis-Hastings Algorithm. The AmericanStatistician, 49(4):327–335.
Costa-Font, J. and Font, M. (2009). Does ’Early Purchase’ Improve the Willingness to Pay for Long-TermCare Insurance? Applied Economics Letters, 16(13):1301–1305.
Cropper, M. and Sussman, F. (1988). Families and the Economics of Risks to Life. American EconomicReview, 78(1):255–260.
27
Working Papers on Risk Management and Insurance, No. 145 – September 2014
Cummings, R. G., Harrison, G. W., and Rutstrom, E. E. (1995). Homegrown Values and HypotheticalSurveys: Is the Dichotomous Choice Approach Incentive-Compatible? American Economic Review,85(1):260–266.
Ding, M. (2007). An Incentive-Aligned Mechanism for Conjoint Analysis. Journal of Marketing Research,44(2):214–223.
Ding, M., Grewal, R., and Liechty, J. (2005). Incentive-Aligned Conjoint Analysis. Journal of MarketingResearch, 42(1):67–82.
Dong, H., Kouyate, B., Cairns, J., Mugisha, F., and Sauerborn, R. (2003). Willingness-to-Pay forCommunity-Based Insurance in Burkina Faso. Health Economics, 12(10):849–862.
Dong, S., Ding, M., and Huber, J. (2010). A Simple Mechanism to Incentive-Align Conjoint Experiments.International Journal of Research in Marketing, 27(1):25–32.
Dror, D. M., Radermacher, R., and Koren, R. (2007). Willingness to Pay for Health Insurance AmongRural and Poor Persons: Field Evidence from Seven Micro Health Insurance Units in India. HealthPolicy, 82(1):12–27.
Eckhardt, M., Forsberg, B. C., Wolf, D., and Crespo-Burgos, A. (2011). Feasibility of Community-BasedHealth Insurance in Rural Tropical Ecuador. Revista Panamericana de Salud Publica, 29(4):177–184.
Eeckhoudt, L. R. and Hammitt, J. K. (2001). Background Risks and the Value of a Statistical Life.Journal of Risk and Uncertainty, 23(3):261–279.
Fraser, R. (1992). An Analysis of Willingness to Pay for Crop Insurance. Australian Journal of Agricul-tural Economics, 36(1):83–95.
Gatzert, N., Huber, C., and Schmeiser, H. (2011). On the Valuation of Investment Guarantees in Unit-Linked Life Insurance: A Customer Perspective. Geneva Papers on Risk and Insurance: Issues andPractice, 36(1):3–29.
Green, P. E., Krieger, A. M., and Wind, Y. J. (2001). Thirty Years of Conjoint Analysis: Reflectionsand Prospects. Interfaces, 31(1):56–73.
Green, P. E. and Rao, V. R. (1971). Conjoint Measurement for Quantifying Judgmental Data. Journalof Marketing Research, 8(3):355–363.
Gustafsson, A., Herrmann, A., and Huber, F. (2003). Conjoint Analysis as an Instrument of MarketResearch Practice. In Gustafsson, A., Herrmann, A., and Huber, F., editors, Conjoint Measurement.Methods and Applications, chapter 1, pages 3–30. Springer, Berlin, 4 edition.
Hammitt, J. K. and Graham, J. D. (1999). Willingness to Pay for Health Protection: InadequateSensitivity to Probability? Journal of Risk and Uncertainty, 18(1):33–62.
Hammitt, J. K. and Liu, J.-T. (2004). Effects of Disease Type and Latency on the Value of MortalityRisk. Journal of Risk and Uncertainty, 28(1):73–95.
Hansen, J., Jacobsen, R., and Lau, M. (2013). Willingness to Pay for Insurance in Denmark. Journal ofRisk and Insurance (forthcoming).
Harrison, G. W. and Rutstrom, E. E. (2008). Experimental Evidence on the Existence of HypotheticalBias in Value Elicitation Methods. In Plott, C. R. and Smith, V. L., editors, Handbook of ExperimentalEconomics Results, volume 1.
28
Working Papers on Risk Management and Insurance, No. 145 – September 2014
Heenkenda, S. (2011). Prospective Demand for an Index-Based Microinsurance in Sri Lanka. Asia-PacificJournal of Social Sciences, 3(1):1–31.
Huber, J. (1997). What We Have Learned from 20 Years of Conjoint Research: When to Use Self-Explicated, Graded Pairs, Full Profiles, or Choice Experiments. In Sawtooth Software ConferenceProceedings, pages 243–256. Sawtooth Software Inc.
Huber, J. (1998). Achieving Individual-Level Predictions from CBC Data: Comparing ICE and Hierar-chical Bayes. Sawtooth Software Research Paper.
Huber, J. and Zwerina, K. (1996). The Importance of Utility Balance in Efficient Choice Designs. Journalof Marketing Research, 33(3):307–317.
Ichoku, H. E., Fonta, W. M., and Ataguba, J. E. (2010). Estimating the Willingness to Pay forCommunity-Based Health Insurance Schemes in Nigeria: A Random Valuation Framework. The IUPJournal of Risk & Insurance, 7(1&2):7–27.
Jacobs-Lawson, J. M., Webb, A. K., Schumacher, M., and Gayer, C. C. (2010). Age, Income, Health,and Willingness to Pay for Health Insurance in Late-Life. Financial Services Review, 19(3):265–274.
Jedidi, K. and Jagpal, S. (2009). Willingness to Pay: Measurement and Managerial Implications. In Rao,V. R., editor, Handbook of Pricing Research in Marketing, pages 37–60. Edward Elgar Publishing,Cheltenham, UK.
Jedidi, K. and Zhang, Z. J. (2002). Augmenting Conjoint Analysis to Estimate Consumer ReservationPrice. Management Science, 48(10):1350–1368.
Johannesson, M. (1996). A Note on the Relationship between Ex Ante and Expected Willingness to Payfor Health Care. Social Science & Medicine, 42(3):305–311.
Johannesson, M., Johansson, P., and Lofgren, K. (1997). On the Value of Changes in Life Expectancy:Blips versus Parametric Changes. Journal of Risk and Uncertainty, 15(3):221–239.
Johnson, R. (1974). Trade-Off Analysis of Consumer Values. Journal of Marketing Research, 11(2):121–127.
Johnson, R. (2000). Monotonicity Constraints in Choice-Based Conjoint with Hierarchical Bayes. Saw-tooth Software Research Paper.
Jones-Lee, M. (1974). The Value of Changes in the Probability of Death or Injury. Journal of PoliticalEconomy, 82(4):835–849.
Kerssens, J. J. and Groenewegen, P. P. (2005). Consumer Preferences in Social Health Insurance. TheEuropean Journal of Health Economics, 6(1):8–15.
Khan, M. A., Chander, M., and Bardhan, D. (2013). Willingness to Pay for Cattle and Buffalo Insurance:An Analysis of Dairy Farmers in Central India. Tropical Animal Health and Production, 45(2):461–468.
Kohli, R. and Mahajan, V. (1991). A Reservation-Price Model for Optimal Pricing of MultiattributeProducts in Conjoint Analysis. Journal of Marketing Research, 28(3):347–354.
Lenk, P. J., Desarbo, W. S., Green, P. E., and Young, M. R. (1996). Hierarchical Bayes Conjoint Anal-ysis: Recovery of Partworth Heterogeneity from Reduced Experimental Designs. Marketing Science,15(2):173–191.
29
Working Papers on Risk Management and Insurance, No. 145 – September 2014
Louviere, J. J. and Woodworth, G. (1983). Design and Analysis of Simulated Consumer Choice orAllocation Experiments: An Approach Based on Aggregate Data. Journal of Marketing Research,20(4):350–367.
Mathiyazaghan, K. (1998). Willingness to Pay for Rural Health Insurance Through Community Partici-pation in India. The International Journal of Health Planning and Management, 13(1):47–67.
McFadden, D. (1974). Conditional Logit Analysis of Qualitative Choice Behavior.pdf. In Frontiers inEconometrics, chapter 4, pages 105–142. Academic Press, New York.
McFadden, D. (1986). The Choice Theory Approach to Market Research. Marketing Science, 5(4):275–297.
Miller, K. M., Hofstetter, R., Krohmer, H., and Zhang, Z. J. (2011). How Should Consumers’ Willingnessto Pay be Measured? An Empirical Comparison of State-of-the-Art Approaches. Journal of MarketingResearch, 48(1):172–184.
Mitchell, R. C. and Carson, R. T. (1989). Using Surveys to Value Public Goods: The Contingent ValuationMethod. Resources for the Future, Washington, D.C.
Musshoff, O., Hirschauer, N., and Odening, M. (2008). Portfolio Effects and the Willingness to Pay forWeather Insurances. Agricultural Finance Review, 68(1):83–97.
Olsen, J. A., Kidholm, K., Donaldson, C., and Shackley, P. (2004). Willingness to Pay for Public HealthCare: A Comparison of Two Approaches. Health Policy, 70(2):217–28.
Orme, B. K. (2002). Formulating Attributes and Levels in Conjoint Analysis. Sawtooth Software ResearchPaper.
Orme, B. K. (2009). Which Conjoint Method Should I Use? Sawtooth Software Research Paper.
Orme, B. K. (2010). Getting Started with Conjoint Analysis: Strategies for Product and Pricing Research.Research Publishers LLC.
Rao, V. R. and Sattler, H. (2003). Measurement of Price Effects with Conjoint Analysis: SeparatingInformational and Allocative Effects of Price. In Gustafsson, A., Herrmann, A., and Huber, F., editors,Conjoint Measurement. Methods and Applications, pages 47–66. Springer, Berlin.
Savage, I. (1993). An Empirical Investigation into the Effect of Psychological Perceptions on the Will-ingness to Pay to Reduce Risk. Journal of Risk and Uncertainty, 6(1):75–90.
Sawtooth Software (2009). The CBC/HB System for Hierarchical Bayes Estimation (Version 5.0). Tech-nical Paper.
Sawtooth Software (2013). The CBC System for Choice-Based Conjoint Analysis. Technical Paper.
Shaik, S., Coble, K. H., Hudson, D., Miller, J. C., Hanson, T. R., and Sempier, S. H. (2008). Willingnessto Pay for a Potential Insurance Policy: Case Study of Trout Aquaculture. Agricultural and ResourceEconomics Review, 37(1):41–50.
Shepard, D. S. and Zeckhauser, R. J. (1984). Survival versus Consumption. Management Science,30(4):423–439.
Sherrick, B. J., Barry, P. J., Schnitkey, G. D., Ellinger, P. N., and Wansink, B. (2003). Farmers’Preferences for Crop Insurance Attributes. Review of Agricultural Economics, 25(2):415–429.
30
Working Papers on Risk Management and Insurance, No. 145 – September 2014
Sonnier, G., Ainslie, A., and Otter, T. (2007). Heterogeneity Distributions of Willingness-to-Pay inChoice Models. Quantitative Marketing and Economics, 5(3):313–331.
Sricharoen, T. and Buchenrieder, G. (2008). Health Insurance in Rural Northern Thailand: What isAvailable? What Would be Desirable? Proceedings of the German Development Economics Conference.
Swait, J. and Louviere, J. (1993). The Role of the Scale Parameter in the Estimation and Comparisonof Multinomial Logit Models. Journal of Marketing Research, 30(3):305–314.
Swiss Re (2012). European Insurance Report 2012 - Customers for Life.
Thurstone, L. (1927). A Law of Comparative Judgment. Psychological Review, 34(4):273–286.
Train, K. E. (2009). Discrete Choice Methods with Simulation. Cambridge University Press, Cambridge.
Van den Berg, B., Van Dommelen, P., Stam, P., Laske-Aldershof, T., Buchmueller, T., and Schut, F. T.(2008). Preferences and Choices for Care and Health Insurance. Social Science & Medicine (1982),66(12):2448–59.
Vargas Bustamante, A., Ojeda, G., and Xochitl, C. n. (2008). Willingness to Pay for Cross-Border HealthInsurance between the United States and Mexico. Health Affairs, 27(1):169–178.
Verlegh, P. W., Schifferstein, H. N., and Wittink, D. R. (2002). Range and Number-of-Levels Effects inDerived and Stated Measures of Attribute Importance. Marketing Letters, 13(1):41–52.
Voelckner, F. (2006). An Empirical Comparison of Methods for Measuring Consumers Willingness toPay. Marketing Letters, 17(2):137–149.
Von Neumann, J. and Morgenstern, O. (1944). Theory of Games and Economic Behavior. PrincetonUniversity Press, Princeton, New Jersey.
Von Watzdorf, S. and Skorna, A. (2010). How Value-Added Services Influence the Purchasing Decisionof Insurance Products. Working Paper Series of the Geneva Association.
Wang, T., Venkatesh, R., and Chatterjee, R. (2007). Reservation Price as a Range: An IncentiveCompatible Approach. Journal of Marketing Research, 44(2):200–213.
Wertenbroch, K. and Skiera, B. (2013). Measuring Consumers’ Willingness to Pay at the Point ofPurchase. Journal of Marketing Research, 39(2):228–241.
Zhang, L., Wang, H., Wang, L., and Hsiao, W. (2006). Social Capital and Farmer’s Willingness-to-Join aNewly Established Community-Based Health Insurance in Rural China. Health Policy, 76(2):233–42.