On Fairness and Application Performance of Active Queue Management in Broadband Cable Networks Gongbing Hong a,* , James Martin a , James Westall a a School of Computing, Clemson University, 100 McAdams Hall, Clemson, SC 29634, USA Abstract We evaluate the performance of modern delay-based active queue management (AQM) algorithms in down- stream DOCSIS 3.0 cable environments. Our simulation-based study involves scenarios that include tiered service levels and application workloads that include FTP, HTTP-based adaptive streaming (HAS), VoIP, and web traffic. Our results show that AQM maintains target queuing delays and consequently provide strong isolation between responsive high bandwidth and low bandwidth latency sensitive flows. We also show that lowering target queuing delays exacerbates TCP’s RTT unfairness. Nevertheless, in the scenarios that we studied, observed application performance was not significantly impacted by the specific AQM in use. With the potential large deployment of AQM imminent for DOCSIS 3.0, the analysis presented in this paper provides timely feedback to the community concerning how delay-based AQM can manage bandwidth allocation fairness and application performance in realistic downstream DOCSIS 3.0 cable network systems. Keywords: Cable access, active queue management, packet scheduling algorithms, network performance evaluation 1. Introduction The evolution of cable network technology is at an intriguing crossroad. Traditional broadcast video is converging with Internet video broadcast. Multiple system operators (MSOs) must engineer their access networks to competitively support both traditional video broadcast service and broadband Internet access. This task is challenging because of the rapid evolution of technology and customer demands from both worlds. In the video broad- cast domain, system operators must provide ac- cess to a mix of hundreds of standard and high definition television channels along with video-on- demand services. In the broadband access domain, standards are rapidly evolving to provide ever in- creasing data rates to end users. To meet all re- quirements in current and emerging access net- * Corresponding author Email addresses: [email protected], [email protected](Gongbing Hong), [email protected](James Martin), [email protected](James Westall) works, operators are rapidly migrating to a con- verged IP network for all cable and broadband ac- cess services. Recent enhancements to cable access standards by CableLabs, the research and development orga- nization for MSOs, are ensuring the convergence is technically possible. Current generation systems based on Data Over Cable Service Interface Spec- ification (DOCSIS) version 3.0 (D3.0) can support multiple downstream, fixed bandwidth channels (usually 6.0 or 8.0 MHz) bonded together and mul- tiple upstream channels (usually 6.4 MHz) bonded together[1]. A common configuration involving 8 bonded downstream channels and 4 bonded up- stream channels can support data rates up to 320 Mbits/s downstream and 120 Mbits/s upstream. Emerging systems will be based on the recently released DOCSIS 3.1 (D3.1) standard[2]. Higher channel bandwidth along with more efficient mod- ulation and coding will allow downstream and up- stream data rates of up to 10 Gbps and 1 Gbps respectively. Scheduling and queue management disciplines are fundamental to computer networking and have Preprint submitted to Elsevier June 28, 2015
Transcript
On Fairness and Application Performance of Active Queue Management inBroadband Cable Networks
Gongbing Honga,∗, James Martina, James Westalla
aSchool of Computing, Clemson University, 100 McAdams Hall, Clemson, SC 29634, USA
Abstract
We evaluate the performance of modern delay-based active queue management (AQM) algorithms in down-stream DOCSIS 3.0 cable environments. Our simulation-based study involves scenarios that include tieredservice levels and application workloads that include FTP, HTTP-based adaptive streaming (HAS), VoIP,and web traffic.
Our results show that AQM maintains target queuing delays and consequently provide strong isolationbetween responsive high bandwidth and low bandwidth latency sensitive flows. We also show that loweringtarget queuing delays exacerbates TCP’s RTT unfairness. Nevertheless, in the scenarios that we studied,observed application performance was not significantly impacted by the specific AQM in use.
With the potential large deployment of AQM imminent for DOCSIS 3.0, the analysis presented in thispaper provides timely feedback to the community concerning how delay-based AQM can manage bandwidthallocation fairness and application performance in realistic downstream DOCSIS 3.0 cable network systems.
The evolution of cable network technology isat an intriguing crossroad. Traditional broadcastvideo is converging with Internet video broadcast.Multiple system operators (MSOs) must engineertheir access networks to competitively support bothtraditional video broadcast service and broadbandInternet access. This task is challenging becauseof the rapid evolution of technology and customerdemands from both worlds. In the video broad-cast domain, system operators must provide ac-cess to a mix of hundreds of standard and highdefinition television channels along with video-on-demand services. In the broadband access domain,standards are rapidly evolving to provide ever in-creasing data rates to end users. To meet all re-quirements in current and emerging access net-
works, operators are rapidly migrating to a con-verged IP network for all cable and broadband ac-cess services.
Recent enhancements to cable access standardsby CableLabs, the research and development orga-nization for MSOs, are ensuring the convergenceis technically possible. Current generation systemsbased on Data Over Cable Service Interface Spec-ification (DOCSIS) version 3.0 (D3.0) can supportmultiple downstream, fixed bandwidth channels(usually 6.0 or 8.0 MHz) bonded together and mul-tiple upstream channels (usually 6.4 MHz) bondedtogether[1]. A common configuration involving 8bonded downstream channels and 4 bonded up-stream channels can support data rates up to 320Mbits/s downstream and 120 Mbits/s upstream.Emerging systems will be based on the recentlyreleased DOCSIS 3.1 (D3.1) standard[2]. Higherchannel bandwidth along with more efficient mod-ulation and coding will allow downstream and up-stream data rates of up to 10 Gbps and 1 Gbpsrespectively.
Scheduling and queue management disciplinesare fundamental to computer networking and have
Preprint submitted to Elsevier June 28, 2015
been studied from many different perspectives.Common objectives include congestion manage-ment and provision of fair sharing or differenti-ated services in IP networks. In spite of this bodyof knowledge, access networks can still suffer fromknown problems including bufferbloat, TCP RTTunfairness, and vulnerability to unresponsive flows[3–8]. Shared medium cable networks present addi-tional challenges. One one hand they must attemptto ensure that bandwidth sharing and latency ob-jectives among many competing flows are met. Onthe other hand, regulatory constraints and concernspertaining to so-called “net neutrality” limit themechanisms that can be used in doing so. Theseregulatory concerns are so strong that flow-aware,multi-queue fair share scheduling systems such asdeficit round robin (DRR) or self-clocked fair queu-ing (SCFQ) that would greatly facilitate bandwidthmanagement are not currently in use.
Two flow-agnostic, single queue AQM algorithmsthat have been proposed since 2012 are ControlledDelay (CoDel) [4, 9] and Proportional Integral Con-troller Enhanced (PIE) [10, 11]. CoDel has beenevaluated in different types of networks includ-ing 802.11 and high speed wired networks. PIE,which is not yet widely deployed, is based in parton concepts that were introduced previously [12].The D3.1 standard requires that a cable modem(CM) manages upstream best effort traffic usingPIE. Wide deployment of D3.1 equipment is not ex-pected for several years. This prompted CableLabsto modify the current, and widely deployed, D3.0standard to allow the immediate use of the PIEAQM for upstream traffic [1]. For downstream traf-fic, the Cable Modem Termination System (CMTS)must support a published AQM algorithm, not nec-essarily CoDel or PIE, in both D3.0 and D3.1.The standards indicate the equipment must sup-port AQM by default, although a network opera-tor can choose to override the default configuration,possibly selecting to not use AQM or to use an al-ternative method. The intent of adding the AQMrequirement to the DOCSIS standards is to ensurethat network operators have tools that can addressbufferbloat in a consistent manner. With large scaledeployments of delay-based AQM algorithms immi-nent, there is critical need to understand how theseschemes will behave in current and emerging cablenetworks.
In prior work we have developed an ns2 -basedsimulation model of DOCSIS 3.0 [13]. We haveused the simulator to explore upstream buffer man-
agement in cable modems [14]. The focus of thatpaper was upon preventing upstream bufferbloatin the CM. The validation of downstream schedul-ing disciplines in bonded channel environments wasthe focus of [15]. Extending our ongoing workin the area of AQM [16], the research presentedin this paper provides detailed analysis on the ef-fectiveness of recently proposed delay-based AQMschemes applied to downstream traffic in cable ac-cess networks. Our simulation framework utilizesrealistic scenarios involving application traffic mod-els such as FTP, VoIP, web browsing, and HTTP-based adaptive streaming (HAS). The analysis in-cludes scenarios involving both single and bondeddownstream channels. We consider scenarios thatinvolve different service tiers, where different cableusers are provisioned with different data rates.
To the best of our knowledge, our study is thefirst to assess the ability of modern delay-basedAQM schemes to manage fairness and applicationperformance in realistic, single or bonded channeldownstream DOCSIS 3.0 cable network scenarios.The results presented in this paper address the fol-lowing questions: 1) How effectively do CoDel andPIE support fairness and application performancein realistic cable network scenarios? 2) Are thereundesirable side effects when the AQM interactswith tiered service levels? 3) How effectively do theschemes isolate responsive traffic from unresponsiveflows?
This paper is organized as follows. Section 2 sum-marizes relevant research that has been published inthe literature. Section 3 introduces the experimen-tal methodology. The next three sections containthe results of our simulation studies with the focusof each section being one of the three fundamen-tal questions enumerated above. Section 7 providesconclusions and identifies our next steps.
2. Related Work
Bufferbloat has received significant attention re-cently [3, 4]. Bufferbloat is a side-effect of conges-tion that occurs when network equipment is pro-visioned with large unmanaged buffer queues. Itseffects are persistently high queue levels that in turnlead to large and sustained packet latency.
AQM has long been considered a solution tobufferbloat. The Random Early Detection (RED)algorithm manages a queue by randomly droppingpackets in a manner in which the random drop rateis dynamically adjusted based on an average queue
2
size estimate and a configured maximum alloweddrop rate (referred to as maxp) [7]. Most REDimplementations offer the ‘gentle’ option where thedrop rate increases linearly from maxp to 1 oncethe average queue level exceeds the target queuesize [8, 17].
While RED is widely available, it is not widelyused. It has been shown that the average queue de-lay with RED is sensitive to traffic loads and to pa-rameter settings[18, 19]. Adaptive RED (ARED) isa simple extension to RED that further adapts therandom drop process such that the average queuelevel tracks a target queue level [20]. This adapta-tion is performed periodically. We refer to this pa-rameter as the control interval . We refer the readerto [21] for a thorough summary of relevant AQM re-search.
CoDel and PIE are AQM algorithms that werespecifically designed to address the shortcomingsof (A)RED. Both AQMs are delay-based as theyproactively drop packets to ensure average packetqueue delay remains less than a configured latencytarget. We refer to this as the target delay parame-ter. Both AQMs expose a second configuration pa-rameter analogous to the control interval of AREDthat defines the timescale of control.
CoDel’s delay estimate is based on a per packetlatency monitor. PIE’s delay estimate is based onan estimate of the recent departure rate at thequeue. The two AQMs both tolerate infrequentbursts of traffic. However, the details of the burstcontrol mechanisms differ and are described in [4]and [10] respectively.
The PIE algorithm performs early packet dropsas packets arrive at the queue. The CoDel algo-rithm, as originally proposed in [4, 9] performs earlypacket drops as queued packets are serviced. TheDOCSIS vendor community has expressed concernin implementing a head-drop AQM such as CoDelin a CM due to complications with hardware buffercontrol logic. This is likely to be true in other lowcost network devices such as Ethernet switches orWiFi APs.
AQM involving per-flow accounting or the useof multiple queues has been proposed to addressthe combined problem of fairness and bufferbloat.Proposals including Fair RED (FRED), Stochas-tic Fair BLUE, and Approximate Fair Dropping(AFD) strive to achieve fairness while retainingbenefits of AQM [12, 19, 22]. Recent proposals haveconsidered per-flow accounting along with delay-based AQM [23, 24]. An AQM scheme called SFQ-
CoDel [25], which is based on CoDel and StochasticFair Queuing (SFQ) [26], has been actively evalu-ated [27, 28].
In follow-on work, we are exploring the combinedproblem of buffer management and packet schedul-ing when multiple queues are involved. However,given the interest of the cable community in singlequeue delay-based AQM, we limit the scope of theresearch presented in this paper to low complexityAQM schemes.
2.1. Overview of DOCSIS Cable Networks
Modern broadband Internet access over cable in-volves a hybrid-fiber coaxial (HFC) infrastructurewith a DOCSIS MAC protocol operating betweenthe Cable Modem Termination System (CMTS)and the subscriber Cable Modems (CMs). Themost widely deployed version of the standard,DOCSIS 3.0 (D3.0), uses 6 MHz (or 8 MHz in cer-tain regions) of bandwidth for the shared down-stream channel and up to 6.4 MHz of bandwidth forthe shared upstream channel. The 6 MHz down-stream channel supports physical layer data ratesup to 42.88 Mbps (55.62 Mbps in 8 MHz regions)and the upstream channel supports data rates upto 30.72 Mbps. Prior to D3.0, CMs were limitedto a single downstream channel and a single up-stream channel (although, for the purposes of loadbalancing, the CMTS could dynamically changea CM’s downstream or upstream channel assign-ment). D3.0 allows a CM to support multiple down-stream or upstream channels. A bonding group isa set of channels that specific subscriber traffic canuse. A downstream service group is the completeset of channels that can potentially reach a CM. Abonding group is a specific subset of channels fromthe service group assigned to carry subscriber traf-fic.
Downstream operation employs time divisionmultiplexing. A downstream scheduler at theCMTS manages the allocation of bandwidth amongcompeting service flows. A DOCSIS service flowis a transport service that provides unidirectionaltransport of packets. Service flow traffic may beshaped and prioritized based on QoS traffic param-eters associated with the flow. For downstream, theservice parameters that define a service flow includepriority, settings for rate shaping and limiting (sus-tained traffic rate, traffic burst size), a minimumreserved traffic rate, a peak traffic rate, and tar-get latency. The standard does not specify how a
3
AggregateQueue(s)
RegulatorDownstream SchedulingDiscipline
Upstream Scheduler
Router
Data rates multiple of:30.72Mbps upstream
42.88Mbps downstream
VoIP Client,WRT Client
CableModems
FTP Clients, Web Clients Map Messages
CM Requests forUpstream bandwidth
...
CMTS
Router
Router
Uncongested Path RTT 30ms
Uncongested Path RTT 80ms
Uncongested Path RTT 130ms
VoIP server, WRT server
FTP Servers
HAS Servers,HTTP Servers
Figure 1: Simulated Cable Network Diagram
specific scheduling implementation should differen-tially treat traffic from different priority levels.
Upstream operation is a shared bus relying on ahybrid contention-based request MAC protocol formanaging access to the channel by competing ca-ble modems. Similar to the service model definedby the Worldwide Interoperability for MicrowaveAccess (WiMAX) [29], upstream DOCSIS providesmultiple services to support different classes of traf-fic. The centralized upstream scheduler operatingat the CMTS allocates periodic grants to modems(i.e., the unsolicited grant service) or the CM re-quests a bandwidth allocation using either a requestpiggy-backed to a previously allocated transmissionor a contention-based request mechanism.
A service tier can be defined by any combinationof these service parameters. In this paper, we de-fine a downstream service tier by the rate shapingand limiting parameters. We refer to the sustainedtraffic rate simply as the service rate.
3. Methodology
Figure 1 illustrates the simulation model used inthese studies. We model a single DOCSIS MACdomain in which one CMTS interacts with a num-ber of cable modems. Each cable modem representsa subscriber who, in practice, might have multipleTCP/IP devices interacting with a variety of Inter-net services. However, in the experiments describedhere, each cable modem hosts a single data flow.
The model assumes ideal channels that offerdownstream and upstream link layer data ratesof 38 Mbps and 27 Mbps respectively. We alsoconsider scenarios involving 4 bonded downstreamchannels providing an effective data rate of 152Mbps.
Our analysis considers scenarios with and with-out imposition of service rate limits. The regula-tor component of the simulator, shown in Figure 1,
models a DOCSIS token bucket with service rateparameters being the desired maximum sustainedrate and bucket size (specified in bytes). We use thedefault DOCSIS token bucket size of 3044 bytes. Awidely used option called Powerboost [30] employsa significantly larger bucket size to allow a flow toexceed its service rate limit during an initial traf-fic burst. This can provide performance benefits tobrief connections in uncongested situations. We donot consider this option in our analysis because weare primarily interested in AQM behaviors duringcongested scenarios.
The queue management algorithms are locatedin the Downstream Scheduling Discipline compo-nent of Figure 1. For DRR, there is a dedicatedqueue for each flow. For all other queue manage-ment schemes, all flows are served through singleshared FIFO queue.
Open source ns2 implementations of adaptiveRED, a tail-drop variant of CoDel, and PIE wereadapted by us to work in our ns2 DOCSIS simu-lation framework. The source code for the AQMsthat we used in our analysis is available to the re-search community. 1
We analyze several scenarios using varying num-bers of downstream application flows includingFTP, VoIP, web, and HAS video streams. Thesimulated client sides of these applications run onnodes attached to cable modems. The simulatedservers run on nodes located outside the cable net-work. The cable network end point of each simu-lated flow is attached to a unique cable modem.
To model Internet path diversity, we set the prop-agation delays of the application server access linksto different values. As illustrated in Figure 1, therange of uncongested path round trip times variesfrom 30 ms to 130 ms. This captures the inherentvariability that subscriber flows might experiencewith respect to the physical distance between com-munication endpoints.
In the simulations that are presented, all datapackets are 1500 bytes with the exception of VoIPpackets which are 238 bytes. The bandwidth delayproduct of a round trip path consisting of hetero-geneous links is properly computed as the bit rateof the bottleneck link multiplied by the path RTT.Assuming a data rate of 38 Mbps, fixed packet sizeof 1500 bytes and RTT of 130 ms, the bandwidth-delay product is 411 packets.
1Available at http://people.cs.clemson.edu/~jmarty/
AQM/AQMPaper.html
4
Maximum buffer capacities at the simulatedrouters and the CMTS are set large enough to en-sure that, in the absence of AQM, all TCP senderscan always have the full bandwidth delay productof unacknowledged packets in the pipeline. Themaximum buffer capacity at the CMTS, referred toas the QUEUE CAPACITY is set to 2048 pack-ets. The maximum buffer capacity at all otherrouters is set to twice the QUEUE CAPACITY.The QUEUE CAPACITY is so large that it is nofactor in packet drops for any of the AQM sched-ulers. For all but the HAS workloads the ns2 TCPsimulation was configured as follows:
• TCP: TCP/Sack (ns2 TCP agent:Agent/TCP/Sack1).
• Maximum window/cwnd: 10000 segments.
• Initial window: 2 segments
• Delayed ACK mean interval: 100ms
• Maximum segment size: 1460 bytes
• Number of segment arrivals required to triggeran ACK: 2
For the HAS experiment, the ns2Agent/TCP/FullTCP/Sack was used for bothFTP and HAS. The TCP configuration used theparameters shown above.
In all simulations, we verified that the upstreamchannel was never congested. Upstream traffic waslimited to ping replies, TCP acknowledgments, andHTTP GET requests.
The behavior of the AQM schedulers is obviouslystrongly dependent on their configuration parame-ters. The ARED drop algorithm is dependent onthe target queue level, which in our simulation isderived from the QUEUE CAPACITY. CoDel andPIE depend on the target delay.
The round trip latency experienced by packetsunder deficit round robin and drop tail schedulingis strongly dependent on the QUEUE CAPACITY.The packet drop rate is also dependent, to a lesserdegree, on QUEUE CAPACITY. We employ therecommended default settings for all schedulers ex-cept as noted.
3.1. Traffic Models and Performance Metrics
The results presented in this paper involve work-loads consisting of FTP, HAS, web, and UDP CBRtraffic. Other than HAS, the traffic models we useare those provided in ns2.
3.1.1. HAS traffic model for ns2
As described in Sandvine’s most recent Inter-net traffic report [31], Internet video streaming,more commonly as HTTP-based Adaptive Stream-ing (HAS), consumes more than 50% of the down-stream bandwidth delivered to fixed access endpoints.
The interaction between a HAS client (i.e., theplayer) and server has been established in recentacademic research [32–35]. In a HAS system, videoand audio content is encoded and made available atservers located either at the content provider’s fa-cilities or distributed to locations in the Internet bya content delivery network provider. Multiple rep-resentations of the content are created that reflecta range of possible encoded bitrates correspondingto different levels of video quality and subsequentlydifferent levels of bandwidth consumption. Whilethe range of bitrates is continually being extended,the literature suggests that a bitrate range of 0.50Mbps to 5.0 Mbps is reasonable [32, 36, 37]. Theclient requests portions of the content in chunks re-ferred to as segments. A segment size between 2 and10 seconds is reasonable [36, 38]. The client main-tains a playback buffer that serves to compensatefor the jitter in the traffic arrival process. The liter-ature suggests that a playback buffer capacity rang-ing from 60 to 240 seconds is reasonable [36, 38].
The HAS adaptation algorithm, which deter-mines the video quality for the next segment re-quested by the client, is an active research topic.Initial ideas explored capacity-based approacheswhere the client monitors the rate of arriving videotraffic and selects the quality level based on a pre-diction of the available TCP bandwidth [32, 33, 39–42]. If the client predicts that available bandwidthmight decrease over the next segment time inter-val, it requests a lower quality segment. If the pre-diction suggests that conditions are improving theclient will ‘switch-up’ and request a higher qualitysegment. Other research, however, suggests that itis difficult for HAS to reliably predict available TCPbandwidth [33, 42–44]. In addition to variabilityof available bandwidth due to competing traffic inthe network or from changing wireless channel con-ditions, rate-limited applications can induce patho-logical behaviors due to complex dynamics betweenthe application and TCP’s congestion control algo-rithm [34]. The use of buffer-based adaptation hasbeen suggested to avoid the issues [36].
Evaluating a particular HAS design is challenging
5
due to the many factors that impact an end user’sperceived quality [45–47]. While the issue of assess-ing HAS quality of experience is intense study, theliterature does suggest that the following measuresare useful for evaluating HAS [33, 35, 45, 48, 49]:
• videoPlaybackRate: Attributes of the streamsuch as the resolution, pixel density, framerate as well as end device capabilities all de-termine the base quality of the video stream.This measure represents the average bitrateof the stream based on the rate (in Mbps)at which data is dequeued from the playbackbuffer. If the video player stalls, samples arenot recorded.
• adaptationRate: It has been shown that fre-quent adaptations and sudden changes to videoquality are distracting [48, 50]. This metriccounts the number of adaptations that occurduring the simulation time. The measure isnormalized to represent the rate of adaptationsper hour.
• rebufferTime: Buffer stalls have a significantimpact on perceived quality [45, 49]. Basedon the ratio of total time the player is stalledto the stream duration, this measure repre-sents the percentage of time that the playeris stalled.
• applicationBias: The system should providefair allocation. We focus primarily on the fair-ness allocated to groups of flows. This mea-sure computes the percentage above or belowthe expected max-min fair allocation.
We have developed a HAS traffic model for ns2.The HAS client issues an HTTP request to the HASserver for the next segment of video content. Theclient specifies the video quality of the segment.The HAS server receives the request and simplysends the amount of data based on the requestedsegment size and quality using the same TCP con-nection. Data that arrives at the client are placedin the client’s playback buffer. When the sessionstarts, the client requests back-to-back segments tofill the playback buffer to a configured level (2 seg-ments by default). Once this threshold is reached,the client video player starts and consumes one seg-ment of video data at a time.
When the video player requires a new segmentand the playback buffer holds less than one segmentof video data, the player moves to a stall state whereit remains until a configured number of segments
arrive (2 segments by default). The client adapta-tion algorithm is based on a previously publishedcapacity-based adaptation algorithm [40]. Eachtime the client issues a new segment request, it com-putes the ratio (µ as defined in equation 1) of thetime required to play a segment (referred to as themedia segment duration or MSD) to the downloadtime of the previous segment (referred to as thesegment fetch time or SFT).
µ =MSD
SFT(1)
The algorithm switches to the next higher qualitylevel if
µ > 1 + ε (2)
where ε is defined as
ε = max
{bri+1 − bri
bri,∀i = 0, 1, . . . , n− 1
}. (3)
The bri represents the encoded bitrate of the i’threpresentation where brn represents the highest bi-trate.
The algorithm assumes there is insufficient ca-pacity for the next segment at the current qualitylevel and switches to a lower quality rendition if
µ < γd. (4)
where γd is a threshold that determines the sen-sitivity of the algorithm to observed network con-gestion. We used the recommended value of 0.67.The adaptation will potentially switch down multi-ple quality levels to match the next request to anestimate of available bandwidth. The new bitrateis the highest bitrate for which
bri < µbc (5)
where bc represents the bitrate of the current seg-ment.
The client supports a configured maximum play-back buffer size. The client will not issue a newsegment request once the buffer is full. As pointedout in recent work, this algorithm can be improvedthrough more careful selection of γd and by comput-ing µ based on multiple SFT samples [51]. However,for the research presented in this paper, we chose touse a simple published adaptation algorithm. Theobjective of the HAS experiment is to explore theimpacts of different buffer management strategieson HAS performance.
6
3.1.2. VoIP performance metric
To assess the impact that high bandwidth appli-cations might have on low bandwidth, latency sen-sitive flows, we establish a VoIP performance moni-tor between a server node and a cable modem. Oneside of the flow, a ‘talker’ located on the VoIP servernode (in Figure 1), sends a stream of UDP traffic ina manner similar to a G.711 session to a ‘listener’located on the CM labeled VoIP client. We esti-mate the call quality (referred to as the R-value)using the technique described in [52]. The R-valueranges from 0 to 100. Toll quality requires an R-value of 70 or higher. The model assumes that two10 ms ‘chunks’ of digitized voice data are sent in anIP packet (of size 238 bytes) every 0.020 seconds.
3.1.3. Web performance traffic generator and met-ric
The web traffic model is based on well understoodbehaviors of web browsing users [53, 54]. The ns2simulation package provides extensive support forweb traffic models. The model includes a set ofweb servers (identified in Figure 1) and web brows-ing users. A variable number of CMs are configuredas web clients. Based on empirically derived distri-butions, these CMs periodically issue HTTP GETrequests to randomly selected servers. The modelis parameterized by user think times and web ob-ject sizes derived from heavy-tailed Pareto distri-butions.
We add an additional designated client and serverapplication flow whose response times are capturedto obtain the Web Response Time (WRT) metric.The designated client issues an HTTP GET and theserver replies by transferring a configured amountof data each iteration (referred to as the WRT ob-ject size). The time between iterations is also con-figurable. The client computes the response time(referred to as a web response time or WRT) asso-ciated with the request. The WRT client repeatedlydownloads the WRT object from the WRT server.Each iteration results in a WRT sample. At theend of the simulation we compute the average WRTstatistic.
3.1.4. Fairness metric
We use Jain’s Fairness Index (JFI) [55] andthe min-max ratio (MMR) to quantify fairness inachieved throughput among competing flows. TheJFI is a widely used assessment of how achieved re-source allocation differs from the desired outcome.
We assume that max-min fair throughput alloca-tion criterion is the desired fairness objective. Anallocation is max-min fair if it is not possible to in-crease the rate allocated to any user in the systemwithout decreasing the rate allocated to any otheruser who is receiving an already lower or equal rate[56]. It has been shown that packet scheduling al-gorithms that implement close approximations ofgeneralized processor sharing (GPS) [57, 58], suchas DRR packet scheduling [59], can achieve max-min fairness. In recent work [15], we have shownthat DRR packet scheduling also achieves max-minfair allocation in downstream D3.0 bonded channelenvironments when no channel is assigned to morethan one bonding group at a time.
Jain’s Fairness Index is computed as follows.Suppose there are n competing flows. Let xi = Ti/riwhere Ti is the achieved throughput of the i-thflow and ri is the expected outcome based uponthe max-min fair criterion. The JFI is defined as:
JFI =[∑n
i=1 xi]2
n∑n
i=1 x2i
, xi ≥ 0.
The min-max ratio is defined as:min {xi}max {xi}
. Both
indexes range from 0 to 1, with ideal fairness rep-resented by a value of 1.
3.2. Experimental Definitions
We map the three motivating questions posed inthe introduction to three sets of experiments:
3.2.1. Set 1
We examine fairness and application performanceresulting from the use of the AQM schemes underinvestigation.
3.2.2. Set 2
We explore implications of the use of differentservice tiers.
3.2.3. Set 3
We examine the ability of the schemes to dealwith unresponsive flows.
Table 1 identifies five experiments that are pre-sented in this paper. Set 1 consists of three differentworkloads while sets 2 and 3 each consist of a vari-ation on the BASE workload of set 1. To betterevaluate the effectiveness of the recently proposedschemes, CoDel and PIE, we compare their per-formance with three non-AQM techniques and oneolder approach to AQM.
7
The DT queue manager employs a singlequeue with first-come-first-served (FCFS) schedul-ing discipline that drops packets arriving to afull queue. The DT queue capacity is set toQUEUE CAPACITY (2048) full size packets.
DT20 is also a FCFS drop-tail queue managerbut configured in a way as be better compared toCoDel and PIE. Its queue capacity is constrainedto 65 full size packets which corresponds to a max-imum queuing delay of approximately 20 ms, thetarget queuing delay for our CoDel implementation.The DT20 queue manager is used in the BASE ex-periment to assess the benefits that accrue from theadditional complexity of CoDel and PIE.
The DRR queue manager employs one queue perflow and deficit round robin scheduling. Capacityof each queue is set to one-tenth of the capacity ofthe DT queue. Thus the total queue size is com-parable. DRR is known to provide max-min fairallocation of channel capacity. Thus, results per-taining to throughput sharing and fairness are notof particular interest. Interest in packet loss rateand impact on latency sensitive traffic motivatesthe inclusion of DRR results.
The ARED queue manager is a simple extensionto RED that adapts maxp such that the averagequeue level tracks a target queue level (we used therecommended target of (minth + maxth)/2.
Configuration parameters are based on recom-mendations from [20]. The minth and maxththresholds are the QUEUE CAPACITY divided by20 and by 2 respectively. The control interval pa-rameter is 0.50 seconds. The initial setting of maxpis 0.10.
The original CoDel description recommends atarget delay parameter set to 0.005 seconds [4]. Wedetermined that a setting of 0.020 seconds providedmore predictable results in our scenarios, especiallyin scenarios that involved a small number of highspeed TCP flows. The interval parameter is setto 0.100 seconds. The original CoDel algorithmproactively drops packets at dequeue time. Due topotential implementation issues of head droppingraised by DOCSIS community, we implemented atail drop variant of CoDel where packets are proac-tively dropped at enqueue time. Our implementa-tion is based on an ns2 tail-drop variant of CoDelcontributed by CableLabs. PIE is another delay-based AQM and is described in [10]. The D3.1specification [2] provides recommended algorithmconfiguration settings for a CM running PIE. Weuse the default settings described in [10] for the
Table 1: Experiment Definition
Set Experiment Summary
1 BASE Varies the number of compet-ing downstream FTP flows alongwith a low bitrate VoIP flow fordifferent simulation runs; no ser-vice rate limit.
HAS Same as BASE except addingfive HAS flows
WEB Runs 5 FTP flows with variednumber of web flows ranging from10–80
2 TIER Same as BASE except: 1) Set-ting a service rate of 6 Mbps forall flows (referred to as Tier-1flows); 2) Adding one additionalcompeting FTP flow with a ser-vice rate of 12 Mbps. We refer tothis flow as a Tier-2 flow.
3 UDP Same as BASE except adding a12 Mbps downstream UDP flow(starts at 500 seconds, stops at1500 seconds). No service ratelimit.
algorithm run on CMTS. We set the target delayparameter to 0.020 seconds and the Tupdate (fre-quency of update) parameter to 0.030 seconds. Themax burst parameter is 0.100 seconds. The inter-nal burst control parameters, α and β, are set to1.25 and 0.125 respectively.
The results of our simulation studies are pre-sented in the next three sections of the paper. Eachsection addresses one of the three questions posedin the introduction. First, we evaluate how effec-tively each AQM maintains throughput fairness andapplication performance in scenarios that do not in-volve service rate limits. Next, we analyze the in-teraction of service rate management with AQM.Finally, we evaluate the ability of AQM to protectresponsive flows from unresponsive ones.
4. Throughput Fairness and ApplicationPerformance
In this section we describe the results of the threeexperiments shown in Table 1 as set 1. The objec-tive of the BASE experiment is to evaluate theeffectiveness of the AQM schemes with respect tobandwidth utilization, throughput fairness and iso-lation of low bandwidth flows having low latencyrequirements.
8
4.1. BASE simulation results
Experiment BASE employs a varying numberFTP flows ranging from one to eleven along witha single VoIP flow. The flows compete for a to-tal available bandwidth of 38 Mbps. The simula-tion time for each simulation is 2000 seconds. TheVoIP performance metric flow starts at time 0.0seconds. Each simulated FTP flow starts at a ran-dom time within the range of 0.0 to 2.0 secondsand has a unique uncongested path RTT. The pathRTTs increase with the number of flows. For i ∈{0, 1, .., 10}, the path RTT of flowi is 30 + 10i ms.Therefore, the average uncongested RTTs for the 6load levels with {1, 3, .., 9, 11} FTP flows are 30, 40,50, 60, 70 and 80 ms.
4.1.1. Bandwidth Utilization
Table 2 summarizes the throughput achieved bythe FTP flows. The total throughput was 37.4Mbps in all but eight of the thirty-six simulationsrun. Throughput is marginally less for CoDel andPIE when the number of flows is small becausethe limited amount of buffering can cause the TCPpipeline to stall and, when combined with a smallnumber of flows, loss of throughput results. Ag-gregate throughput for DT20 never reaches 37.4,demonstrating that the more complex queue man-agement algorithms of CoDel and PIE do providevalue. When a sufficient number of flows are active,all queue management mechanisms except DT20produce the same aggregate bandwidth utilization.
The standard deviation reflects the magnitudeof the variation in the throughput achieved by thecompeting flows. Since DRR is known to be max-min fair, the absence of variation is to be expected.For the other queue management techniques, thevariation is proportional to the number of flows andinversely proportional to queue capacity. A moredetailed analysis of the factors underlying the vari-ation in observed throughput will be presented inthe discussion of fairness.
Table 3 shows the mean and standard deviationof the loss rate experienced by the FTP flows foreach simulation. The lost rates are expressed asa percentage and peak at only 0.245% (Approxi-mately 25 packets out of every 10000 are lost.) Weconclude that in all cases TCP is adapting verywell to the available bandwidth and buffer space.Not surprisingly, marginal increases in loss rate areagain proportional to the number of flows and in-versely proportional to queue capacity. When the
number of flows exceeds one, DT20 produces sig-nificantly higher loss rates than CoDel and PIE. Aspointed out in [60], it is possible to tune the param-eters of RED (or ARED in our case) to match thebehavior of CoDel and PIE, as long as the channel’sbit rate stays constant. However, in the presence ofadaptive modulation and dynamic channel bondingin networks such as wireless or DOCSIS 3.1, ARED,as currently defined, would not be able to maintaina target queue delay.
Table 4 shows the average RTT experienced bythe TCP packets of the FTP flows. The reportedRTT is the sum of the inherent path delay and thequeuing delay. For the 11 flow case, the mean inher-ent path delay is 80 ms. Therefore, mean queuingdelay can be inferred by subtracting 80 ms fromthe values shown in the 11 flow column. We ob-serve that PIE, CoDel, and DT20 maintain RTTvalues consistent with the target of 20 ms. ARED’squeue latency ranges from 45 ms to 60 ms as thenumber of competing flows increase.
The DT results show a constantly high RTT re-gardless of the number of competing flows. Sincethe maximum allowed TCP window is configured tobe larger than the queue capacity, the queue lengthis limited only by the QUEUE CAPACITY.
The DRR results reflect individual queue capac-ities that are 1/10 of the QUEUE CAPACITY.Therefore, when there are n flows with full queues,DRR queuing delay is the sum of the inherent pathdelay and n×QUEUE CAPACITY / 10.
We briefly consider the statistical accuracy of theresults associated with the BASE experiment. Weran five independent replications with nine activeTCP flows. The 95% confidence intervals for theaverage throughput, loss rate, and RTT are shownin Table 5. The widths of the confidence intervalswere no more than 0.002 Mbps for throughput forall queue management schemes and no more than0.2 ms in RTT for all three AQMs.
Given the synchronization and lockout issues thatare associated with DT, we ran the DT simulation 5times with different random seeds and involving dif-ferent number of FTP flows. The results are givenin Table 6.
4.1.2. Throughput fairness in the BASE experi-ment
Figure 2 shows the throughput fairness results.These results are consistent with the standard de-viation values previously discussed. The JFI resultsconfirm that DRR is approximately max-min fair.
9
Table 2: Experiment BASE TCP Throughput: Mean / Stddev / Sum (Mbps)
Figure 2: Experiment BASE throughput fairness results.
The figure also shows that at high loads DT20 ex-hibits the highest level of unfair allocation. CoDeland PIE are significantly fairer but still worse thanthe others. Furthermore, it is apparent that unfair-ness is increasing with the number of flows for allqueue management schemes other than DRR.
We ran additional ARED, CoDel and PIE simu-lations extending the number of competing flows to50 and we observed the fairness continue to deteri-orate. The JFI results for ARED, CoDel, and PIEwith 50 competing flows were 0.75, 0.60, and 0.62respectively.
Nevertheless, the underlying cause of the unfair-ness is not the increase in the number of flows per se.Instead, it is primarily a function of the disparity inuncongested RTTs. Table 7 shows the throughputof each of the individual FTP flows for an 11 flowexperiment in one BASE simulation. The uncon-
Table 8: JFI of BASE with Same Path RTT
#FTPs 1 3 5 7 9 11
DRR 1.00 1.00 1.00 1.00 1.00 1.00
DT 1.00 0.96 0.97 0.95 0.99 0.98
DT20 1.00 1.00 1.00 1.00 1.00 1.00
ARED 1.00 1.00 1.00 1.00 1.00 1.00
CoDel 1.00 0.99 1.00 1.00 1.00 1.00
PIE 1.00 1.00 1.00 1.00 1.00 1.00
Table 9: MMR of BASE with Same Path RTT
#FTPs 1 3 5 7 9 11
DRR 1.00 1.00 1.00 1.00 1.00 1.00
DT 1.00 0.66 0.61 0.50 0.75 0.63
DT20 1.00 0.93 0.96 0.89 0.92 0.92
ARED 1.00 0.86 0.95 0.91 0.88 0.92
CoDel 1.00 0.83 0.95 0.94 0.95 0.93
PIE 1.00 0.92 0.92 0.96 0.92 0.92
gested path RTTs for individual flows are given inthe bottom row. It can be seen in this table thatthe achieved throughput for an individual flow un-der AQM management is inversely proportional (ina non-linear way) to its path RTT.
This is in agreement with the model proposed byMathis [61]. TCP/RTT unfairness is in large mea-sure to the fact that achieved throughput dependson factor of 1/RTT. The result is that TCP flowshaving shorter RTT paths can starve longer pathflows of buffer resource at a bottleneck. Each DRRflow has a dedicated amount of buffer resource,and this completely eliminates buffer starvation ofone flow by another. The DT flows have a largeQUEUE CAPACITY shared buffer resource whichmitigates the effect. Because of the parameters cho-sen, the ARED flows also had more effective buffercapacity (as evidenced by their longer RTTs) thandid CoDel and PIE and therefore less unfairness dueto buffer contention.
To confirm the conjecture that buffer contentionwas the root cause of the unfairness, we ran ad-ditional simulations (these results are not shown)with the target delay parameter for CoDel and PIEset to a value commensurate with observed AREDqueuing delays. The fairness results are consistentwith those of DT and ARED.
To further explore the effect of path diversity onfairness, we ran a modified BASE simulation withall FTP flow paths set to the 80 ms mean RTT ofthe original BASE simulation. The fairness resultsare given in Table 8 and Table 9. Except for DT,
the fairness results for all schemes improve across allworkloads. In addition, the allocation is not shownto be less fair as the workload increases when RTTdoes not vary.
We then ran another modified BASE simulationwhere we kept the number of FTP flows fixed at7 and varied the RTT range. The mean RTTwas fixed at 100 ms and individual RTTs differedby step where step ∈ {5, 10, 15, 20, 25}. For ex-ample, when step = 5, the individual RTTs are{100, 95, 105, 90, 110, 85, 115}. Therefore, the totalRTT range for each experiment is 6× step.
The results as shown in Figure 3 clearly indicatethat the AQMs under investigation become less fairas the range of RTTs widens. We conclude pathRTT diversity has an adverse impact on throughputfairness under AQM.
4.1.3. Flow isolation
Having addressed the impact of AQM on overallthroughput and fairness we now turn to flow iso-lation. We do this by analyzing the behavior ofthe simulated simplex VoIP stream that is sent inparallel with the FTP transfers of the BASE ex-periment. The stream is sent from a source outsidethe cable network to a sink attached to a simulatedcable modem, and it is implemented as a simulatedUDP flow in which two 10 ms ‘chunks’ of digitizedvoice data are sent in an IP packet of size 238 bytesevery 0.020 seconds.
The results are summarized in Table 10. Thelatency is average one-way latency experienced bythe simulated VoIP packets. The mean loss rateexperienced by the VoIP flow is of the same orderof magnitude as those of the FTP flows which areshown in table Table 3. As would be expected,the VoIP loss rates under AQM are generally largerthan the higher bandwidth FTP flows. It is also thecase that the disparity between FTP and VoIP loss
0.5
0.55
0.6
0.65
0.7
0.75
0.8
0.85
0.9
0.95
1
40 60 80 100 120 140
Fai
rnes
s (J
FI)
RTT Range - Difference Between Lowest and Highest RTTs (ms)
DRRDTDT20AREDCoDelPIE
(a) Jain’s Fairness Index
0
0.2
0.4
0.6
0.8
1
40 60 80 100 120 140
Fai
rnes
s (M
MR
)
RTT Range - Difference Between Lowest and Highest RTTs (ms)
DRRDTDT20AREDCoDelPIE
(b) Min-Max Ratio
Figure 3: BASE fairness results for 7 FTP flows with variedRTT ranges.
rates is consistently larger for CoDel than it is forPIE. Furthermore, DT20 yields lower loss rates andhigher R-values than either CoDel or PIE across theboard. The reasons for these disparities are yet to
12
Table 10: Experiment BASE VoIP Isolation Performance (Mean Latency / Mean Loss Rate (Percentage) / R-Value)
be fully understood.The R-value for DT drops quickly from 41 to 33
as the number of competing FTP flows increasesfrom 1 to 11. The main factor contributing to thepoor R-values is the large latency experienced bythe VoIP flow with DT managed queues. DT20, fol-lowed by CoDel and PIE, provides the lowest VoIPpacket delays.
In additional simulations, we found that the R-value remains reasonably high. When the numberof competing FTP flows was increased from 50 to90, the R-values varied from about 88 to 69 forARED, CoDel, and PIE with slight differences.
4.2. HAS simulation results
We evaluate HAS video performance under dif-ferent AQM schemes when the video streams aresubject to competing greedy FTP flows. Experi-ment HAS involves five HAS flows along with avaried number of FTP flows for different simula-tion runs. As previously noted, TCP throughput isinversely proportional to path RTT. To make theHAS and FTP allocation results more comparable,the mean uncongested path RTT of the HAS flowsand of the FTP flows are set to 80 ms in all experi-ments. The five HAS flows have path RTT’s of {80,70, 90, 60, and 100 ms}. The path RTT of the firstFTP flow is also 80 ms, and when additional flowsare added, the path RTTs follow a similar patternas that of the HAS flows.
For the results presented in this paper, we usedthe following configuration settings:
• Playback buffer capacity: 240 seconds.
• Segment size: 4 seconds.
• Set of bitrate representations (in Mbps): {0.5,1.0, 2.0, 3.0, 4.0, 5.0}• TCP specific configuration: we use the ns2
simulator’s TCP/FullTCP/Sack model withsimilar settings to what was used in the otherexperiments described in this paper.
During the startup phase, the client makes back-to-back requests until the buffer threshold (2 seg-ments) is reached. The client then enters a steadystate where it periodically (every segment time) is-sues a new segment request. As an example, con-sider an uncongested scenario involving a singleHAS flow and no FTP flows, once the HAS clientreaches steady state, it requests a maximum qual-ity segment (which is 2.5 Mbytes) every 4 secondswhich corresponds to the maximum bit rate of 5.0Mbps that HAS is configured to consume. Now sup-pose that the new segment arrives 1.07 seconds af-ter the request is sent. Then ε is 4/1.07 = 3.74 andthus the estimated availible capacity is 5.0 × 3.74or 18.7 Mbps. This capacity estimate underesti-mates the actual available capacity (38 Mbps) bymore than a factor of two. The estimate is low inpart because the TCP stack resets the TCP con-gestion window after the application has been idlefor one retransmission timeout period (which hap-pens each on/off cycle). This is a known issue withrate-limited applications [34, 44, 62].
Table 11: Experiment HAS Throughput Efficiency
#FTPs DRR DT ARED CoDel PIE
1 88% 76% 88% 83% 84%
3 96% 96% 96% 94% 94%
5 96% 96% 96% 95% 95%
7 96% 96% 96% 95% 95%
9 96% 96% 96% 95% 96%
11 96% 96% 96% 95% 96%
Table 11 shows the percentage utilization of thedownstream channel for each experiment. The re-sults show that in all cases except for simulationsinvolving 5 HAS flows and 1 FTP flow, the channelutilization is at least 94%. CoDel and PIE exhib-ited a utilization 1-2% lower than that of AREDand DRR.
It is challenging to create meaningful throughputfairness comparisons between the HAS and FTPworkloads for several reasons. First, the maximum
13
application layer demand of each HAS applicationis self-limited to 5.0 Mbps while each FTP appli-cation has unbounded application layer demand.Second, when congestion occurs HAS responds byfurther reducing its application layer demand whileFTP does not. Furthermore, when few FTPs areactive, the applications can interact with AQM insuch a way that considerably less than full utiliza-tion of the 38 Mbps downstream channel is actuallyachieved. Finally, there are unwanted dynamics be-tween HAS and TCP control algorithms. Never-theless, comparing the average FTP flow allocationand the average HAS flow application to what onewould expect from a max-min fair allocation doesprovide insight in these dynamics.
The average throughput for FTP and HAS ap-plications as well as the applicationBias is shownin Table 12. For all buffer management schemes,the throughput achieved by both FTP and HAS de-creased as the number of competing flows increased.
The applicationBias metric is the percentageabove or below the max-min fair allocation of thebandwidth that was actually consumed in the ex-periment (as opposed to the nominal channel band-width of 38 Mbps.) The expected max-min fair al-location for a HAS flow is based on a demand of5 Mbps, which is the highest HAS encoded videobitrate. Using the low congestion scenario (1 FTPflow and 5 HAS flows) as an example, Table 11 indi-cates that the consumed bandwidth under DRR is88.3% of the 38 Mbps. The max-min fair allocationof the 33.5 Mbps actually consumed under DRR is5 Mbps for HAS and 8.55 Mbps for FTP. Consumedbandwidth under CoDel was significantly lower andmax-min fair allocation is 5 Mbps for HAS and6.6 Mbps for FTP. For the CoDel results the ac-tual FTP throughput was 8.17 Mbps and the av-erage HAS throughput was 4.69 Mbps. The HASapplicationBias is (4.69−5.00)/5.00 or −6.3%. Forthe scenario involving 5 FTP and 5 HAS flows,under CoDel, the actually consumed bandwidth is36.1 Mbps. So the max-min fair allocation is 3.6Mbps for all flows. In this case, for CoDel, theHAS applicationBias is (3.1− 3.6)/3.6 or −13%.
In all cases the allocation favored FTP. The re-sults indicate that only DRR consistently improvedthe HAS allocation outcome as the network becamecongested. For PIE and CoDel, the allocation out-come actually became worse (i.e., applicationBiasexperienced by HAS flows grew further negative)as the load increased.
Table 13 indicates the HAS performance metrics.
Table 13: HAS Performance Metrics (videoPlaybackRate /adaptationRate)
#FTPs 1 5 11
DRR 4.7 / 9 2.8 / 5 2.0 / 3
DT 3.7 / 32 1.9 / 56 0.9 / 53
ARED 4.7 / 35 2.9 / 91 1.8 / 150
CODEL 4.4 / 50 3.0 / 165 1.8 / 216
PIE 4.6 / 44 3.1 / 101 1.8 / 154
The rebufferTime results (not shown) was 0 in allsimulations. The results show that AQM signifi-cantly improves HAS performance compared to DTbased on the videoPlaybackRate metric. Amongthe three AQMs, the videoPlaybackRate resultswere very similar. The results suggest that CoDelleads to higher HAS adaptationRate than the otherAQMs. We have observed that PIE is less tol-erant of bursts and consequently during times ofheavy congestion does maintain the target queuelatency generally more reliably than CoDel. Weconjecture that differences in the AQM’s burst tol-erance behavior contribute to the observed differ-ence with the adaptationRate metric. However, itis likely that changing AQM configuration param-eters would alter the behavior. Therefore, furtherstudy is required before we can draw any conclu-sions.
The absence of rebuffering events is largely dueto relatively static workloads (a small number of es-tablished TCP flows) and to a large playback buffercapacity. In additional simulations not included inthe paper, we run the scenarios using a version ofHAS that does not adapt. Instead, the client alwaysrequests highest quality segment (we refer to thisalgorithm as max-always). The videoPlaybackRatein all cases is 5.0 Mbps which represents the high-est quality. In this scenario, all buffer managementschemes exhibit frequent stalls. The CoDel and PIErebufferTime results were similar with the percent-age of time spent stalled ranging from 0% (with 5HAS and 1 FTP flow) to 53% of the time (with 5HAS and 11 FTP flows).
The work in [34] shows that HAS is prone to a’spiral down’ effect where it is possible for a HASflow to be ’beaten down’ by competing greedy TCPapplication flows. In this situation, the HAS flow islikely to remain at the lowest bitrate quality levelto oscillate across the lowest quality levels. In ourresults, the applicationBias metric shows evidencethat aspects of this effect are present. Primarilydue to relatively well behaved dynamics, the system
14
does not suffer the full spiral-down effects observedin [34].
4.3. WEB simulation results
The experiment WEB explores the impact of thedifferent queue management schemes in scenariosthat involve a mix of downloads of web objects ofvarying size and FTP traffic. Five greedy FTP flowsare run in parallel with a varied number of simu-lated web flows. For five FTPs, the uncongestedRTTs are 30, 40, 50, 60, 70 (as in the BASE). Thenumber of web flows ranges from 10 to 80, and forthe web flows, the uncongested RTTs cycle in thesame pattern as: 30, 40, 50, 60, 70, 30, 40, 50, 60,70, ... .
The parameters of the web traffic model, derivedfrom [63], include user and session attributes de-signed to reproduce the variability inherent in webtraffic. The web sessions start randomly within thefirst second of the simulation. The inter-page timeis set to a Pareto distribution with mean and shapeequal to 5 and 2.0 respectively. The objects per pageis set to Pareto distribution with mean and shapeequal to 4 and 1.2 respectively. The inter-objecttime is set to Pareto distribution with mean andshape equal to 0.5 and 1.5 respectively. The objectsize in KB is set to Pareto distribution with meanand shape equal to 20 and 1.5. Both of these sets ofparameters produce distributions with infinite vari-ance. Therefore, it is difficult to obtain repeatableestimates of statistics such as mean response timewith simulations of practical duration.
It should be noted that models such as Feld-mann’s no longer properly characterize the trafficgenerated by browsing commercial web sites. Theobjects at such sites typically contain many em-bedded links to different advertising sites that arenot co-located with the primary page. The objectsloaded via the embedded links commonly containa mix of text, images, audio, video, and possiblyeven additional embedded links. Modeling trafficof this type is well beyond the scope of this paper.Feldmann’s model is designed to model browsing ofa non-commercial document collection in which theuser may download citations, abstracts, or full textof scientific papers of various sizes.
Therefore, as described in the Methodology sec-tion, the WRT metric reflects the response timeexperienced by an additional designated web clientin requesting and receiving a web object of a par-ticular size. By default, the WRT object size is20 KB, and the think time before the next request
3
4
5
6
7
8
10 20 30 40 50 60 70 80
Ave
rage
FT
P T
hrou
gpu
t (M
bps)
Number of Competing Web Flows
DRRDTAREDCODELPIE
Figure 4: WEB Simulation Average FTP Throughput
is issued is 10 seconds. The range of uncongestedpath RTTs for both the web browsing flows andthe competing FTP flows is between 30 and 70 ms.The designated flow for which the WRT metric iscomputed has an uncongested path RTT of 50 mswhich is the mean of the RTTs of the competingtraffic.
Figure 4 shows the average throughput achievedby FTP flows as the number of web browsing flowsincreases from 10 to 80. Although not shown, themean bandwidth demand of a single web flow is0.13 Mbps and the total observed bandwidth con-sumption of the web flows ranges from 1.3 to 10.3Mbps for all schedulers except DT. In a max-minfair allocation of the available 38 Mbps, each webflow should receive its entire demand and the 5FTP flows should divide the remainder. It canbe observed in Figure 4 that this is approximatelythe case for all schedulers except DT. For example,when there are 80 web flows, the web flows consumean average of 0.129 Mbps and the 5 FTP flows con-sume approximately 5.2 Mbps each. This indicatesthat the 36.3 Mbps of consumed bandwidth is fairlydivided between the web and FTP traffic.
The DT allocation of slightly more than 6 Mbpsto the FTP flows demonstrates the well knownresult that with unmanaged queues greedy flowsprevent less greedy ones from obtaining their fairshares.
Table 14 provides the WRT results for the experi-ment. As shown, AQM schemes are able to supporta range of low bandwidth web flows with consis-tently low web response time. TCP slow-start re-quires multiple RTTs before the 20 KBytes of datais successfully received by the WRT client. As the
15
0
2
4
6
8
10
12
14
32 64 128 256 512 1024 2048
Web
Res
pons
e T
ime
(sec
onds
)
Web Object Size (KB)
DRRDTAREDCODELPIE
Figure 5: WEB Simulation WRT Results for Varied ObjectSizes
number of web flows increase, there is significantincrease in WRT only with the DT queue manager.
In a separate WEB experiment, we explore howthe different queue management techniques mightimpact the web response times as the WRT ob-ject size increases. The scenario involves 5 FTPflows that compete with 50 web flows based on theweb traffic model. Unlike the previous WRT ex-periment, we vary the WRT web object size from32 KBytes to 2048 KBytes. The WRT results areshown in Figure 5. As expected, the web responsetime increases along with the web object size. Thebest mean response time was obtained by DRR,and the worst by DT. DT response was also quitesensitive to stochastic effects. In one test, five inde-pendent replications of the DT simulation producedmean response times of 6.8, 8.9, 8.2, 6.7, and 6.2seconds. In contrast, the mean response times pro-duced by ARED, CoDel, and PIE had small varia-tion.
5. Implications of Service Rate Management
The objective of the TIER experiments is to ex-plore the impact of the different queue managementschemes on subscribers having different maximumservice rates. A varying number of Tier-1 FTPflows, each having a service rate of 6 Mbps, com-pete with a single Tier-2 FTP flow having a servicerate of 12 Mbps on a single downstream channel.The uncongested path RTT of the Tier-2 flow is setto 80 ms which is also the mean uncongested RTTof the Tier-1 flows. Individual RTTs of adjacent
0
2
4
6
8
10
12
0 500 1000 1500 2000
Thr
ough
put (
Mbp
s)
Simulation Time (Seconds)
CODEL
During the interval 500 - 1500 seconds:
Tier 1 flow throughput mean/std: 3.49/0.59
Tier 2 flow throughput mean/std: 3.77/0.72
Tier 1 FTP Flow (selected)Tier 2 FTP flow
Figure 6: TIER simulation results with CoDel (1 Tier-2 flowcompeting with 9 Tier-1 flows)
Tier-1 flows vary according to the pattern {80, 70,90, 60, 100, ....}.
Figure 6 illustrates the observed behavior of nineTier-1 flows competing with the single Tier-2 flowunder CoDel scheduling. The Tier-1 FTP flows runfor the entire simulation time of 2000 seconds, butthe Tier-2 flow is active only from time 500 to 1500seconds. Each data point plotted represents mea-sured throughput during an interval of ten seconds.The Tier-1 flow with 80 ms uncongested RTT isshown in red, and the Tier-2 flow in blue. Dur-ing the time period when the Tier-2 flow is active,the throughput of the selected Tier-1 flow and Tier-2 flow are 3.49 Mbps and 3.77 Mbps respectively,and the Tier-2 flow displays higher variability. Theweighted max-min fair allocation is 3.45 Mbps forthe Tier-1 flows and 6.9 Mbps for the Tier-2 flow.The unweighted max-min fair allocation is 3.8 Mbpsfor all flows. These results illustrate that singlequeue AQM will not support differentiated servicebased on tiers. Whether or not this outcome isdesirable, depends on one’s perspective. From theperspective of the Tier-2 customer, this is clearly abad outcome and conversely so for the Tier-1 cus-tomer.
The second TIER experiment is designed toshow the allocation to the different tiers achieved bythe different queue management schemes. A vary-ing number of Tier-1 flows compete with a singleTier-2 flow for the entire simulation.
Table 15 summarizes the average allocationachieved by all Tier-1 flows and the allocationachieved by the Tier-2 flow. Simulations involv-ing 1 and 3 competing Tier-1 flows are not shown
16
Table 15: TIER Flow Average Throughput Allocation(Mbps)
# Tier-1FTPFlows
5 7 9 11
Tier(Mbps)
6 12 6 12 6 12 6 12
Max-min 6.0 8.0 4.75 4.75 3.8 3.8 3.17 3.17
WMax-min
5.4 10.8 4.2 8.4 3.45 6.9 2.9 5.8
DRR 5.9 7.8 4.7 4.7 3.7 3.7 3.1 3.1
DT 5.9 8.1 4.5 6.0 3.5 5.5 3.1 3.3
ARED 5.7 8.7 4.7 4.8 3.7 3.8 3.1 3.0
CoDel 5.8 7.9 4.6 5.4 3.7 3.7 3.1 2.9
PIE 5.7 8.4 4.6 4.8 3.7 3.7 3.1 2.8
as these reflect uncongested conditions, and the ex-pected tiered allocations are achieved in all cases.
As expected, DRR provides an unweighted max-min fair allocation. DT consistently allocates morebandwidth to the Tier-2 flow. The AQMs supportstiered allocation in a load dependent way. As theload increases, the average flow bandwidth alloca-tion by various AQMs for both tiers converges ap-proximately to unweighted max-min fair allocation.In the case of 11 Tier-1 flows, all AQMs allocateless bandwidth than its max-min fair share to theTier-2 flow. This anomaly is due to the non-linearnature of the RTT penalty. Recall that the Tier-1throughput is the average of flows having uncon-gested RTTs ranging from 30 to 130 ms while theTier-2 throughput is that of a single flow.
Table 16: TIER Flow Average Throughput Allocation(Mbps) with 4-channel Bonding Group
# Tier-1FTPFlows
5 7 9 11
Tier(Mbps)
24 48 24 48 24 48 24 48
Max-min 24 32 19 19 15.2 15.2 12.7 12.7
DRR 23.7 31.7 18.7 18.8 15.0 15.0 12.5 12.5
DT 23.1 34.6 18.0 24.2 14.3 20.9 12.0 17.5
ARED 23.2 34.0 18.4 21.4 15.2 13.5 12.5 12.5
CoDel 23.1 31.3 18.5 20.0 15.1 14.1 12.6 11.5
PIE 22.9 33.1 18.5 20.2 15.1 14.3 12.6 10.9
DOCSIS 3.0 supports channel bonding to pro-vide fat data pipes. A bonding group as deployedin the field often involves 4 to 8 downstream chan-nels bonded together. Such fat pipes can support
0
5
10
15
20
25
30
35
40
0 500 1000 1500 2000
Thr
ough
put (
Mbp
s)
Simulation Time (Seconds)
PIE
Mean = 11.9
Sum of All FTP FlowsUnresponsive UDP Flow
Figure 7: Experiment UDP Results with PIE
higher service rates and tiers. We run TIER with a4-channel bonding group. We set the Tier-1 servicerate to 24 Mbps and the Tier-2 service rate to 48Mbps. To adjust for the increased bandwidth-delayproduct, we increase the QUEUE CAPACITY andTCP window size by a factor of 4. Again forthe uncongested scenarios (i.e., those involving1 and 3 competing Tier-1 flows), our simulationresults show each flow receives a throughputequal to its service rate. For congested scenarios,Table 16 shows the results of this simulation. Theresults show our previous conclusions for the singlechannel case still hold for the channel bonding case.
6. Management of Unresponsive Flows
To evaluate how effectively the AQM schemes un-der investigation manage unresponsive flows, exper-iment UDP runs a varying number of FTP flowsalong with an unresponsive UDP CBR flow. Fig-ure 7 illustrates the results using PIE queue man-agement in a UDP simulation in which 9 FTP flowscompete with an unresponsive UDP CBR flow fora total available bandwidth of 38 Mbps. The UDPflow was configured to send 1500 byte packets at aconstant rate of 12 Mbps during the time period 500to 1500 seconds of the 2000 second simulation. Noservice rate limitations were imposed. As shown,the unresponsive flow was allocated almost its to-tal demand of 12 Mbps by PIE and the FTP flowswere allocated the remaining bandwidth. For allother schemes, only DRR correctly allocates equalshare (about 3.7 Mbps) to all flows during the timeperiod when the UDP flow was active. The results
17
for DT, ARED, and CoDel were very similar to thePIE result shown in Figure 7.
We conclude that single queue managementschemes including the AQM schemes evaluated hereare not effective in preventing unresponsive flowsfrom consuming more bandwidth than their fairshares during the time of congestion.
7. Conclusion
The focus of this paper has been upon the ef-fects of downstream queue management in DOCSIScable environment. We have considered workloadsconsisting of FTP, HTTP-based adaptive stream-ing (HAS), web browsing, and unresponsive UDPtraffic. Our analysis also considered scenarios withand without imposition of service rate limits. Weexplored fairness and application performance ob-tained with four single queue packet schedulingdisciplines: FCFS drop tail (DT), Adaptive RED(ARED), CoDel, and PIE. We also included re-sults obtained with multi-queue DRR as a referencepoint for our analysis.
The clearest result is the undesirability of the useof drop tail queue management in conjunction witha large unmanaged buffer pool. The effects of theresulting bufferbloat included poor flow isolation,very high latency, and unpredictable allocation ofbandwidth to competing flows.
Our ARED results differ from CoDel and PIE inlarge part due to our choice of parameter settings.For all AQMs, we attempted to use recommendedsettings. Nevertheless, it is possible to configureARED to behave in a manner similar to CoDeland PIE when channel capacity is known a prioriand not subject to changes due to factors such asadaptive modulation or dynamic changes to chan-nel bonding groups.
We briefly summarize our conclusions by address-ing the three motivating questions raised in the in-troduction and then provide a statement of nextsteps.
1) How effective are CoDel and PIE in realisticcable network scenarios?
The schemes are quite effective at maintainingthe target queue delay. This in turn provides iso-lation between responsive flows in the scenarios weexplored. Both CoDel and PIE exhibited similar re-sults in all of the experiments, and even as the levelof congestion became very high, both were able toprovide strong flow isolation.
All schemes except DRR are shown to not al-locate bandwidth fairly in the presence of hetero-geneous RTTs. However, the principal cause ofthe unfairness is TCP’s well known bias towardsshort-RTT connections. Nevertheless, delay-basedAQMs such as CoDel and PIE are particularly sen-sitive to RTT induced unfairness issue when com-pared to other queue management schemes that al-low sustained large queues. When a buffer bloatedqueuing point causes 100’s of milliseconds of packetdelay, the fairness outcome of competing TCPflows that might have uncongested path delays ofa fraction of this are less sensitive to TCP RTT-based unfairness. When delay-based AQM removes‘bufferbloated’ queues, differences in uncongestedpath delays have more of an impact on TCP per-formance. Nevertheless, it should be noted thatthroughput fairness is not a primary objective ofdelay-based AQMs.
2) Are there undesirable side effects when AQMinteracts with tiered service levels?
We observed a range of behaviors among theAQM schemes. When different service tiers com-pete for bandwidth during periods of the conges-tion, the impact upon tiered service is dependentupon the severity of the congestion. When the sys-tem is not loaded or slightly loaded, the AQMsdo allocate more bandwidth to the higher servicetier flows. As the load continues to increase, wesee that the allocations for different tier flows tendto converge. As congestion increases, a higher tierflow can be more aggressively targeted by an AQMscheme because the regulator allows its packets toreach the queue at a higher rate than those of thelower tier.
3) How effectively do the schemes isolate respon-sive traffic from unresponsive flows?
An inherent problem with the single queueschemes is that they cannot effectively manageunresponsive flows. This is a huge challengenetwork operators have to address. One of ournext steps includes addressing this problem witha multiple queue solution that can also meet theconstraints of CMTS vendors.
Our results suggest that there is a trade-off in-volved with single queue management mechanismsbetween the goals of managing fairness and man-aging application performance. Current practicetends to favor application performance over fair-ness. This may not be acceptable in emergingconverged broadcast networks where a larger per-
18
centage of subscribers view content from video-on-demand providers located in the Internet. For ex-ample, our results indicate that content providersthat physically locate content closer to the sub-scriber might be allocated a larger share of accessnetwork resources (during periods of congestion)compared to a content provider that does not lo-cate content at the access network. While this re-sult is common to all buffer management methods,delay based AQM exacerbates this issue in certaincircumstances primarily because bufferbloat effectsserved to mask the issue.
Since our experiments made no use of new DOC-SIS features such as dynamic channel bonding, webelieve that our results are applicable to any sys-tem in which a head-end device or router managesa single shared medium downstream channel. Inpractical terms, the only networks of this type inwidespread use at present are cable networks andsome wireless networks such as WiMax and WiFi(operating in infrastructure mode).
References
[1] Cable Television Laboratories, Inc., Data-Over-CableService Interface Specifications: DOCSIS 3.0 MAC andUpper Layer Protocols Interface Specification, cM-SP-MULPIv3.0-I24-140403 (2014).URL http://www.cablelabs.com
[2] Cable Television Laboratories, Inc., Data-Over-CableService Interface Specifications: DOCSIS 3.1 MAC andUpper Layer Protocols Interface Specification, cM-SP-MULPIv3.1-I02-140320 (2014).URL http://www.cablelabs.com
[3] J. Gettys, K. Nichols, Bufferbloat: Dark buffers in theInternet, Queue 9 (11) (2011) 40.
[4] K. Nichols, V. Jacobson, Controlling queue delay, Com-munications of the ACM 55 (7) (2012) 42–50.
[5] S. Floyd, V. Jacobson, Traffic phase effects in packet-switched gateways, ACM SIGCOMM Computer Com-munication Review 21 (2) (1991) 26–42.
[6] S. Floyd, K. Fall, Promoting the use of end-to-end con-gestion control in the Internet, IEEE/ACM Transac-tions on Networking (TON) 7 (4) (1999) 458–472.
[7] S. Floyd, V. Jacobson, Random early detec-tion gateways for congestion avoidance, Networking,IEEE/ACM Transactions on 1 (4) (1993) 397–413.
[8] V. Rosolen, O. Bonaventure, G. Leduc, A RED discardstrategy for ATM networks and its performance evalua-tion with TCP/IP traffic, ACM SIGCOMM ComputerCommunication Review 29 (3) (1999) 23–43.
[9] K. Nichols, V. Jacobson, Controlled de-lay active queue management (draft-nichols-tsvwg-codel-01), http://tools.ietf.org/html/
draft-nichols-tsvwg-codel-01 (2013).[10] R. Pan, P. Natarajan, C. Piglione, M. S. Prabhu,
V. Subramanian, F. Baker, B. VerSteeg, PIE: Alightweight control scheme to address the bufferbloatproblem, in: High Performance Switching and Routing
(HPSR), 2013 IEEE 14th International Conference on,IEEE, 2013, pp. 148–155.
[11] R. Pan, P. Natarajan, C. Piglione, M. Prabhu,V. Subramanian, F. Baker, B. V. Steeg, PIE: Alightweight control scheme to address the bufferbloatproblem (draft-pan-aqm-pie-00), https://tools.ietf.org/html/draft-pan-aqm-pie-02 (2013).
[12] R. Pan, L. Breslau, B. Prabhakar, S. Shenker, Ap-proximate fairness through differential dropping, ACMSIGCOMM Computer Communication Review 33 (2)(2003) 23–39.
[13] J. Martin, J. Westall, A simulation model of the DOC-SIS protocol, Simulation 83 (2) (2007) 139–155.
[14] J. Martin, J. Westall, T. Shaw, G. White, R. Woundy,J. Finkelstein, G. Hart, Cable modem buffer manage-ment in DOCSIS networks, in: Sarnoff Symposium,2010 IEEE, IEEE, 2010, pp. 1–6.
[15] G. Hong, J. Martin, S. Moser, J. Westall, Fair schedul-ing on parallel bonded channels with intersecting bond-ing groups, in: Modeling, Analysis & Simulationof Computer and Telecommunication Systems (MAS-COTS), 2012 IEEE 20th International Symposium on,IEEE, 2012, pp. 89–98.
[16] J. Martin, G. Hong, J. Westall, Managing fairness andapplication performance with active queue managementin DOCSIS-based cable networks, in: Proceedings ofthe 2014 ACM SIGCOMM workshop on Capacity shar-ing workshop, ACM, 2014, pp. 9–14.
[17] S. Floyd, RED (random early detection) queue man-agement (2008).URL http://www.icir.org/floyd/red.html
[18] M. May, J. Bolot, C. Diot, B. Lyles, Reasons not todeploy RED, in: Quality of Service, 1999. IWQoS’99.1999 Seventh International Workshop on, IEEE, 1999,pp. 260–262.
[19] D. Lin, R. Morris, Dynamics of random early detec-tion, in: ACM SIGCOMM Computer CommunicationReview, Vol. 27, ACM, 1997, pp. 127–137.
[20] S. Floyd, R. Gummadi, S. Shenker, et al., AdaptiveRED: An algorithm for increasing the robustness ofRED’s active queue management, Preprint, availableat http://www.icir.org/floyd/papers.html.
[21] R. Adams, Active queue management: A survey, Com-munications Surveys & Tutorials, IEEE 15 (3) (2013)1425–1476.
[22] W.-c. Feng, K. G. Shin, D. D. Kandlur, D. Saha,The BLUE active queue management algorithms,IEEE/ACM Transactions on Networking (TON) 10 (4)(2002) 513–528.
[23] L. Xue, S. Kumar, C. Cui, P. Kondikoppa, C.-H.Chiu, S.-J. Park, AFCD: An approximated-fair andcontrolled-delay queuing for high speed networks, in:Computer Communications and Networks (ICCCN),2013 22nd International Conference on, IEEE, 2013, pp.1–7.
[24] E. Duzamet, Fair queue CoDel packet scheduler(2012).URL https://dev.openwrt.org/browser/trunk/
target/linux/generic/patches-3.3/042-fq_
codel-Fair-Queue-Codel-AQM.patch?rev=33560
[25] T. Hoeiland-Joergensen, P. McKenney,D. Taht, J. Ghettys, E. Dumazet, Flowqueue-Codel (draft-hoeiland-joergensen-aqm-fq-codel-00), https://tools.ietf.org/html/
draft-hoeiland-joergensen-aqm-fq-codel-00
19
(2014).[26] P. E. McKenney, Stochastic fairness queueing, in: IN-
FOCOM’90. Ninth Annual Joint Conference of theIEEE Computer and Communication Societies.’TheMultiple Facets of Integration’. Proceedings., IEEE,IEEE, 1990, pp. 733–740.
[27] N. Khademi, D. Ros, M. Welzl, The new AQM kidson the block: Much ado about nothing?, Tech. rep.,University of Oslo (Oct. 2013).URL https://www.duo.uio.no/bitstream/handle/
10852/37381/khademi-AQM_Kids_TR434.pdf?
sequence=4
[28] G. White, D. Rice, Active queue management algo-rithms for DOCSIS 3.0, cableLabs Technical Report,April 2013 (2013).URL http://www.cablelabs.com/downloads/pubs/
Active_Queue_Management_Algorithms_DOCSIS_3_0.
pdf
[29] I. S. Organization, IEEE Standard for WirelessMAN-Advanced Air Interface for Broadband Wireless Ac-cess Systems, IEEE Std 802.16.1-2012 (2012) 1 –1090doi:10.1109/IEEESTD.2012.6297413.
[30] S. Bauer, D. Clark, W. Lehr, Powerboost, in: Proceed-ings of the 2nd ACM SIGCOMM Workshop on HomeNetworks, ACM, 2011, pp. 7–12.
[31] Sandvine Incorporated ULC, Global Internet phenom-ena report (2015).URL https://www.sandvine.com/
[32] S. Akhshabi, A. C. Begen, C. Dovrolis, An experimen-tal evaluation of rate-adaptation algorithms in adaptivestreaming over HTTP, in: Proceedings of the secondannual ACM conference on Multimedia systems, ACM,2011, pp. 157–168.
[33] S. Akhshabi, L. Anantakrishnan, A. C. Begen,C. Dovrolis, What happens when HTTP adaptivestreaming players compete for bandwidth?, in: Pro-ceedings of the 22nd international workshop on Networkand Operating System Support for Digital Audio andVideo, ACM, 2012, pp. 9–14.
[34] T.-Y. Huang, N. Handigol, B. Heller, N. McKeown,R. Johari, Confused, timid, and unstable: Picking avideo streaming rate is hard, in: Proceedings of the2012 ACM Conference on Internet Measurement Con-ference, ACM, 2012, pp. 225–238.
[35] J. Jiang, V. Sekar, H. Zhang, Improving fairness, ef-ficiency, and stability in HTTP-based adaptive videostreaming with FESTIVE, in: Proceedings of the 8thInternational Conference on Emerging Networking Ex-periments and Technologies, ACM, 2012, pp. 97–108.
[36] T.-Y. Huang, R. Johari, N. McKeown, M. Trunnell,M. Watson, A buffer-based approach to rate adapta-tion: Evidence from a large video streaming service,in: Proceedings of the 2014 ACM conference on SIG-COMM, ACM, 2014, pp. 187–198.
[37] L. De Cicco, S. Mascolo, An adaptive video streamingcontrol system: Modeling, validation, and performanceevaluation, Networking, IEEE/ACM Transactions on22 (2) (2014) 526–539.
[38] J. Martin, Y. Fu, N. Wourms, T. Shaw, CharacterizingNetflix bandwidth consumption, in: Consumer Com-munications and Networking Conference (CCNC), 2013IEEE, IEEE, 2013, pp. 230–235.
[39] Z. Li, A. C. Begen, J. Gahm, Y. Shan, B. Osler,D. Oran, Streaming video over HTTP with consistentquality, in: Proceedings of the 5th ACM Multimedia
Systems Conference, ACM, 2014, pp. 248–258.[40] C. Liu, I. Bouazizi, M. Gabbouj, Rate adaptation for
adaptive HTTP streaming, in: Proceedings of the sec-ond annual ACM conference on Multimedia systems,ACM, 2011, pp. 169–174.
[41] G. Tian, Y. Liu, Towards agile and smooth video adap-tation in dynamic HTTP streaming, in: Proceedingsof the 8th international conference on Emerging net-working experiments and technologies, ACM, 2012, pp.109–120.
[42] Z. Li, X. Zhu, J. Gahm, R. Pan, H. Hu, A. Begen,D. Oran, Probe and adapt: Rate adaptation for HTTPvideo streaming at scale, Selected Areas in Communi-cations, IEEE Journal on 32 (4) (2014) 719–733.
[43] L. De Cicco, V. Caldaralo, V. Palmisano, S. Mascolo,Elastic: A client-side controller for dynamic adaptivestreaming over HTTP (DASH), in: Packet Video Work-shop (PV), 2013 20th International, IEEE, 2013, pp.1–8.
[44] S. Nazir, Z. Hossain, R. Secchi, M. Broadbent,A. Petlund, G. Fairhurst, Performance evaluation ofcongestion window validation for DASH transport, in:Proceedings of Network and Operating System Supporton Digital Audio and Video Workshop, ACM, 2014,p. 67.
[45] F. Dobrian, V. Sekar, A. Awan, I. Stoica, D. Joseph,A. Ganjam, J. Zhan, H. Zhang, Understanding theimpact of video quality on user engagement, ACMSIGCOMM Computer Communication Review 41 (4)(2011) 362–373.
[46] F. Dobrian, A. Awan, D. Joseph, A. Ganjam, J. Zhan,V. Sekar, I. Stoica, H. Zhang, Understanding the impactof video quality on user engagement, Communicationsof the ACM 56 (3) (2013) 91–99.
[47] A. Balachandran, V. Sekar, A. Akella, S. Seshan, I. Sto-ica, H. Zhang, A quest for an Internet video quality-of-experience metric, in: Proceedings of the 11th ACMWorkshop on Hot Topics in Networks, ACM, 2012, pp.97–102.
[48] P. Ni, R. Eg, A. Eichhorn, C. Griwodz, P. Halvorsen,Flicker effects in adaptive video streaming to handhelddevices, in: Proceedings of the 19th ACM internationalconference on Multimedia, ACM, 2011, pp. 463–472.
[49] S. S. Krishnan, R. K. Sitaraman, Video stream qual-ity impacts viewer behavior: inferring causality usingquasi-experimental designs, Networking, IEEE/ACMTransactions on 21 (6) (2013) 2001–2014.
[50] N. Cranley, P. Perry, L. Murphy, User perceptionof adapting video quality, International Journal ofHuman-Computer Studies 64 (8) (2006) 637–647.
[51] C. Liu, I. Bouazizi, M. M. Hannuksela, M. Gabbouj,Rate adaptation for dynamic adaptive streaming overHTTP in content distribution network, Signal Process-ing: Image Communication 27 (4) (2012) 288–311.
[52] R. G. Cole, J. H. Rosenbluth, Voice over IP performancemonitoring, ACM SIGCOMM Computer Communica-tion Review 31 (2) (2001) 9–24.
[53] P. Barford, M. Crovella, Generating representative webworkloads for network and server performance evalua-tion, in: ACM SIGMETRICS Performance EvaluationReview, Vol. 26, ACM, 1998, pp. 151–160.
[54] M. E. Crovella, A. Bestavros, Self-similarity in worldwide web traffic: evidence and possible causes, Net-working, IEEE/ACM Transactions on 5 (6) (1997) 835–846.
20
[55] R. K. Jain, D.-M. W. Chiu, W. R. Hawe, A quantita-tive measure of fairness and discrimination for resourceallocation in shared computer systems (1984).URL http://www1.cse.wustl.edu/~jain/papers/ftp/
fairness.pdf
[56] J.-Y. Le Boudec, Rate adaptation, congestion controland fairness: A tutorial (2012).URL http://moodle.epfl.ch/pluginfile.php/4391/
course/section/8686/cc.pdf
[57] A. K. J. Parekh, A generalized processor sharing ap-proach to flow control in integrated services networks,Ph.D. thesis, Massachusetts Institute of Technology(1992).
[58] A. Demers, S. Keshav, S. Shenker, Analysis and sim-ulation of a fair queueing algorithm, in: ACM SIG-COMM Computer Communication Review, Vol. 19,ACM, 1989, pp. 1–12.
[59] M. Shreedhar, G. Varghese, Efficient fair queueing usingdeficit round robin, in: ACM SIGCOMM ComputerCommunication Review, Vol. 25, ACM, 1995, pp. 231–242.
[60] N. Kuhn, E. Lochin, O. Mehani, Revisiting old friends:Is CoDel really achieving what RED cannot?, in: Pro-ceedings of the 2014 ACM SIGCOMM Workshop on Ca-pacity Sharing Workshop, CSWS ’14, ACM, New York,NY, USA, 2014, pp. 3–8.
[61] M. Mathis, J. Semke, J. Mahdavi, T. Ott, The macro-scopic behavior of the TCP congestion avoidance al-gorithm, ACM SIGCOMM Computer CommunicationReview 27 (3) (1997) 67–82.
[62] G. Fairhurst, A. Sathiaseelan, R. Secchi, Up-dating tcp to support rate-limited traffic (draft-ietf-tcpm-newcwv-12), https://tools.ietf.org/html/draft-ietf-tcpm-newcwv-12 (2015).
[63] A. Feldmann, A. C. Gilbert, P. Huang, W. Willinger,Dynamics of IP traffic: A study of the role of variabilityand the impact of control, in: ACM SIGCOMM Com-puter Communication Review, Vol. 29, ACM, 1999, pp.301–313.
Gongbing Hong is currentlypursuing a Ph.D. in the Schoolof Computing at Clemson Uni-versity. His past work experienceincluded more than a decade en-gineering career in the cable sys-tem division at Cisco / Scientific-Atlanta. His current research fo-
cus is on bandwidth management for emergingDOCSIS system.
James Martin is an Asso-ciate Professor in the School ofComputing at Clemson Univer-sity. His research interests in-clude broadband access, wire-less networks, Internet protocols,and network performance analy-sis. Current research projects in-
clude heterogeneous wireless systems and DOCSIS
3.x cable access networks. He has received fund-ing from NSF, NASA, the Department of Justice,BMW, CableLabs, Cisco, Comcast, Cox, Huawei,and IBM. He received his Ph.D. from North Car-olina State University. Prior to joining Clemson, hewas a consultant for Gartner, and prior to that, asoftware engineer for IBM.
James M. Westall received theM.S. degree in Computer Scienceand the Ph.D. degree in Math-ematics from the University ofNorth Carolina at Chapel Hill.He is a Professor Emeritus andResearch Professor of ComputerScience in the School of Comput-
ing at Clemson University. His research interests in-clude measurement and modeling of computer sys-tems and networks, computer graphics, and high-performance computing.
21
Table 12: FTP and HAS Average Throughput and Allocation Bias


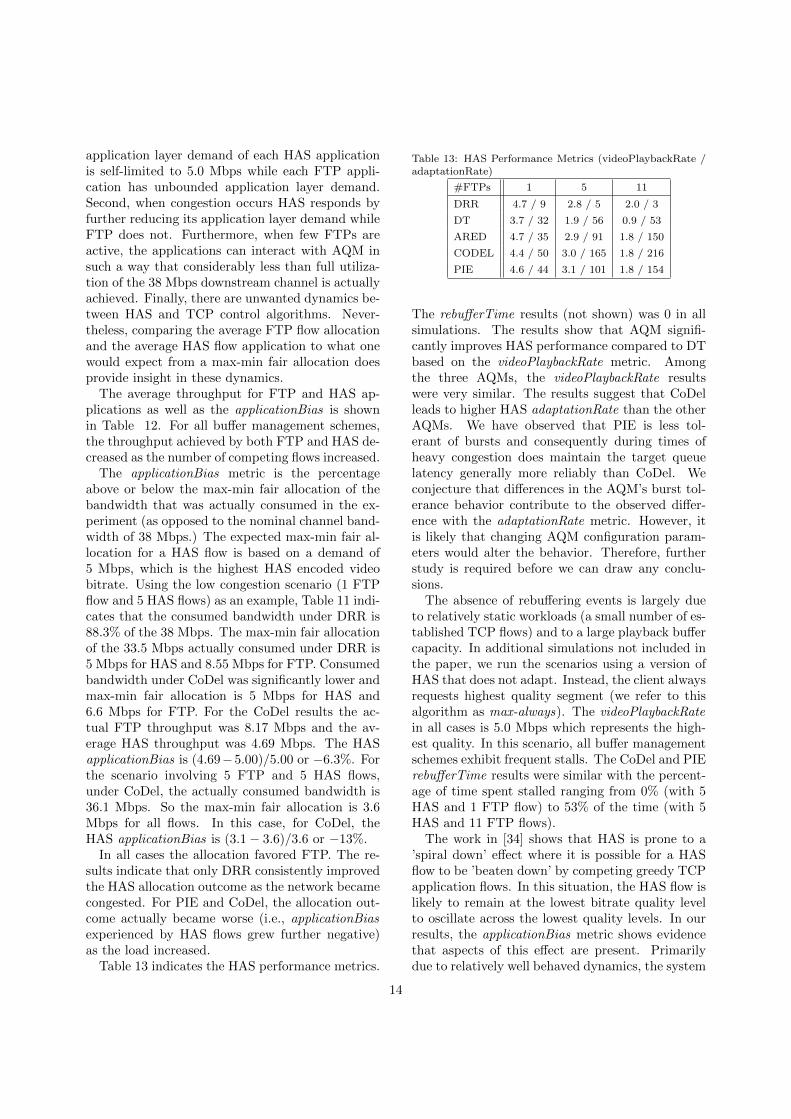


![A Cross-layer Dual Queue Approach for Improving TCP ... · The issue of TCP fairness in WLANs has been recently addressed in [6–10]. In [6], the ... 3 Dual Queue Scheme for Uplink](https://static.documents.pub/doc/80x56/603e1d18025a5a6a0b2c52b9/a-cross-layer-dual-queue-approach-for-improving-tcp-the-issue-of-tcp-fairness.jpg)


