10th Symposium on Finance, Banking, and Insurance Universität Karlsruhe (TH), December 14 – 16, 2005 Opening Lecture Prof. Richard Roll University of California Recent Research about Liquidity
Transcript
10th Symposium on
Finance, Banking, and InsuranceUniversität Karlsruhe (TH), December 14 – 16, 2005
Opening Lecture
Prof. Richard RollUniversity of California
Recent Research about Liquidity
Universität Karlsruhe14 December 2005
Northern Finance AssociationVancouver,
October 1, 2005
L’Association de Finance du NordVancouver,
le premier Octobre, 2005
Liquidity
Presented by
Recent Research About Liquidity
Liquidity: What is it?Like the U.S. Supreme Court said about pornography, “it’s hard to define but we know it when we see it!”Liquidity was always a focus of market professionals but was not the subject of intensive academic research until recently
Liquidity Literature
Using the keywords “liquidity” or “illiquidity,” to search the econlibrary.com data base returns 934 papers with these words in the titleHowever, many of these are not pertinent to market liquidity; e.g.,
The “liquidity trap”Liquidity preference and riskLiquidity premium term structure theory
Also, some are purely theoretical; I’m focusing on empirical issues
Liquidity Literature (2)
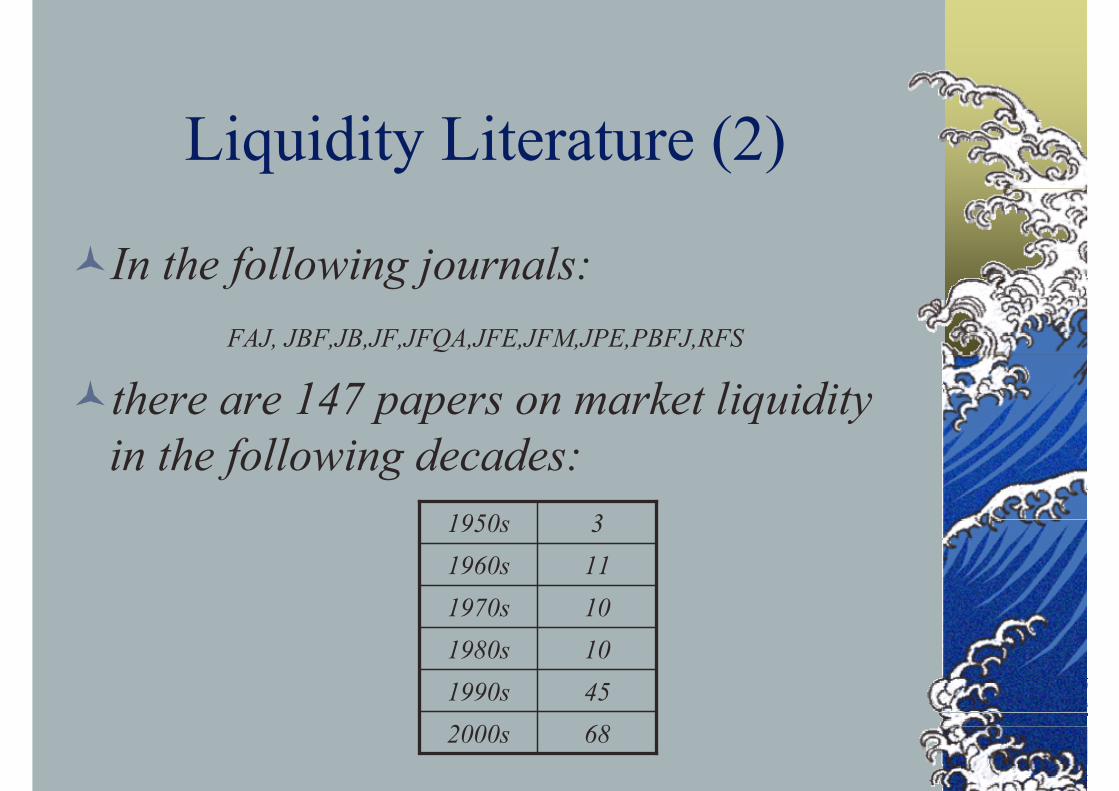
In the following journals: FAJ, JBF,JB,JF,JFQA,JFE,JFM,JPE,PBFJ,RFS
there are 147 papers on market liquidity in the following decades:
682000s451990s101980s101970s111960s31950s
Liquidity Literature (3)
The fourth oldest paper:Alan Greenspan, “Liquidity As A Determinant Of Industrial Prices And Interest Rates,” Journal of Finance, 1964I initially had high hopes for this paper, but it’s about using the quantity theory of money to forecast interest rates; and here’s what he said
Empirical Definitions of Liquidity
Aitken and Comerton-Forde (PBFJ, January 2003)
68 different measures used in the literatureTwo basic types
Trade-based measuresVolumeNumber of trades, etc.
Order-based measuresBid-ask spreads, quoted depth, depth of order book
Trade-based measures
Volume, frequency of trading, dollar value of shares traded, etc.Intuitively, these are not good because they can be high when the market is in a crisis and liquidity is actually lowAlso, they’re not very correlated with order-based measures; e.g., volume and spreads often have negative correlation
Order-based measures
Quoted spreads, effective spreads, depth and combinationsGeneralizations using orders in the book, when availableThese are the focus of much recent research, which is partly driven by the availability of transactions data, (e.g., TAQ and similar data bases)
P denotes price and subscripts indicate: t=actual transaction, A=ask,B=bid, M=bid/ask midpoint. Q denotes the quantity guaranteed availablefor trade at the quotes, (with subscripts: A=ask, B=bid.)
Summary Statistics for NYSECross-sectional statistics for time-series means
Mean Median Standard Deviation
QSPR 0.3162 0.2691 1.3570
PQSPR 0.0160 0.0115 0.0136
DEP 3776 2661 3790
ESPR 0.2245 0.1791 1.3051
PESPR 0.0111 0.0077 0.0132
Liquidity is highly volatile
Individual percentage changes in spreads and depth have volatilities that exceed that of returns themselves!
“D” preceding the acronym, e.g., DQSPR, denotes a proportional change in thevariable across successive trading days; i.e., for liquidity measure L, DLt≡(Lt-Lt-1)/Lt-1
for trading day t. ⏐ DLt⏐ denotes the absolute value of the daily proportional change.
Liquidity, micro or macro?
Until recently, liquidity research examined individual assets
Poor liquidity reduces an asset’s value (Amihud and Mendelson)Analogous to yield premium on low-grade debt
More recently, it has become clear that liquidity is a market-wide phenomenaThere is commonality across assets (co-movement) in liquidityThe raises the question of whether it might be a non-diversifiable risk
Value-Weighted NYSE Composite Average Spreads
Average (EW) DepthNYSE, 1988-1998
Liquidity Risk
Pastor/Stambaugh, JPE, 2003Based on daily regressions for individual stock excess returns in a calendar month
rt+1=a+brt+g[sign(rt)]$VolumetThen aggregate g across stocks and scale it for growing dollar volumeIntuition: high volume moves prices away from equilibrium and they rebound the following day; hence, g is typically negative
Pastor/Stambaugh Aggregate Liquidity (replicated)
-0.3
-0.3
-0.2
-0.2
-0.1
-0.1
0.0
0.1
0.1
Aug-62
Aug-65
Aug-68
Aug-71
Aug-74
Aug-77
Aug-80
Aug-83
Aug-86
Aug-89
Aug-92
Aug-95
Aug-98
P/S
Scal
ed L
Priced liquidity risk?
Regress individual stock returns monthly on traditional factors and also on P/S aggregate scaled liquidityTest whether “betas” on liquidity are associated with higher returnsP/S Result: “the average return on stocks with high sensitivities to liquidity exceeds that for stocks with low sensitivities by 7.5 percent annually” adjusted for market, size, value and momentum
Still unpublished recent research,a few examples
Liquidity and the Law of One Price
Working Paper, 2005, with Eduardo Schwartz Avanidhar Subrahmanyam
September 28, 2005 Liquidity and Arbitrage 8
The absolute relative basis
SSFe t)r( −δ−−
☯F = Futures Price☯S = Spot Price (Cash index level)☯r = Interest rate☯δ = Dividend yield☯t = Term until expiration of futures contract
Plot of the six-month basisNYSE Composite & Future
Six-Month Basis
-2%
-1%
0%
1%
2%
3%
Jan-88
Dec-88
Dec-89
Dec-90
Dec-91
Dec-92
Dec-93
Dec-94
Dec-95
Dec-96
Dec-97
Dec-98
Dec-99
Dec-00
Dec-01
Dec-02
Bas
is (%
)
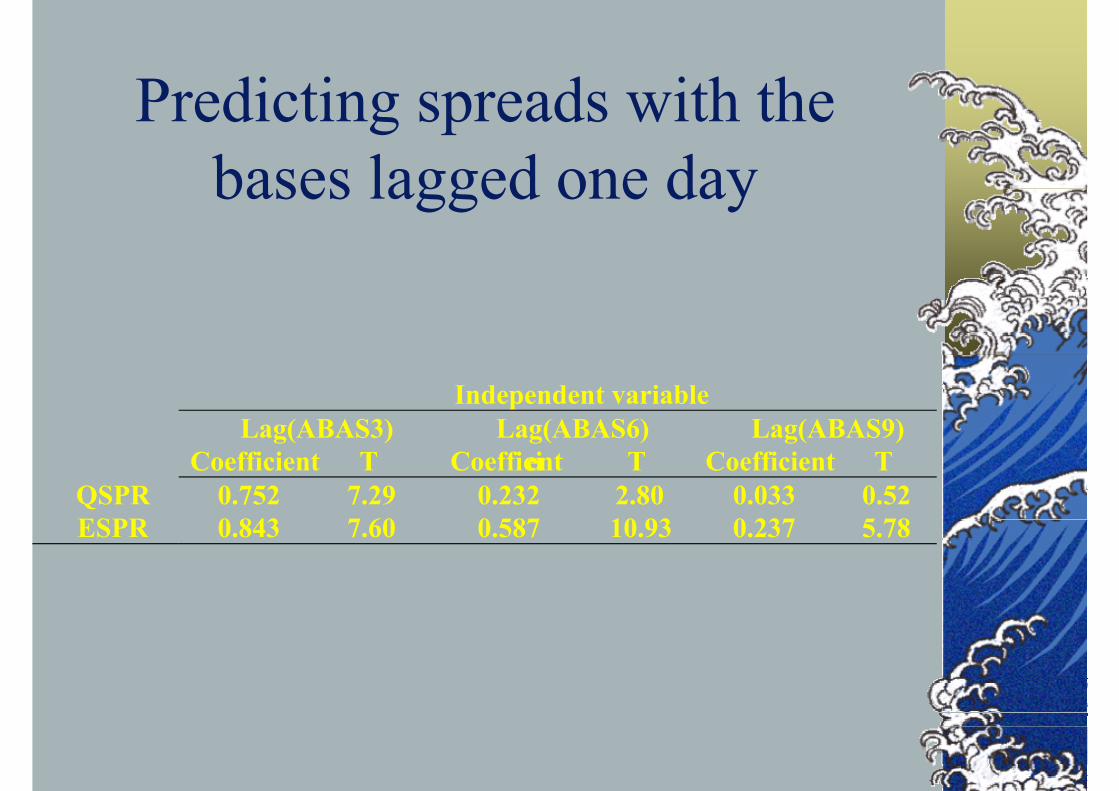
Correlations of average absolute basis and average liquidity across contracts
Coefficient T Coefficient T Coefficient TQSPR 0.752 7.29 0.232 2.80 0.033 0.52ESPR 0.843 7.60 0.587 10.93 0.237 5.78
Summary of Empirical Results
Deviations from the basis (NYSE composite) and liquidity are jointly determinedThere is bi-directional causality
Lower liquidity impedes arbitrage and allows larger deviations from the basisArbitrage trading to eliminate basis deviations absorbs liquidity and raises trading costsVARs show that the impact lasts a few daysControlled for non-synchronous trading, interest rates, and a host of other influences
Liquidity and Market Efficiency
Very high frequency returns are predictable to some extent; e.g., five-minute autocorrelations are positiveArbitrageurs can take advantage of this if they have enough liquidity to tradeImplication: inefficiencies should be more pronounced when the market is illiquidEvidence: a new paper with Chordia and Subra,”Liquidity and Market Efficiency”
Figure 1. Market Inefficiency Trend, NYSE, 1993-2002 Five-Minute Return Predictions Using Lagged (by five minutes) Dollar Order Imbalance
-1%
1%
3%
5%
7%
9%
11%
13%
Jan-93
Jul-93
Jan-94
Jul-94
Jan-95
Jul-95
Jan-96
Jul-96
Jan-97
Jul-97
Jan-98
Jul-98
Jan-99
Jul-99
Jan-00
Jul-00
Jan-01
Jul-01
Jan-02
Jul-02
Pred
ictiv
e R
-squ
are
-2
0
2
4
6
8
10
12
14
T-St
atis
tic fo
r Pre
dict
ion
R-square
T-statistic
Eighths Regime Sixteenths Regime Decimal Regime
Illiquid periods
Defined as days where the de-trended effective spread is more than one standard deviation above its mean within each tick size regimeWe use an indicator variable, ILD, which is one on illiquid days
Regressions predicting returns using illiquidity indicator ILD (dependent variable is mid-quote return at time t)
Liquidity and predictability
The predictability of returns from lagged order flows is greater on more illiquid daysThe effect is present in every tick regime
Market efficiency by time of day
Since spreads vary by time of day (McInish and Wood, 1992), there is reason to expect a similar pattern in return predictabilityWe define two dummies, morn (9:30-12), and eve (14:00-16:00)
Time-of-day effects
Intraday efficiency results
The market’s ability to accommodate order flows was smaller during the morning and, to a lesser extent, the evening period within the eighth regimeThis effect has declined considerably during the decimal period
Plenty of Questions LeftWhy does liquidity have seasonals?Does liquidity really beget liquidity?
Does lower liquidity feed on itself?What arbitrage force can correct this?
What can we learn from improved empirical measures such as depth of limit order book?Who provides and absorbs liquidity in different international markets?
Individuals, Institutions, foreign investors?More details on liquidity as risk
It’s negatively associated with idiosyncratic riskIf it’s systematic, how does it vary across asset classes?


![0-+,.6241 895;3@/:7BA= - Wing On Travel · 0.764 JO9: >@B;GDNI8CAA=@>?F V]ba ? VKY;Y;WJJ;QVT;DE>?zl7bKKa}irLHvXGNFgFRd[x](https://static.documents.pub/doc/80x56/5e5a653dd341f634d20069e7/0-6241-89537ba-wing-on-travel-0764-jo9-bgdni8caaf-vba.jpg)


![Cathodoluminescence (CL) Microscopy Application to ... · Total refractories production in United States in 1998 was 3.66 million metric tons [4] with a value of $2.379 billion (Figure](https://static.documents.pub/doc/80x56/6012c0fb6b022c731962449f/cathodoluminescence-cl-microscopy-application-to-total-refractories-production.jpg)
![FCABDLHJG NOKQIRUTVEPMXWS · 2018-05-09 · 0.764 8=|},.0~52@>? ???> wRY@1DCBCHBECDK]flj D ]Qa@a@_PP@W][@JEF FCABDLHJG NOKQIRUTVEPMXWS](https://static.documents.pub/doc/80x56/5f7e6e1f06522b54e976b4a8/fcabdlhjg-nokqirutvepmxws-2018-05-09-0764-8052-wry1dcbchbecdkflj.jpg)
![FCABDMLTHJG OPKRISWVXEQNZYU · 0.764:?~*.02+74>9}31,;9}=A@6;~* t|GoP}Z>@>? ???> ~zZs,ELBDDBECDJ]eji D ]Qa@a@_PP@W][@HHD FCABDMLTHJG OPKRISWVXEQNZYU D_X29C18WksD](https://static.documents.pub/doc/80x56/5f7631519d3bd302607815f0/fcabdmlthjg-opkriswvxeqnzyu-076402749319a6-tgopz.jpg)


