23
On-Line H 2 PPB Impurity Analysis Using FTIR On-Line H 2 PPB Impurity Analysis Using FTIR Arik Ultsch MKS Instruments Deutschland
On-Line H2 PPB Impurity Analysis Using FTIR
On-Line H2 PPB Impurity Analysis Using FTIR
Arik UltschMKS Instruments Deutschland
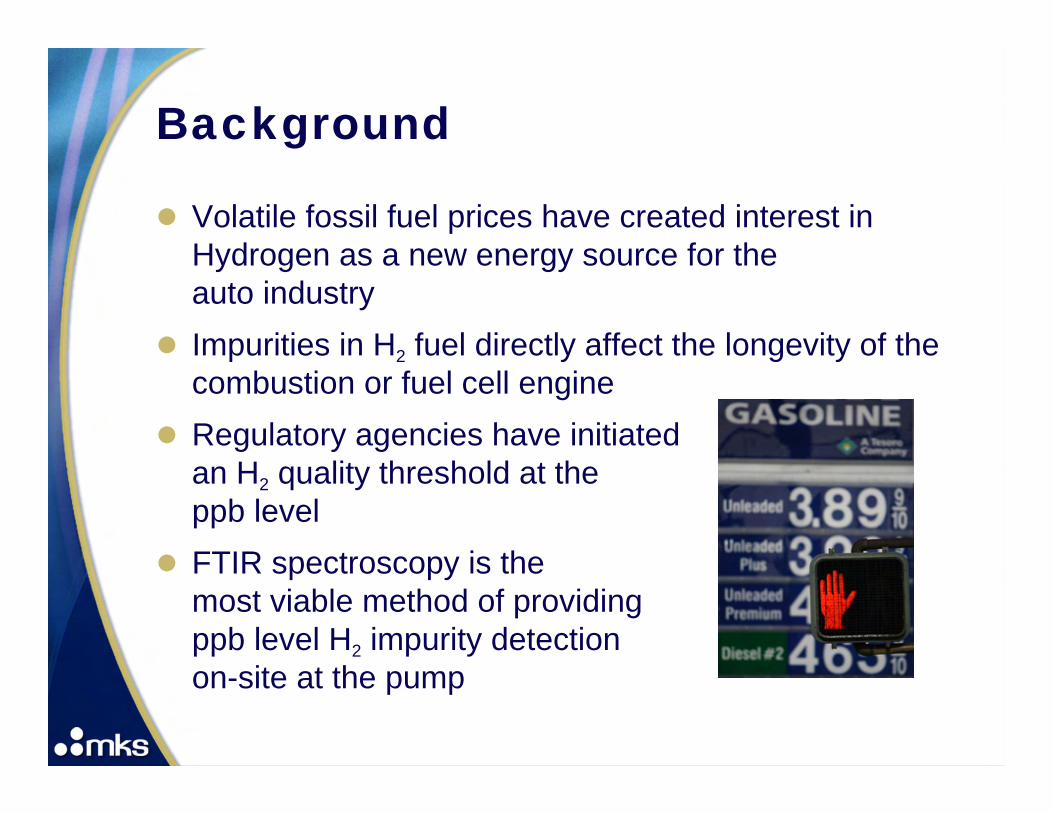
Background
Volatile fossil fuel prices have created interest in Hydrogen as a new energy source for the auto industryImpurities in H2 fuel directly affect the longevity of the combustion or fuel cell engineRegulatory agencies have initiated an H2 quality threshold at the ppb levelFTIR spectroscopy is the most viable method of providing ppb level H2 impurity detection on-site at the pump

H2 Impurity Analysis: Content
Fuel cell principleDetermining the effect of impurities on fuel cells– How much can be tolerated?– Is the effect reversible?– Effects of impurities
Sulfur (H2S, COS), ammonia, CO, CO2, H2O– Impurities from H2 Fuel as well as Air Feed
Cell Analysis by Air Liquide R&D Center USARobert Benesch, Tracey Jacksier, and Sumaeya Salman
FTIR Validation for H2 impurity detection– Method detection limits for:
Multiple componentsDifferent FTIR detector ranges tested

Fuel cells generate electricity from a simple electrochemical reaction in which oxygen and hydrogen combine to form waterAnode– Porous carbon coated with tiny particles of platinum (Pt) – Pt acts as a catalyst to form ions
(2H2 => 4H+ + 4e-)
Proton Exchange Membrane (PEM)– Allows positively charged
ions to travel through
Cathode– Forms oxygen atoms – Oxygen and hydrogen
combine to form water(O2 + 4H+ + 4e- => 2H2O)
Fuel Cell Principle
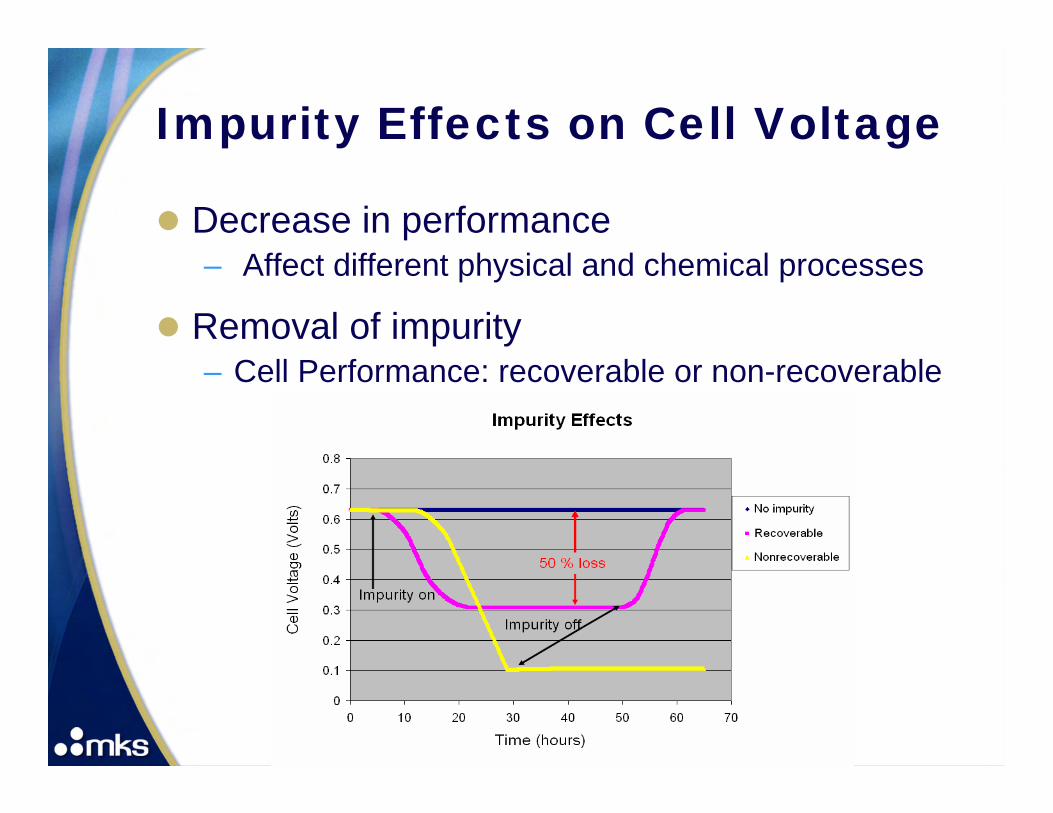
Impurity Effects on Cell Voltage
Decrease in performance– Affect different physical and chemical processes
Removal of impurity– Cell Performance: recoverable or non-recoverable

The Fuel – Hydrogen and Air
Hydrogen– Introduced to anode side of fuel cell
Reducing environment– Dependant upon production method
Typical methods- Biological – fermentation, anaerobic digestion- Electrochemical – electrolysis of H2O- Thermal – reforming, gasification
Steam Methane Reforming (SMR)- 95% of US H2 production- He, N2, CO, H2S, NH3, CH4 …
Air– Introduced to cathode side of fuel cell
Oxidizing environment
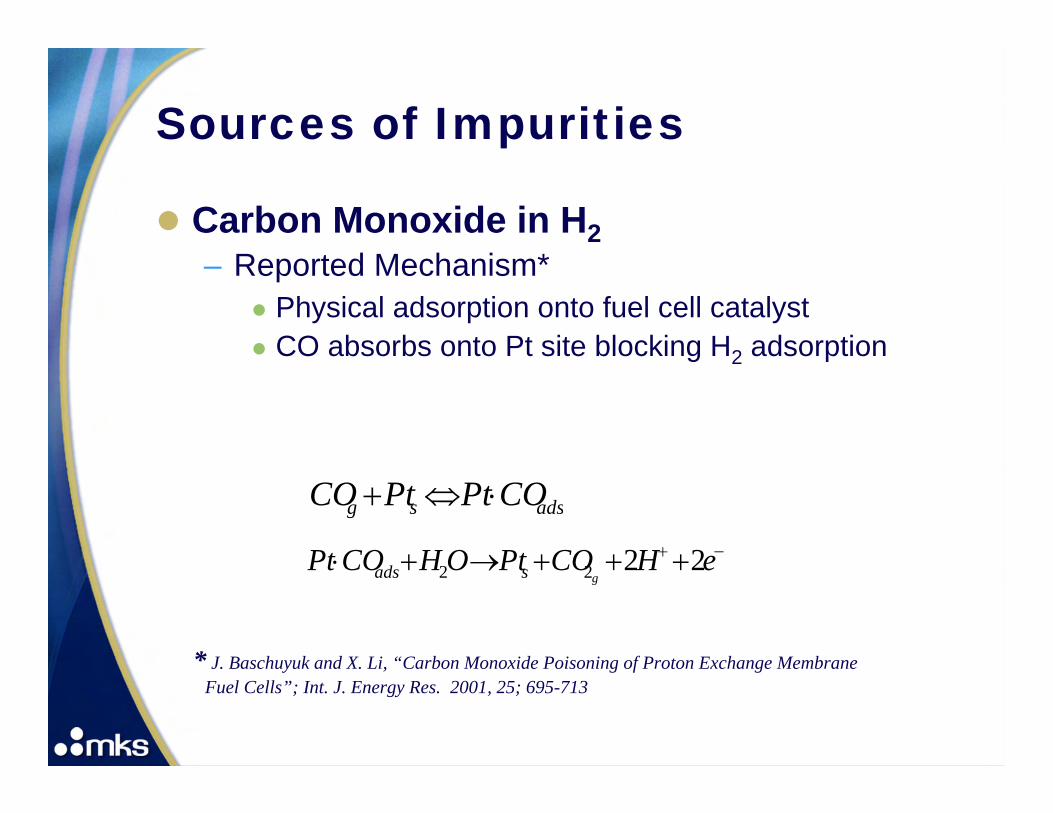
Sources of Impurities
Carbon Monoxide in H2– Reported Mechanism*
Physical adsorption onto fuel cell catalystCO absorbs onto Pt site blocking H2 adsorption
* J. Baschuyuk and X. Li, “Carbon Monoxide Poisoning of Proton Exchange Membrane Fuel Cells”; Int. J. Energy Res. 2001, 25; 695-713
adssg COPtPtCO ⋅⇔+−+ +++→+⋅ eHCOPtOHCOPt
gsads 2222
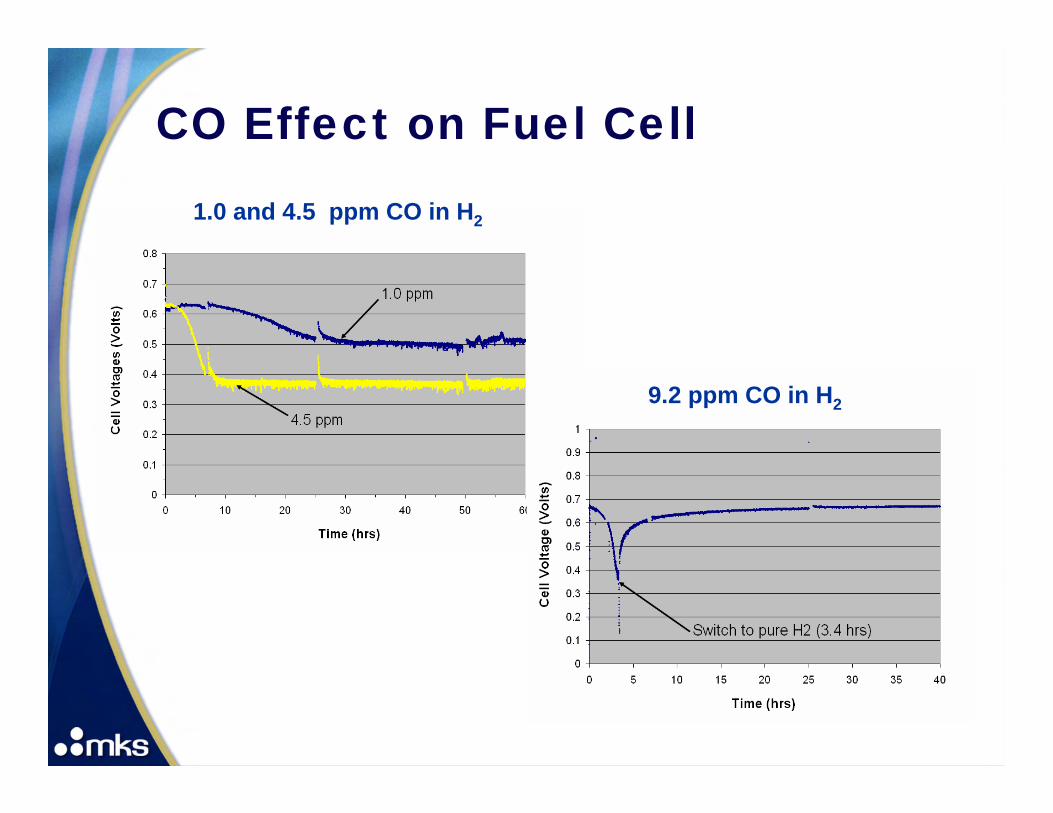
CO Effect on Fuel Cell
1.0 and 4.5 ppm CO in H2
9.2 ppm CO in H2
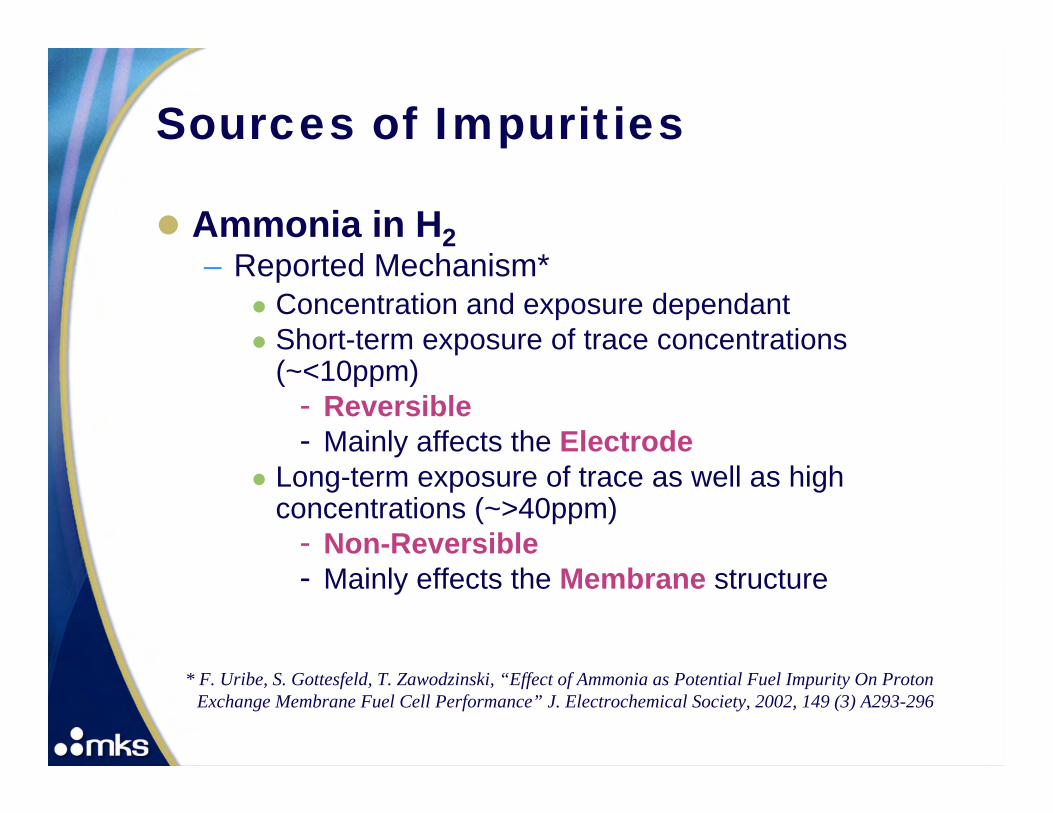
Sources of Impurities
Ammonia in H2– Reported Mechanism*
Concentration and exposure dependantShort-term exposure of trace concentrations (~<10ppm)
- Reversible- Mainly affects the Electrode
Long-term exposure of trace as well as high concentrations (~>40ppm)
- Non-Reversible- Mainly effects the Membrane structure
* F. Uribe, S. Gottesfeld, T. Zawodzinski, “Effect of Ammonia as Potential Fuel Impurity On Proton Exchange Membrane Fuel Cell Performance” J. Electrochemical Society, 2002, 149 (3) A293-296
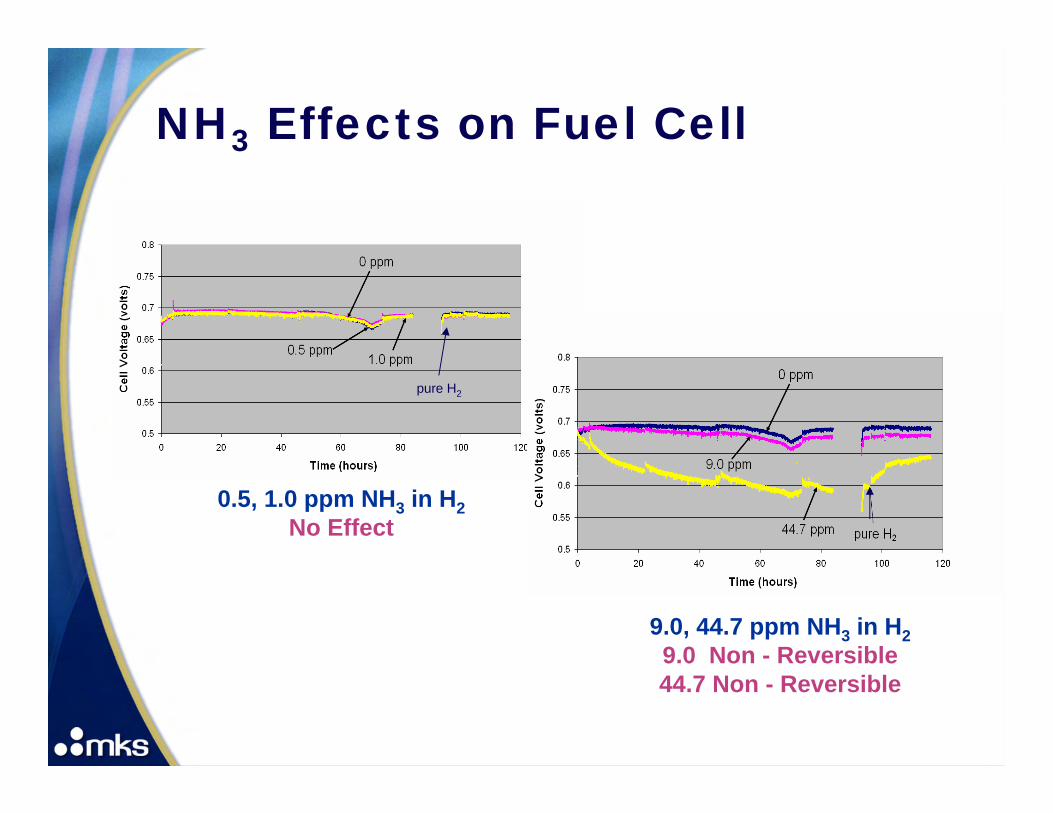
NH3 Effects on Fuel Cell
0.5, 1.0 ppm NH3 in H2No Effect
9.0, 44.7 ppm NH3 in H29.0 Non - Reversible44.7 Non - Reversible
pure H2

Summary of Impurities Tested
Typical Air Sample: (maximum hourly concentration detected at EPA testing sites in Houston and Chicago area in 2005):
CO [3 ppm], NO [0.65 ppm], SO2 [0.137 ppm]
Impurity Electrode Lowest Test Conc (ppm)
Highest Test Conc (ppm)
% Decrease at Lowest
Conc
% Decrease at Highest
Conc CO anode 0.52 9.2 5 >58 H2S anode 0.10 2.0 not detected >58 NH3 anode 0.50 44.7 not detected 14.7 CO cathode 0.40 68.6 not detected not detected SO2 cathode 0.07 4.8 3 40 NO2 cathode 0.025 2.86 not detected 20
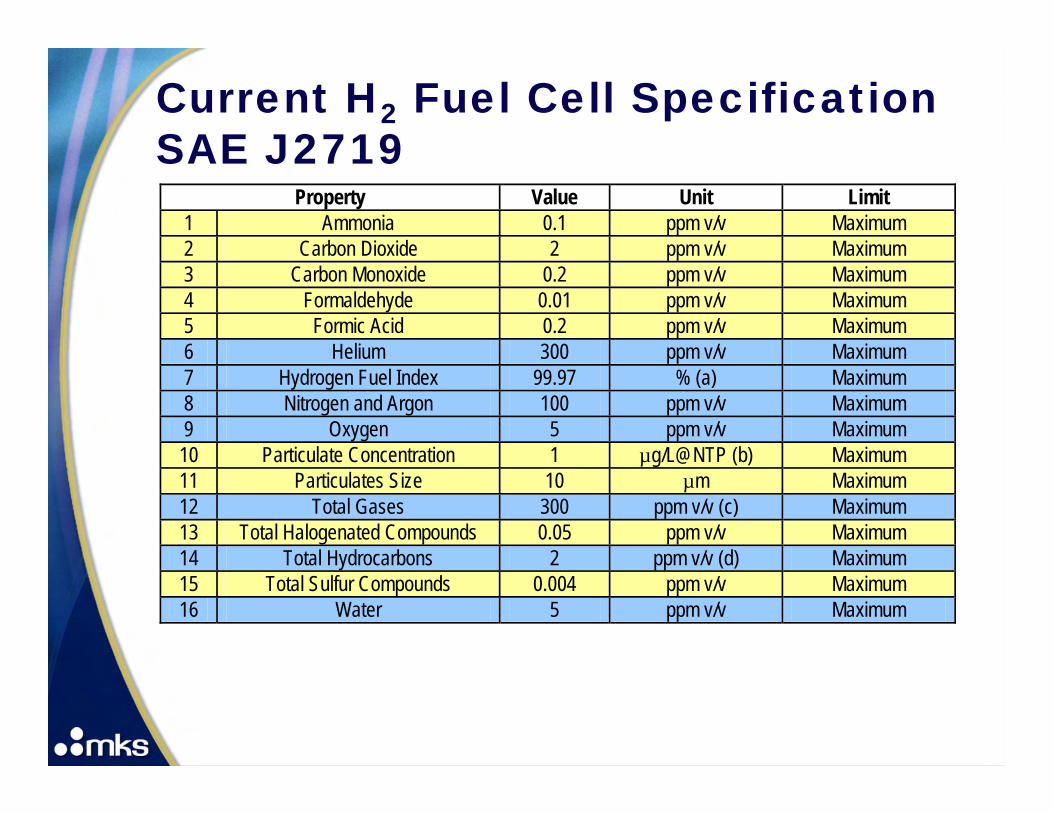
Current H2 Fuel Cell Specification SAE J2719
Property Value Unit Limit 1 Ammonia 0.1 ppm v/v Maximum 2 Carbon Dioxide 2 ppm v/v Maximum 3 Carbon Monoxide 0.2 ppm v/v Maximum 4 Formaldehyde 0.01 ppm v/v Maximum 5 Formic Acid 0.2 ppm v/v Maximum 6 Helium 300 ppm v/v Maximum 7 Hydrogen Fuel Index 99.97 % (a) Maximum 8 Nitrogen and Argon 100 ppm v/v Maximum 9 Oxygen 5 ppm v/v Maximum
10 Particulate Concentration 1 µg/L@NTP (b) Maximum 11 Particulates Size 10 µm Maximum 12 Total Gases 300 ppm v/v (c) Maximum 13 Total Halogenated Compounds 0.05 ppm v/v Maximum 14 Total Hydrocarbons 2 ppm v/v (d) Maximum 15 Total Sulfur Compounds 0.004 ppm v/v Maximum 16 Water 5 ppm v/v Maximum

FTIR For H2 Impurity Analysis
Real-time analysis at ppb levelsFTIR advantage – Multiple components analysis with one unit
Single analyzer for all the impurities except O2, H2, Ar, N2
– High resolution enables speciation between similar moleculesButane, Propane, Ethane, Methane, fuel sources, etc.
– Permanent calibration – Analysis performed at various sites
H2 production siteH2 storage site: gas or liquid cylindersAt - Line analysis at fueling station

Infrared (IR) Spectroscopy
Based on IR light absorption – Energy (IR radiation) heats molecule - vibrations and rotations– The pattern and intensity of the spectrum provides all the information
about gas (type and concentration)
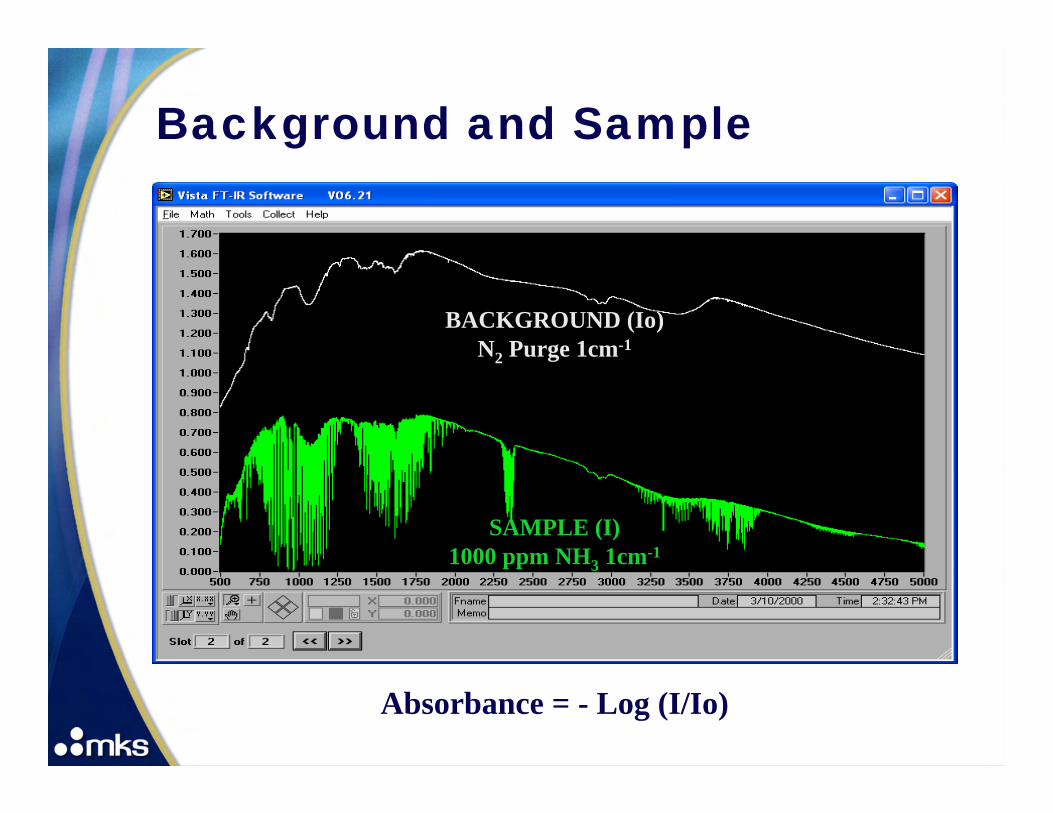
Background and Sample
BACKGROUND (Io)N2 Purge 1cm-1
SAMPLE (I)1000 ppm NH3 1cm-1
Absorbance = - Log (I/Io)
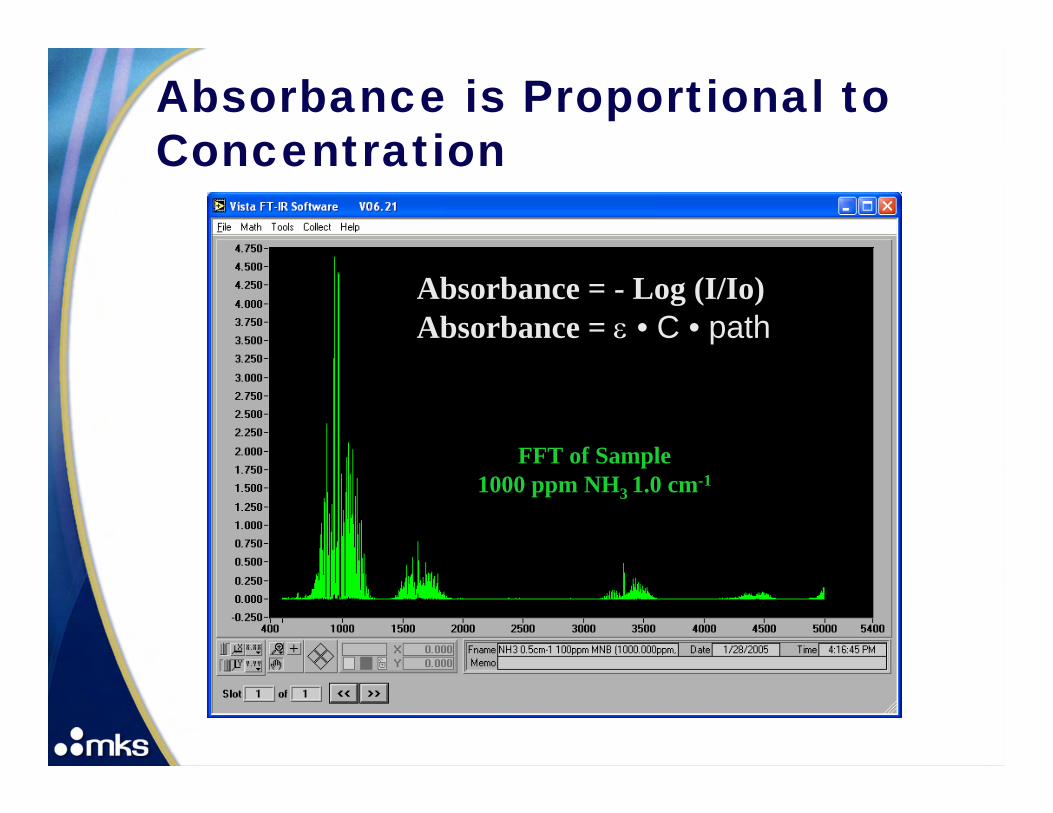
Absorbance is Proportional to Concentration
FFT of Sample1000 ppm NH3 1.0 cm-1
Absorbance = - Log (I/Io)Absorbance = ε • C • path
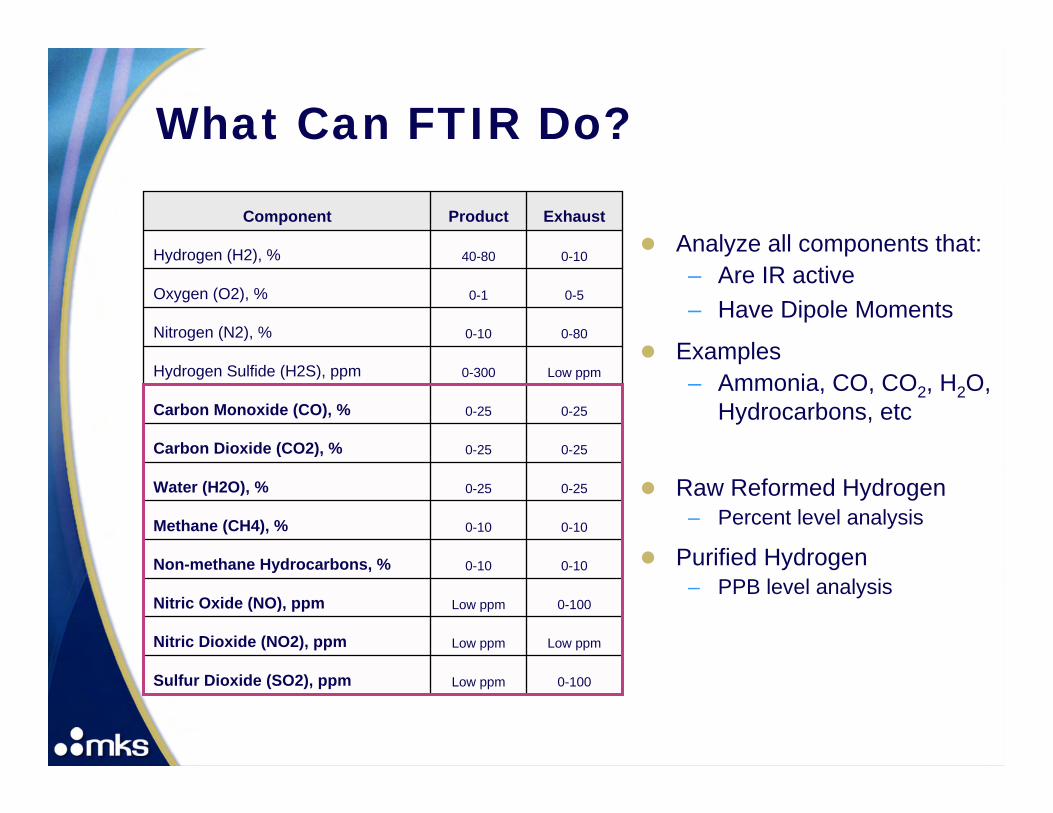
What Can FTIR Do?
Analyze all components that:– Are IR active– Have Dipole Moments
Examples– Ammonia, CO, CO2, H2O,
Hydrocarbons, etc
Raw Reformed Hydrogen– Percent level analysis
Purified Hydrogen– PPB level analysis
0-100Low ppmSulfur Dioxide (SO2), ppm
Low ppmLow ppmNitric Dioxide (NO2), ppm
0-100Low ppmNitric Oxide (NO), ppm
0-100-10Non-methane Hydrocarbons, %
0-100-10Methane (CH4), %
0-250-25Water (H2O), %
0-250-25Carbon Dioxide (CO2), %
0-250-25Carbon Monoxide (CO), %
Low ppm0-300Hydrogen Sulfide (H2S), ppm
0-800-10Nitrogen (N2), %
0-50-1Oxygen (O2), %
0-1040-80Hydrogen (H2), %
ExhaustProductComponent
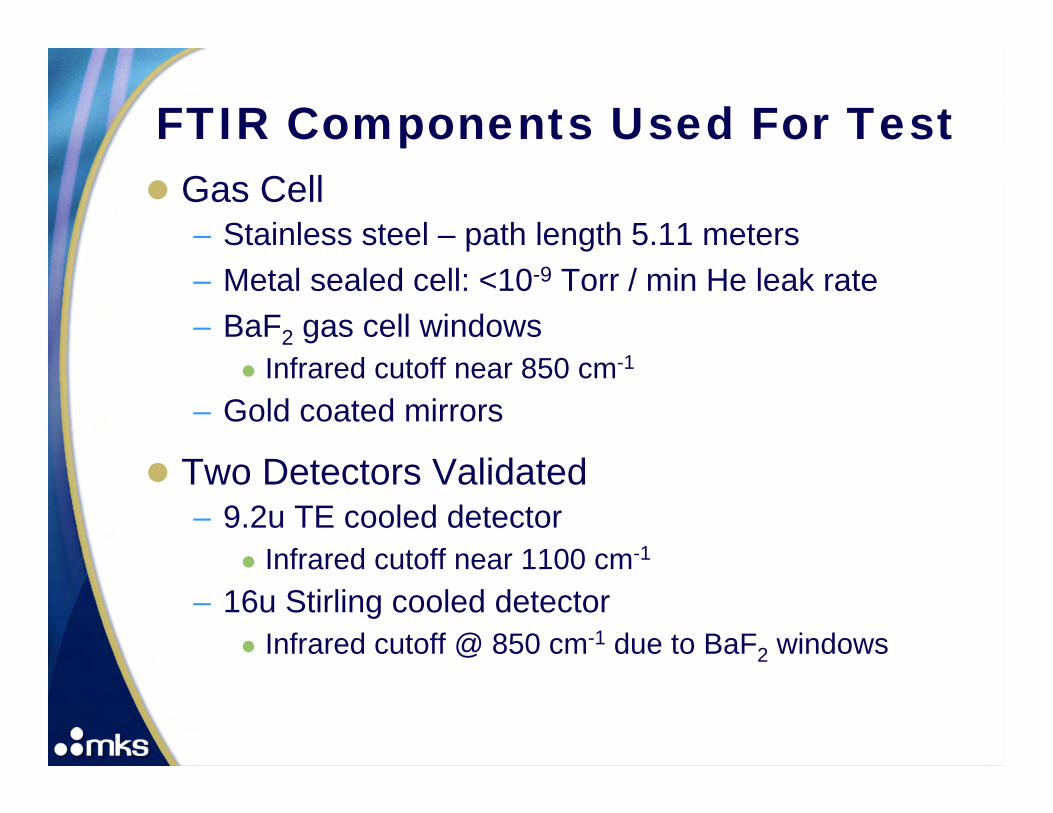
FTIR Components Used For TestGas Cell – Stainless steel – path length 5.11 meters– Metal sealed cell: <10-9 Torr / min He leak rate– BaF2 gas cell windows
Infrared cutoff near 850 cm-1
– Gold coated mirrors
Two Detectors Validated– 9.2u TE cooled detector
Infrared cutoff near 1100 cm-1
– 16u Stirling cooled detectorInfrared cutoff @ 850 cm-1 due to BaF2 windows
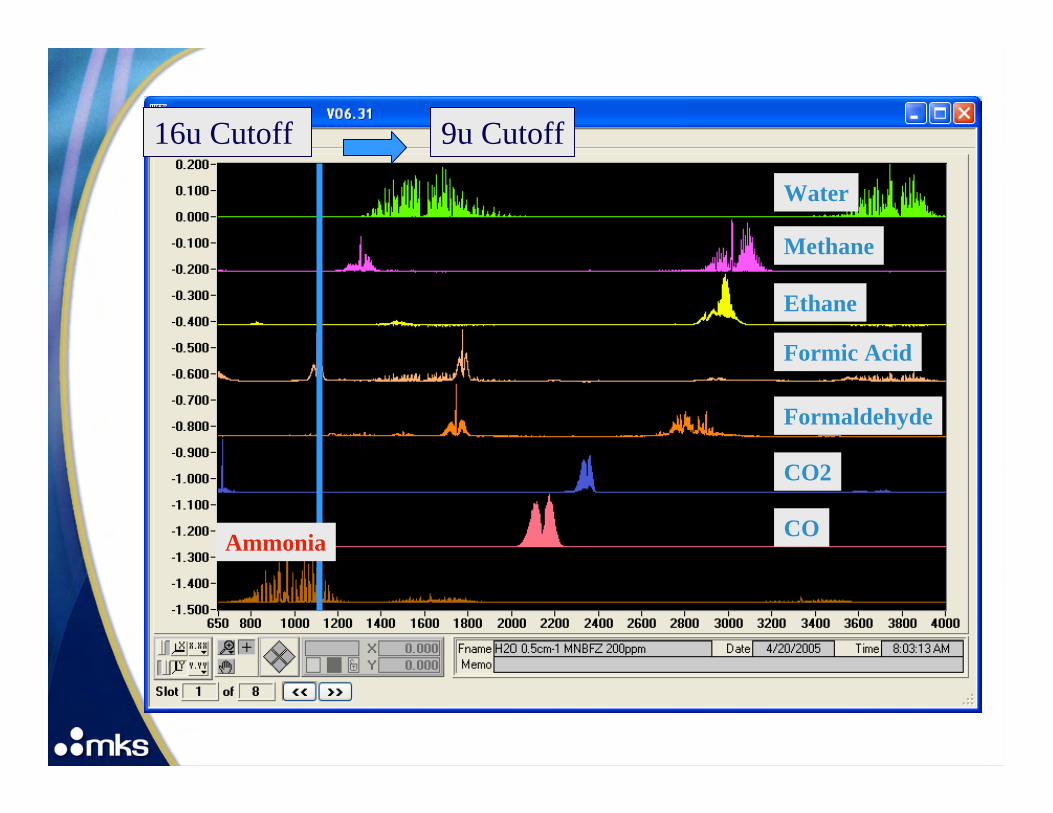
9u Cutoff
Water
Methane
Ethane
Formaldehyde
Formic Acid
CO2
COAmmonia
16u Cutoff
Method Validation
EPA Method 40 CFR 136 Appendix B– Build calibrations on FTIR– Estimate a minimum detection limit– Determine how low a concentration can be
detected with this method

FTIR Validation Method for H2
Gases validated on FTIR– CO, CO2, CH4, C2H6, NH3, H2O, Formaldehyde
and Formic Acid– All in Balance of H2
Gas standards creation– NIST traceable gas cylinders for gases
100 ppm of CO, CO2, CH4, C2H6 in H2
– NIST traceable permeation tubes for liquidsNH3, H2O, Formaldehyde and Formic Acid
– Blended with H2
Purified H2 (<1ppb H2O, CO CO2)

Contaminant SAE J2719 Detection
Limits (ppmv) 16u Stirling* 9.2u TE 16u LN2
Ammonia (NH3) 0.10 0.36 0.81 0.02 Carbon Monoxide (CO) 0.20 0.01 0.05 0.01 Carbon Dioxide (CO2) 2.00 0.01 0.01 0.01 Formaldehyde (HCHO) 0.01 0.02 0.02 0.02 Formic Acid (HCOOH) 0.20 0.03 0.02 0.02 Total Hydrocarbons (Reported as C1)
2.00 0.71
Methane 0.10 0.02 0.02 0.03 Ethane 0.10 0.02 0.05 0.05 Ethylene 0.10 0.03 Water (H2O) 5.00 0.40 0.74 0.12
Method Detection Limits
* Signal to noise ratio (SNR) was 1/3 that of 16u LN2 for this test* However improved SNR to same level as 16u LN2
Acknowledgments
Fuel cell work– Air Liquide Research and Technology Center
Robert Benesch, Tracey Jacksier, Sumaeya Salman
Method validation / calibration work– Elutions Design Bureau, Inc – Houston, TX
Scott Thompson– MKS Instruments – On Line Product Group
Barbara Marshik– Monetary support for this work
MKS InstrumentsShell Global Solutions Inc. - Westhollow Technology Center


