Journal of the O P TI C A L of SO CI ETY AMERICA VOLUME 34, NUMBER 8 AUGUST, 1944 On Plate Calibration in Spectrographic Analysis* SAUL LEVY Carnegie-IllinoisSteel Corporation,Gary Works, Gary, Indiana (Received May 23, 1944) 1. METHODS OF PHOTOGRAPHIC PHOTOMETRY THERE are, essentially, two procedures in photographic radiation measurements in use. The first is based on the so-called Hartmann principle,' namely, that two sources of equal intensity and of the same wave-length produce equal blackenings on the same plate if the time of the exposure is the same. This principle sounds trivial, and yet it is the basis of modern photo- metric procedure, as applied first by Koch in his measurements of line broadening. Using sources of known intensity ratios, one obtains intensity marks on the plate and by measuring the density (or transparency) of the plate, the whole density-intensity curve is obtained. The second method involves the application of some kind of law for the density of the plate as a function of exposure, such as the linear approxi- mation of the Hurter and Driffield curve (density-intensity relation). The photometric procedures used in spectro- graphic analysis are similar to those mentioned above (see, however, Section 4). In one method the intensities of spectral lines which depend on the concentrations of the elements in the sample are measured with the help of an empirical characteristic curve. In the other method use is *Abstract in Phys. Rev. 65, 256 (1944). 1J. Hartmann, Zeits. f. Instrumentenk. 19, 97 and 842 (1899). 2 P. P. Koch, Ann. d. Physik 30, 841 (1909); 34, 377 (1911). made of a linear approximation for the "normal" blackening portion of the H & D curve, using standards to account forthe changeable contrast. 3 The first method is in principle correct; how- ever, it is not always convenient in quick routine work, as it requires several measurements and careful plotting of the characteristic curve. Often in practice this is not made for each plate and the curve is only checked from time to time. However, the contrast of the plates might differ occasionally even on plates taken from the same box, because of conditions of storage, developing, etc. The second method is a rapid one and can be applied for each plate. The linear approximation, however, might not always be sufficient, espe- cially, when a larger density range is used. In the present paper a simplified method of plate calibration is described which is believed to be satisfactory in many cases occurring in practical work. 2. ANALYTICALREPRESENTATION OF THE CHARACTERISTIC CURVE The valuable feature of the second of the above- described methods (using the linear approxima- tion of the H & D curve) is that it permits the calibration of the plate by measuring the densities of one pair of lines of sufficient stability, as the 3This procedure is described in F. Twyman's Spectro- chemical Analysis of Metals and Alloys (Chemical Publish- ing Company, Brooklyn, New York, 1941), p. 97. 447
Transcript
Journal of the
O P TI C A L
of
SO CI ETYAMERICA
VOLUME 34, NUMBER 8 AUGUST, 1944
On Plate Calibration in Spectrographic Analysis*
SAUL LEVYCarnegie-Illinois Steel Corporation, Gary Works, Gary, Indiana
(Received May 23, 1944)
1. METHODS OF PHOTOGRAPHIC PHOTOMETRY
THERE are, essentially, two procedures inphotographic radiation measurements in
use. The first is based on the so-called Hartmannprinciple,' namely, that two sources of equalintensity and of the same wave-length produceequal blackenings on the same plate if the timeof the exposure is the same. This principle soundstrivial, and yet it is the basis of modern photo-metric procedure, as applied first by Koch inhis measurements of line broadening. Usingsources of known intensity ratios, one obtainsintensity marks on the plate and by measuringthe density (or transparency) of the plate, thewhole density-intensity curve is obtained. Thesecond method involves the application of somekind of law for the density of the plate as afunction of exposure, such as the linear approxi-mation of the Hurter and Driffield curve(density-intensity relation).
The photometric procedures used in spectro-graphic analysis are similar to those mentionedabove (see, however, Section 4). In one methodthe intensities of spectral lines which depend onthe concentrations of the elements in the sampleare measured with the help of an empiricalcharacteristic curve. In the other method use is
*Abstract in Phys. Rev. 65, 256 (1944).1 J. Hartmann, Zeits. f. Instrumentenk. 19, 97 and 842
(1899).2 P. P. Koch, Ann. d. Physik 30, 841 (1909); 34, 377
(1911).
made of a linear approximation for the "normal"blackening portion of the H & D curve, usingstandards to account for the changeable contrast.3
The first method is in principle correct; how-ever, it is not always convenient in quick routinework, as it requires several measurements andcareful plotting of the characteristic curve.Often in practice this is not made for each plateand the curve is only checked from time to time.However, the contrast of the plates might differoccasionally even on plates taken from the samebox, because of conditions of storage, developing,etc.
The second method is a rapid one and can beapplied for each plate. The linear approximation,however, might not always be sufficient, espe-cially, when a larger density range is used.
In the present paper a simplified method ofplate calibration is described which is believed tobe satisfactory in many cases occurring inpractical work.
2. ANALYTICAL REPRESENTATION OF THECHARACTERISTIC CURVE
The valuable feature of the second of the above-described methods (using the linear approxima-tion of the H & D curve) is that it permits thecalibration of the plate by measuring the densitiesof one pair of lines of sufficient stability, as the
3This procedure is described in F. Twyman's Spectro-chemical Analysis of Metals and Alloys (Chemical Publish-ing Company, Brooklyn, New York, 1941), p. 97.
447
SAUL LEVY
measured intensity ratio determines the onlyconstant of the linear equation important forrelative measurements, namely, the slope. Thequestion arises whether the actual characteristiccurve, in its usable part at least, depends also ononly one constant. If that is the case, then thecalibration can be obtained by measuring oneintensity ratio, this single constant determiningthe whole characteristic curve of the plate.
It is of no decisive importance for our practicalpurposes whether or not an explicit analyticalexpression can be found which represents thecalibration curve with a sufficient accuracy.Nevertheless, it is interesting to note thattheoretical considerations have led to more orless complicated expressions for the H & D curve.The expression obtained by Silberstein4 containsonly one constant essential for relative measure-ments. Since the theoretical interpretation ofthis constant encounters some difficulties, Silber-stein considers his expression as a semi-empiricalone, as it agrees well with the experimentalresults with pure silver-bromide emulsions.Webb,5 in a somewhat different way, arrives atthe same conclusion, namely, that the theoreticalH & D curve contains only one essential constant.
Perhaps the simplest of all analytical expres-sions suggested for the representation of the
4 L. Silberstein, J. Opt. Soc. Am. 32, 474 (1942).5 J. H. Webb, J. Opt. Soc. Am. 29, 314 (1939).
FIG. 1.
-.1 -. 2 -. 3 -. 4 -. 5 -. 6 -. 7 -. 8
Z = log intensity+ +iog 2
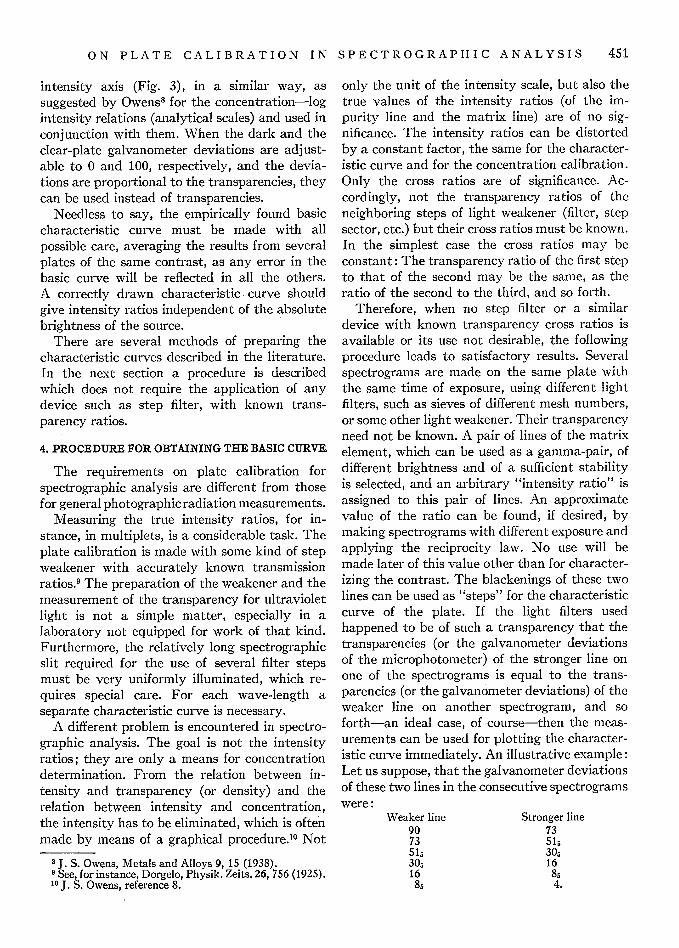
characteristic curve is that given by Abney,which for our purposes can be written: u/uo= exp [ - (k log I)2], where u/uo is the trans-parency, I-intensity of light, and k-a constant.It is not considered to be a good approximationsfor the whole extension of the curve; however,for that part of the curve which is mostly usedfor spectrographic purposes with transparenciesbetween 0.10 and 0.80, or densities 1.0 and 0.1,respectively, the agreement between the calcu-lated and the experimental curves is fairly close,as it was found in this laboratory (Fig. 1) forEastman Kodak Spectrum Analysis No. 1 plates,using the light of a spectral line of wave-length3100, from a spark. The circles are the meanvalues of actual measurements, the curve is onewing of the normal frequency distribution, withz=log I and k adjusted for the middle portionof the curve. The experimental and the calculated
TABLE I.
Transparency Intensity ratiosFirst line Second line Calc. Experimental
G C. K. Mees, The Theory of Photographic Process (D.Van Nostrand Company, Inc., New York, 1943).
448
c:
dI
' o
ON PLATE CALIBRATION IN SPECTROGRAPHIC ANALYSIS
curves are brought to coincidence at their inflec-tion points, where their values of the ordinate is0.50. Between the transparency 0.85 and 0.20the agreement is excellent. The deviation startsat about 0.15 and is not negligible.7 Table Igives the intensity ratios computed from thesetwo curves for different transparencies.
It appears thus that the characteristic curvecan be represented very closely by expressionshaving one constant. By changing this constantwhich, obviously, is characteristic of the platecontrast, one obtains a family of curves fordifferent contrast. For instance, by variation ofk in the Abney approximation one obtains curveswhich deviate one from another only in the unitof the abscissa, that is, of the log intensity axis.In general, as it will be shown in Section 3, thecharacteristic curves for plates of different con-trasts can be found by changing the unit of thelog intensity axis, when the curve for oneparticular contrast is found experimentally. Theapplicability of those curves depends on thevalidity of the following assumptions: (1) Thetransparency of a photographic plate is alwaysthe same monotonous function of the exposure.(2) This function contains only one constant.This implies the assumption that all the factorsother than exposure, such as temperature and
I It should be emphasized that the measured trans-parency depends to a certain extent on the type of densi-tometer used: the difference between the "specular" andthe "diffuse" transparency, as a result of the scattering oflight in the emulsion. The theoretical notion of trans-parency (or density), as well as the measured values ofthis quantity are therefore somewhat indefinite.
FIG. 2.
/
I. 1. .
properties of the developer, time of developing,and so forth, exert a combined influence on onesingle physical quantity, responsible for theblackening of the plate. In Silberstein's theoryit is the minimum number of light quanta whichrender the grain developable.
Whether and to what extent the curves thusobtained actually represent the characteristiccurves for the plates of different contrasts canbe decided by comparison with the experimentalcurves or by investigating the consistency of themeasured intensity ratios on plates of differentcontrasts, applying those curves.
3. CHARACTERISTIC CURVES FOR PLATES OFDIFFERENT CONTRASTS
Let us suppose that the characteristic curvefor one particular plate was found experimentally.By selecting a pair of lines (of the matrix ele-ment, for instance, of iron, when steel is to beanalyzed) of different brightness and of a stableintensity ratio, one obtains a certain value forthe latter, applying the experimental character-istic curve of the plate to the transparencies ofthe lines. For convenience, we shall call thisexperimental curve the basic curve, the selectedpair of lines-the gamma-pair. The measuredintensity ratio of this pair, the gamma-pair ratioof the plate, should have the value A. Theapplication of the basic curve to the blackeningsof the gamma-pair lines on other plates mayyield ratios different from A, on account of adifferent characteristic curve corresponding tothose plates. Suppose that for a particular plate
//
449
tf.- 1k Ho at 11, . .
SAUL LEVY
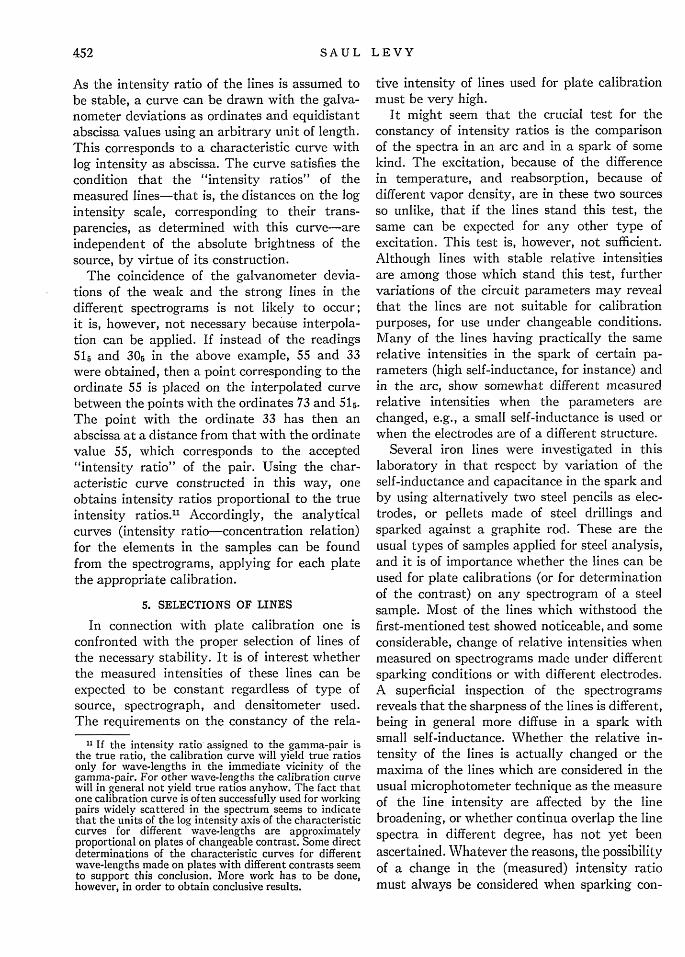
the gamma-pair ratio, as measured with thebasic curve, is B instead of A. A characteristiccurve is sought which being applied to thegamma-pair transparencies of that plate yieldsthe value A. With the assumption made inSection 2, the following construction can bemade. Let the full curve (Fig. 2) be the basiccharacteristic curve, PO and QR1 the trans-parencies of the gamma-pair lines on that plate,and OR1 = log B. As the shift of the characteristiccurve with log intensity scale does not changethe relative intensities, we may assume that thecurve to be constructed intersects the basic curveat the point P. The transparencies PO and Q1Rjshould have abscissa difference OR1 = log A, whenthe new curve is applied. Therefore the pointQ11 with the ordinate QR 1=Q1
1Ril and theabscissa OR1
1 = log A belongs to the curve inquestion. We consider now the transparenciesQ1 R1 and Q2R2 with the abscissa differenceR1R2 = OR1 = log B. Assuming now that the newcurve is shifted to the right the distance R1
1R1,and intersects now the basic curve at Q1, we findin a similar way the point Q2'. Considering thetransparencies Q2R2 and Q3R3 with the sameabscissa difference R2 R 3 = R1 R2 = OR1 , and as-suming that the new curve is again shifted to theright the distance R2
1R2, so as to make theintersection point of two curves at Q2, we ob-tained the point Q3'. In this way we obtain aseries of points Q1 , Q21, Q3', etc. By shifting tothe left the point Q21 the distance R1Rll=R 2
2R 2 ,Q3 '-twice this distance, Q4
1 -three times, and
. I
-/
7-
so on, we obtain the points of a curve whichintersects the basic curve at P and which yieldsin all its parts the intensity ratio A applied totransparencies of a plate, when the basic curvegives the ratio B.
It will be noticed that the new curve can beobtained from the basic one by changing theabscissa unit in the ratio log A/log B.
The assumption made in Section 2, namely,that the characteristic curves are determined bymeasurement of two transparencies, implies thatthe constructed curve is also applicable tointensity ratios other than that of the gamma-pair. That is, the curve is the characteristiccurve for all plates on which the gamma-pairmeasured with the basic curve has the value B.
The same construction can be made for differ-ent values of the gamma-pair ratio as measuredwith the basic curve. In this way a set of calibra-tion curves is obtained, in the range of expectedvariations of the contrast and at intervals de-sired. While determining the relation betweenthe intensity ratios and concentrations and thenfor concentration determinations, one has tomeasure, first, the transparencies of the gamma-pair and to find the intensity ratio with thebasic calibration. The resulting value indicateswhich calibration must be used for the plate inquestion.
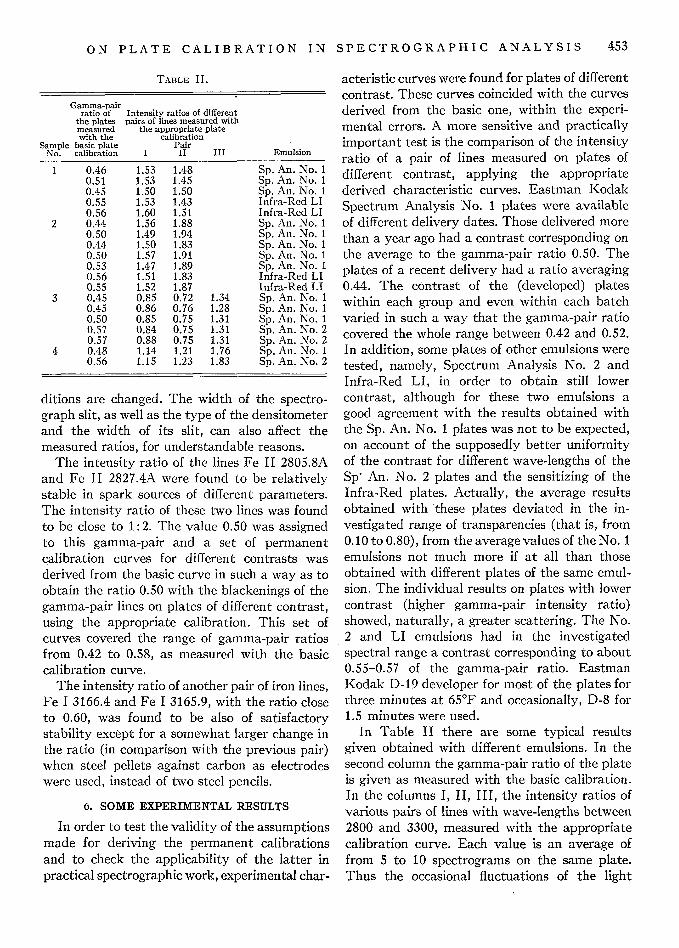
As the calibrations are made for permanentuse, the two-dimensional diagrams can be trans-formed into one-dimensional scales by markingthe transparencies on the corresponding log
/..
FIG. 3.
450
ON PLATE CALIBRATION IN SPECTROGRAPHIC ANALYSIS
intensity axis (Fig. 3), in a similar way, assuggested by Owens8 for the concentration-logintensity relations (analytical scales) and used inconjunction with them. When the dark and theclear-plate galvanometer deviations are adjust-able to 0 and 100, respectively, and the devia-tions are proportional to the transparencies, theycan be used instead of transparencies.
Needless to say, the empirically found basiccharacteristic curve must be made with allpossible care, averaging the results from severalplates of the same contrast, as any error in thebasic curve will be reflected in all the others.A correctly drawn characteristic curve shouldgive intensity ratios independent of the absolutebrightness of the source.
There are several methods of preparing thecharacteristic curves described in the literature.In the next section a procedure is describedwhich does not require the application of anydevice such as step filter, with known trans-parency ratios.
4. PROCEDURE FOR OBTAINING THE BASIC CURVE
The requirements on plate calibration forspectrographic analysis are different from thosefor general photographic radiation measurements.
Measuring the true intensity ratios, for in-stance, in multiplets, is a considerable task. Theplate calibration is made with some kind of stepweakener with accurately known transmissionratios.9 The preparation of the weakener and themeasurement of the transparency for ultravioletlight is not a simple matter, especially in alaboratory not equipped for work of that kind.Furthermore, the relatively long spectrographicslit required for the use of several filter stepsmust be very uniformly illuminated, which re-quires special care. For each wave-length aseparate characteristic curve is necessary.
A different problem is encountered in spectro-graphic analysis. The goal is not the intensityratios; they are only a means for concentrationdetermination. From the relation between in-tensity and transparency (or density) and therelation between intensity and concentration,the intensity has to be eliminated, which is oftenmade by means of a graphical procedure." Not
8J. S. Owens, Metals and Alloys 9, 15 (1938).See, for instance, Dorgelo, Physik. Zeits. 26, 756 (1925).
10 J. S. Owens, reference 8.
only the unit of the intensity scale, but also thetrue values of the intensity ratios (of the im-purity line and the matrix line) are of no sig-nificance. The intensity ratios can be distortedby a constant factor, the same for the character-istic curve and for the concentration calibration.Only the cross ratios are of significance. Ac-cordingly, not the transparency ratios of theneighboring steps of light weakener (filter, stepsector, etc.) but their cross ratios must be known.In the simplest case the cross ratios may beconstant: The transparency ratio of the first stepto that of the second may be the same, as theratio of the second to the third, and so forth.
Therefore, when no step filter or a similardevice with known transparency cross ratios isavailable or its use not desirable, the followingprocedure leads to satisfactory results. Severalspectrograms are made on the same plate withthe same time of exposure, using different lightfilters, such as sieves of different mesh numbers,or some other light weakener. Their transparencyneed not be known. A pair of lines of the matrixelement, which can be used as a gamma-pair, ofdifferent brightness and of a sufficient stabilityis selected, and an arbitrary "intensity ratio" isassigned to this pair of lines. An approximatevalue of the ratio can be found, if desired, bymaking spectrograms with different exposure andapplying the reciprocity law. No use will bemade later of this value other than for character-izing the contrast. The blackenings of these twolines can be used as "steps" for the characteristiccurve of the plate. If the light filters usedhappened to be of such a transparency that thetransparencies (or the galvanometer deviationsof the microphotometer) of the stronger line onone of the spectrograms is equal to the trans-parencies (or the galvanometer deviations) of theweaker line on another spectrogram, and soforth-an ideal case, of course-then the meas-urements can be used for plotting the character-istic curve immediately. An illustrative example:Let us suppose, that the galvanometer deviationsof these two lines in the consecutive spectrogramswere:
Weaker line907351s305168s,
Stronger line7351530616
84.
451
SAUL LEVY
As the intensity ratio of the lines is assumed tobe stable, a curve can be drawn with the galva-nometer deviations as ordinates and equidistantabscissa values using an arbitrary unit of length.This corresponds to a characteristic curve withlog intensity as abscissa. The curve satisfies thecondition that the "intensity ratios" of themeasured lines-that is, the distances on the logintensity scale, corresponding to their trans-parencies, as determined with this curve-areindependent of the absolute brightness of thesource, by virtue of its construction.
The coincidence of the galvanometer devia-tions of the weak and the strong lines in thedifferent spectrograms is not likely to occur;it is, however, not necessary because interpola-tion can be applied. If instead of the readings515 and 3 in the above example, 55 and 33were obtained, then a point corresponding to theordinate 55 is placed on the interpolated curvebetween the points with the ordinates 73 and 515.The point with the ordinate 33 has then anabscissa at a distance from that with the ordinatevalue 55, which corresponds to the accepted"intensity ratio" of the pair. Using the char-acteristic curve constructed in this way, oneobtains intensity ratios proportional to the trueintensity ratios." Accordingly, the analyticalcurves (intensity ratio-concentration relation)for the elements in the samples can be foundfrom the spectrograms, applying for each platethe appropriate calibration.
5. SELECTIONS OF LINES
In connection with plate calibration one isconfronted with the proper selection of lines ofthe necessary stability. It is of interest whetherthe measured intensities of these lines can beexpected to be constant regardless of type ofsource, spectrograph, and densitometer used.The requirements on the constancy of the rela-
"1 If the intensity ratio assigned to the gamma-pair isthe true ratio, the calibration curve will yield true ratiosonly for wave-lengths in the immediate vicinity of thegamma-pair. For other wave-lengths the calibration curvewill in general not vield true ratios anyhow. The fact thatone calibration curve is often successfully used for workingpairs widely scattered in the spectrum seems to indicatethat the units of the log intensity axis of the characteristiccurves for different wave-lengths are approximatelyproportional on plates of changeable contrast. Some directdeterminations of the characteristic curves for differentwave-lengths made on plates with different contrasts seemto support this conclusion. More work has to be done,however, in order to obtain conclusive results.
tive intensity of lines used for plate calibrationmust be very high.
It might seem that the crucial test for theconstancy of intensity ratios is the comparisonof the spectra in an arc and in a spark of somekind. The excitation, because of the differencein temperature, and reabsorption, because ofdifferent vapor density, are in these two sourcesso unlike, that if the lines stand this test, thesame can be expected for any other type ofexcitation. This test is, however, not sufficient.Although lines with stable relative intensitiesare among those which stand this test, furthervariations of the circuit parameters may revealthat the lines are not suitable for calibrationpurposes, for use under changeable conditions.Many of the lines having practically the samerelative intensities in the spark of certain pa-rameters (high self-inductance, for instance) andin the arc, show somewhat different measuredrelative intensities when the parameters arechanged, e.g., a small self-inductance is used orwhen the electrodes are of a different structure.
Several iron lines were investigated in thislaboratory in that respect by variation of theself-inductance and capacitance in the spark andby using alternatively two steel pencils as elec-trodes, or pellets made of steel drillings andsparked against a graphite rod. These are theusual types of samples applied for steel analysis,and it is of importance whether the lines can beused for plate calibrations (or for determinationof the contrast) on any spectrogram of a steelsample. Most of the lines which withstood thefirst-mentioned test showed noticeable, and someconsiderable, change of relative intensities whenmeasured on spectrograms made under differentsparking conditions or with different electrodes.A superficial inspection of the spectrogramsreveals that the sharpness of the lines is different,being in general more diffuse in a spark withsmall self-inductance. Whether the relative in-tensity of the lines is actually changed or themaxima of the lines which are considered in theusual microphotometer technique as the measureof the line intensity are affected by the linebroadening, or whether continua overlap the linespectra in different degree, has not yet beenascertained. Whatever the reasons, the possibilityof a change in the (measured) intensity ratiomust always be considered when sparking con-
452
SPECTROGRAPHIC ANALYSIS 453
TABLE I I.
Gamma-pairratio of Intensity ratios of different
the plates pairs of lines measured withmeasured the appropriate platewith the calibration
Sample basic plate PairNo. calibration I II III Emulsion
1 0.46 1.53 1.48 Sp. An. No. 10.51 1.53 1.45 Sp. An. No. 10.45 1.50 1.50 Sp. An. No. 10.55 1.53 1.43 Infra-Red LI0.56 1.60 1.51 Infra-Red LI
2 0.44 1.56 1.88 Sp. An. No. 10.50 1.49 1.94 Sp. An. No. 10.44 1.50 1.83 Sp. An. No. 10.50 1.57 1.91 Sp. An. No. 10.53 1.47 1.89 Sp. An. No. 10.56 1.51 1.83 Infra-Red LI0.55 1.52 1.87 Infra-Red LI
3 0.45 0.85 0.72 1.34 Sp. An. No. 10.45 0.86 0.76 1.28 Sp. An. No. 10.50 0.85 0.75 1.31 Sp. An. No. 10.57 0.84 0.75 1.31 Sp. An. No. 20.57 0.88 0.75 1.31 Sp. An. No. 2
4 0.48 1.14 1.21 1.76 Sp. An. No. 10.56 1.15 1.23 1.83 Sp An. No. 2
ditions are changed. The width of the spectro-graph slit, as well as the type of the densitometerand the width of its slit, can also affect themeasured ratios, for understandable reasons.
The intensity ratio of the lines Fe II 2805.8Aand Fe II 2827.4A were found to be relativelystable in spark sources of different parameters.The intensity ratio of these two lines was foundto be close to 1:2. The value 0.50 was assignedto this gamma-pair and a set of permanentcalibration curves for different contrasts wasderived from the basic curve in such a way as toobtain the ratio 0.50 with the blackenings of thegamma-pair lines on plates of different contrast,using the appropriate calibration. This set ofcurves covered the range of gamma-pair ratiosfrom 0.42 to 0.58, as measured with the basiccalibration curve.
The intensity ratio of another pair of iron lines,Fe I 3166.4 and Fe I 3165.9, with the ratio closeto 0.60, was found to be also of satisfactorystability except for a somewhat larger change inthe ratio (in comparison with the previous pair)when steel pellets against carbon as electrodeswere used, instead of two steel pencils.
6. SOME EXPERIMENTAL RESULTS
In order to test the validity of the assumptionsmade for deriving the permanent calibrationsand to check the applicability of the latter inpractical spectrographic work, experimental char-
acteristic curves were found for plates of differentcontrast. These curves coincided with the curvesderived from the basic one, within the experi-mental errors. A more sensitive and practicallyimportant test is the comparison of the intensityratio of a pair of lines measured on plates ofdifferent contrast, applying the appropriatederived characteristic curves. Eastman KodakSpectrum Analysis No. 1 plates were availableof different delivery dates. Those delivered morethan a year ago had a contrast corresponding onthe average to the gamma-pair ratio 0.50. Theplates of a recent delivery had a ratio averaging0.44. The contrast of the (developed) plateswithin each group and even within each batchvaried in such a way that the gamma-pair ratiocovered the whole range between 0.42 and 0.52.In addition, some plates of other emulsions weretested, namely, Spectrum Analysis No. 2 andInfra-Red LI, in order to obtain still lowercontrast, although for these two emulsions agood agreement with the results obtained withthe Sp. An. No. 1 plates was not to be expected,on account of the supposedly better uniformityof the contrast for different wave-lengths of theSp' An. No. 2 plates and the sensitizing of theInfra-Red plates. Actually, the average resultsobtained with these plates deviated in the in-vestigated range of transparencies (that is, from0.10 to 0.80), from the average values of the No. 1emulsions not much more if at all than thoseobtained with different plates of the same emul-sion. The individual results on plates with lowercontrast (higher gamma-pair intensity ratio)showed, naturally, a greater scattering. The No.2 and LI emulsions had in the investigatedspectral range a contrast corresponding to about0.55-0.57 of the gamma-pair ratio. EastmanKodak D-19 developer for most of the plates forthree minutes at 650 F and occasionally, D-8 for1.5 minutes were used.
In Table II there are some typical resultsgiven obtained with different emulsions. In thesecond column the gamma-pair ratio of the plateis given as measured with the basic calibration.In the columns 1, II, III, the intensity ratios ofvarious pairs of lines with wave-lengths between2800 and 3300, measured with the appropriatecalibration curve. Each value is an average offrom 5 to 10 spectrograms on the same plate.Thus the occasional fluctuations of the light
ON PLATE CALIBRATION IN
P. A. LEICHTLE
source and possible non-uniformity of the de-veloped plates did not affect appreciably themeasured intensity ratios.
Numerous measurements with the same sam-ples made on different plates, similar to those inTable II, showed an (arithmetical) averagedeviation from the mean values of about ±t1.5percent of ratios not exceeding 2:1. The closerto unity the ratio, the smaller the deviations,as the difference in plate calibrations becomes oflittle importance.
When several spectrograms are made on thesame plate and the time permits, it is advisableto measure the gamma-pair ratio on severalspectrograms and to apply the mean value.Also, different gamma-pairs, of different ratios,can be used for better determination of the platecontrast. In such cases the advantage comparedwith the usual method of plate calibration isnot the elimination of numerous measurementsbut avoiding the plotting of the curve in haste,which can occasionally be a source of consider-able error, particularly for higher densities.
In order to check the proper choice of theplate calibration, in addition to the measuringthe gamma-pair ratio, the following procedureis often convenient, when the concentration canbe determined by means of two different ana-
JOURNAL OF THE OPTICAL SOCIETY OF AMERICA
lytical pairs. In these cases the reference lines(internal standards) are chosen usually in sucha way that the intensity ratio of one analyticalpair is smaller than 1, that of the other pair islarger than 1. The concentration determinedwith two such analytical pairs is identical onlywhen measured with the correct plate calibrationcurve, as otherwise the calculated intensityratios are distorted in the opposite directions.The selection of the calibrations in the seriesreproduced in Table II was, however, not cor-rected by this method.
SUMMARY
The possibility of application of permanentplate calibrations for analytical spectroscopy isdiscussed and the preparation of a set of calibra-tions for plates of different contrast is described.Some experimental results are given illustratingthe applicability of the procedure.
The writer expresses his sincere gratitude tothe members of the Spectrographic Laboratory,Chemical Department, Gary Works for all themeasurements made in connection with thisinvestigation. He is particularly obliged to D. I.Byrge, 0. W. Christine, R. H. Colin, and J. W.Macedo for their active help.
VOLUME 34, NUMBER 8 AUGUST, 1944
Spectrographic Determination of Trace Elements in 70/30 Brass andAdmiralty Brass. Part 1*
P. A. LEICHTLEChase Brass & Copper Company, Inc., Waterbury, Connecticut
A spectrographic procedure for the simultaneous determination of Pb, Fe, Ni, Sn, Bi, and Sbin 70/30 brass and admiralty brass is described in detail. The source is a 14-ampere low voltaged.c. arc of conventional type. A 50-mg pellet sample is arced to extinction in a cupped graphiteelectrode of specified dimensions. The "intermediate mode" of illumination obtained by focusingthe source on the collimator lens is used. A radial sector disk placed at the slit is used to regulatethe effective exposure at the plate. The step sector method of plate calibration is used. The sourcefor the calibration is a 4-ampere d.c. arc on A" diameter copper electrodes. The calibrationcurve on the copper line 2882.934A is used for a wave-length region 2590A-3100A. The copperreference line of 2858.734A is chosen for comparison with the respective impurity lines. Workingcurves are given for the determination of Pb, Fe, Ni, Sn, and Sb in the range of 0.01-0.10 per-cent and Bi in the range of 0.0004-0.010 percent.
INTRODUCTION a large number of copper and brass products forT HE Analytical Section of our Research De- conformity with specifications of composition.
l partment has the responsibility of testing The chief chemist has various analytical toolsPresentedantthOpticlSocetyMetingOctob 9 and methods at his disposal. Generally, the
1943reseatt henptica ier major constituents are analyzed by chemical1943, at Pittsburgh, Pennsylvania.'mao costuns re nly dby hmcl