24
On Ridesharing Competition and Accessibility: Evidence from Uber , Lyft, and Taxi Shan Jiang, Le Chen, Alan Mislove, Christo Wilson Northeastern University
On Ridesharing Competition and Accessibility: Evidence from Uber, Lyft, and Taxi
Shan Jiang, Le Chen, Alan Mislove, Christo Wilson
Northeastern University
On Ridesharing Competition and Accessibility: Evidence from Uber, Lyft, and Taxi Shan Jiang et al.
Northeastern University The Web Conference 2018
Outline
1
• Background
• Data collection
• Results on competition and accessibility
On Ridesharing Competition and Accessibility: Evidence from Uber, Lyft, and Taxi Shan Jiang et al.
Northeastern University The Web Conference 2018
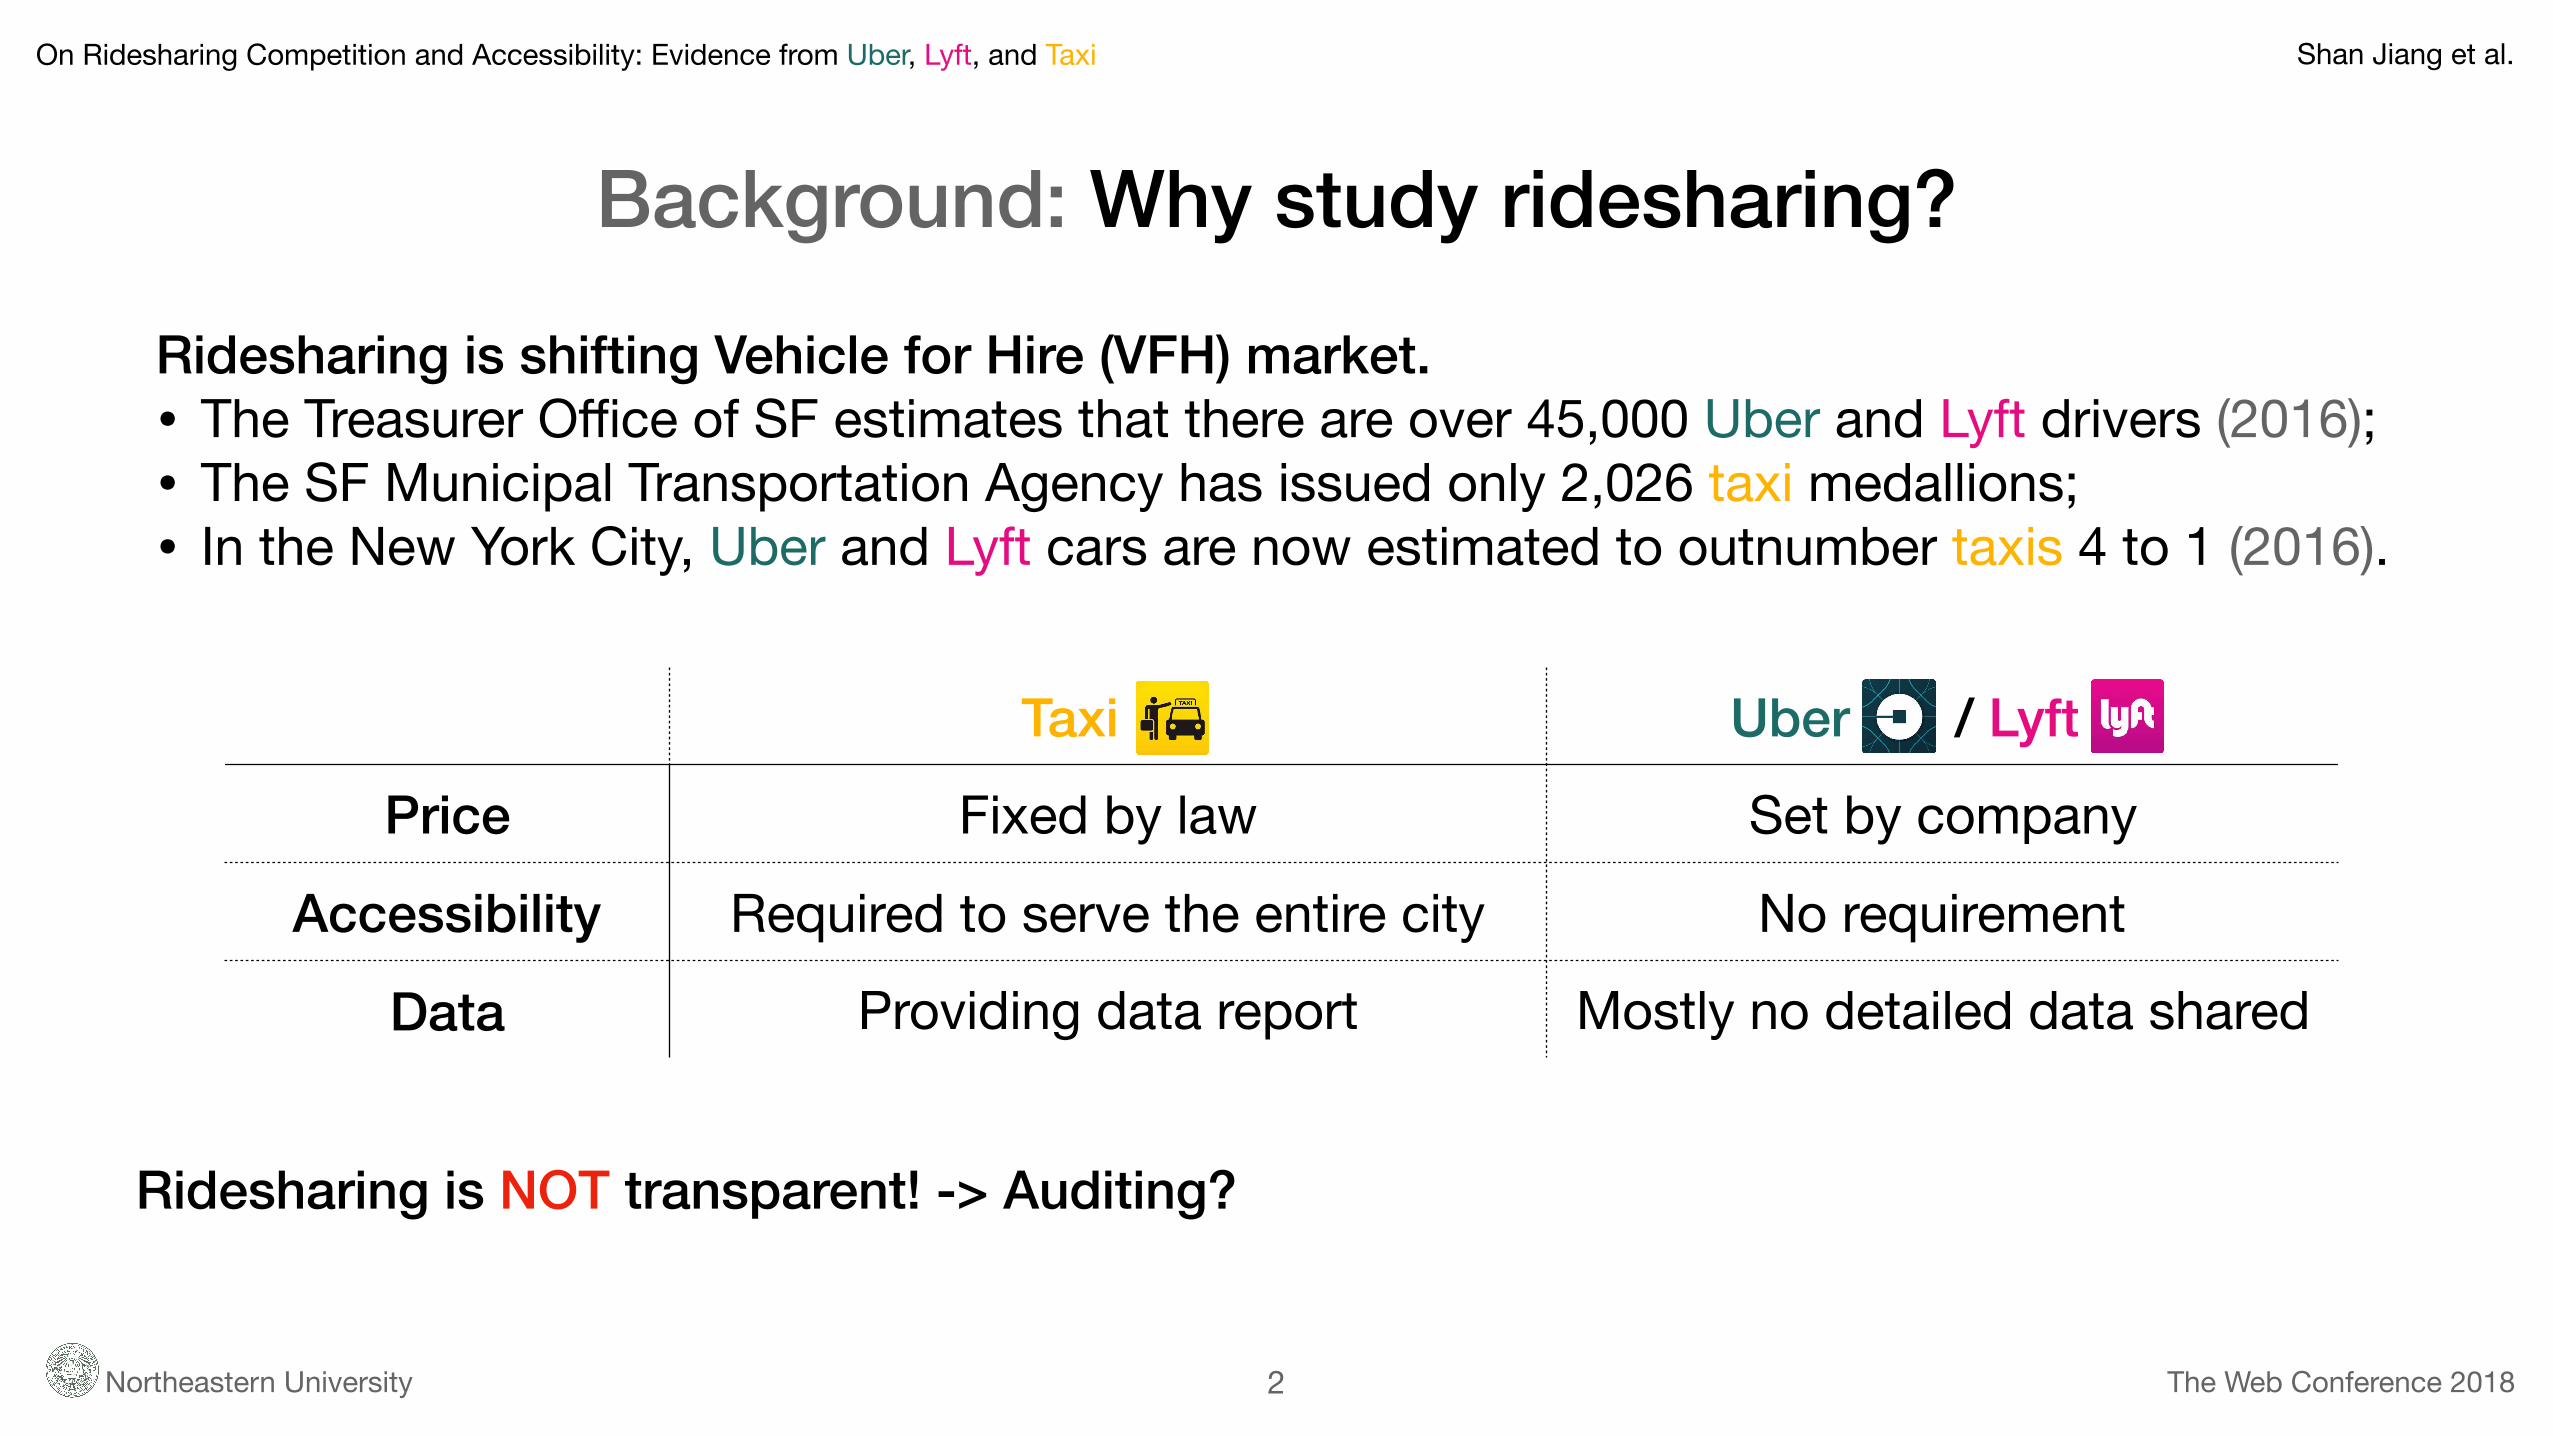
Background: Why study ridesharing?
2
Ridesharing is shifting Vehicle for Hire (VFH) market. • The Treasurer Office of SF estimates that there are over 45,000 Uber and Lyft drivers (2016);• The SF Municipal Transportation Agency has issued only 2,026 taxi medallions;• In the New York City, Uber and Lyft cars are now estimated to outnumber taxis 4 to 1 (2016).
Taxi m Uber m / Lyft m
Price Fixed by law Set by company
Accessibility Required to serve the entire city No requirement
Data Providing data report Mostly no detailed data shared
Ridesharing is NOT transparent! -> Auditing?
On Ridesharing Competition and Accessibility: Evidence from Uber, Lyft, and Taxi Shan Jiang et al.
Northeastern University The Web Conference 2018
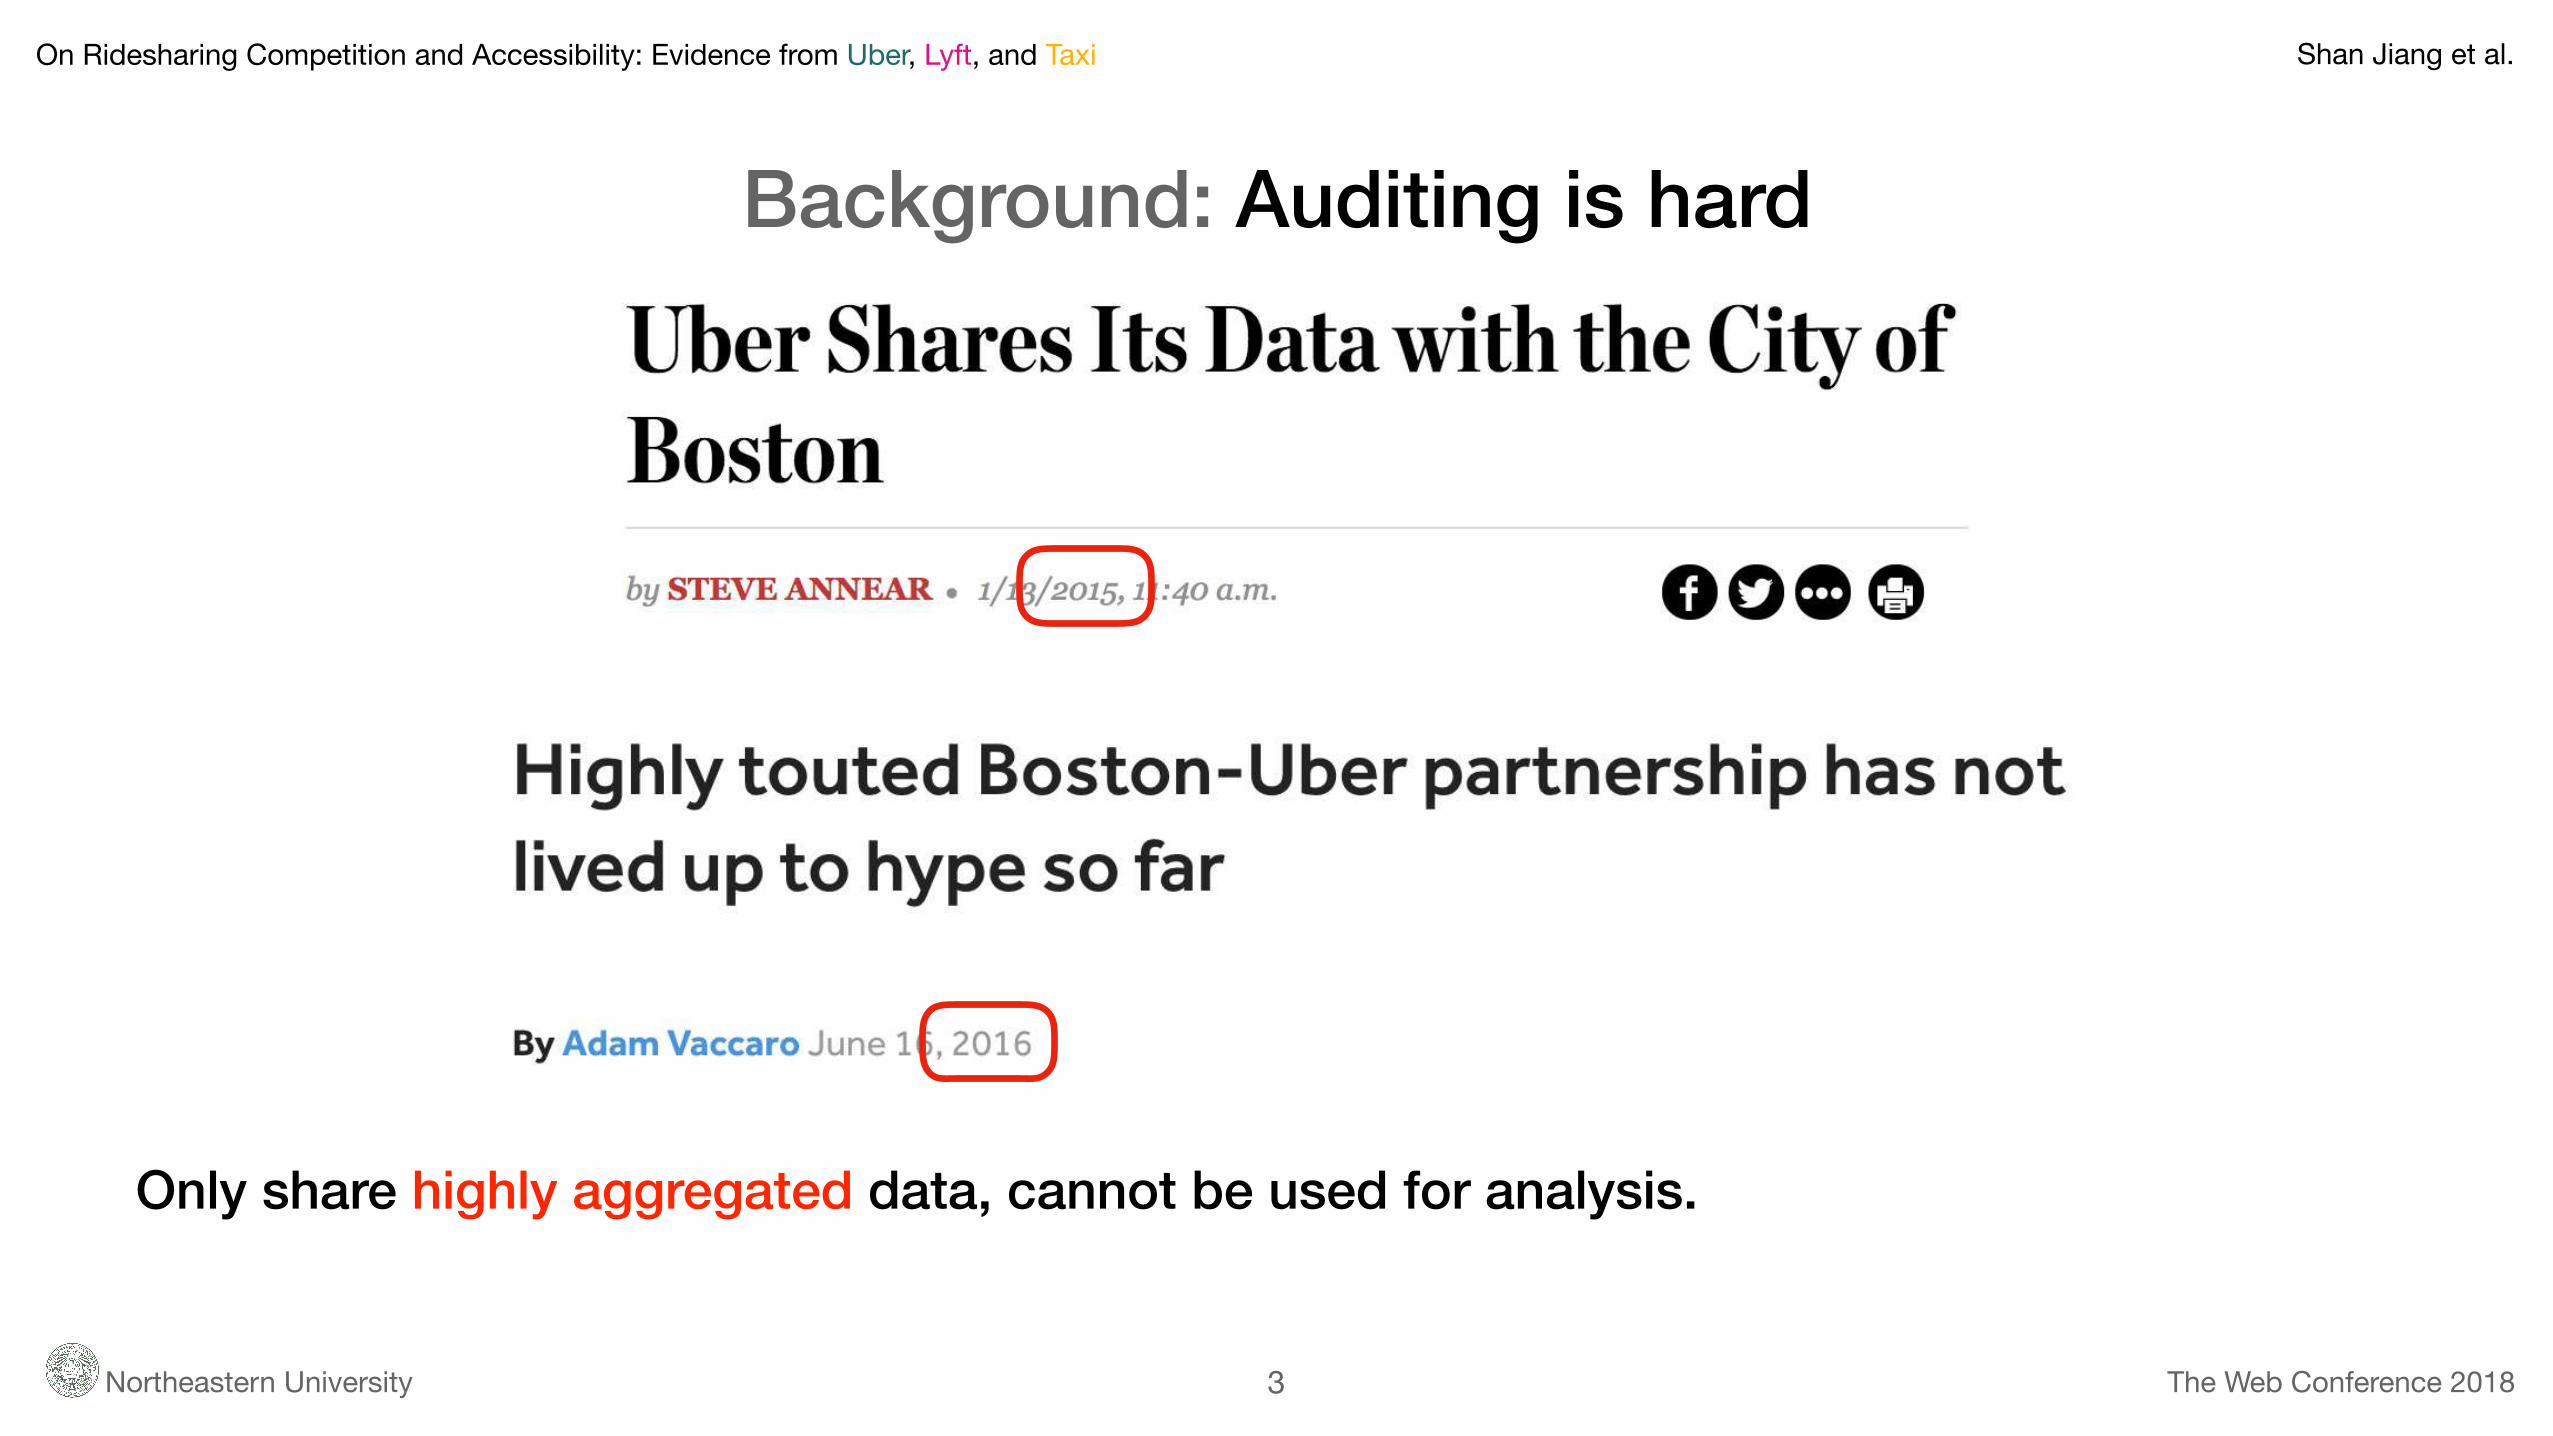
Background: Auditing is hard
3
Only share highly aggregated data, cannot be used for analysis.
On Ridesharing Competition and Accessibility: Evidence from Uber, Lyft, and Taxi Shan Jiang et al.
Northeastern University The Web Conference 2018
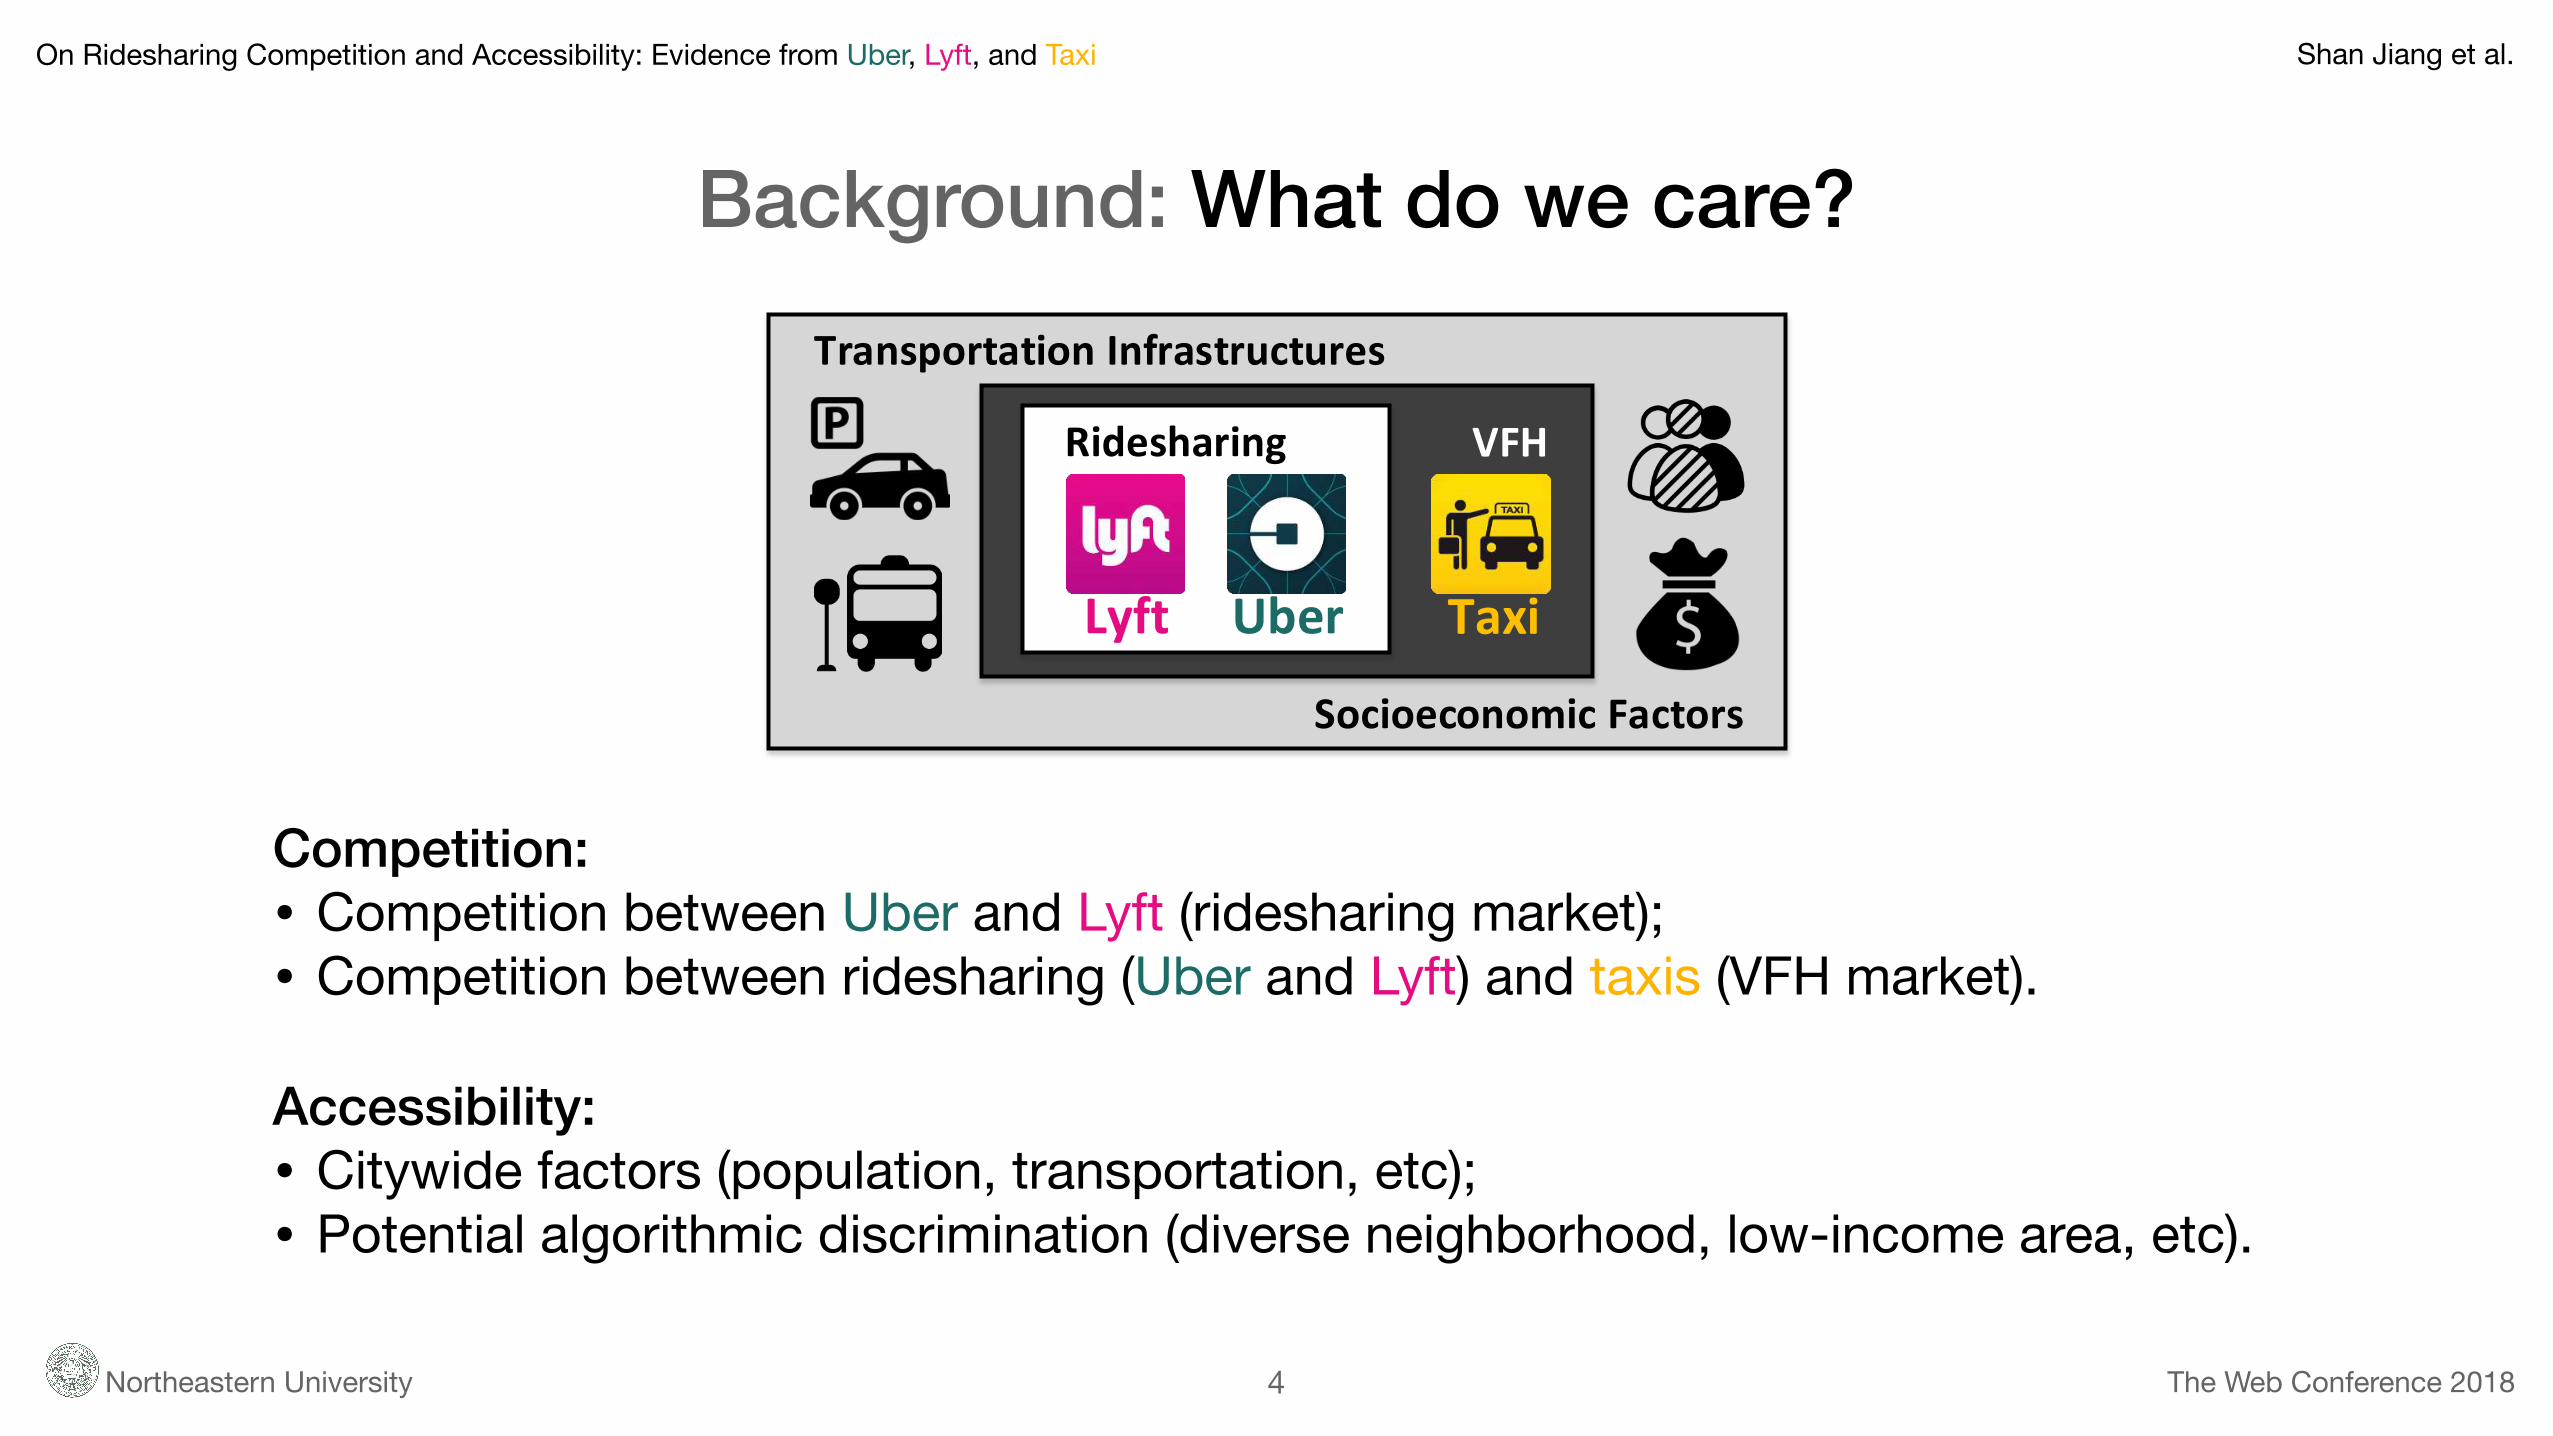
Background: What do we care?
4
Lyft Uber Taxi
Ridesharing
Socioeconomic Factors
VFH
Transportation Infrastructures
Competition: • Competition between Uber and Lyft (ridesharing market);• Competition between ridesharing (Uber and Lyft) and taxis (VFH market).
Accessibility: • Citywide factors (population, transportation, etc);• Potential algorithmic discrimination (diverse neighborhood, low-income area, etc).
On Ridesharing Competition and Accessibility: Evidence from Uber, Lyft, and Taxi Shan Jiang et al.
Northeastern University The Web Conference 2018
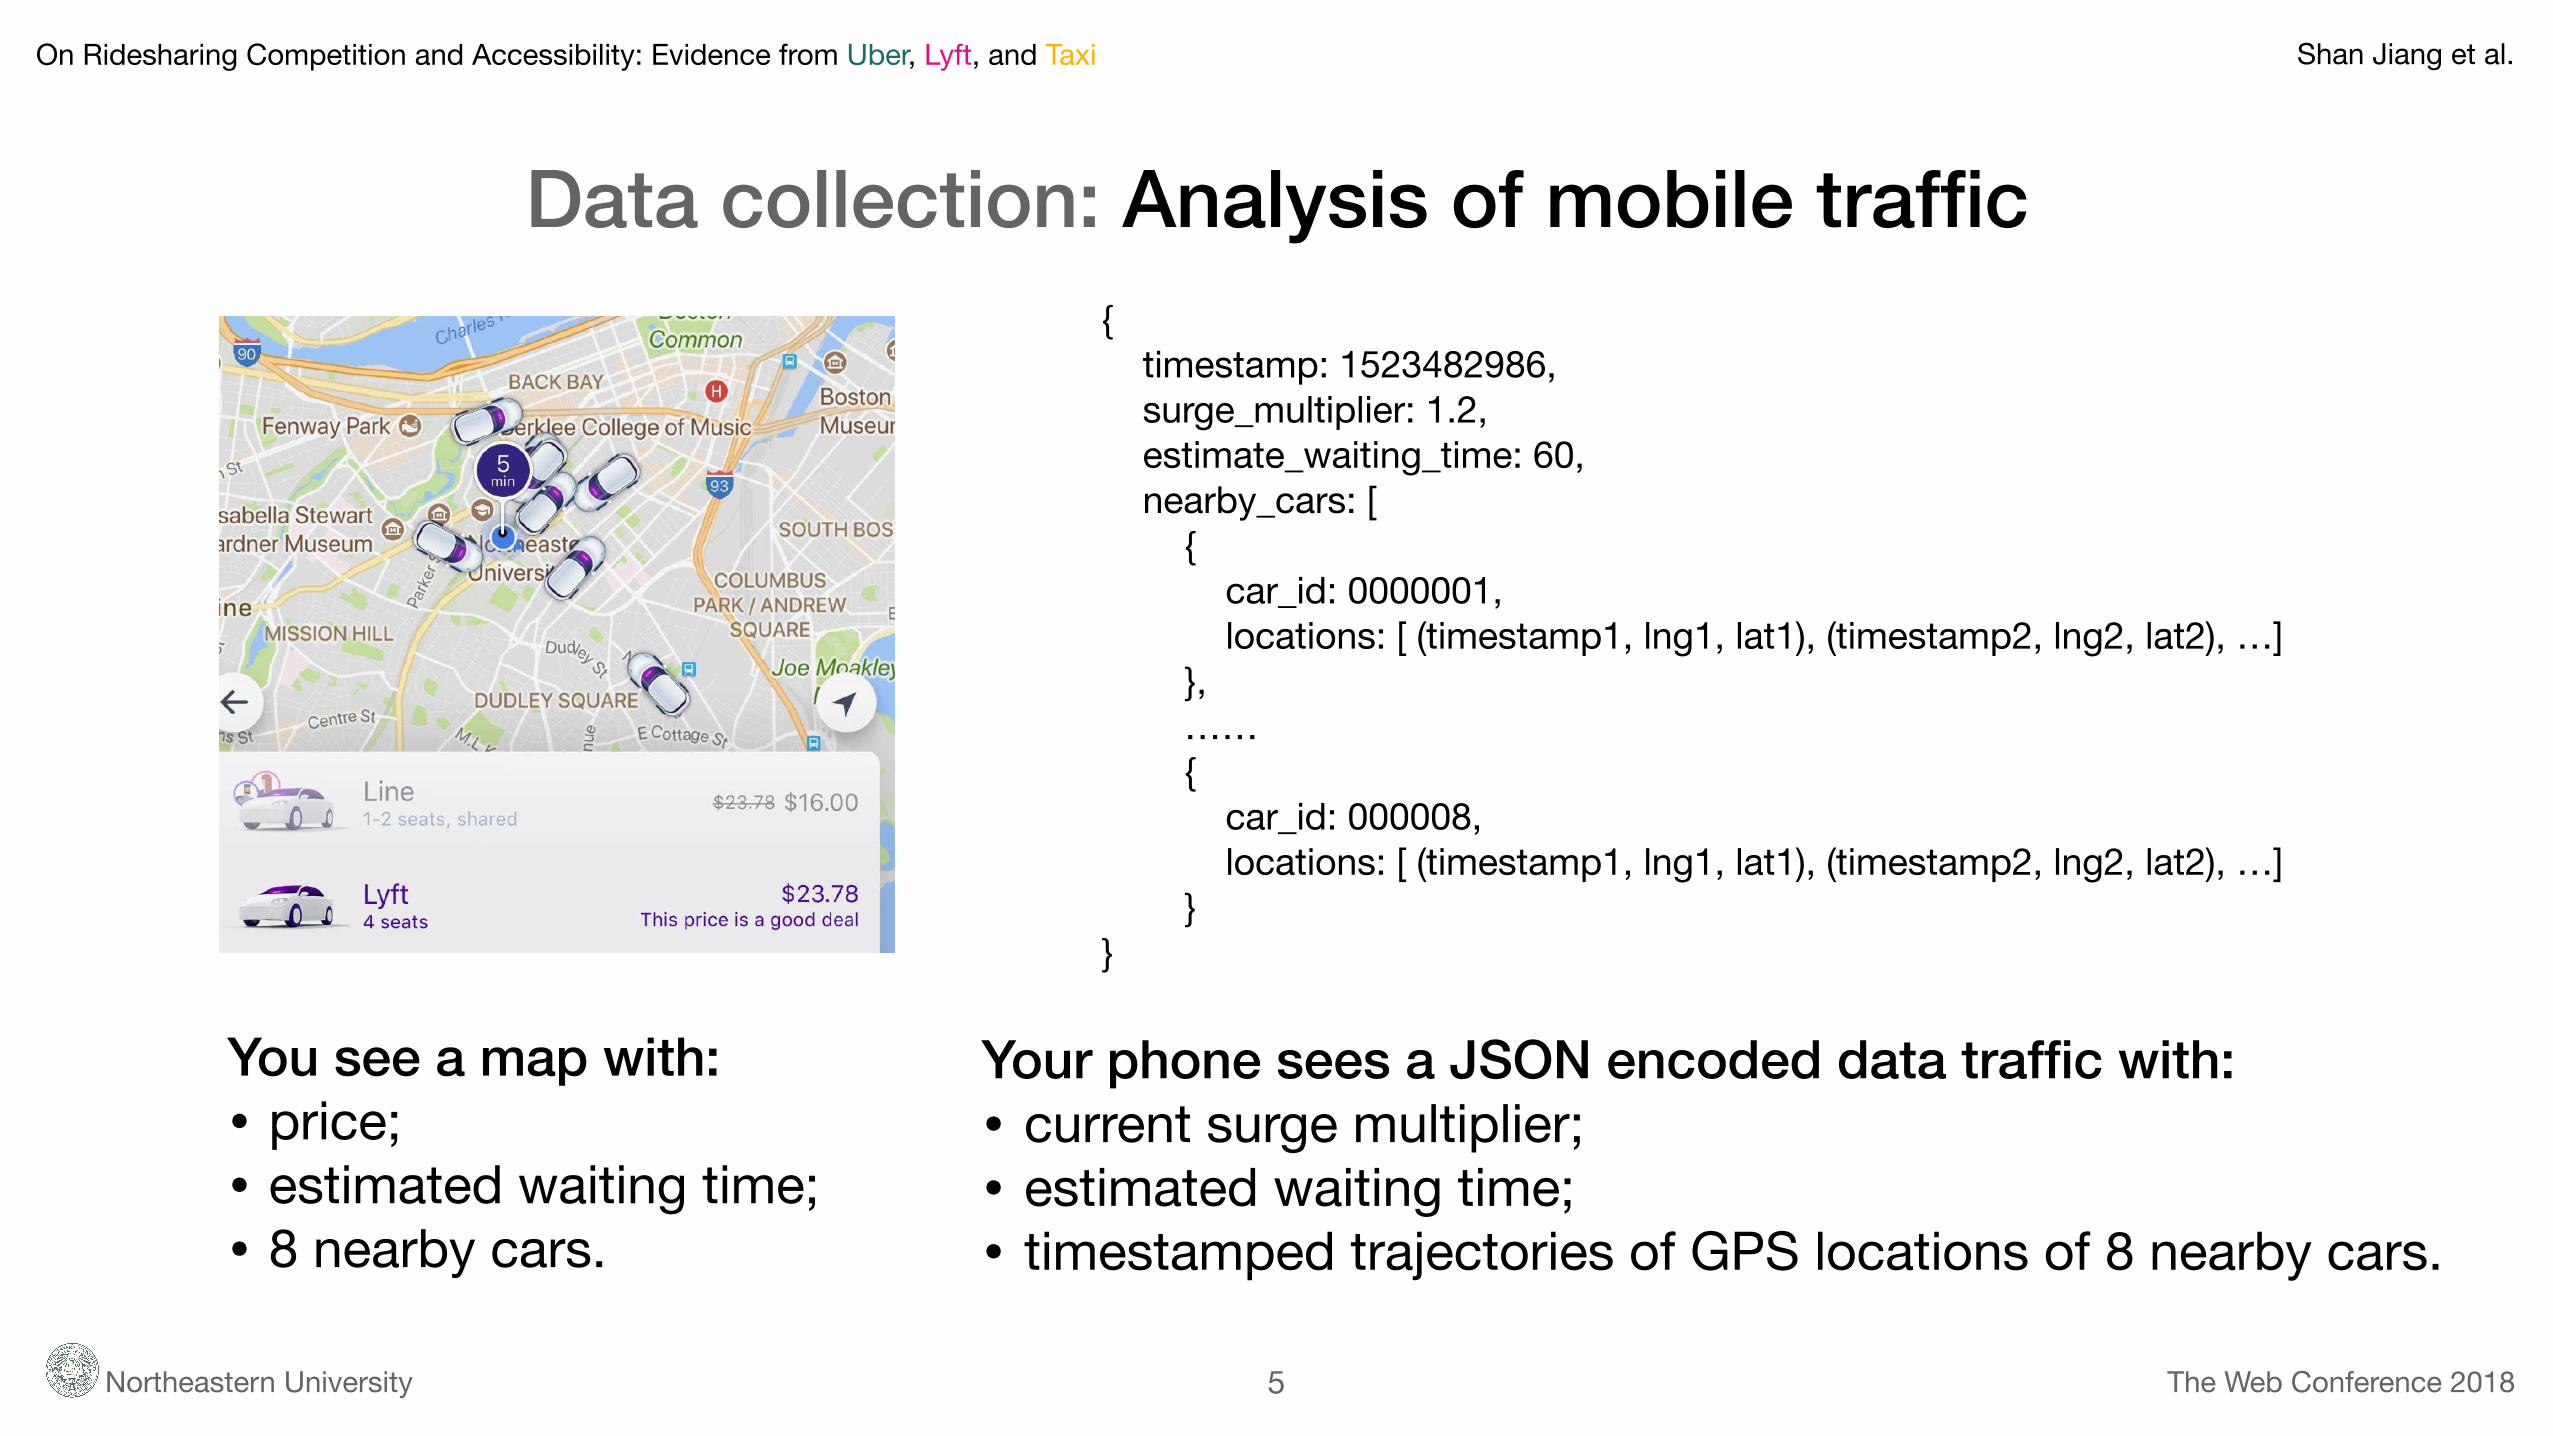
Data collection: Analysis of mobile traffic
5
You see a map with: • price;• estimated waiting time;• 8 nearby cars.
{ timestamp: 1523482986, surge_multiplier: 1.2, estimate_waiting_time: 60, nearby_cars: [ { car_id: 0000001, locations: [ (timestamp1, lng1, lat1), (timestamp2, lng2, lat2), …] }, …… { car_id: 000008, locations: [ (timestamp1, lng1, lat1), (timestamp2, lng2, lat2), …] }}
Your phone sees a JSON encoded data traffic with: • current surge multiplier;• estimated waiting time;• timestamped trajectories of GPS locations of 8 nearby cars.
On Ridesharing Competition and Accessibility: Evidence from Uber, Lyft, and Taxi Shan Jiang et al.
Northeastern University The Web Conference 2018
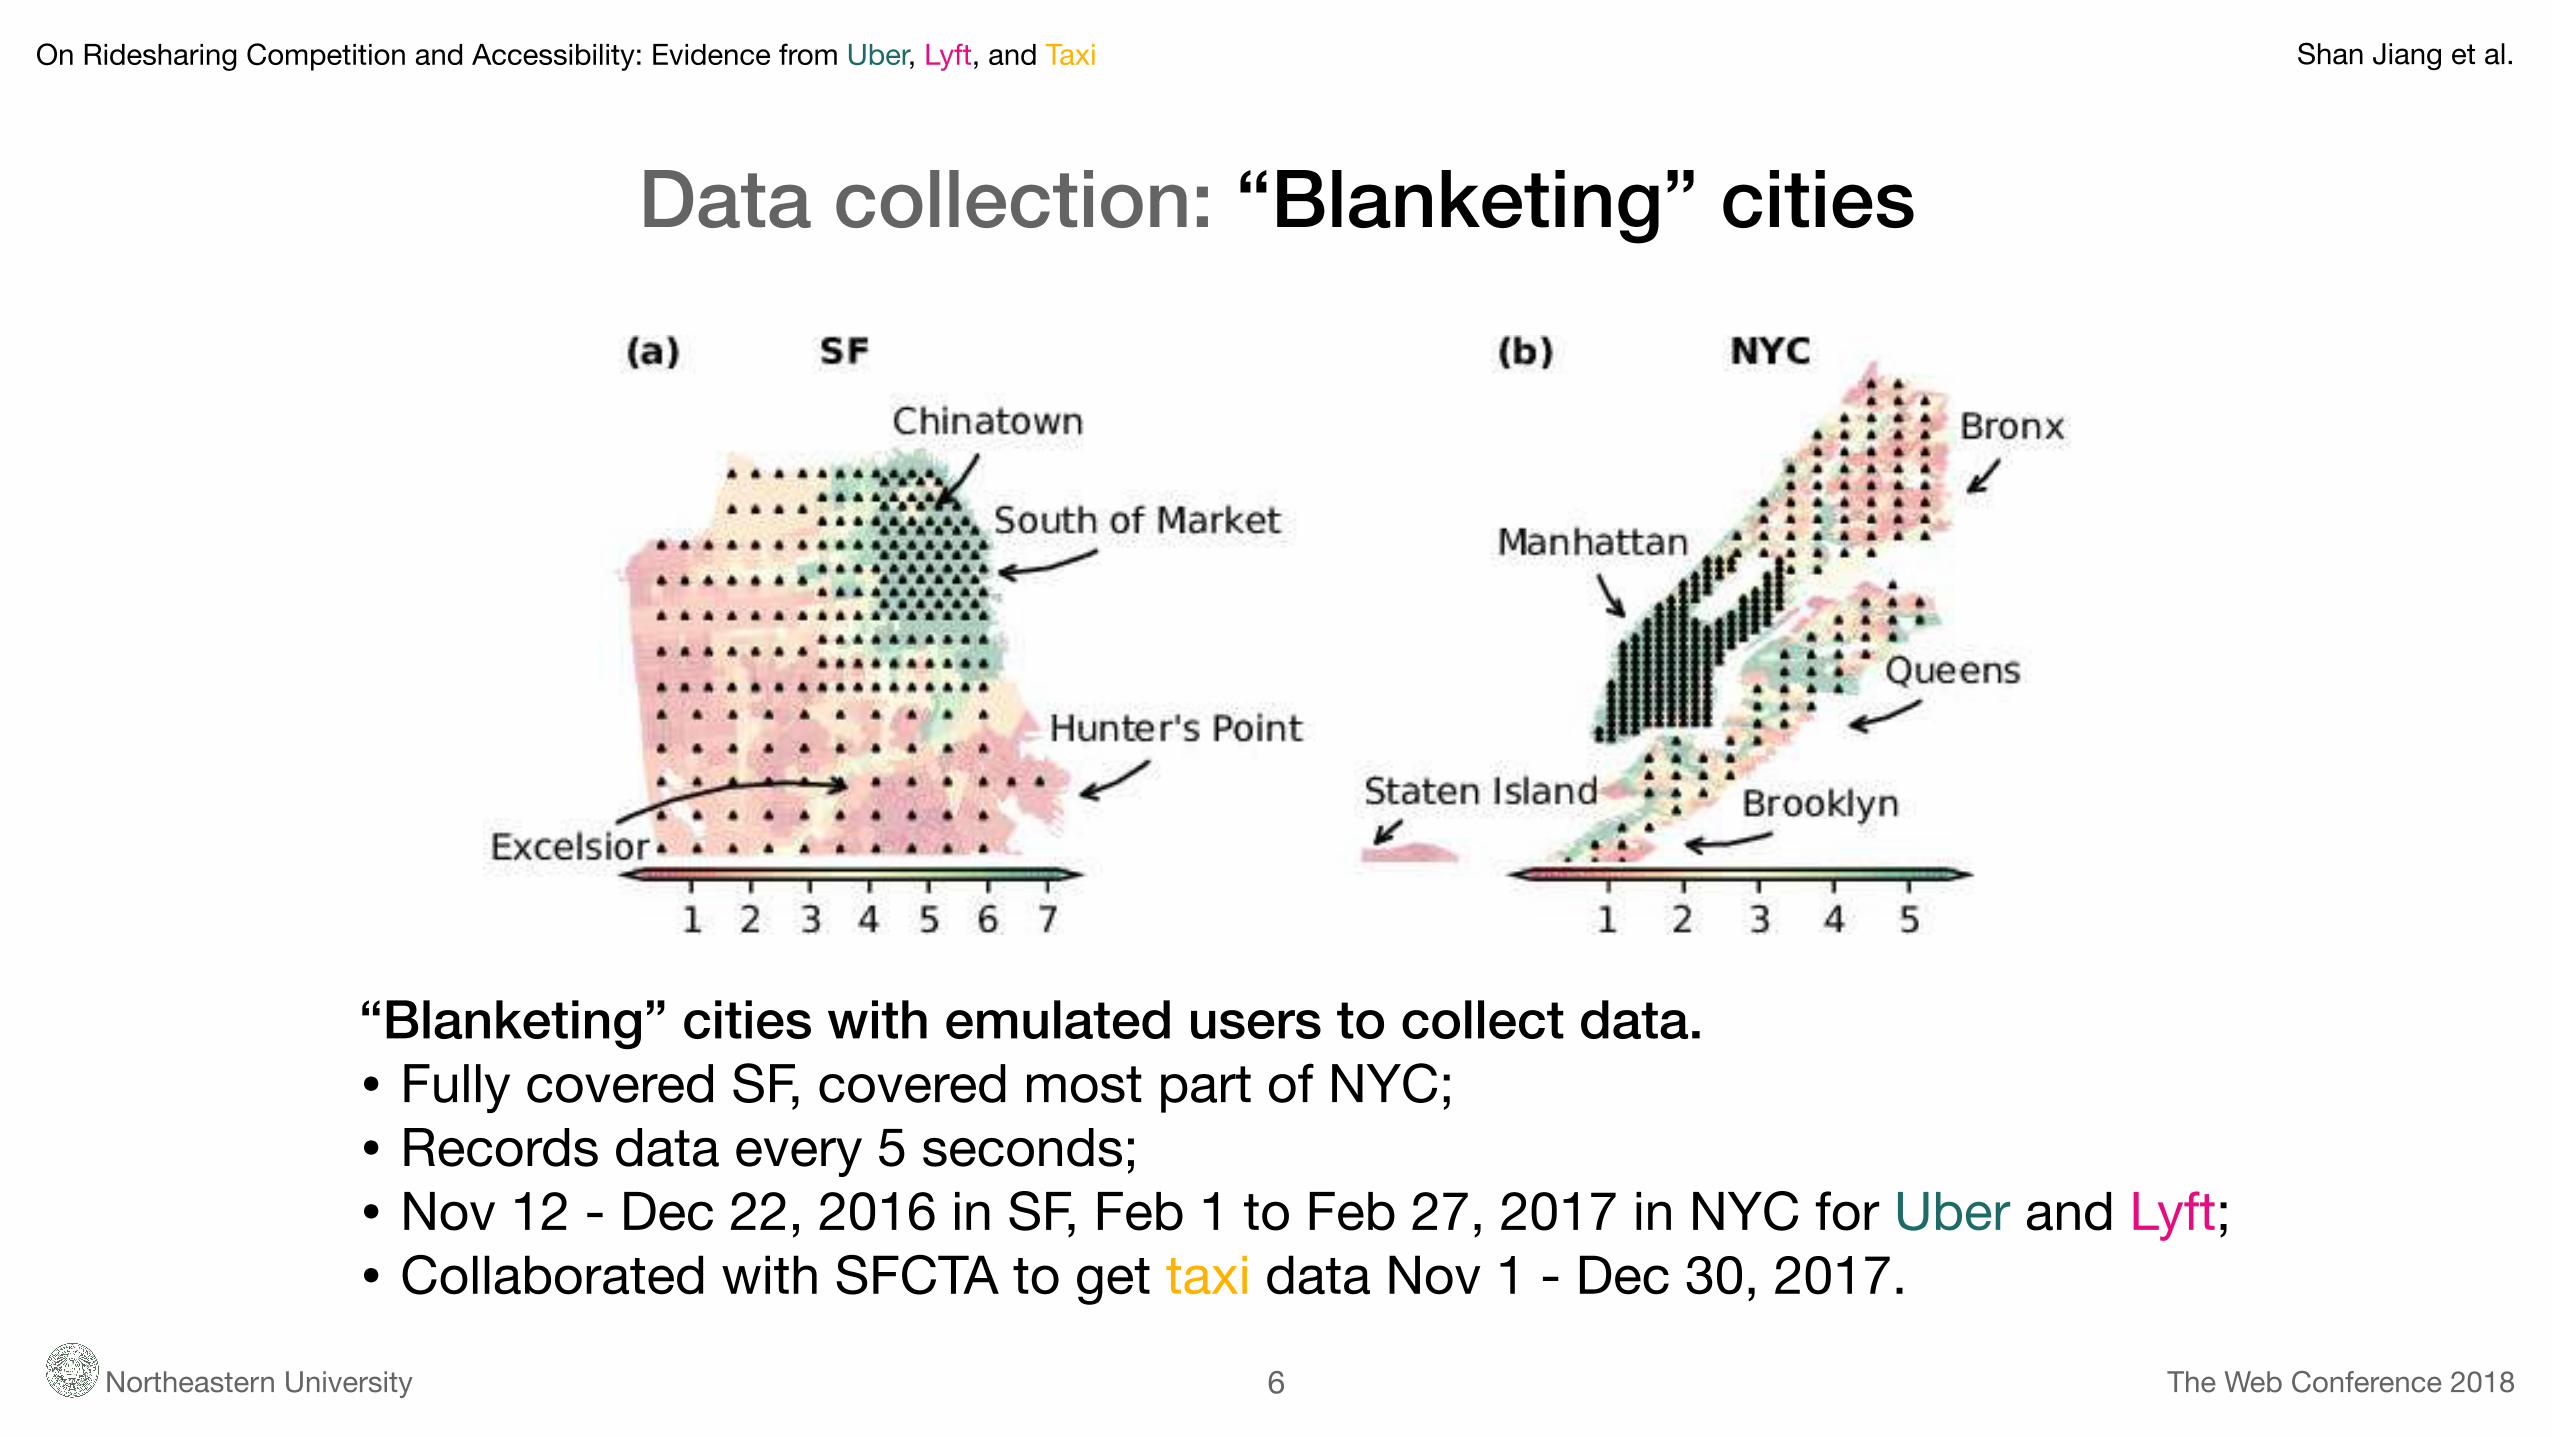
Data collection: “Blanketing” cities
6
“Blanketing” cities with emulated users to collect data. • Fully covered SF, covered most part of NYC;• Records data every 5 seconds;• Nov 12 - Dec 22, 2016 in SF, Feb 1 to Feb 27, 2017 in NYC for Uber and Lyft;• Collaborated with SFCTA to get taxi data Nov 1 - Dec 30, 2017.
On Ridesharing Competition and Accessibility: Evidence from Uber, Lyft, and Taxi Shan Jiang et al.
Northeastern University The Web Conference 2018
Data collection: Ethics
7
NO personal information collected. • All identifiers are opaque IDs.
NO impact on ridesharing platforms, drivers or riders. • We only observed nearby cars, and never requested any actual rides;• Our infrastructure has the same behavior as ordinary smartphone apps.
Positive impact on the society. • SFCTA report: http://www.sfcta.org/tncstoday• Visualization: http://tncstoday.sfcta.org• Regulation in process…

On Ridesharing Competition and Accessibility: Evidence from Uber, Lyft, and Taxi Shan Jiang et al.
Northeastern University The Web Conference 2018
Data preprocessing: Inferring supply and demand
8
Aggregate data to get index of market features (block-group level, 5-minute window). • Supply: the number of available cars;• Demand: the number of disappearing cars;• Price: the average price;
* More details in our paper.
On Ridesharing Competition and Accessibility: Evidence from Uber, Lyft, and Taxi Shan Jiang et al.
Northeastern University The Web Conference 2018
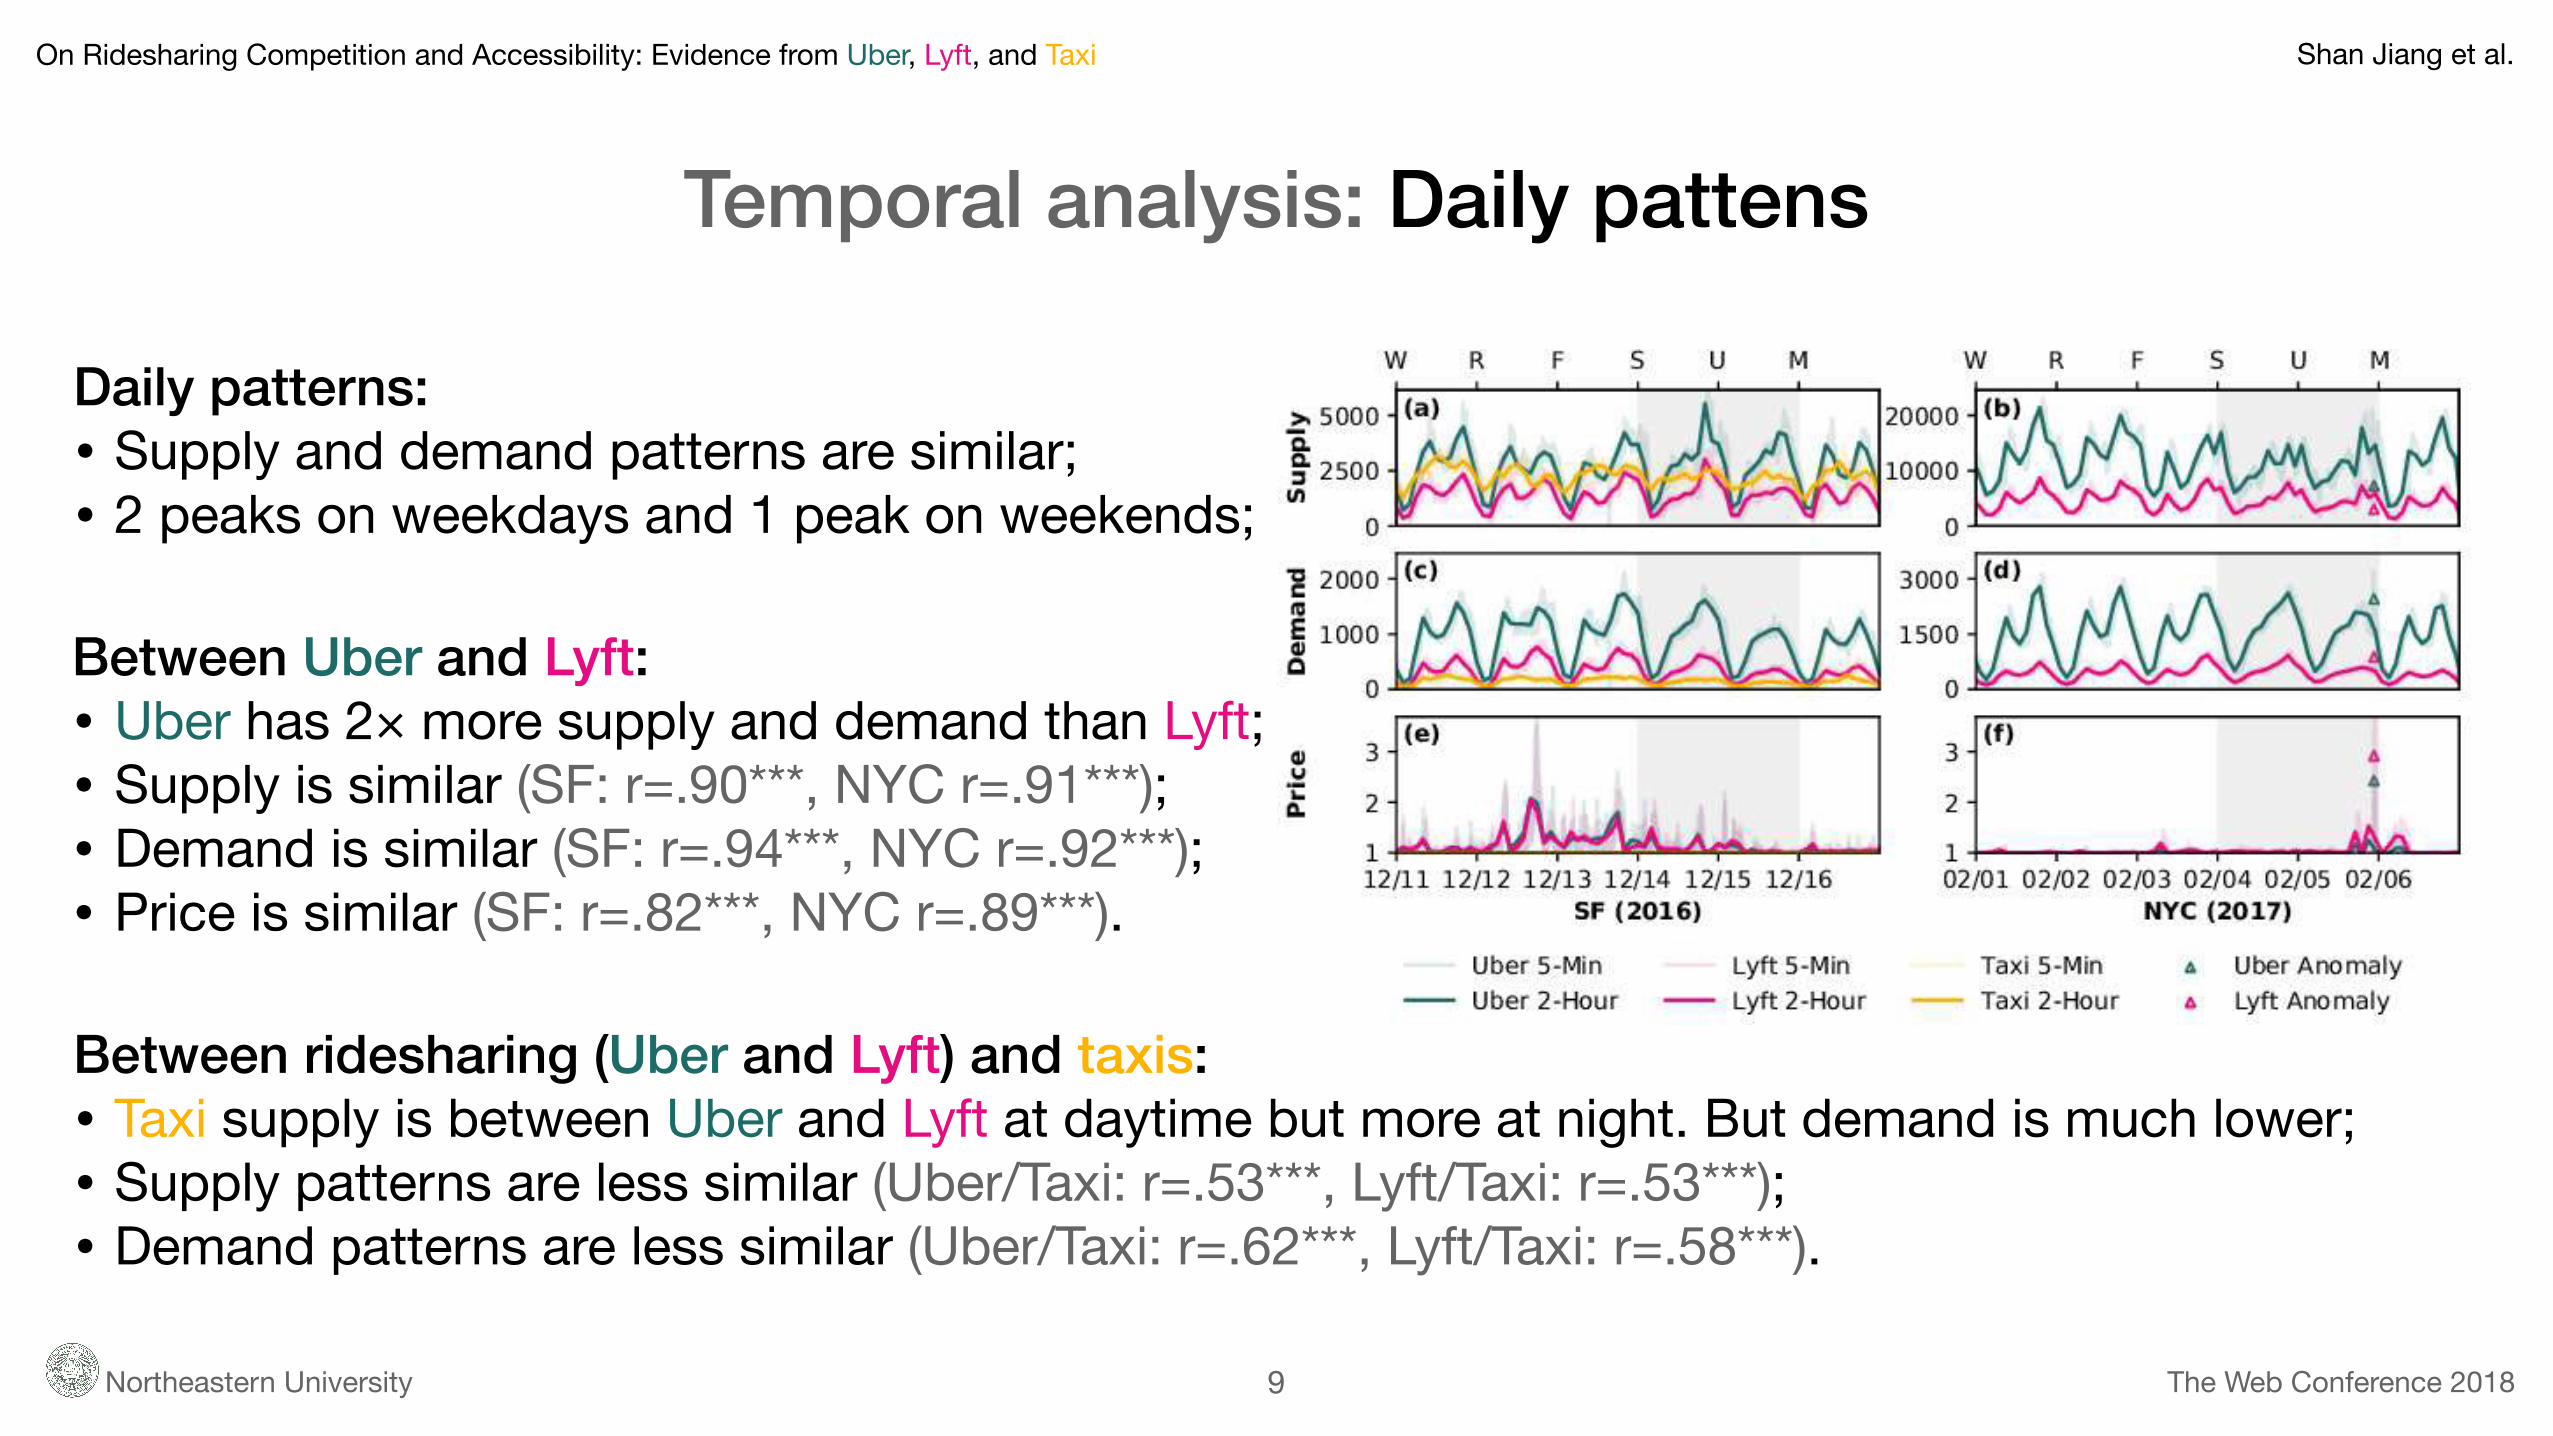
Temporal analysis: Daily pattens
9
Daily patterns: • Supply and demand patterns are similar;• 2 peaks on weekdays and 1 peak on weekends;
Between Uber and Lyft: • Uber has 2× more supply and demand than Lyft;• Supply is similar (SF: r=.90***, NYC r=.91***);• Demand is similar (SF: r=.94***, NYC r=.92***);• Price is similar (SF: r=.82***, NYC r=.89***).
Between ridesharing (Uber and Lyft) and taxis: • Taxi supply is between Uber and Lyft at daytime but more at night. But demand is much lower;• Supply patterns are less similar (Uber/Taxi: r=.53***, Lyft/Taxi: r=.53***);• Demand patterns are less similar (Uber/Taxi: r=.62***, Lyft/Taxi: r=.58***).
On Ridesharing Competition and Accessibility: Evidence from Uber, Lyft, and Taxi Shan Jiang et al.
Northeastern University The Web Conference 2018
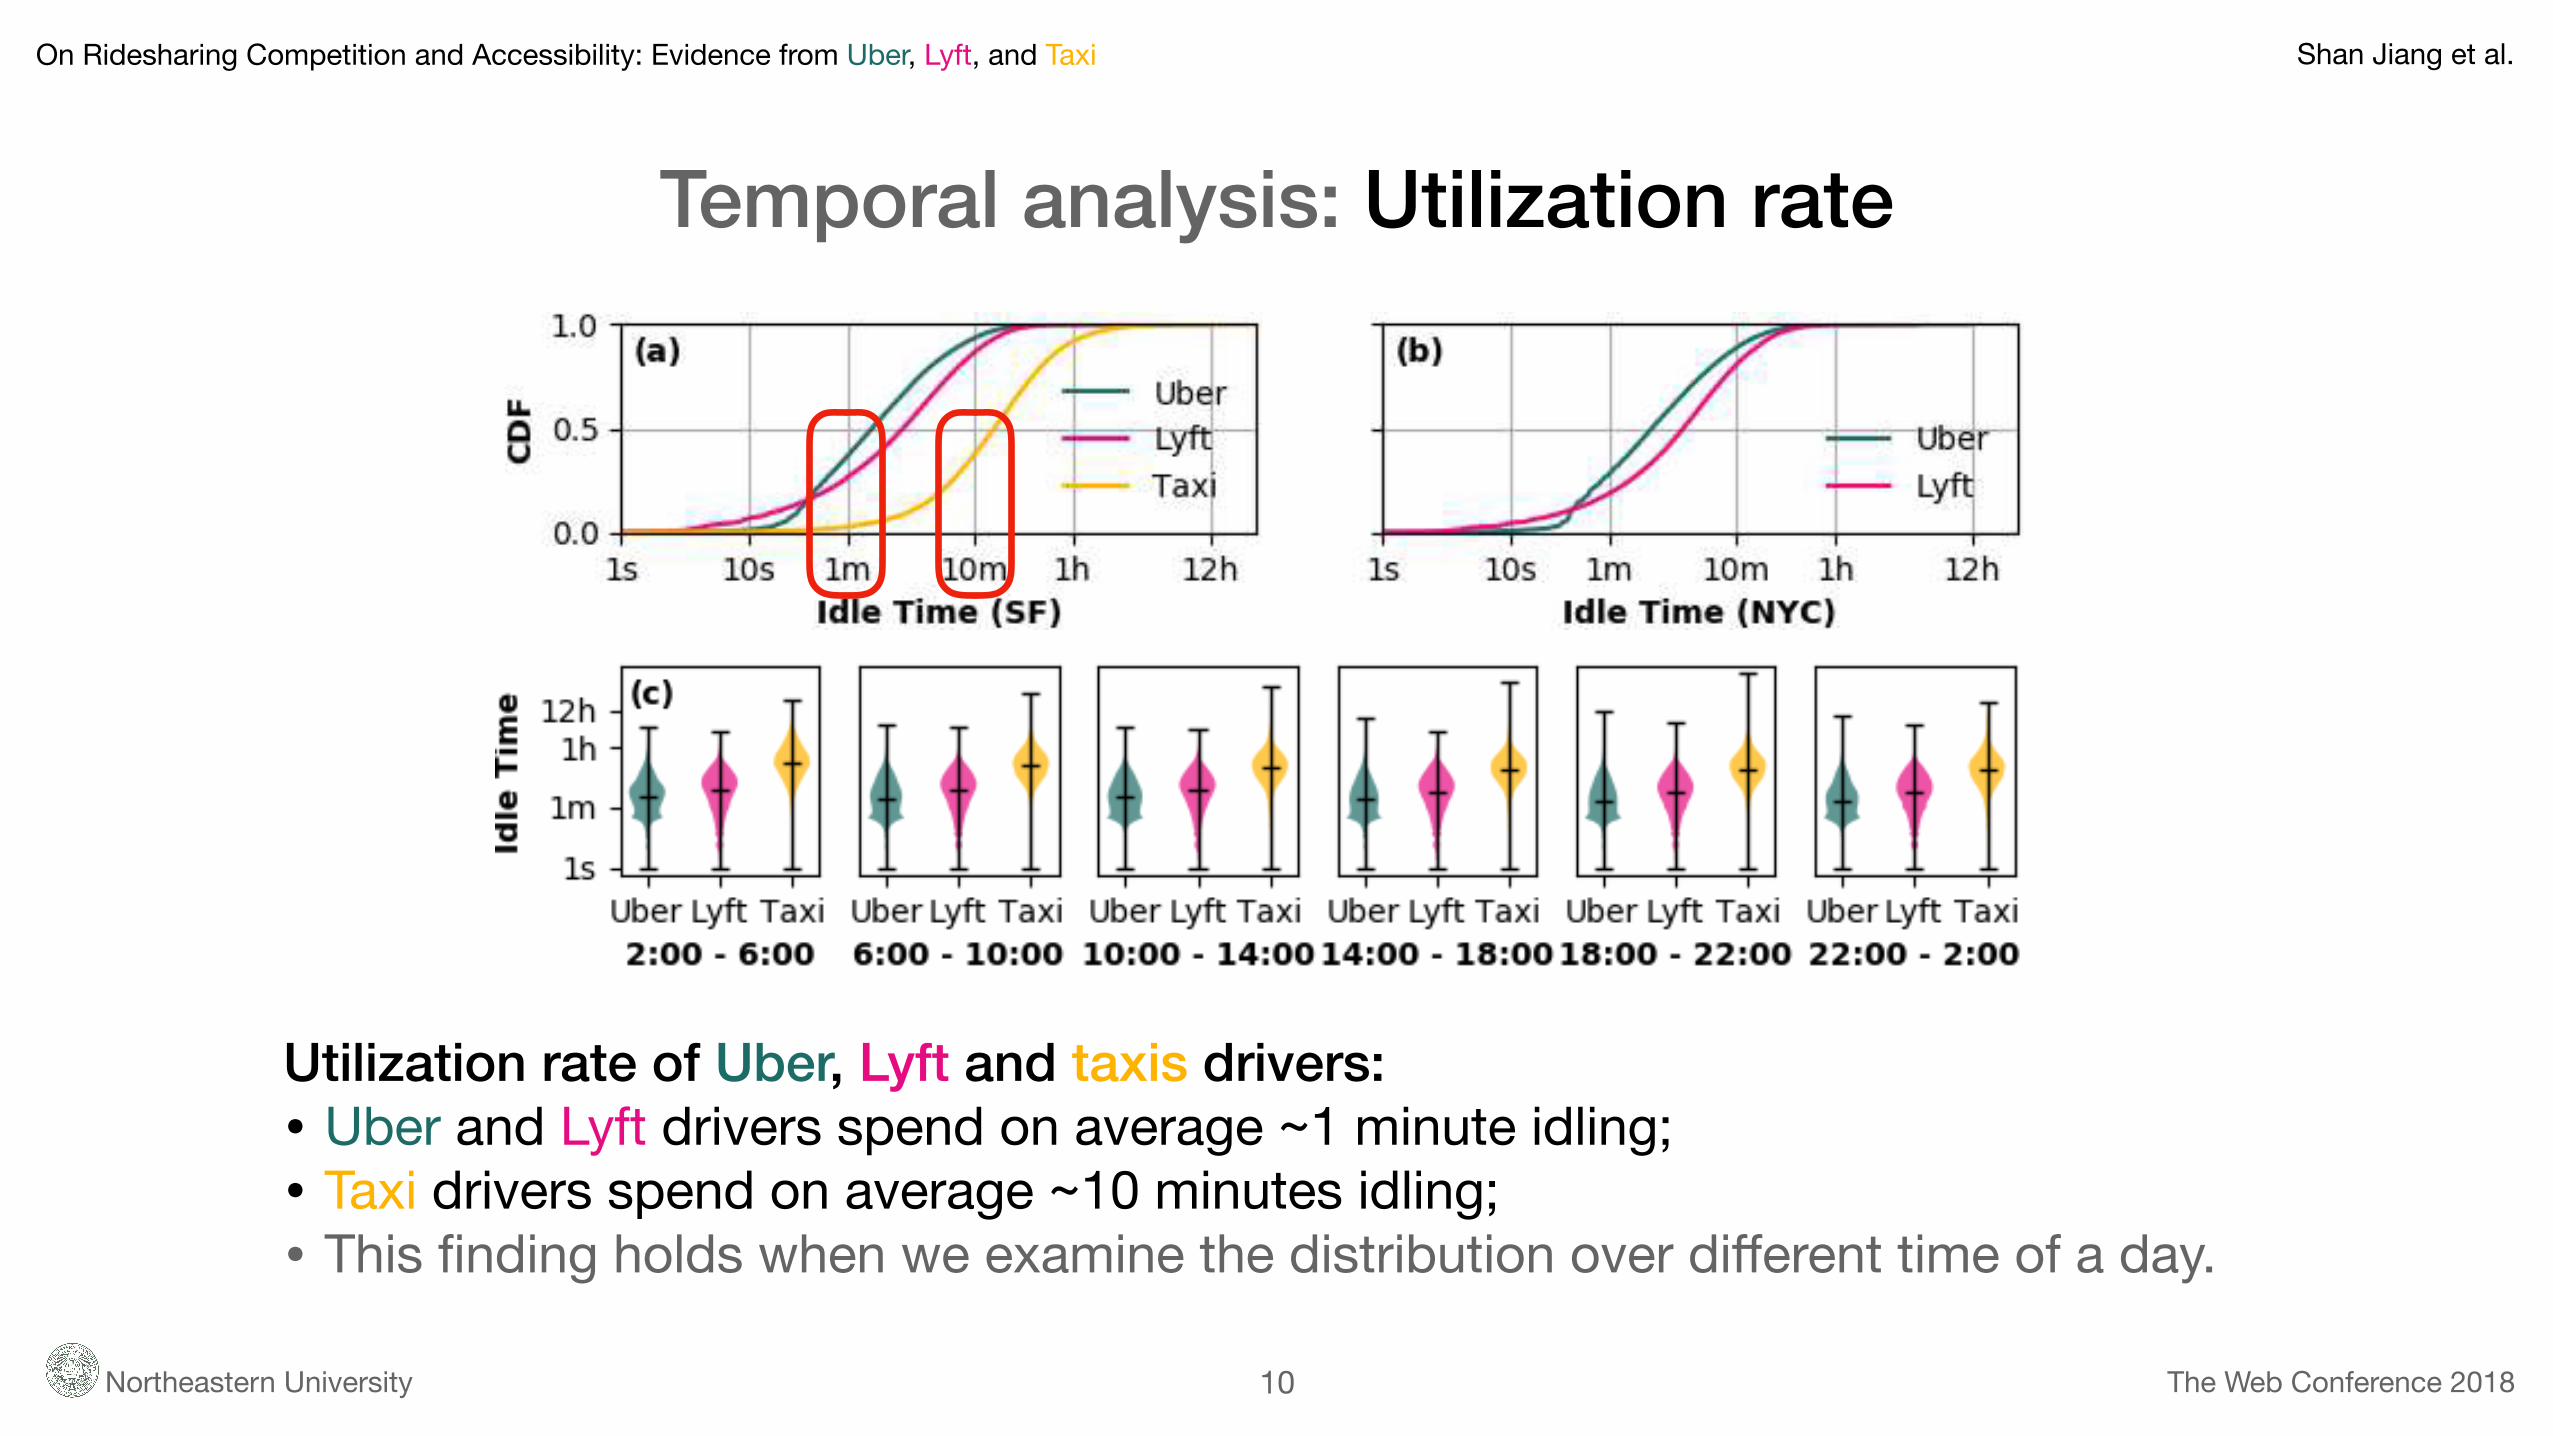
Temporal analysis: Utilization rate
10
Utilization rate of Uber, Lyft and taxis drivers: • Uber and Lyft drivers spend on average ~1 minute idling;• Taxi drivers spend on average ~10 minutes idling;• This finding holds when we examine the distribution over different time of a day.
On Ridesharing Competition and Accessibility: Evidence from Uber, Lyft, and Taxi Shan Jiang et al.
Northeastern University The Web Conference 2018
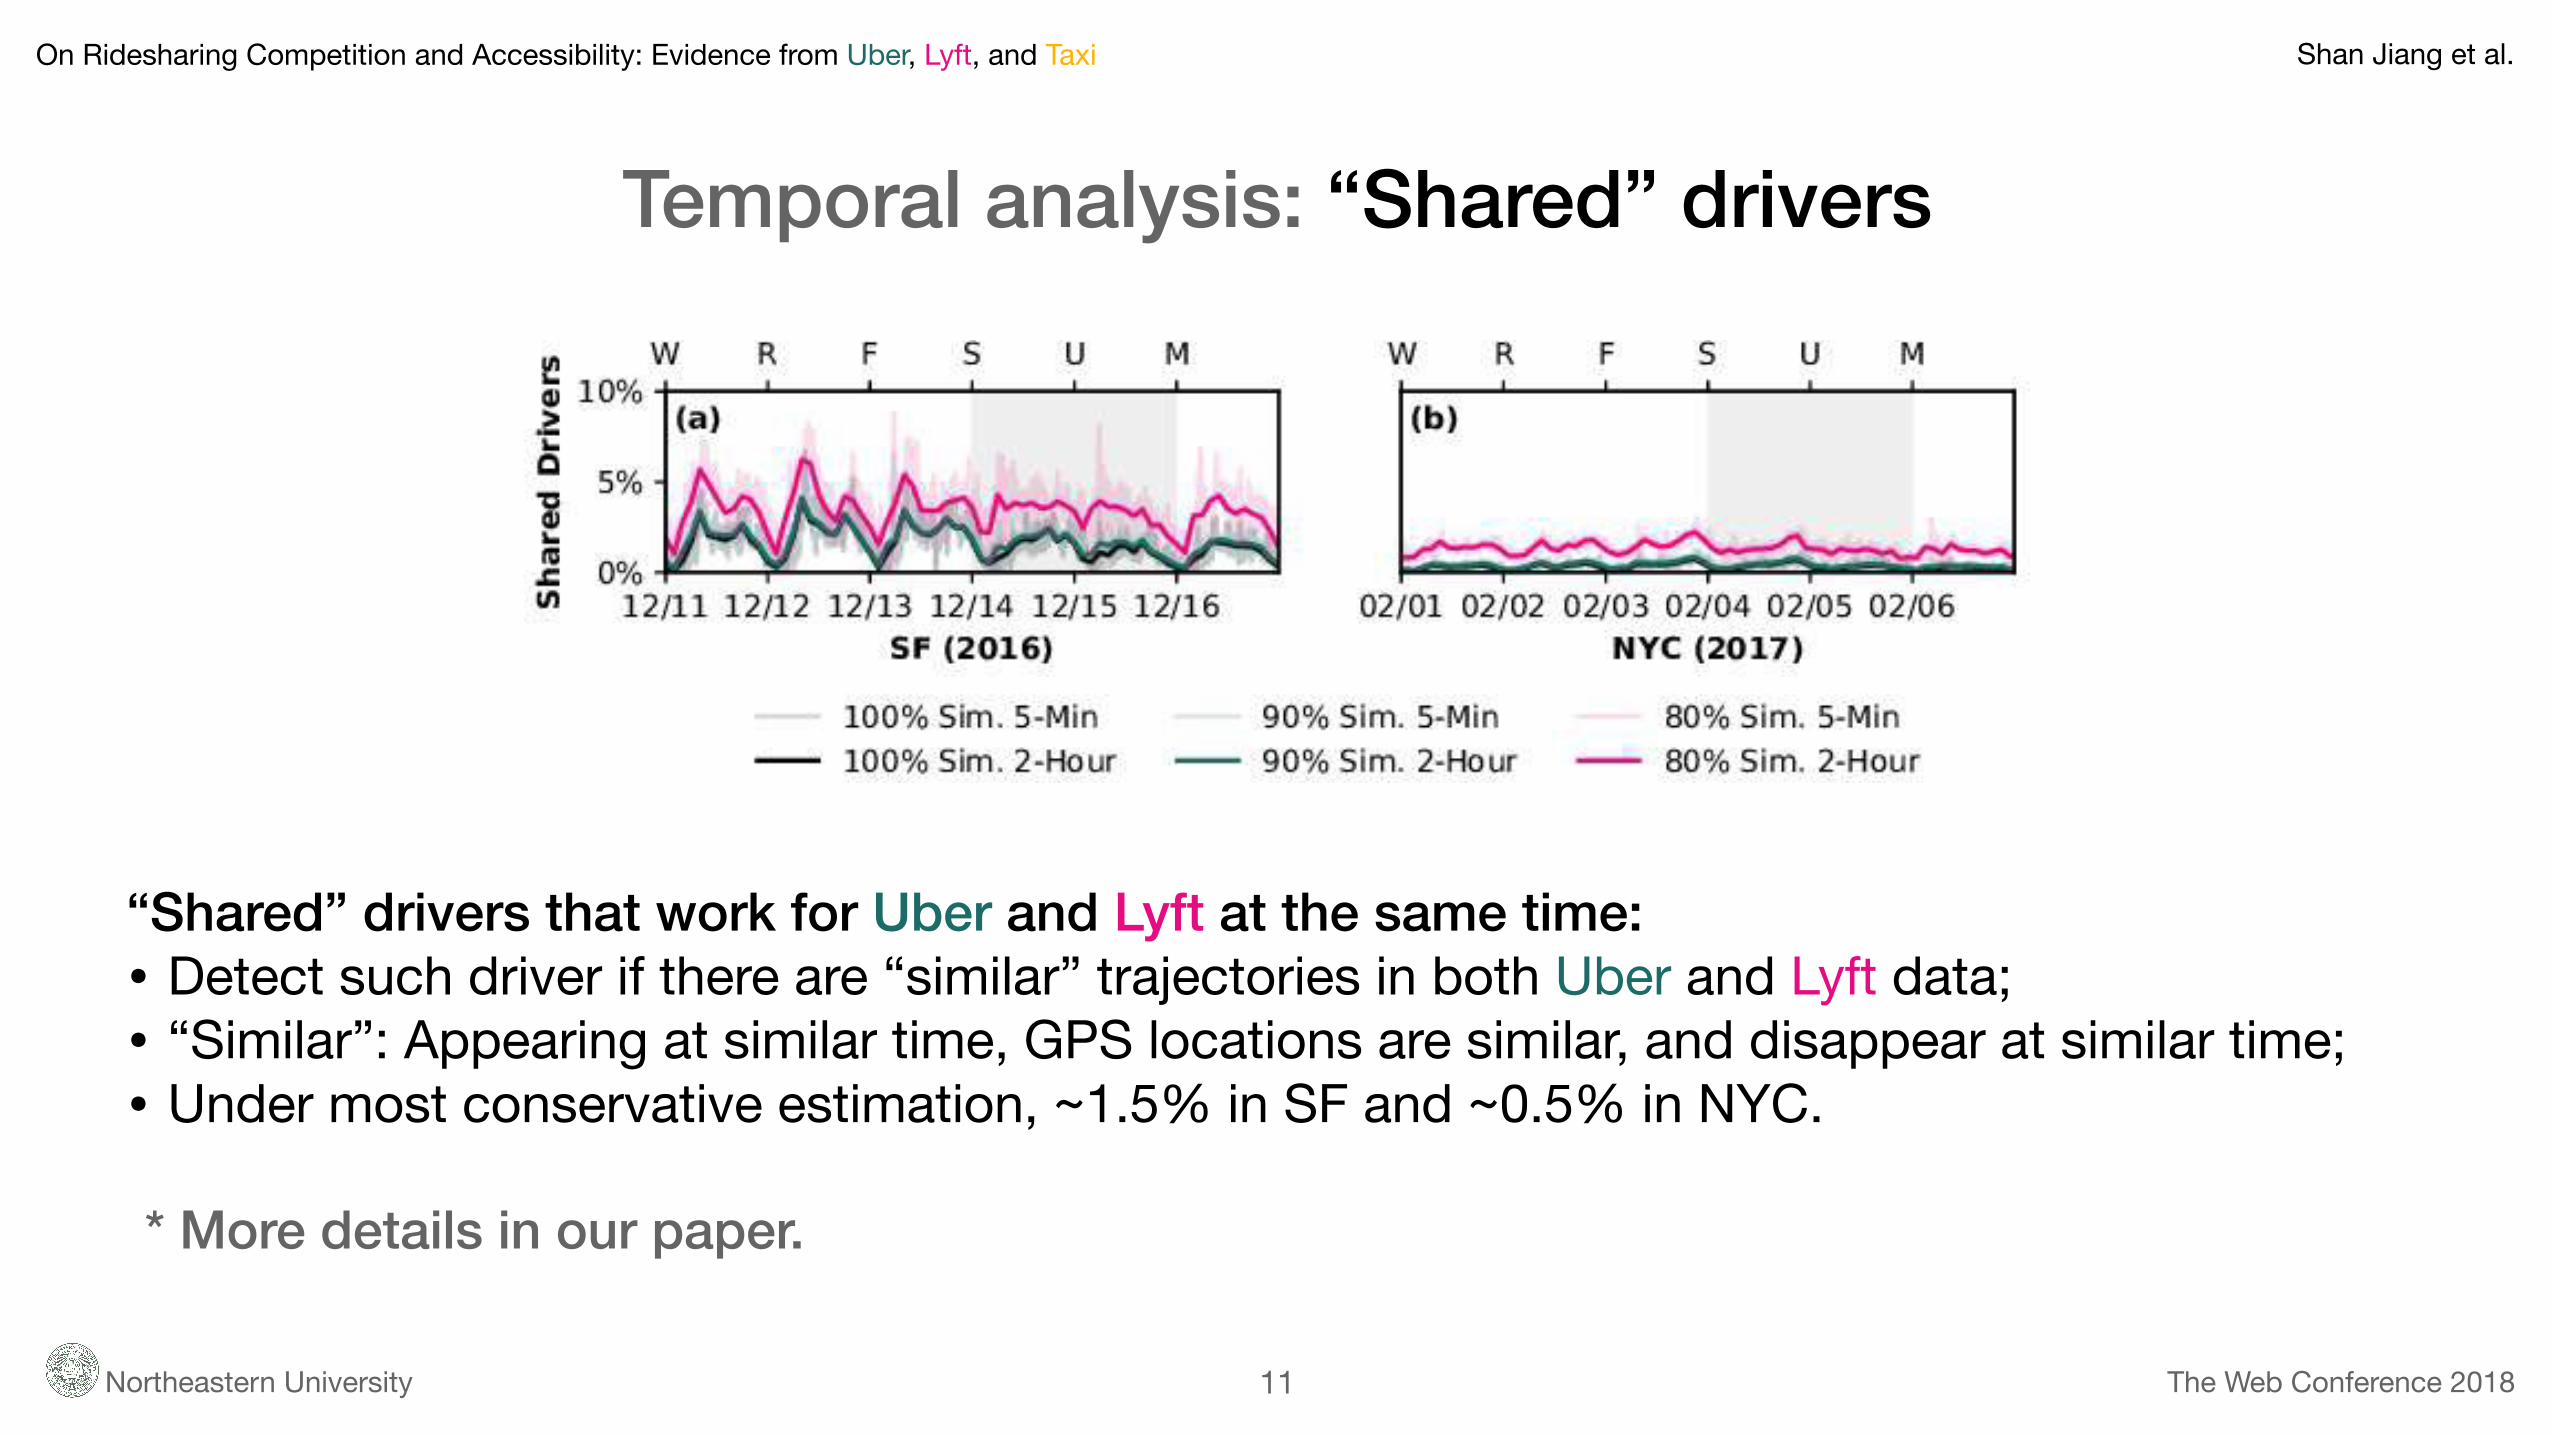
Temporal analysis: “Shared” drivers
11
“Shared” drivers that work for Uber and Lyft at the same time: • Detect such driver if there are “similar” trajectories in both Uber and Lyft data;• “Similar”: Appearing at similar time, GPS locations are similar, and disappear at similar time;• Under most conservative estimation, ~1.5% in SF and ~0.5% in NYC.
* More details in our paper.
On Ridesharing Competition and Accessibility: Evidence from Uber, Lyft, and Taxi Shan Jiang et al.
Northeastern University The Web Conference 2018
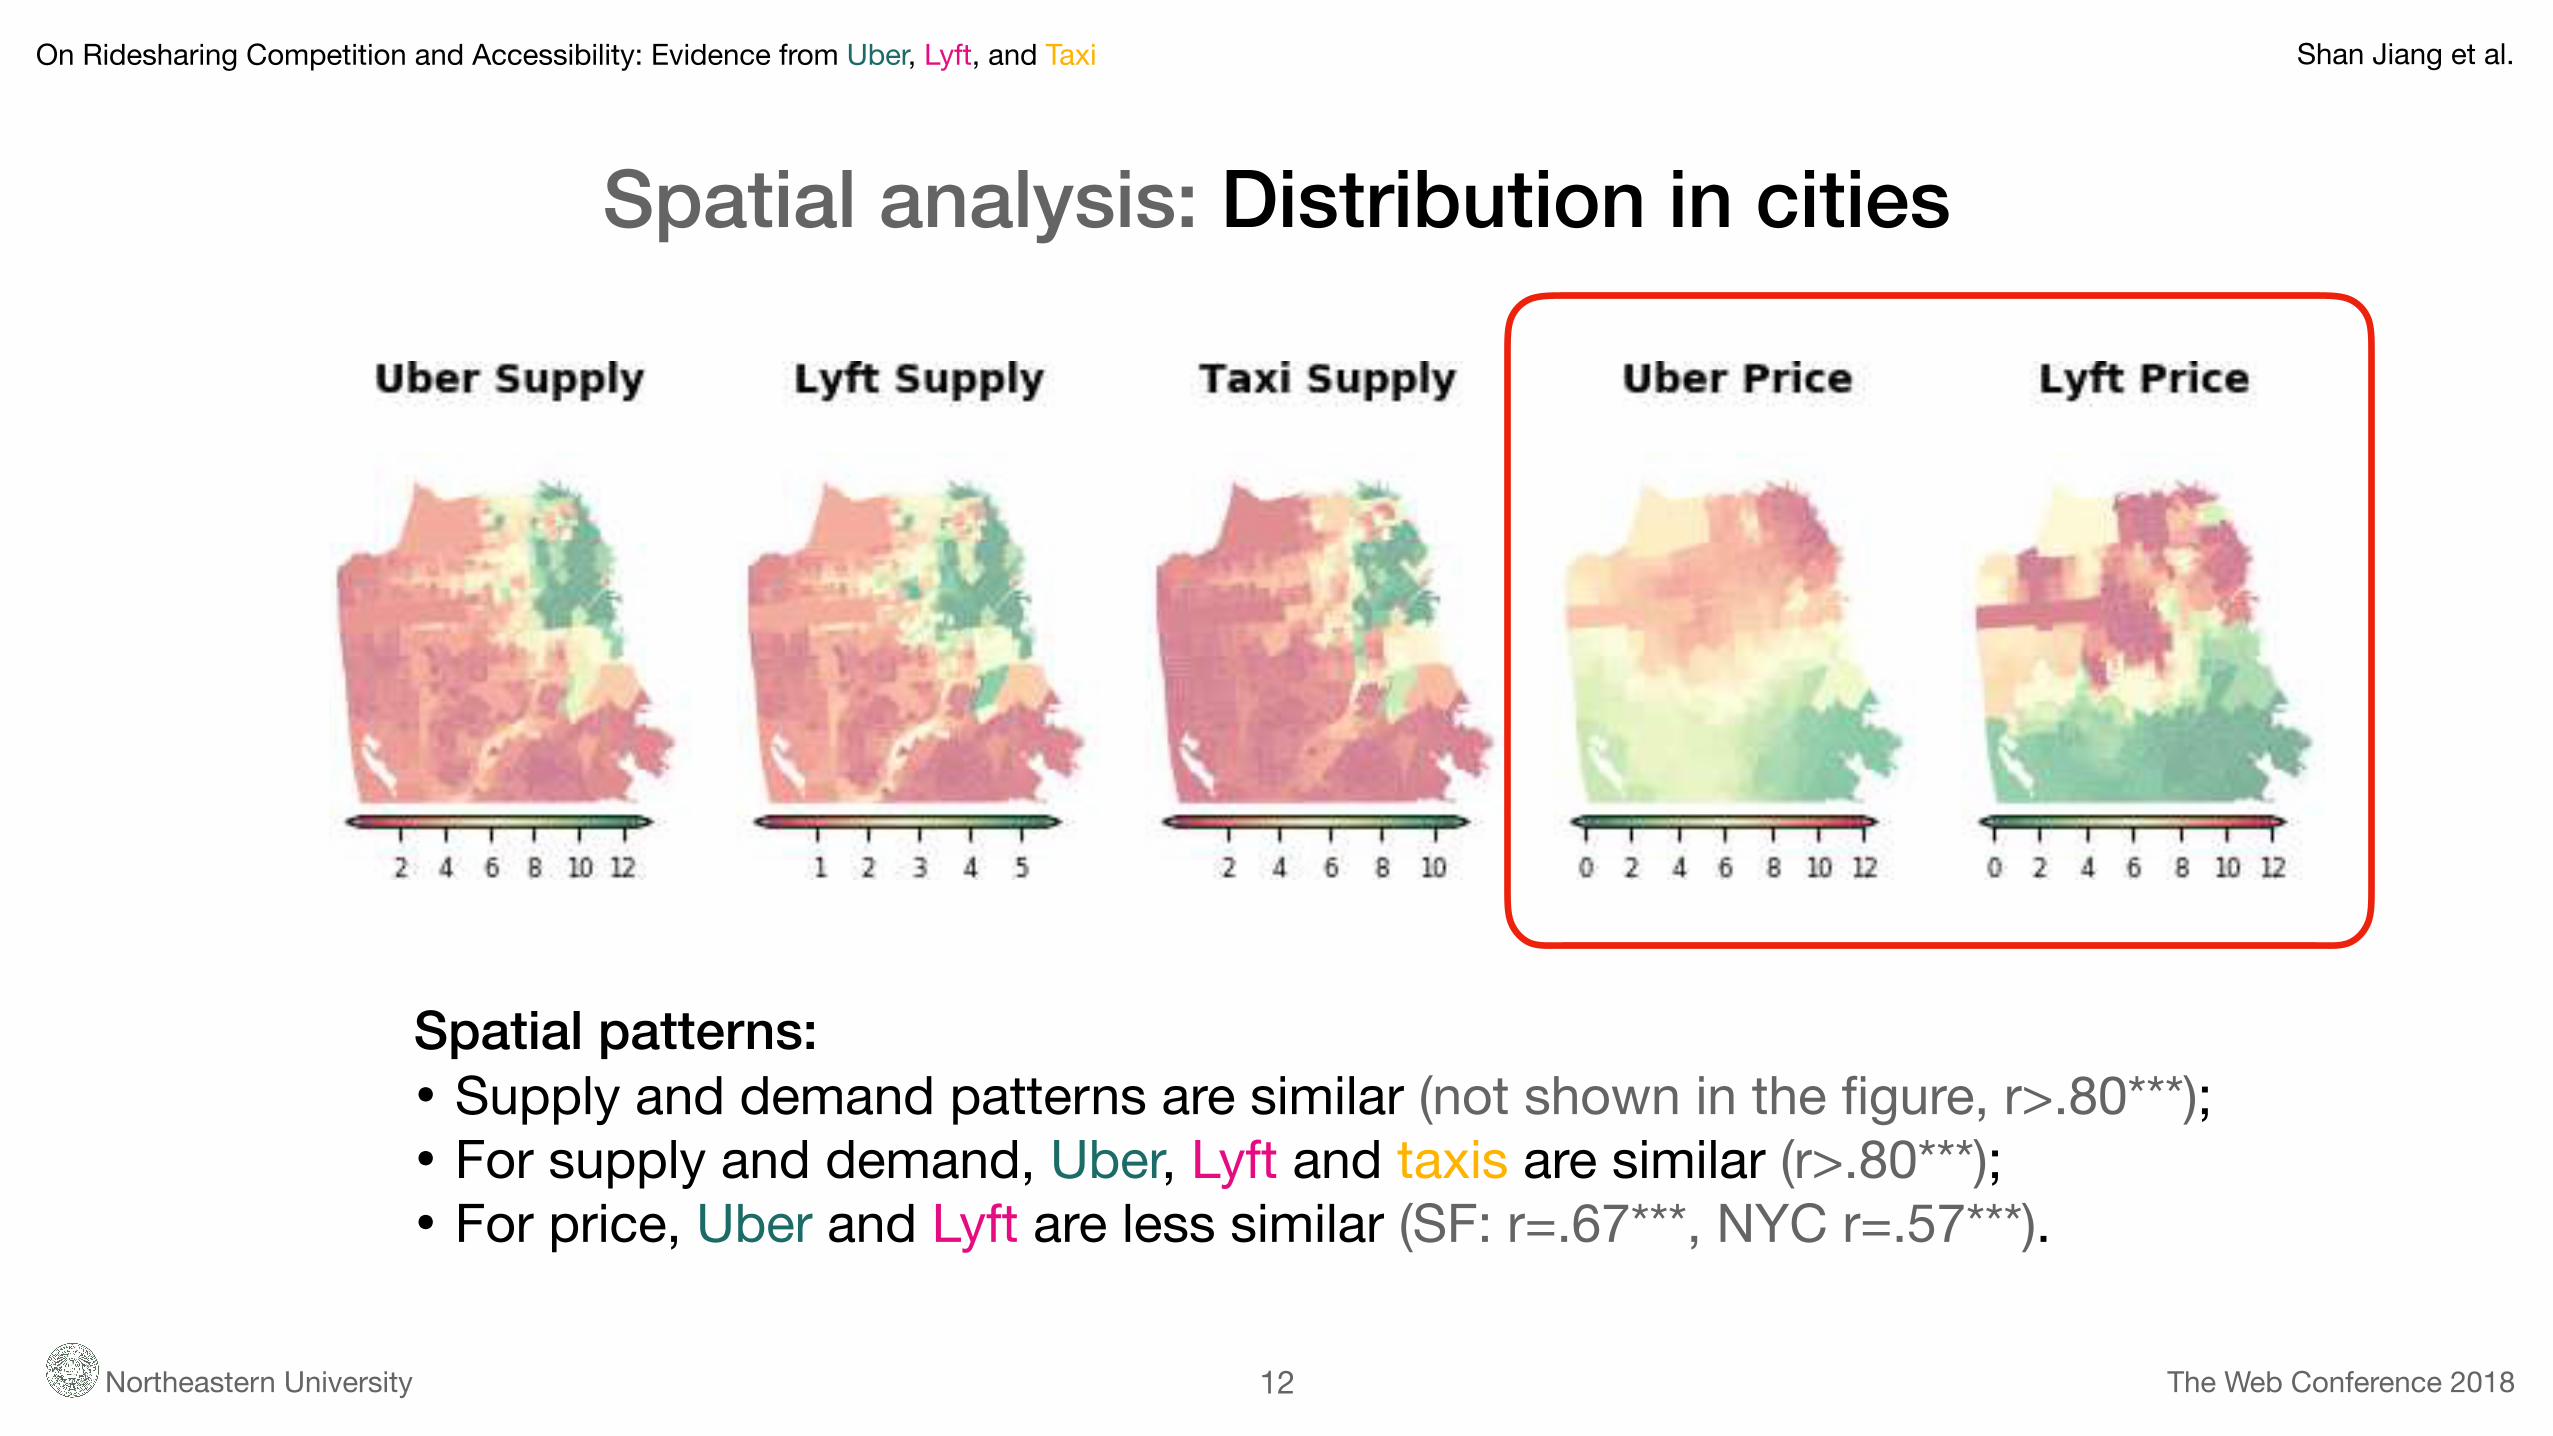
Spatial analysis: Distribution in cities
12
Spatial patterns: • Supply and demand patterns are similar (not shown in the figure, r>.80***);• For supply and demand, Uber, Lyft and taxis are similar (r>.80***);• For price, Uber and Lyft are less similar (SF: r=.67***, NYC r=.57***).
On Ridesharing Competition and Accessibility: Evidence from Uber, Lyft, and Taxi Shan Jiang et al.
Northeastern University The Web Conference 2018
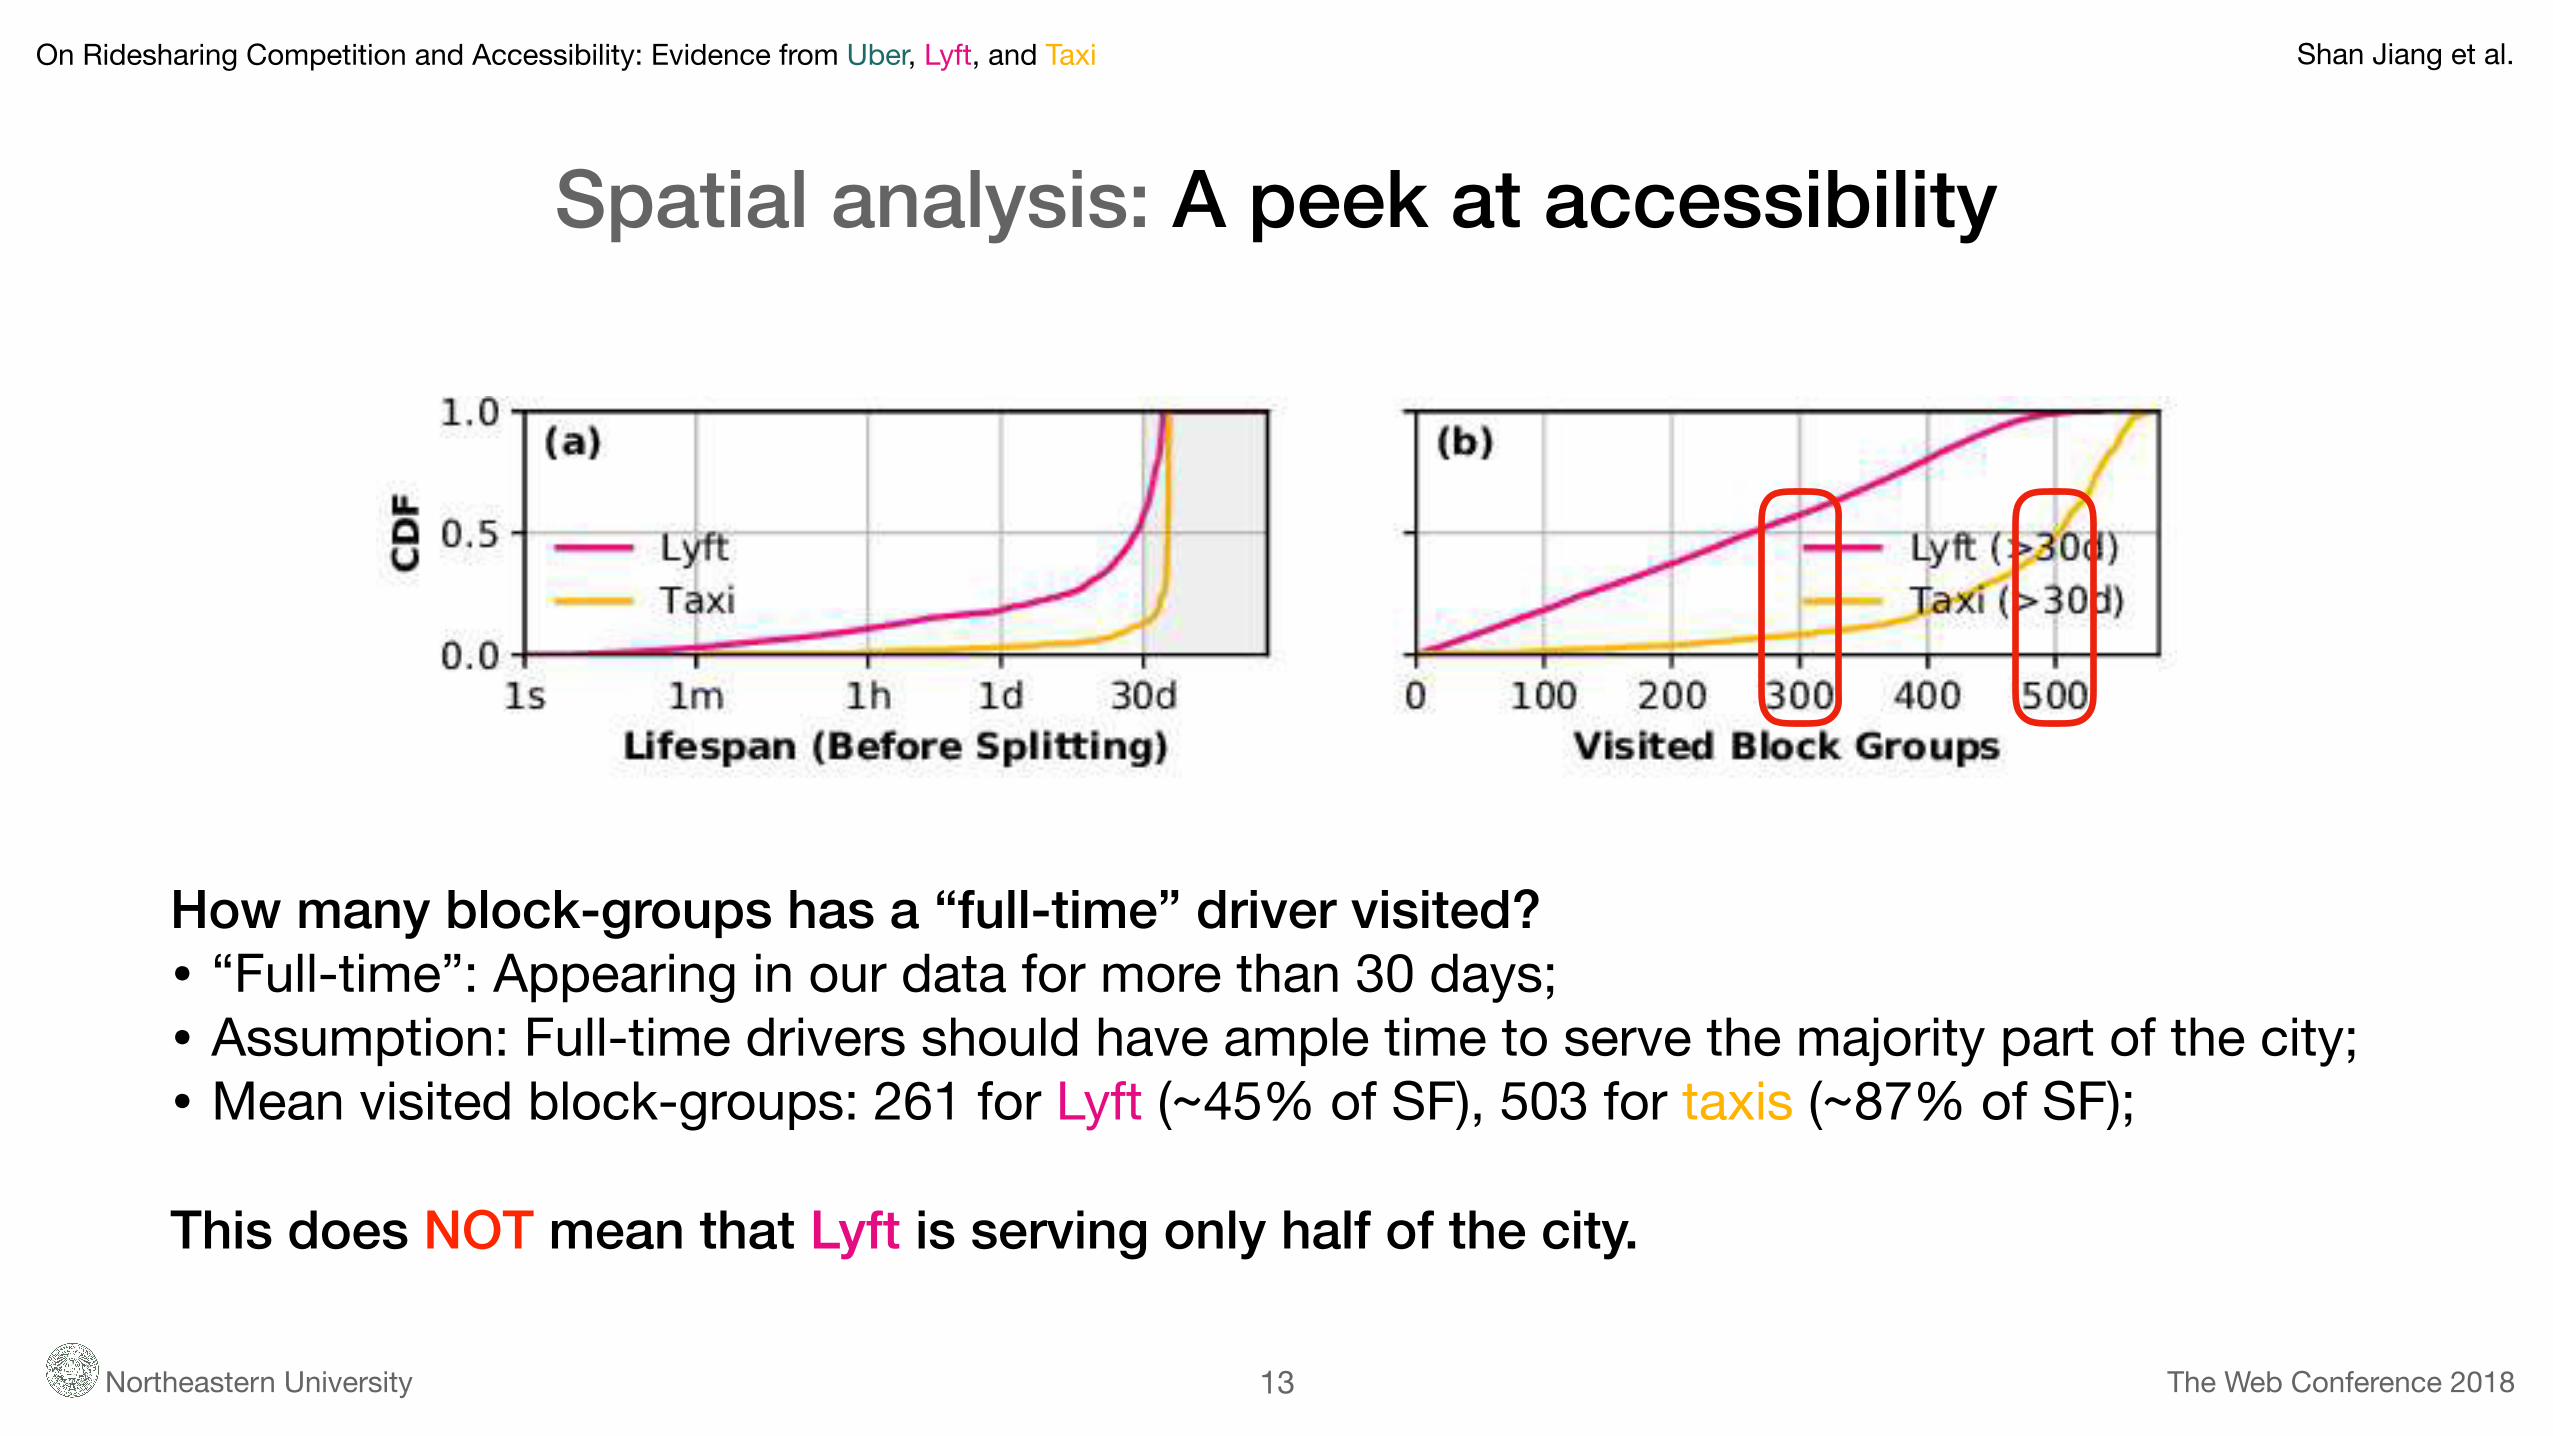
Spatial analysis: A peek at accessibility
13
How many block-groups has a “full-time” driver visited? • “Full-time”: Appearing in our data for more than 30 days;• Assumption: Full-time drivers should have ample time to serve the majority part of the city;• Mean visited block-groups: 261 for Lyft (~45% of SF), 503 for taxis (~87% of SF);
This does NOT mean that Lyft is serving only half of the city.
On Ridesharing Competition and Accessibility: Evidence from Uber, Lyft, and Taxi Shan Jiang et al.
Northeastern University The Web Conference 2018
Accessibility: What do we care?
14
Transportation infrastructures: • Public transit stops, on-street parking meters, off-street parking lots, etc.• Civil engineering perspective, how ridesharing interact with existing infrastructure?• Good control variables.• Data sources: Open data platforms of SF and NYC, Department of Transportation website, etc.
Socioeconomic factors: • Population density, race and ethnicity, income, education, etc.• Fairness perspective, are there any potential discrimination?• Data sources: American Community Survey (ACS), Census, etc.

On Ridesharing Competition and Accessibility: Evidence from Uber, Lyft, and Taxi Shan Jiang et al.
Northeastern University The Web Conference 2018
Accessibility: Spatial econometrics
Classical econometrics with OLS not woking:
• Significant spatial endogeneity among observations (Moran’s I test, p<0.001);• Intuitively, this means that the supply or demand of an area is highly affected by its neighbors;• This leads to over-estimation of classic econometrics with Ordinary Least Squares (OLS).
y = �X+ ✏, ✏ ⇠ N(0,�2)
y = ⇢Wy + �X+ ✏, ✏ ⇠ N(0,�2)
???Spatial econometrics - Lag model:
• Spatial endogeneity is captured by spatial matrix W;• Estimated by Maximum Likelihood (ML);• There are “spillovers”, i.e., the effect on one area will affects an another area;• There are direct effects and indirect effects, combined as total effects.
15
On Ridesharing Competition and Accessibility: Evidence from Uber, Lyft, and Taxi Shan Jiang et al.
Northeastern University The Web Conference 2018
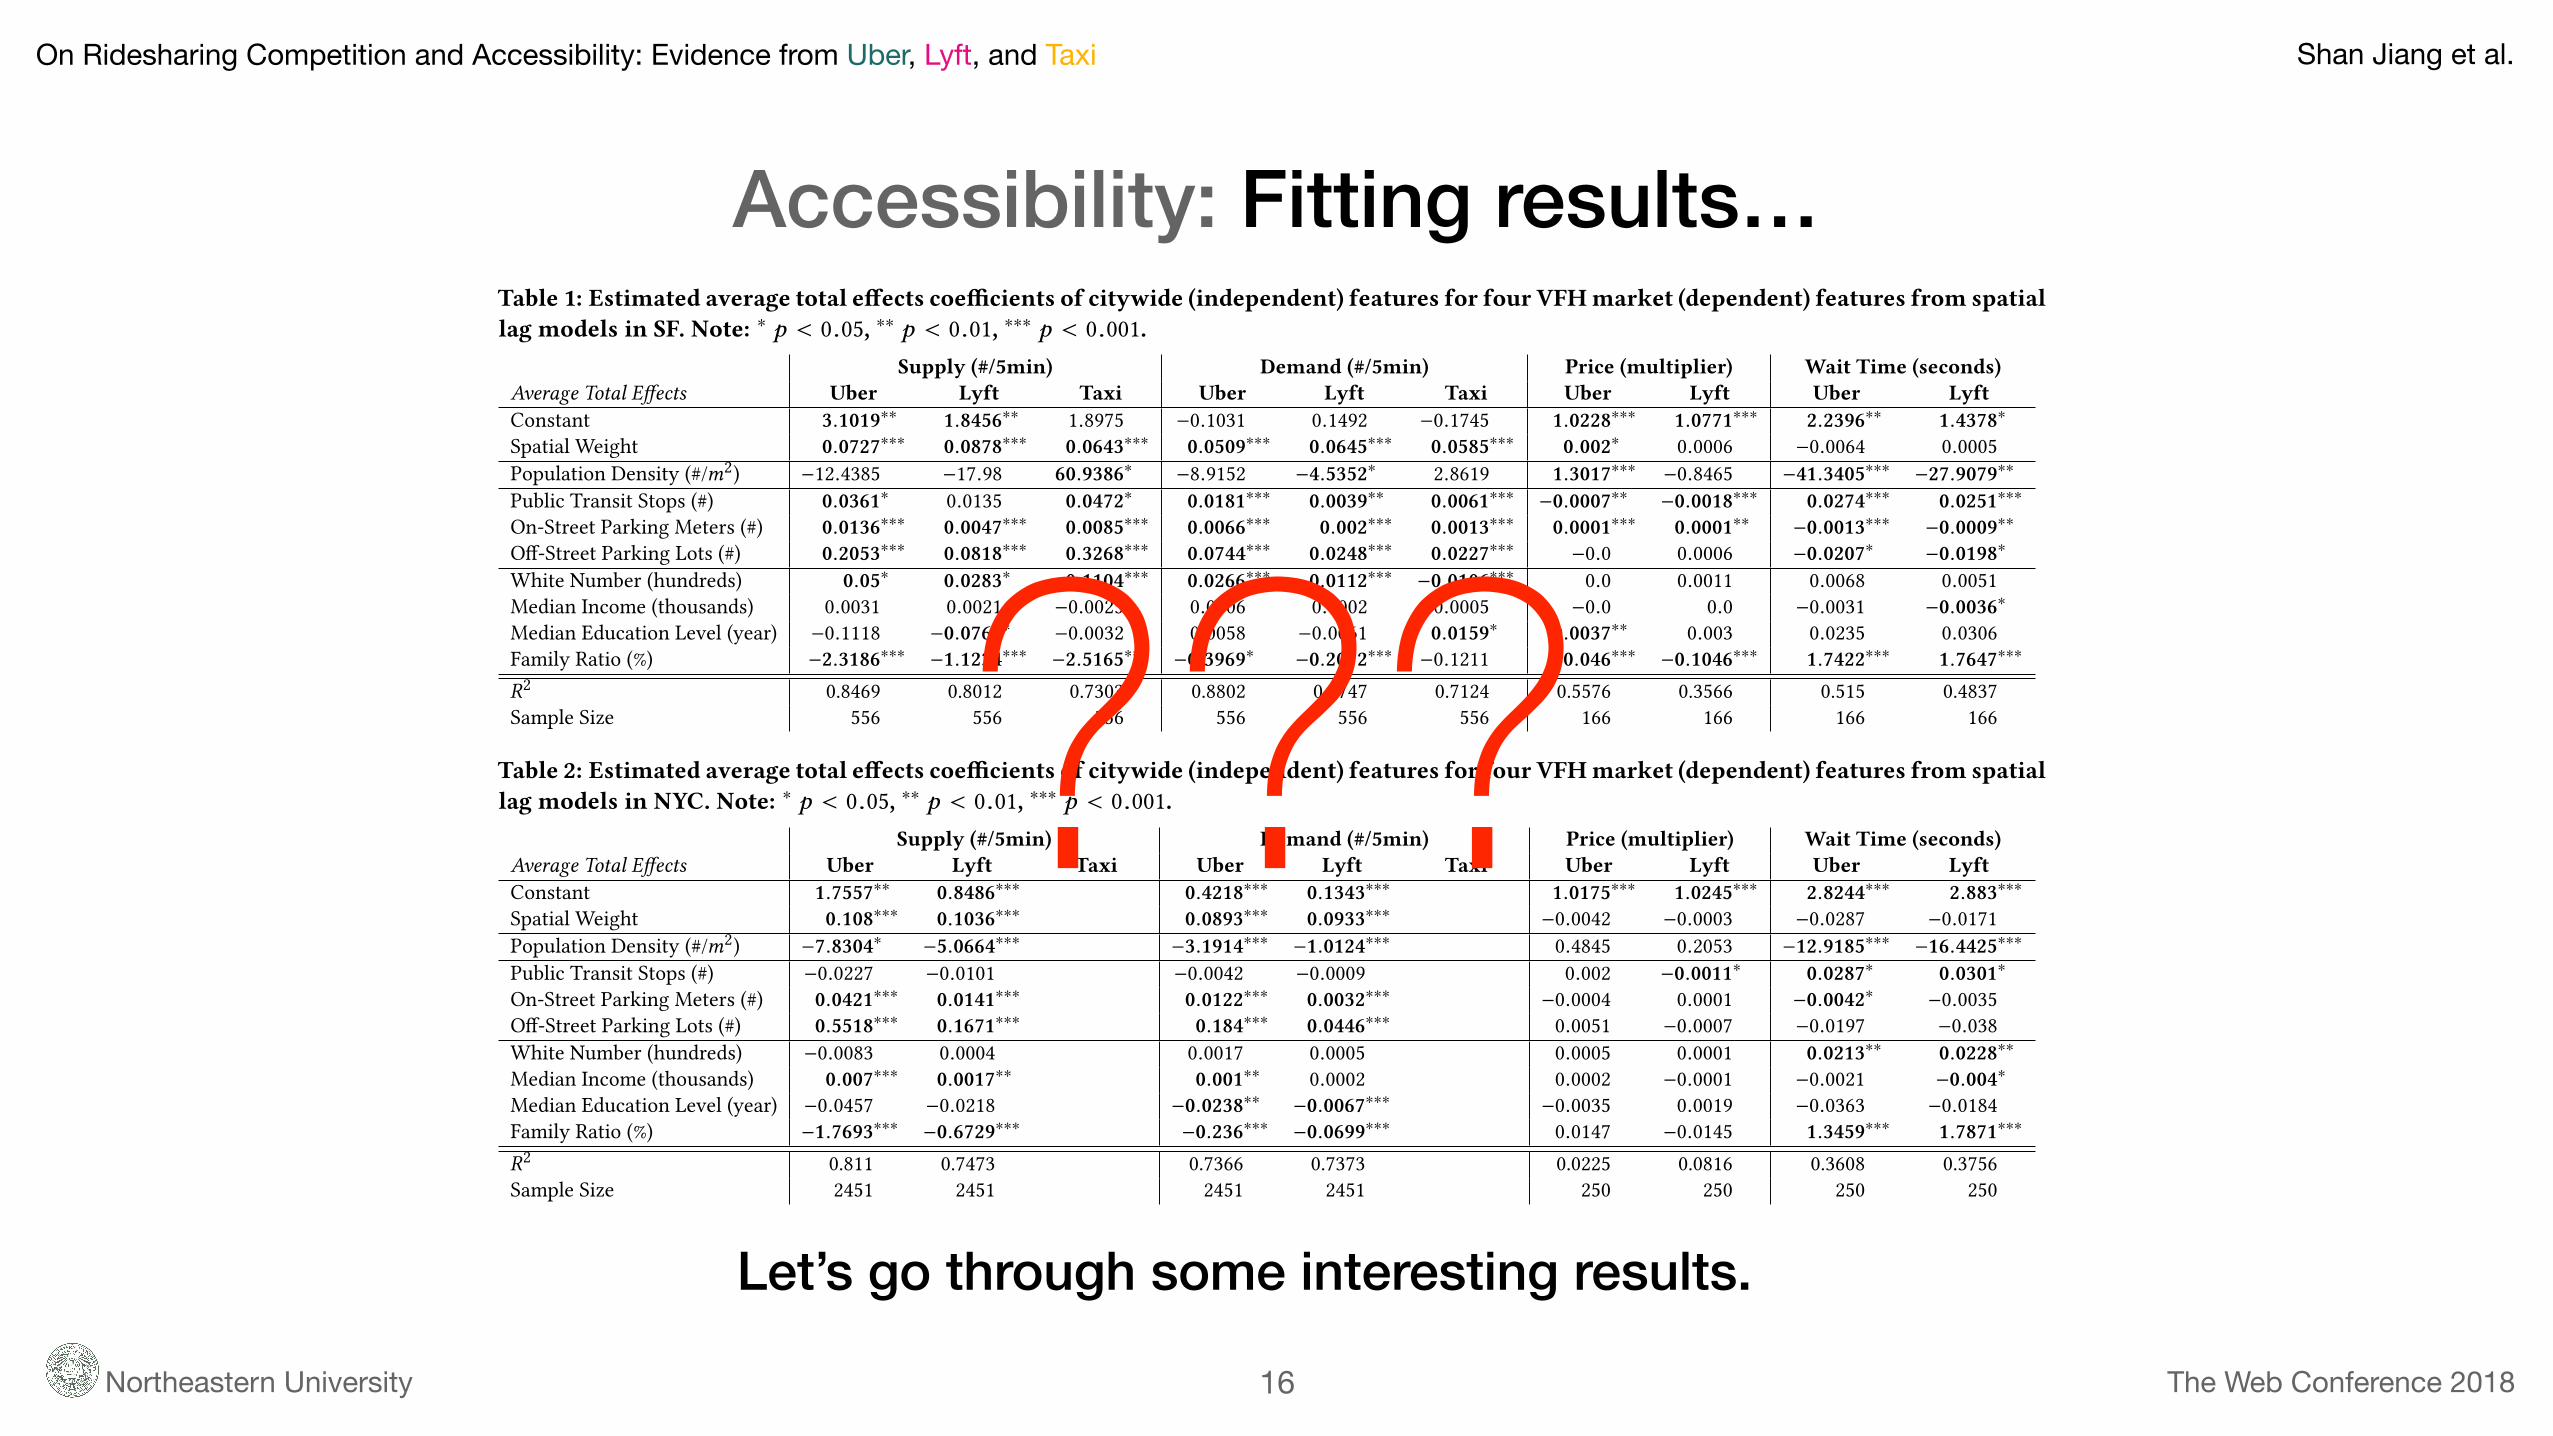
Accessibility: Fitting results…
16
Let’s go through some interesting results.
Table 1: Estimated average total effects coefficients of citywide (independent) features for four VFHmarket (dependent) features from spatiallag models in SF. Note: ∗ p < 0.05, ∗∗ p < 0.01, ∗∗∗ p < 0.001.
Supply (#/5min) Demand (#/5min) Price (multiplier) Wait Time (seconds)Average Total Effects Uber Lyft Taxi Uber Lyft Taxi Uber Lyft Uber LyftConstant 3.1019∗∗ 1.8456∗∗ 1.8975 −0.1031 0.1492 −0.1745 1.0228∗∗∗ 1.0771∗∗∗ 2.2396∗∗ 1.4378∗Spatial Weight 0.0727∗∗∗ 0.0878∗∗∗ 0.0643∗∗∗ 0.0509∗∗∗ 0.0645∗∗∗ 0.0585∗∗∗ 0.002∗ 0.0006 −0.0064 0.0005Population Density (#/m2) −12.4385 −17.98 60.9386∗ −8.9152 −4.5352∗ 2.8619 1.3017∗∗∗ −0.8465 −41.3405∗∗∗ −27.9079∗∗Public Transit Stops (#) 0.0361∗ 0.0135 0.0472∗ 0.0181∗∗∗ 0.0039∗∗ 0.0061∗∗∗ −0.0007∗∗ −0.0018∗∗∗ 0.0274∗∗∗ 0.0251∗∗∗On-Street Parking Meters (#) 0.0136∗∗∗ 0.0047∗∗∗ 0.0085∗∗∗ 0.0066∗∗∗ 0.002∗∗∗ 0.0013∗∗∗ 0.0001∗∗∗ 0.0001∗∗ −0.0013∗∗∗ −0.0009∗∗Off-Street Parking Lots (#) 0.2053∗∗∗ 0.0818∗∗∗ 0.3268∗∗∗ 0.0744∗∗∗ 0.0248∗∗∗ 0.0227∗∗∗ −0.0 0.0006 −0.0207∗ −0.0198∗White Number (hundreds) 0.05∗ 0.0283∗ −0.1104∗∗∗ 0.0266∗∗∗ 0.0112∗∗∗ −0.0106∗∗∗ 0.0 0.0011 0.0068 0.0051Median Income (thousands) 0.0031 0.0021 −0.0025 0.0006 0.0002 −0.0005 −0.0 0.0 −0.0031 −0.0036∗Median Education Level (year) −0.1118 −0.0768∗ −0.0032 0.0058 −0.0061 0.0159∗ 0.0037∗∗ 0.003 0.0235 0.0306Family Ratio (%) −2.3186∗∗∗ −1.1234∗∗∗ −2.5165∗∗∗ −0.3969∗ −0.2072∗∗∗ −0.1211 −0.046∗∗∗ −0.1046∗∗∗ 1.7422∗∗∗ 1.7647∗∗∗
R2 0.8469 0.8012 0.7303 0.8802 0.8747 0.7124 0.5576 0.3566 0.515 0.4837Sample Size 556 556 556 556 556 556 166 166 166 166
Table 2: Estimated average total effects coefficients of citywide (independent) features for four VFHmarket (dependent) features from spatiallag models in NYC. Note: ∗ p < 0.05, ∗∗ p < 0.01, ∗∗∗ p < 0.001.
Supply (#/5min) Demand (#/5min) Price (multiplier) Wait Time (seconds)Average Total Effects Uber Lyft Taxi Uber Lyft Taxi Uber Lyft Uber LyftConstant 1.7557∗∗ 0.8486∗∗∗ 0.4218∗∗∗ 0.1343∗∗∗ 1.0175∗∗∗ 1.0245∗∗∗ 2.8244∗∗∗ 2.883∗∗∗Spatial Weight 0.108∗∗∗ 0.1036∗∗∗ 0.0893∗∗∗ 0.0933∗∗∗ −0.0042 −0.0003 −0.0287 −0.0171Population Density (#/m2) −7.8304∗ −5.0664∗∗∗ −3.1914∗∗∗ −1.0124∗∗∗ 0.4845 0.2053 −12.9185∗∗∗ −16.4425∗∗∗Public Transit Stops (#) −0.0227 −0.0101 −0.0042 −0.0009 0.002 −0.0011∗ 0.0287∗ 0.0301∗On-Street Parking Meters (#) 0.0421∗∗∗ 0.0141∗∗∗ 0.0122∗∗∗ 0.0032∗∗∗ −0.0004 0.0001 −0.0042∗ −0.0035Off-Street Parking Lots (#) 0.5518∗∗∗ 0.1671∗∗∗ 0.184∗∗∗ 0.0446∗∗∗ 0.0051 −0.0007 −0.0197 −0.038White Number (hundreds) −0.0083 0.0004 0.0017 0.0005 0.0005 0.0001 0.0213∗∗ 0.0228∗∗Median Income (thousands) 0.007∗∗∗ 0.0017∗∗ 0.001∗∗ 0.0002 0.0002 −0.0001 −0.0021 −0.004∗Median Education Level (year) −0.0457 −0.0218 −0.0238∗∗ −0.0067∗∗∗ −0.0035 0.0019 −0.0363 −0.0184Family Ratio (%) −1.7693∗∗∗ −0.6729∗∗∗ −0.236∗∗∗ −0.0699∗∗∗ 0.0147 −0.0145 1.3459∗∗∗ 1.7871∗∗∗
R2 0.811 0.7473 0.7366 0.7373 0.0225 0.0816 0.3608 0.3756Sample Size 2451 2451 2451 2451 250 250 250 250
1
???
On Ridesharing Competition and Accessibility: Evidence from Uber, Lyft, and Taxi Shan Jiang et al.
Northeastern University The Web Conference 2018
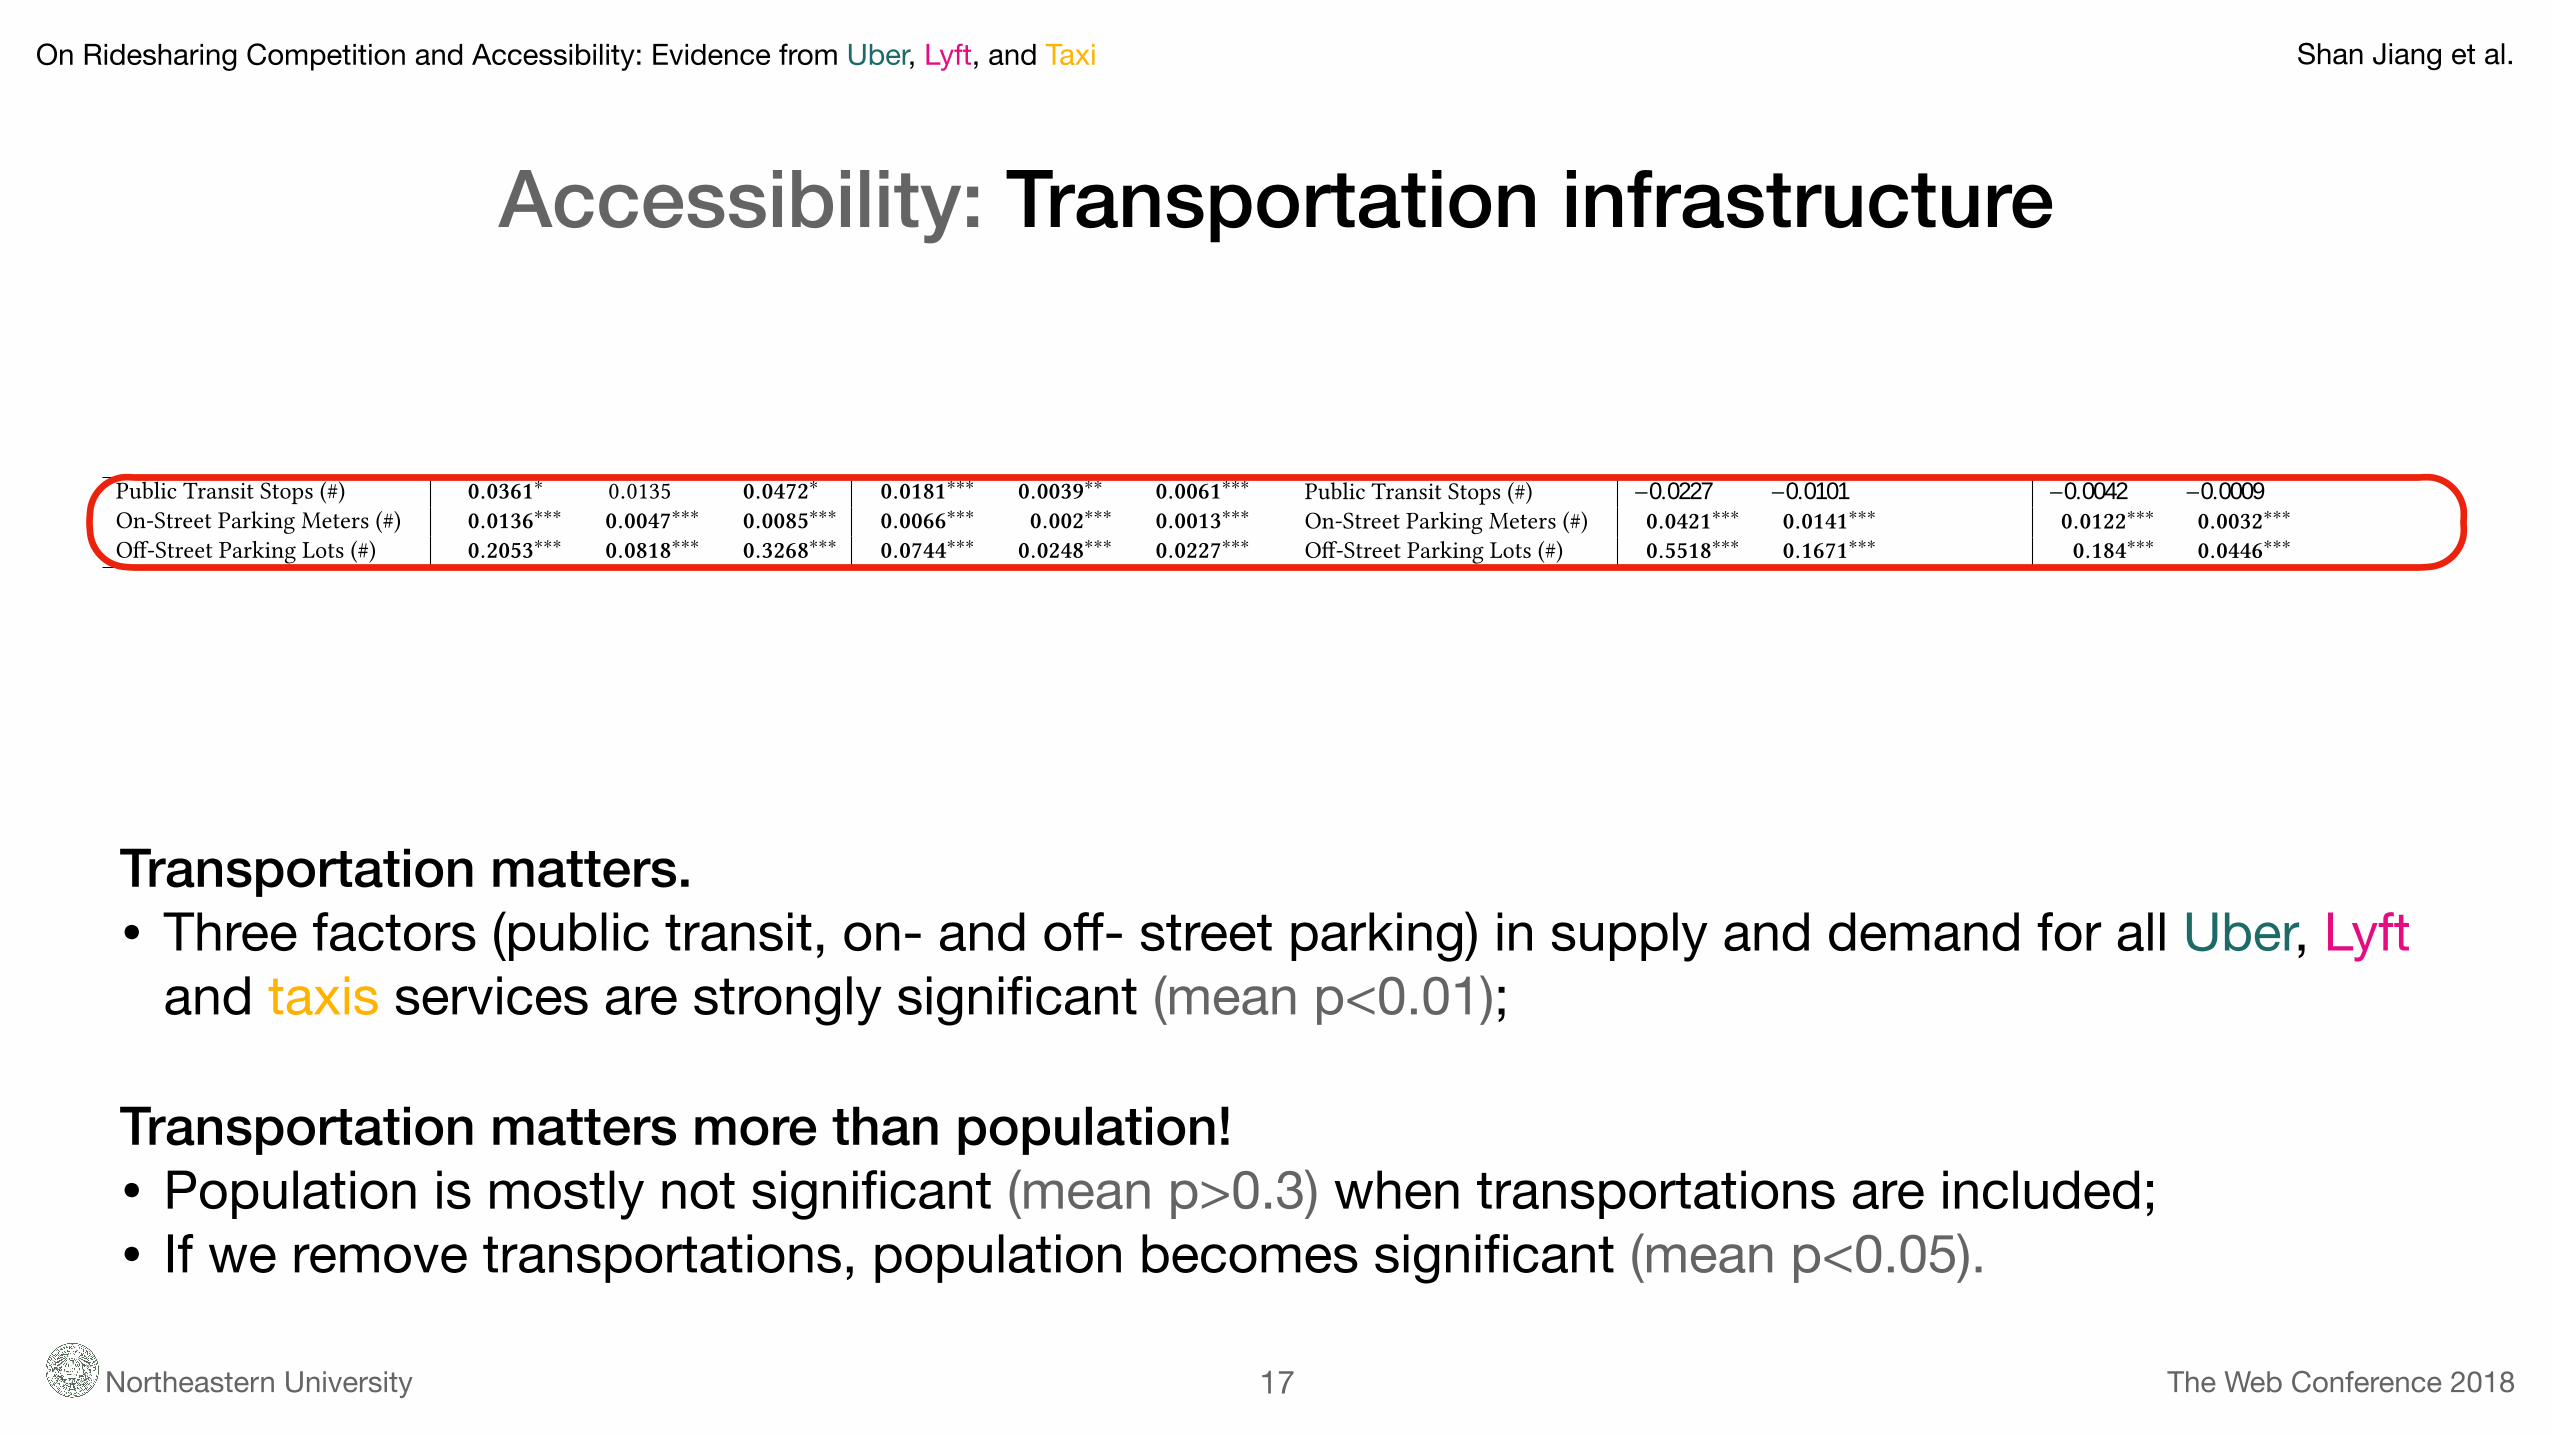
Accessibility: Transportation infrastructure
17
Transportation matters. • Three factors (public transit, on- and off- street parking) in supply and demand for all Uber, Lyft
and taxis services are strongly significant (mean p<0.01);
Transportation matters more than population! • Population is mostly not significant (mean p>0.3) when transportations are included;• If we remove transportations, population becomes significant (mean p<0.05).
Supply (#/5min) Demand (#/5min) Price (multiplier) Wait Time (seconds)Average Total E�ects Uber Lyft Taxi Uber Lyft Taxi Uber Lyft Uber LyftConstant 3.1019⇤⇤ 1.8456⇤⇤ 1.8975 �0.1031 0.1492 �0.1745 1.0228⇤⇤⇤ 1.0771⇤⇤⇤ 2.2396⇤⇤ 1.4378⇤Spatial Weight 0.0727⇤⇤⇤ 0.0878⇤⇤⇤ 0.0643⇤⇤⇤ 0.0509⇤⇤⇤ 0.0645⇤⇤⇤ 0.0585⇤⇤⇤ 0.002⇤ 0.0006 �0.0064 0.0005Population Density (#/m2) �12.4385 �17.98 60.9386⇤ �8.9152 �4.5352⇤ 2.8619 1.3017⇤⇤⇤ �0.8465 �41.3405⇤⇤⇤ �27.9079⇤⇤Public Transit Stops (#) 0.0361⇤ 0.0135 0.0472⇤ 0.0181⇤⇤⇤ 0.0039⇤⇤ 0.0061⇤⇤⇤ �0.0007⇤⇤ �0.0018⇤⇤⇤ 0.0274⇤⇤⇤ 0.0251⇤⇤⇤On-Street Parking Meters (#) 0.0136⇤⇤⇤ 0.0047⇤⇤⇤ 0.0085⇤⇤⇤ 0.0066⇤⇤⇤ 0.002⇤⇤⇤ 0.0013⇤⇤⇤ 0.0001⇤⇤⇤ 0.0001⇤⇤ �0.0013⇤⇤⇤ �0.0009⇤⇤O�-Street Parking Lots (#) 0.2053⇤⇤⇤ 0.0818⇤⇤⇤ 0.3268⇤⇤⇤ 0.0744⇤⇤⇤ 0.0248⇤⇤⇤ 0.0227⇤⇤⇤ �0.0 0.0006 �0.0207⇤ �0.0198⇤White Number (hundreds) 0.05⇤ 0.0283⇤ �0.1104⇤⇤⇤ 0.0266⇤⇤⇤ 0.0112⇤⇤⇤ �0.0106⇤⇤⇤ 0.0 0.0011 0.0068 0.0051Median Income (thousands) 0.0031 0.0021 �0.0025 0.0006 0.0002 �0.0005 �0.0 0.0 �0.0031 �0.0036⇤Median Education Level (year) �0.1118 �0.0768⇤ �0.0032 0.0058 �0.0061 0.0159⇤ 0.0037⇤⇤ 0.003 0.0235 0.0306Family Ratio (%) �2.3186⇤⇤⇤ �1.1234⇤⇤⇤ �2.5165⇤⇤⇤ �0.3969⇤ �0.2072⇤⇤⇤ �0.1211 �0.046⇤⇤⇤ �0.1046⇤⇤⇤ 1.7422⇤⇤⇤ 1.7647⇤⇤⇤
R2 0.8469 0.8012 0.7303 0.8802 0.8747 0.7124 0.5576 0.3566 0.515 0.4837Sample Size 556 556 556 556 556 556 166 166 166 166
1
Supply (#/5min) Demand (#/5min) Price (multiplier) Wait Time (seconds)Average Total E�ects Uber Lyft Taxi Uber Lyft Taxi Uber Lyft Uber LyftConstant 1.7557⇤⇤ 0.8486⇤⇤⇤ 0.4218⇤⇤⇤ 0.1343⇤⇤⇤ 1.0175⇤⇤⇤ 1.0245⇤⇤⇤ 2.8244⇤⇤⇤ 2.883⇤⇤⇤Spatial Weight 0.108⇤⇤⇤ 0.1036⇤⇤⇤ 0.0893⇤⇤⇤ 0.0933⇤⇤⇤ �0.0042 �0.0003 �0.0287 �0.0171Population Density (#/m2) �7.8304⇤ �5.0664⇤⇤⇤ �3.1914⇤⇤⇤ �1.0124⇤⇤⇤ 0.4845 0.2053 �12.9185⇤⇤⇤ �16.4425⇤⇤⇤Public Transit Stops (#) �0.0227 �0.0101 �0.0042 �0.0009 0.002 �0.0011⇤ 0.0287⇤ 0.0301⇤On-Street Parking Meters (#) 0.0421⇤⇤⇤ 0.0141⇤⇤⇤ 0.0122⇤⇤⇤ 0.0032⇤⇤⇤ �0.0004 0.0001 �0.0042⇤ �0.0035O�-Street Parking Lots (#) 0.5518⇤⇤⇤ 0.1671⇤⇤⇤ 0.184⇤⇤⇤ 0.0446⇤⇤⇤ 0.0051 �0.0007 �0.0197 �0.038White Number (hundreds) �0.0083 0.0004 0.0017 0.0005 0.0005 0.0001 0.0213⇤⇤ 0.0228⇤⇤Median Income (thousands) 0.007⇤⇤⇤ 0.0017⇤⇤ 0.001⇤⇤ 0.0002 0.0002 �0.0001 �0.0021 �0.004⇤Median Education Level (year) �0.0457 �0.0218 �0.0238⇤⇤ �0.0067⇤⇤⇤ �0.0035 0.0019 �0.0363 �0.0184Family Ratio (%) �1.7693⇤⇤⇤ �0.6729⇤⇤⇤ �0.236⇤⇤⇤ �0.0699⇤⇤⇤ 0.0147 �0.0145 1.3459⇤⇤⇤ 1.7871⇤⇤⇤
R2 0.811 0.7473 0.7366 0.7373 0.0225 0.0816 0.3608 0.3756Sample Size 2451 2451 2451 2451 250 250 250 250
1

On Ridesharing Competition and Accessibility: Evidence from Uber, Lyft, and Taxi Shan Jiang et al.
Northeastern University The Web Conference 2018
Accessibility: Socioeconomic factors
18
Family ratio is the most important socioeconomic factor. • Family ratio in supply, demand and price for all Uber, Lyft and taxis services are mostly
significant (mean p<0.001);
There are “residual” correlations for diverse and low income areas. • In SF, Uber and Lyft supply is significant increasing (mean p<0.05) with Caucasian number.• In NYC, Uber and Lyft supply is significant increasing (mean p<0.001) with median income.
Caution: Effect size is small. * More details in our paper.
Supply (#/5min) Demand (#/5min) Price (multiplier) Wait Time (seconds)Average Total E�ects Uber Lyft Taxi Uber Lyft Taxi Uber Lyft Uber LyftConstant 3.1019⇤⇤ 1.8456⇤⇤ 1.8975 �0.1031 0.1492 �0.1745 1.0228⇤⇤⇤ 1.0771⇤⇤⇤ 2.2396⇤⇤ 1.4378⇤Spatial Weight 0.0727⇤⇤⇤ 0.0878⇤⇤⇤ 0.0643⇤⇤⇤ 0.0509⇤⇤⇤ 0.0645⇤⇤⇤ 0.0585⇤⇤⇤ 0.002⇤ 0.0006 �0.0064 0.0005Population Density (#/m2) �12.4385 �17.98 60.9386⇤ �8.9152 �4.5352⇤ 2.8619 1.3017⇤⇤⇤ �0.8465 �41.3405⇤⇤⇤ �27.9079⇤⇤Public Transit Stops (#) 0.0361⇤ 0.0135 0.0472⇤ 0.0181⇤⇤⇤ 0.0039⇤⇤ 0.0061⇤⇤⇤ �0.0007⇤⇤ �0.0018⇤⇤⇤ 0.0274⇤⇤⇤ 0.0251⇤⇤⇤On-Street Parking Meters (#) 0.0136⇤⇤⇤ 0.0047⇤⇤⇤ 0.0085⇤⇤⇤ 0.0066⇤⇤⇤ 0.002⇤⇤⇤ 0.0013⇤⇤⇤ 0.0001⇤⇤⇤ 0.0001⇤⇤ �0.0013⇤⇤⇤ �0.0009⇤⇤O�-Street Parking Lots (#) 0.2053⇤⇤⇤ 0.0818⇤⇤⇤ 0.3268⇤⇤⇤ 0.0744⇤⇤⇤ 0.0248⇤⇤⇤ 0.0227⇤⇤⇤ �0.0 0.0006 �0.0207⇤ �0.0198⇤White Number (hundreds) 0.05⇤ 0.0283⇤ �0.1104⇤⇤⇤ 0.0266⇤⇤⇤ 0.0112⇤⇤⇤ �0.0106⇤⇤⇤ 0.0 0.0011 0.0068 0.0051Median Income (thousands) 0.0031 0.0021 �0.0025 0.0006 0.0002 �0.0005 �0.0 0.0 �0.0031 �0.0036⇤Median Education Level (year) �0.1118 �0.0768⇤ �0.0032 0.0058 �0.0061 0.0159⇤ 0.0037⇤⇤ 0.003 0.0235 0.0306Family Ratio (%) �2.3186⇤⇤⇤ �1.1234⇤⇤⇤ �2.5165⇤⇤⇤ �0.3969⇤ �0.2072⇤⇤⇤ �0.1211 �0.046⇤⇤⇤ �0.1046⇤⇤⇤ 1.7422⇤⇤⇤ 1.7647⇤⇤⇤
R2 0.8469 0.8012 0.7303 0.8802 0.8747 0.7124 0.5576 0.3566 0.515 0.4837Sample Size 556 556 556 556 556 556 166 166 166 166
1
Supply (#/5min) Demand (#/5min) Price (multiplier) Wait Time (seconds)Average Total E�ects Uber Lyft Taxi Uber Lyft Taxi Uber Lyft Uber LyftConstant 1.7557⇤⇤ 0.8486⇤⇤⇤ 0.4218⇤⇤⇤ 0.1343⇤⇤⇤ 1.0175⇤⇤⇤ 1.0245⇤⇤⇤ 2.8244⇤⇤⇤ 2.883⇤⇤⇤Spatial Weight 0.108⇤⇤⇤ 0.1036⇤⇤⇤ 0.0893⇤⇤⇤ 0.0933⇤⇤⇤ �0.0042 �0.0003 �0.0287 �0.0171Population Density (#/m2) �7.8304⇤ �5.0664⇤⇤⇤ �3.1914⇤⇤⇤ �1.0124⇤⇤⇤ 0.4845 0.2053 �12.9185⇤⇤⇤ �16.4425⇤⇤⇤Public Transit Stops (#) �0.0227 �0.0101 �0.0042 �0.0009 0.002 �0.0011⇤ 0.0287⇤ 0.0301⇤On-Street Parking Meters (#) 0.0421⇤⇤⇤ 0.0141⇤⇤⇤ 0.0122⇤⇤⇤ 0.0032⇤⇤⇤ �0.0004 0.0001 �0.0042⇤ �0.0035O�-Street Parking Lots (#) 0.5518⇤⇤⇤ 0.1671⇤⇤⇤ 0.184⇤⇤⇤ 0.0446⇤⇤⇤ 0.0051 �0.0007 �0.0197 �0.038White Number (hundreds) �0.0083 0.0004 0.0017 0.0005 0.0005 0.0001 0.0213⇤⇤ 0.0228⇤⇤Median Income (thousands) 0.007⇤⇤⇤ 0.0017⇤⇤ 0.001⇤⇤ 0.0002 0.0002 �0.0001 �0.0021 �0.004⇤Median Education Level (year) �0.0457 �0.0218 �0.0238⇤⇤ �0.0067⇤⇤⇤ �0.0035 0.0019 �0.0363 �0.0184Family Ratio (%) �1.7693⇤⇤⇤ �0.6729⇤⇤⇤ �0.236⇤⇤⇤ �0.0699⇤⇤⇤ 0.0147 �0.0145 1.3459⇤⇤⇤ 1.7871⇤⇤⇤
R2 0.811 0.7473 0.7366 0.7373 0.0225 0.0816 0.3608 0.3756Sample Size 2451 2451 2451 2451 250 250 250 250
1
On Ridesharing Competition and Accessibility: Evidence from Uber, Lyft, and Taxi Shan Jiang et al.
Northeastern University The Web Conference 2018
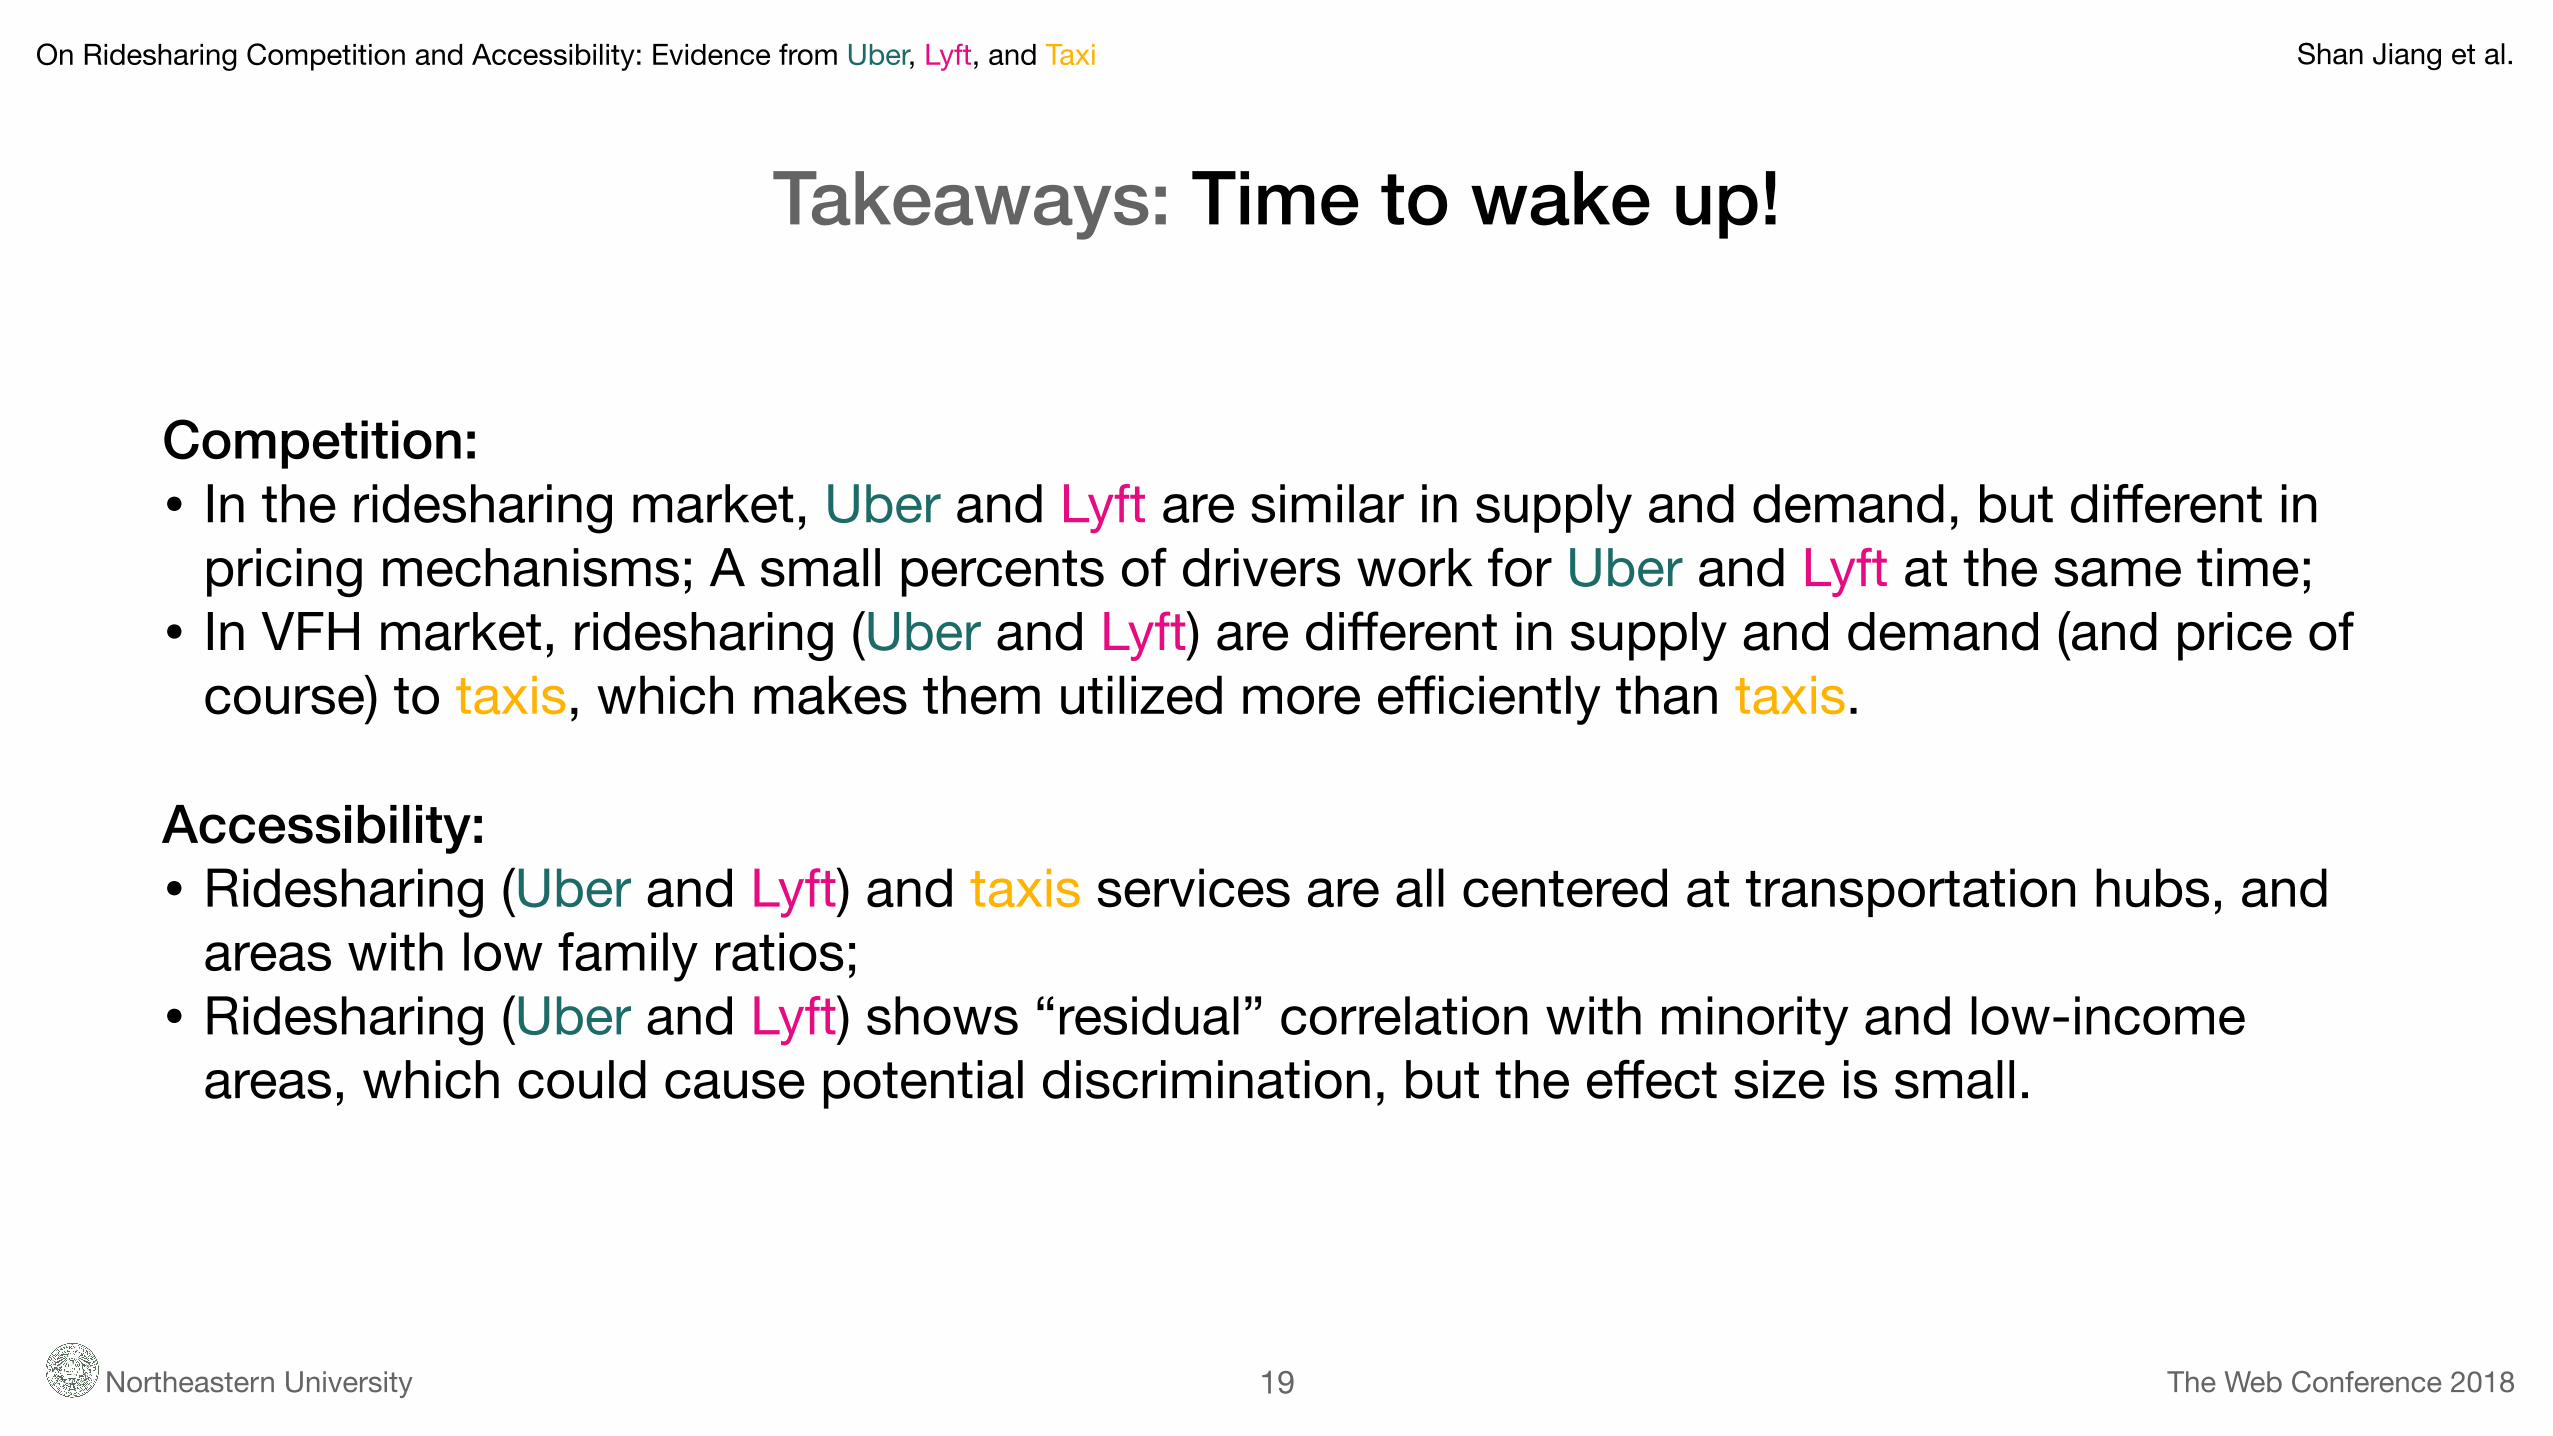
Takeaways: Time to wake up!
19
Competition: • In the ridesharing market, Uber and Lyft are similar in supply and demand, but different in
pricing mechanisms; A small percents of drivers work for Uber and Lyft at the same time;• In VFH market, ridesharing (Uber and Lyft) are different in supply and demand (and price of
course) to taxis, which makes them utilized more efficiently than taxis.
Accessibility: • Ridesharing (Uber and Lyft) and taxis services are all centered at transportation hubs, and
areas with low family ratios;• Ridesharing (Uber and Lyft) shows “residual” correlation with minority and low-income
areas, which could cause potential discrimination, but the effect size is small.
On Ridesharing Competition and Accessibility: Evidence from Uber, Lyft, and Taxi Shan Jiang et al.
Northeastern University The Web Conference 2018
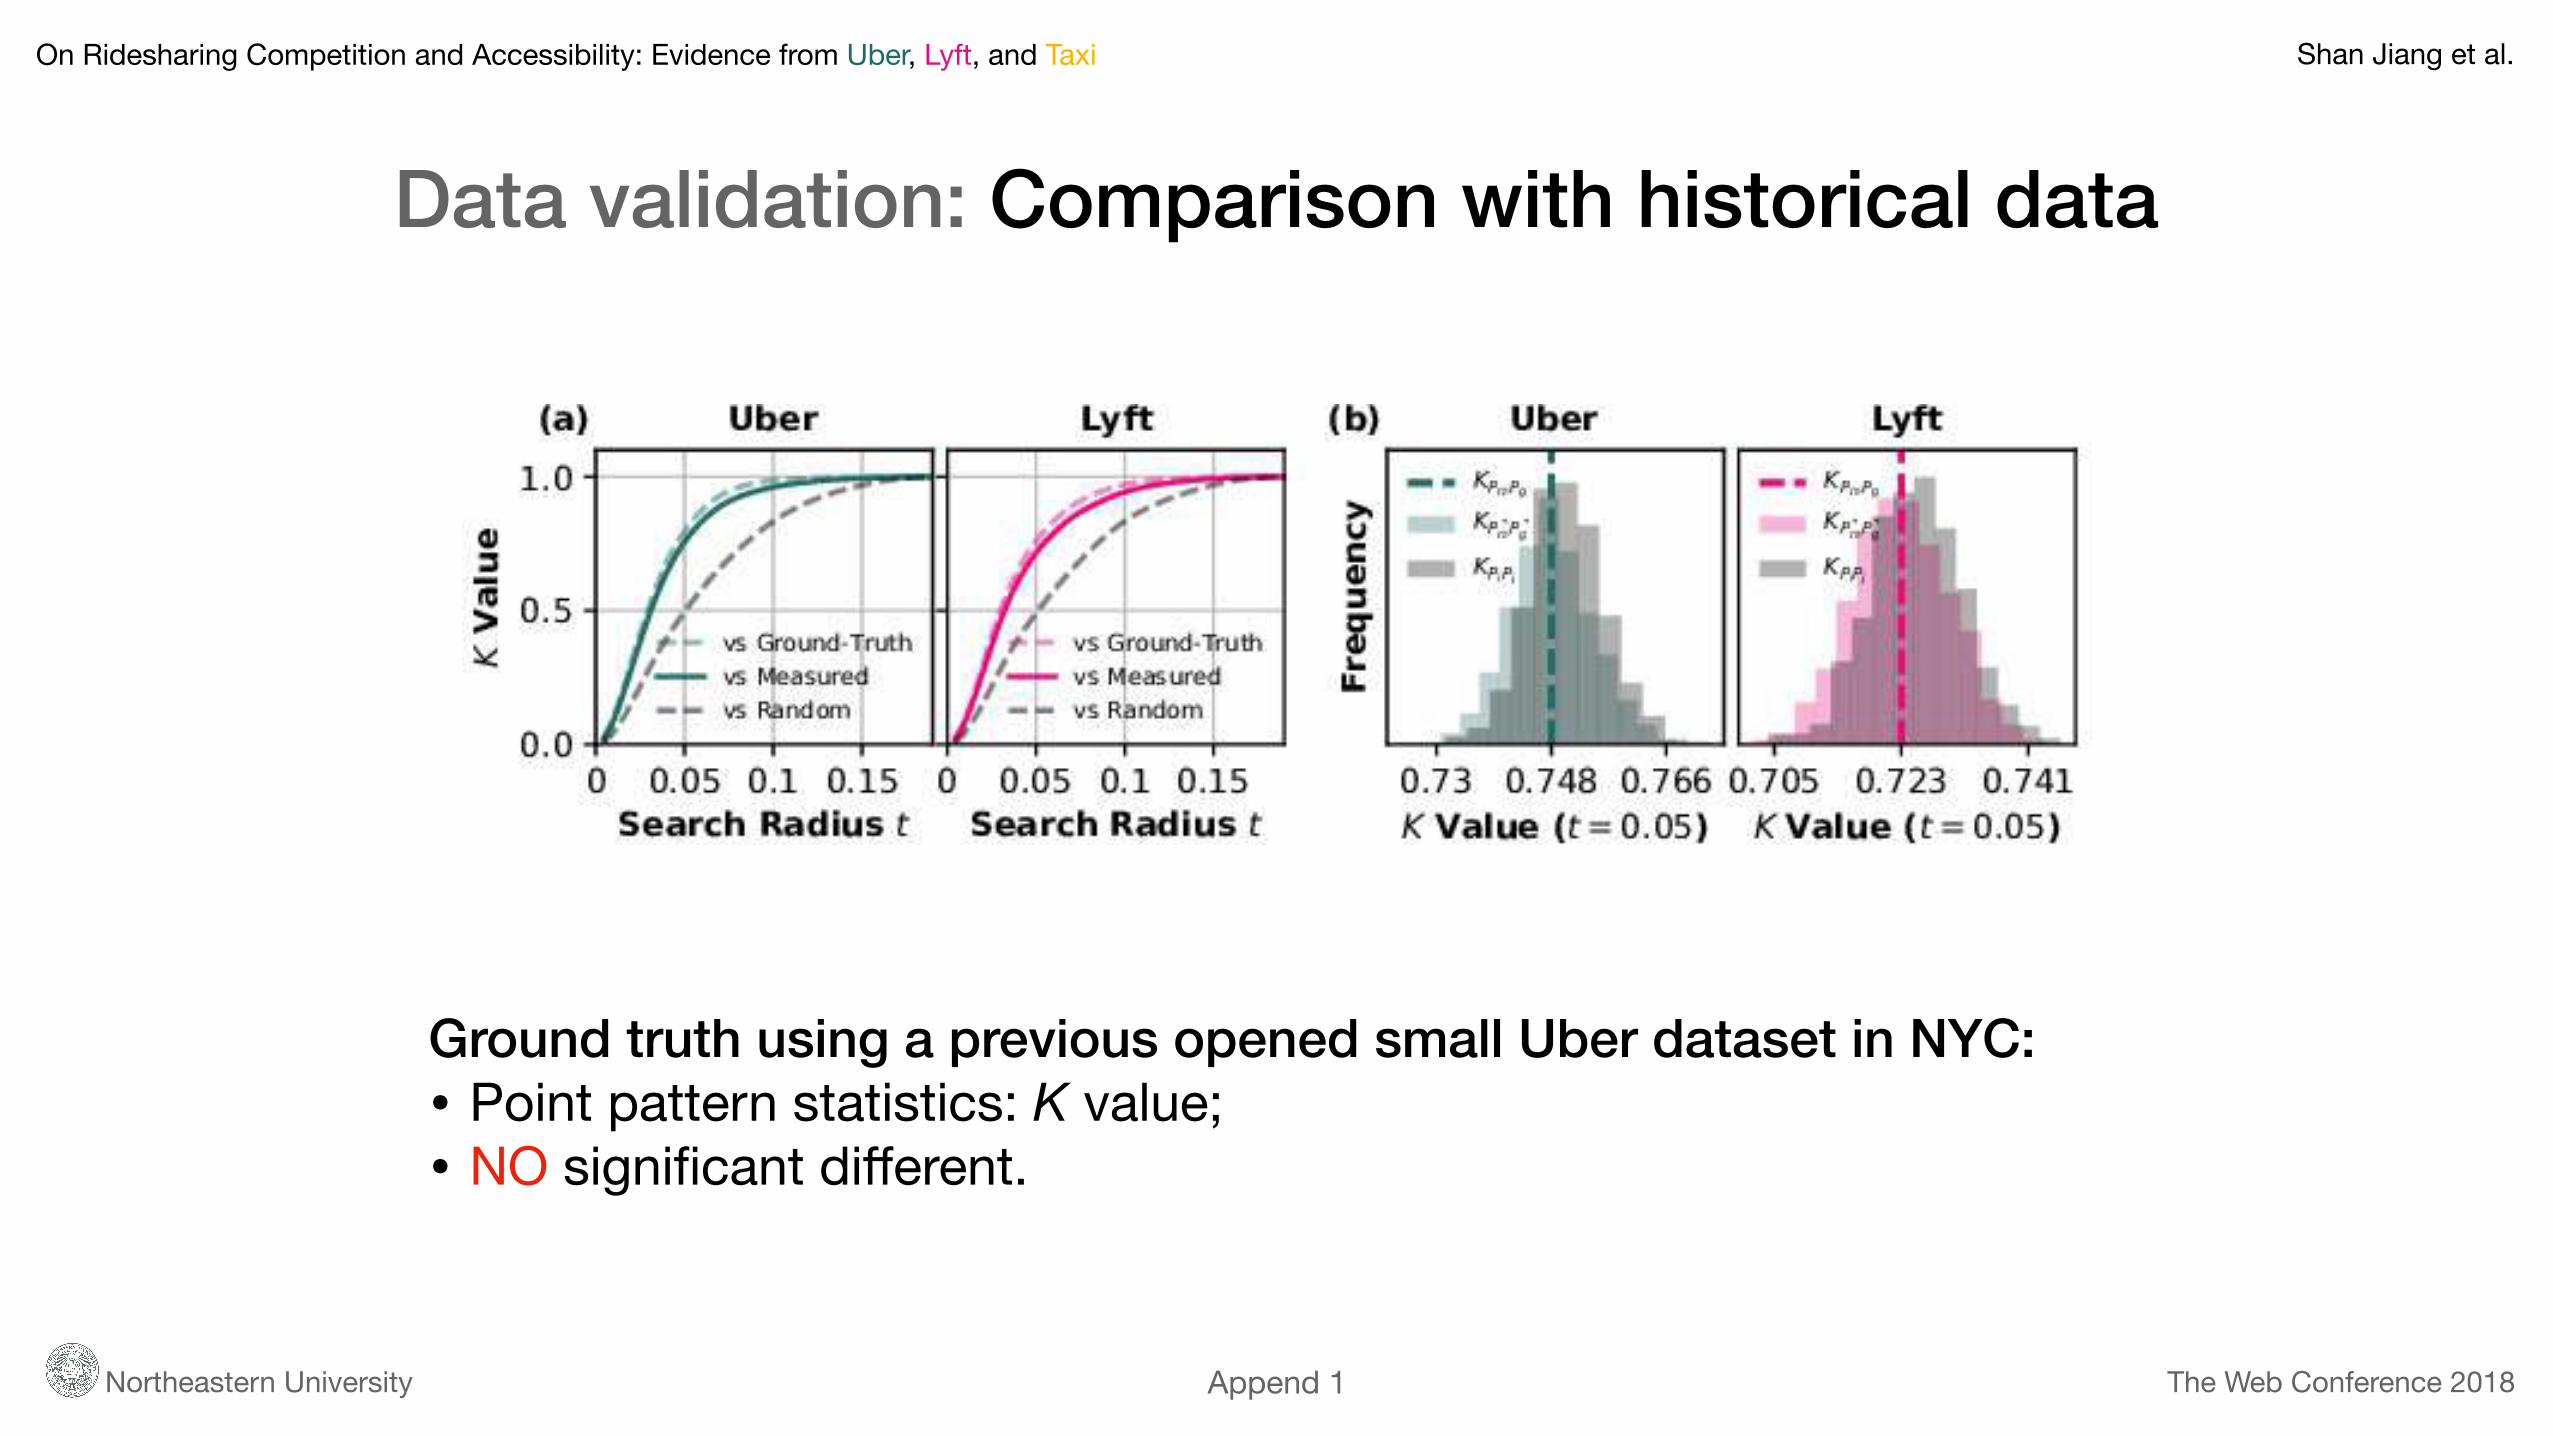
Data validation: Comparison with historical data
Append 1
Ground truth using a previous opened small Uber dataset in NYC: • Point pattern statistics: K value;• NO significant different.
On Ridesharing Competition and Accessibility: Evidence from Uber, Lyft, and Taxi Shan Jiang et al.
Northeastern University The Web Conference 2018
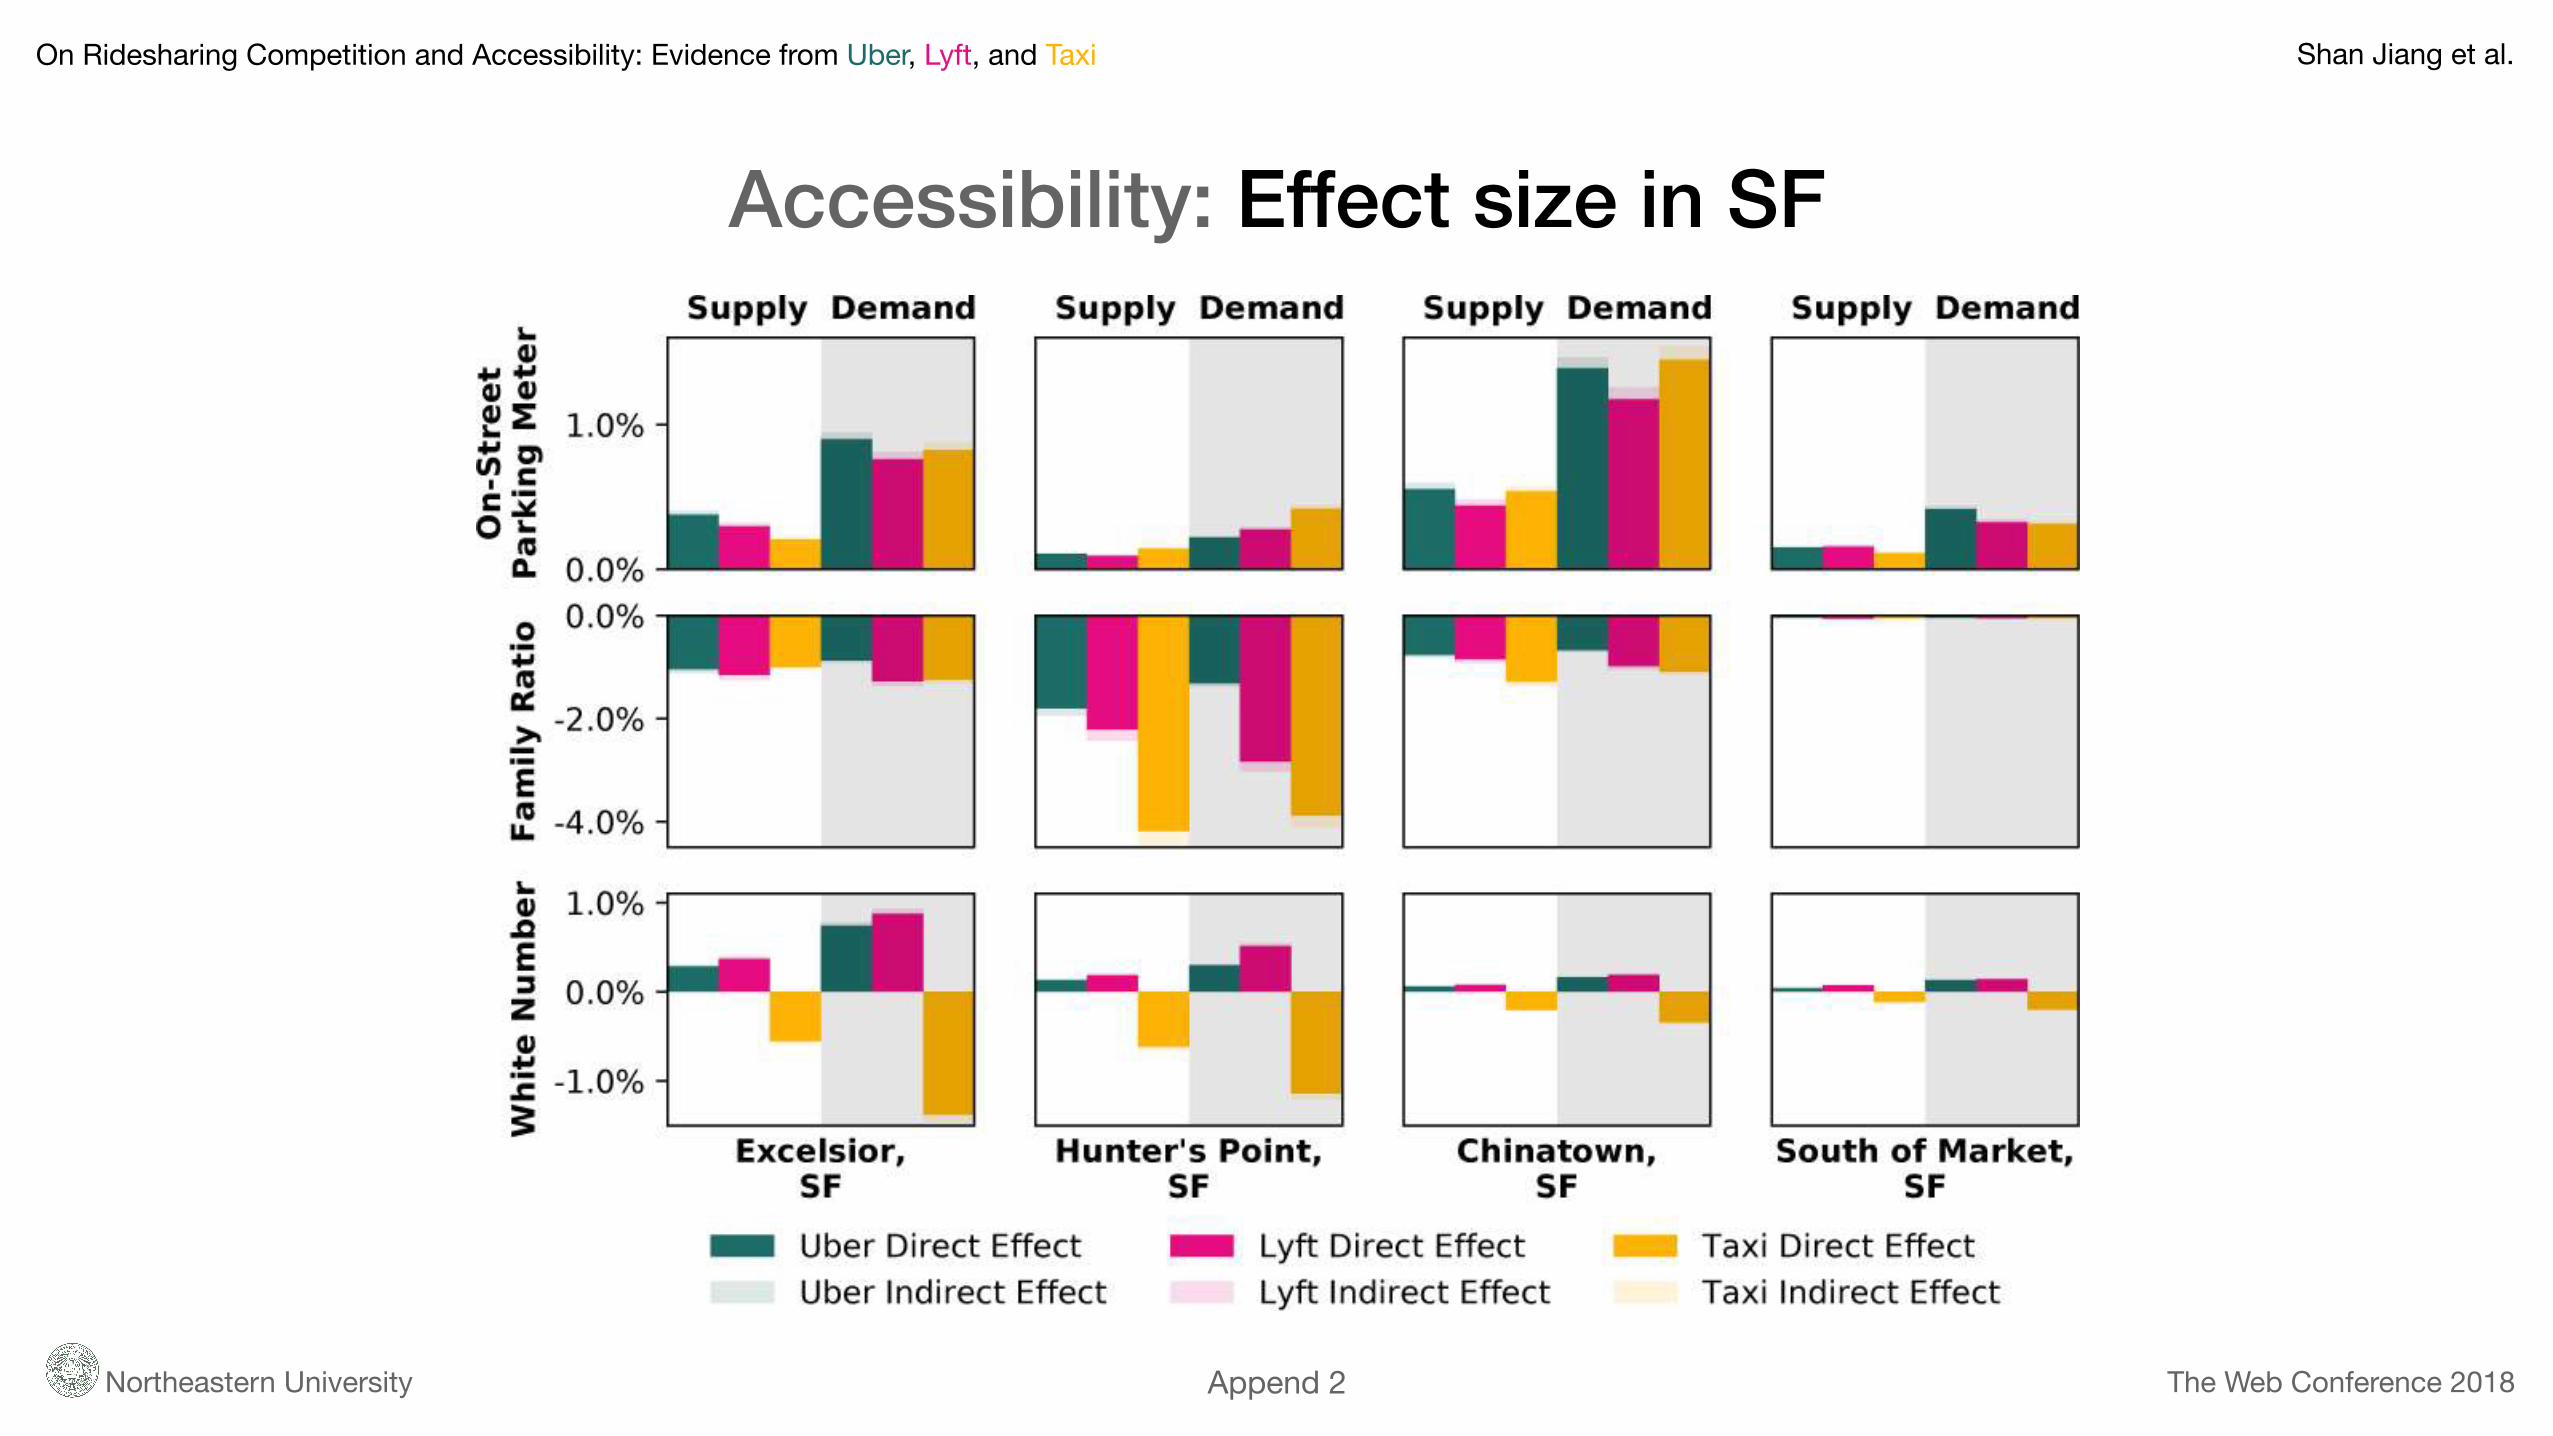
Accessibility: Effect size in SF
Append 2
On Ridesharing Competition and Accessibility: Evidence from Uber, Lyft, and Taxi Shan Jiang et al.
Northeastern University The Web Conference 2018
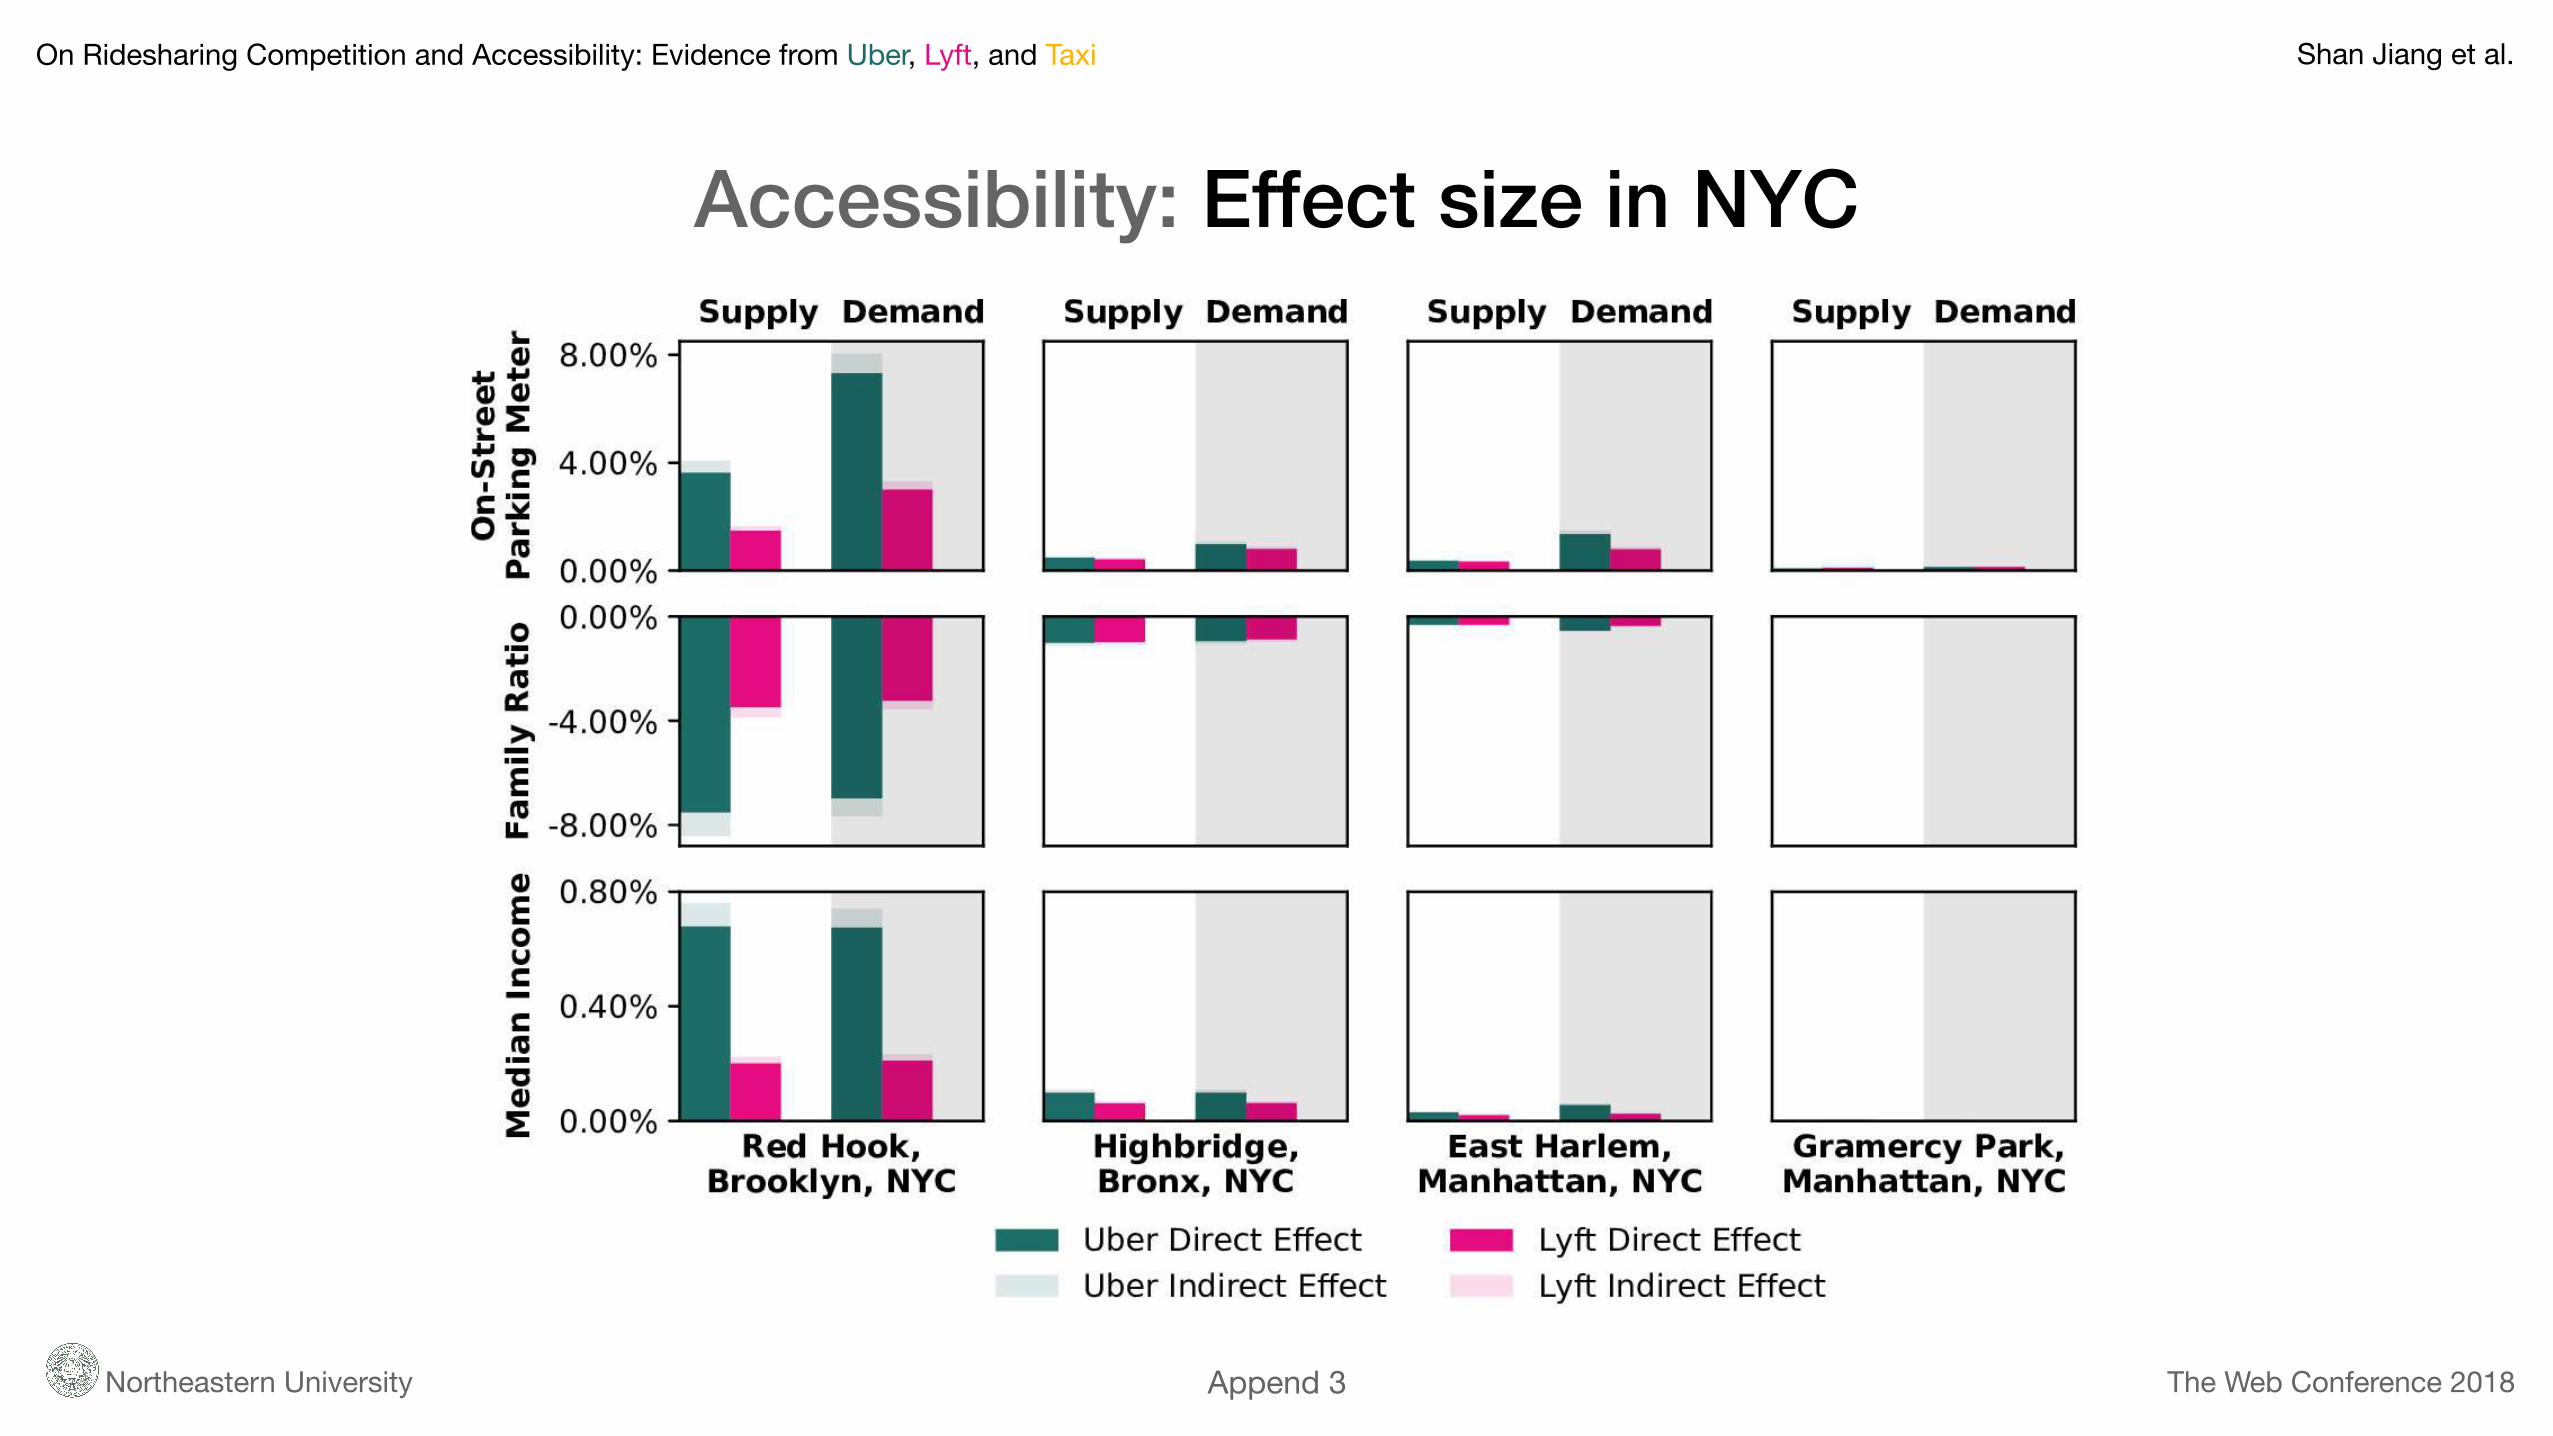
Accessibility: Effect size in NYC
Append 3


