On-Road Motor Vehicle Emissions including NH 3 , SO 2 and NO 2 Gary A. Bishop, Allison Peddle and Donald H. Stedman Department of Chemistry and Biochemistry University of Denver Denver, CO www.feat.biochem.du.edu Sacramento, CA June 17, 2010
Transcript
On-Road Motor Vehicle Emissions including NH3, SO2 and NO2
Gary A. Bishop, Allison Peddleand Donald H. Stedman
Department of Chemistry and BiochemistryUniversity of Denver
• 1973 Vehicle Inspection Instrumentation, Hoshizaki, Wood and Kemp, Report to CARB.– REMOVE reported CO, HC, and NO ratioed to [CO+CO2]
in the IR. Was battery powered and gave results on 3 analog meters. Worked sometimes for CO and HC up to 20mph. Results were never published in the literature!
• 1983 The remote measurement of traffic generated CO,Chaney, JAPCA.– Demonstrated the capabilities to measure individual
vehicle CO plumes with a roadside detector.• 1987 DU demonstrates the Fuel Efficiency Automobile Test
1000 instrument.– Liquid N2 cooled InSb detectors for CO and CO2.– Added video image capture and a detector for HC in 1989
Vehicle Remote Sensing History (cont.)
• 1989 General Motors (Stephens et al) develops an on-road sensor
• 1990 FEAT 3000 instrument developed– Four peltier cooled detectors CO, CO2, HC and Ref
• 1991 Hughes Aircraft tests a sensor using an FTIR
• 1994 RSD1000 First commercial remote sensor– FEAT 3000 upgraded with NDUV NO
• 1997 FEAT 3000 upgraded with a dispersive UV spectrometer for NO
• 2005 FEAT 3000 upgraded to twin spectrometers to measure NO, SO2, NH3 and NO2
Roadside Instrument Setup
Light Source
Speed Bars
Roadside Instrument Setup
Speed Bars
Light Source
Calibration Cylinder
FEAT Detector
Spectrometers
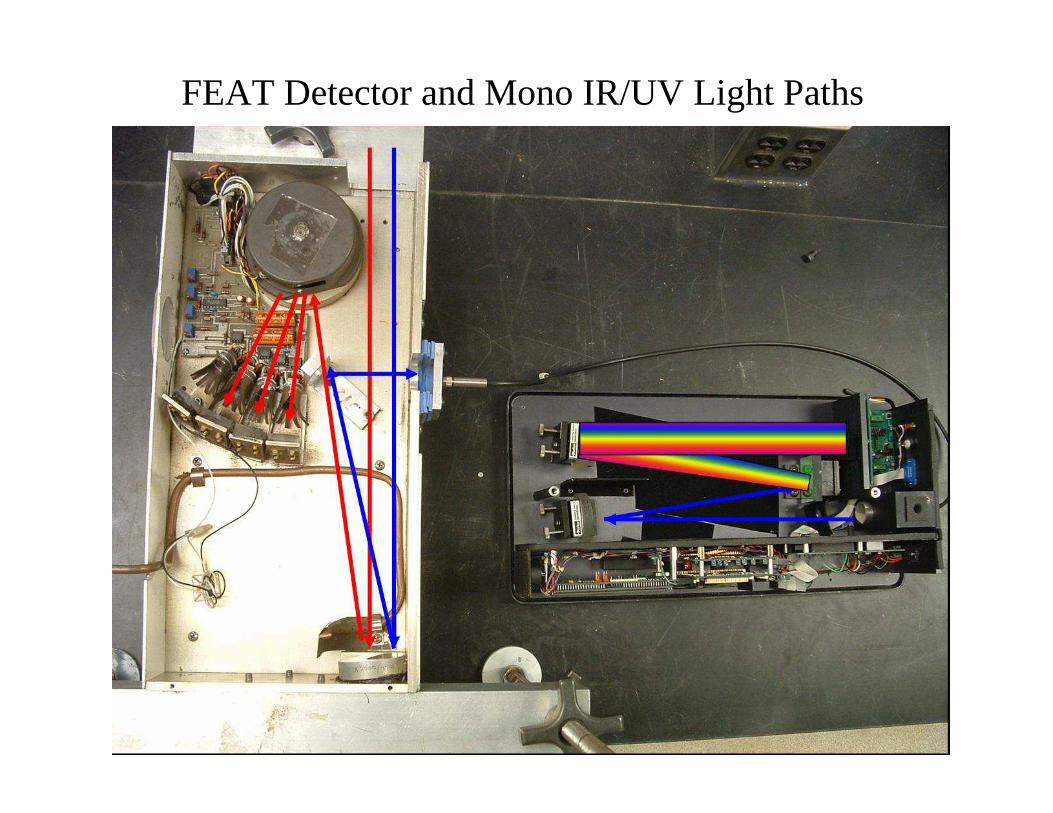
FEAT Detector and Mono IR/UV Light Paths
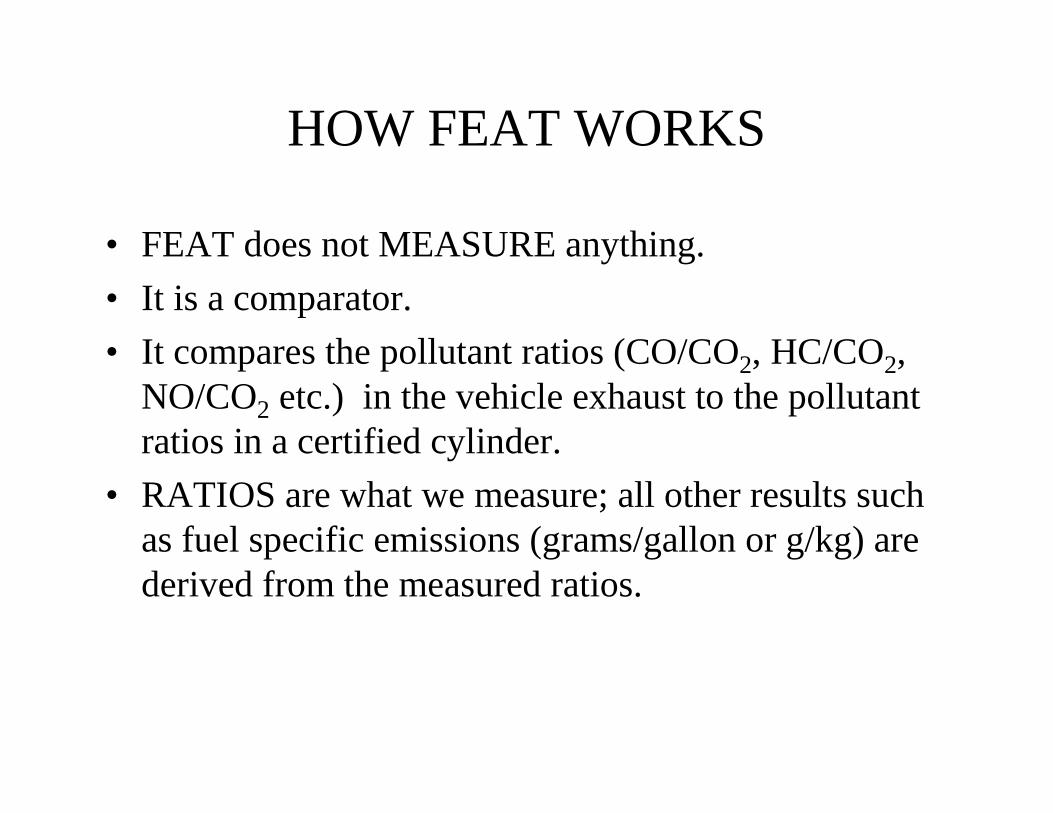
HOW FEAT WORKS
• FEAT does not MEASURE anything.
• It is a comparator.
• It compares the pollutant ratios (CO/CO2, HC/CO2, NO/CO2 etc.) in the vehicle exhaust to the pollutant ratios in a certified cylinder.
• RATIOS are what we measure; all other results such as fuel specific emissions (grams/gallon or g/kg) are derived from the measured ratios.
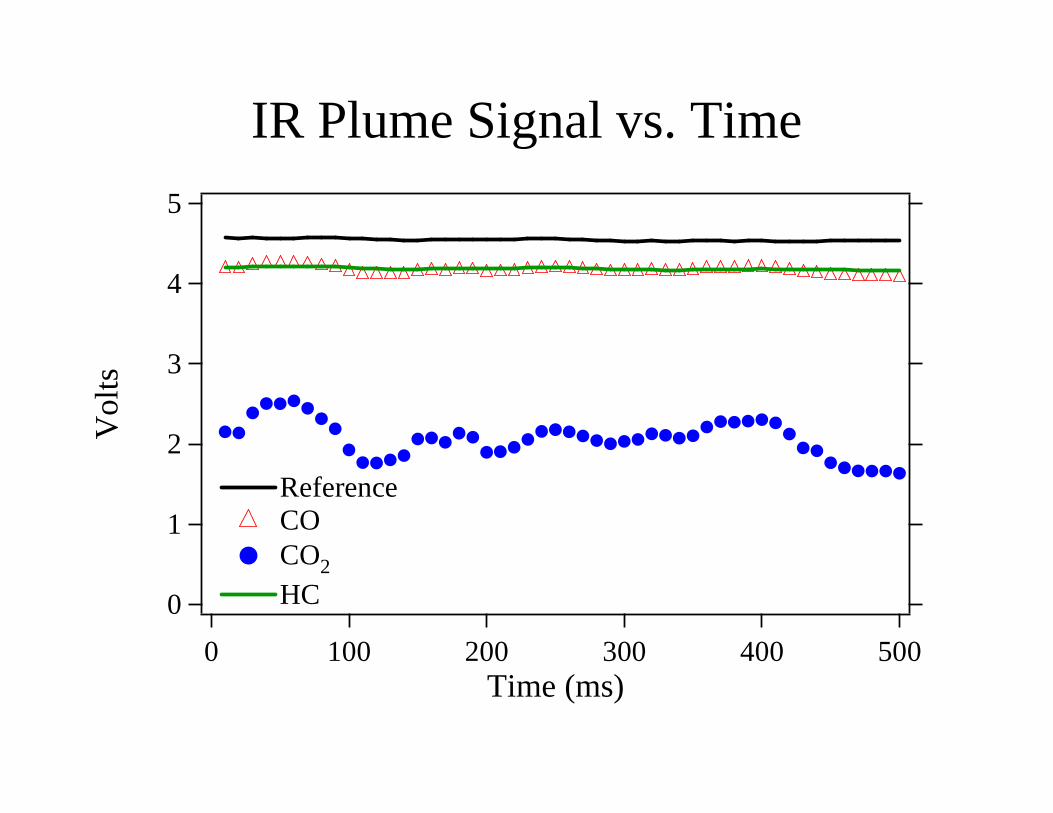
IR Plume Signal vs. Time
5
4
3
2
1
0
Vol
ts
5004003002001000Time (ms)
ReferenceCOCO2
HC
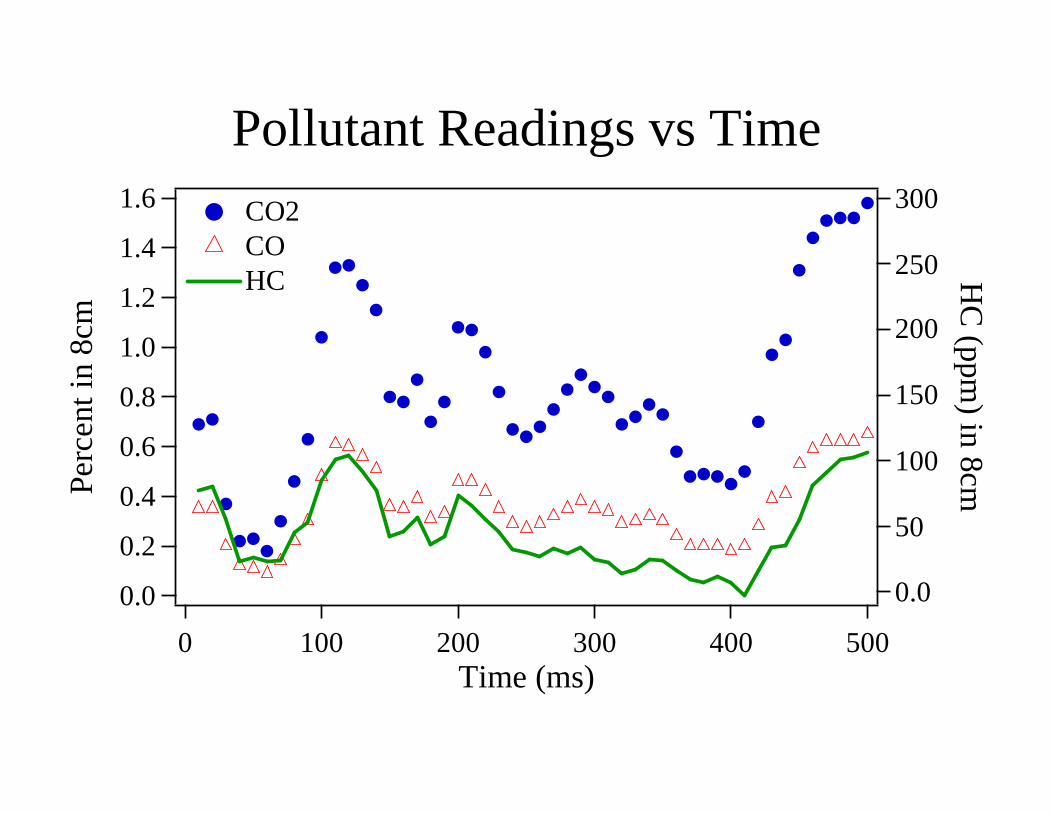
Pollutant Readings vs Time1.6
1.4
1.2
1.0
0.8
0.6
0.4
0.2
0.0
Pe
rce
nt in
8cm
5004003002001000Time (ms)
HC
(ppm
) in 8cm
CO2COHC
0.0
50
100
150
200
250
300
Pollutant Ratio Plots0.75
0.50
0.25
0.00
Per
cent
CO
in 8
cm
2.01.51.00.50.0
Percent CO2 in 8cm
HC
(ppm) in 8cm
CO/CO2 = 0.41
gCO/kg ~ 550
0.0
50
100
150
200
250
300
HC/CO2 = 0.0067 gHC/kg ~ 14
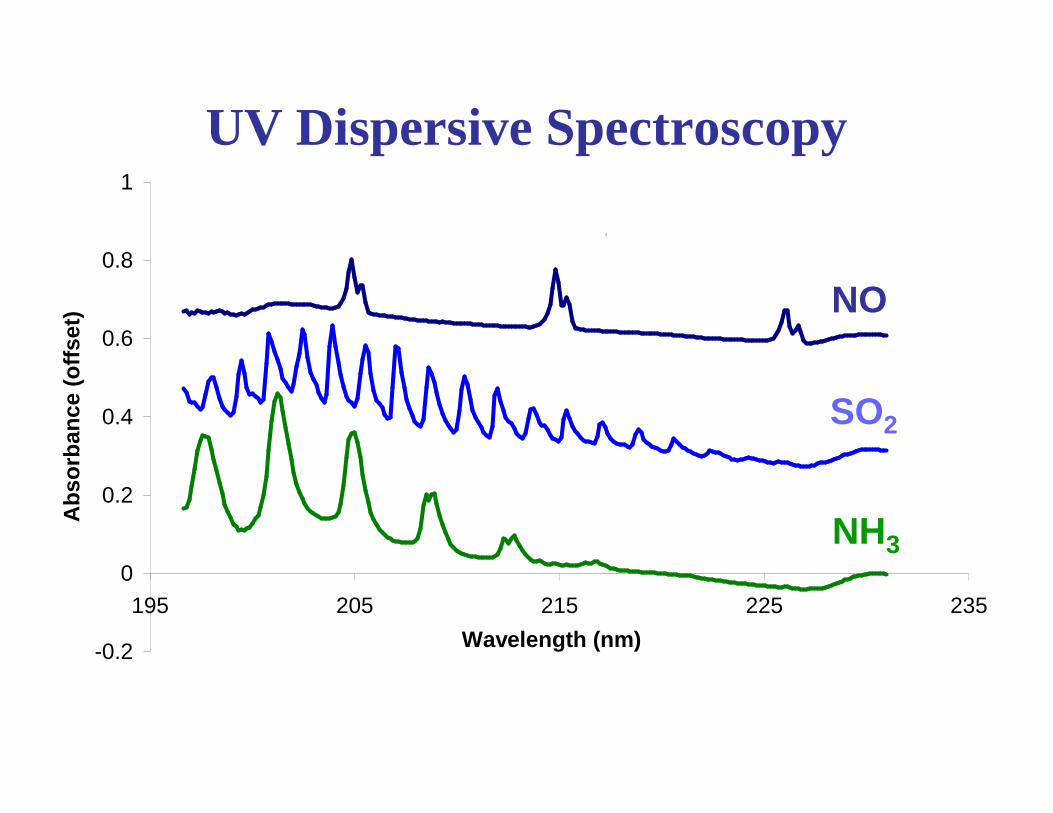
UV Dispersive Spectroscopy
-0.2
0
0.2
0.4
0.6
0.8
1
195 205 215 225 235
Wavelength (nm)
Ab
sorb
ance
(o
ffse
t)
NO
SO2
NH3
NO2 Spectrum from FEAT Remote Sensor
0
0.01
0.02
0.03
0.04
0.05
0.06
0.07
0.08
430 432 434 436 438 440 442 444 446 448
Wavelength (nm)
Ab
sorb
ance
Field Sampling: March, 2008
Three Field Sampling Sites
San Jose Site / Nb I-280 to Nb I-880
March 4 – 7, 2008
Attempts / Valid Gas / Matched
31,116 / 25,371 / 24,978
Mean CO – 16.6 g/kgMean HC – 1.5 g/kgMean NO – 2.6 g/kgMean SO2 – 0.06 g/kgMean NH3 – 0.5 g/kgMean NO2 – 0.05 g/kgMean MY – 2000.6Mean Speed – 30.6 mphMean Accel – 1.0 mph/s
San Jose Historical Emissions Comparison50
40
30
20
10
0
Mea
n g/
kg
1999 2008Measurement Year
COAdjusted HCNO
-66%
-74% -40%
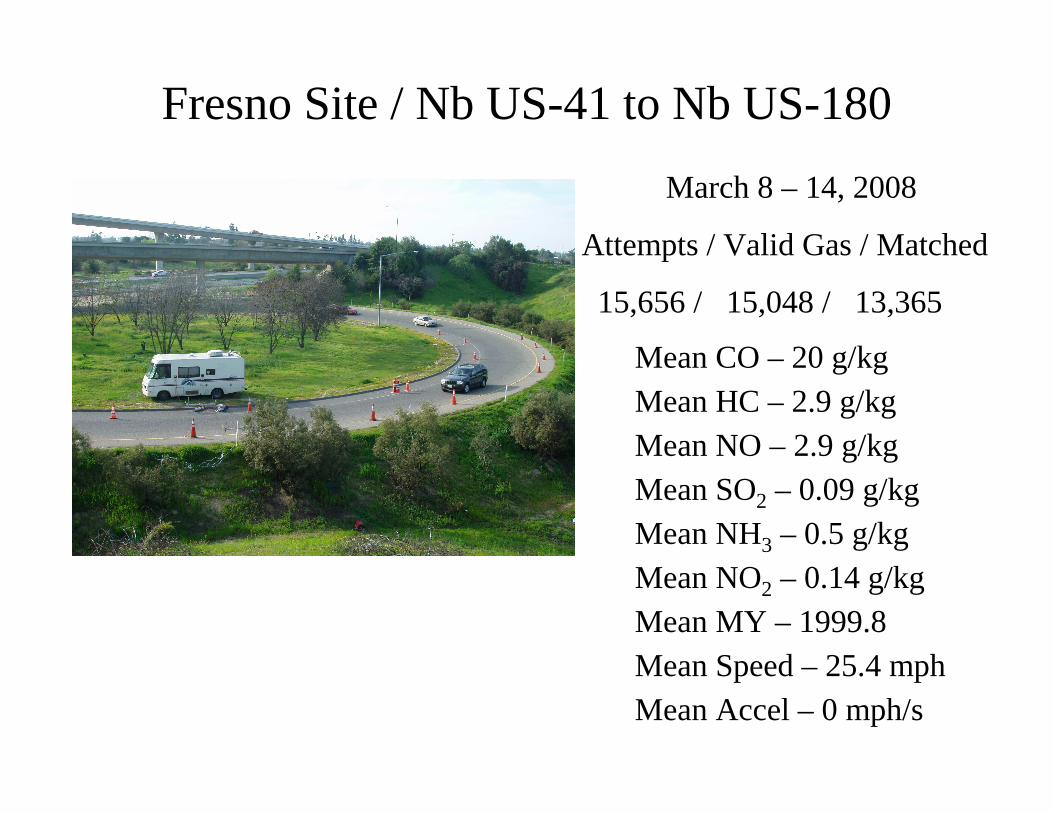
Fresno Site / Nb US-41 to Nb US-180
March 8 – 14, 2008
Attempts / Valid Gas / Matched
15,656 / 15,048 / 13,365
Mean CO – 20 g/kgMean HC – 2.9 g/kgMean NO – 2.9 g/kgMean SO2 – 0.09 g/kgMean NH3 – 0.5 g/kgMean NO2 – 0.14 g/kgMean MY – 1999.8Mean Speed – 25.4 mphMean Accel – 0 mph/s
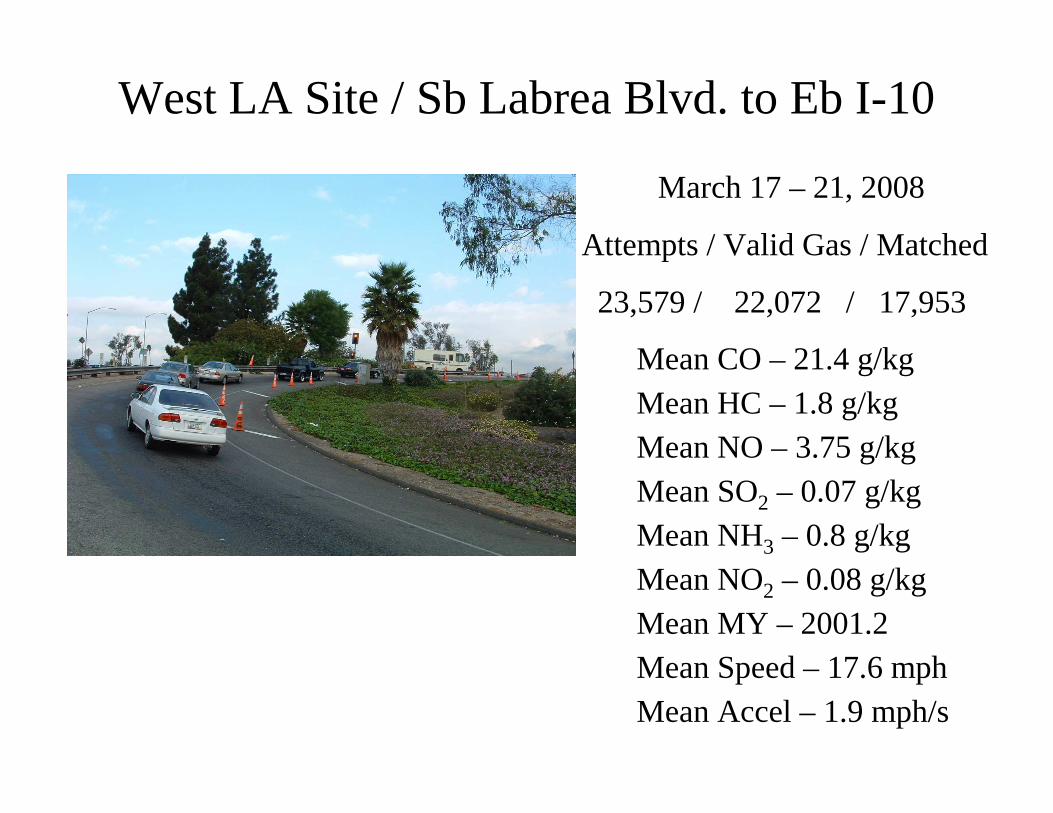
West LA Site / Sb Labrea Blvd. to Eb I-10
March 17 – 21, 2008
Attempts / Valid Gas / Matched
23,579 / 22,072 / 17,953
Mean CO – 21.4 g/kgMean HC – 1.8 g/kgMean NO – 3.75 g/kgMean SO2 – 0.07 g/kgMean NH3 – 0.8 g/kgMean NO2 – 0.08 g/kgMean MY – 2001.2Mean Speed – 17.6 mphMean Accel – 1.9 mph/s
West LA Historical Emissions Comparison80
70
60
50
40
30
20
10
0
Mea
n g
/kg
1999 2008Measurement Year
-70%
-74% -43%
COAdjusted HCNO
CO/NOx Emissions Trend Comparison
Parrish LA -5.5 ± 0.4% San Jose -7.1% WLA -7.0 ± 0.2%Parrish Nashville -8.8 ± 1.0%
20
16
12
8
Mol
ar C
O/N
O x R
atio
2005200019951990Measurement Year
LA, Fujita et al. 1992 Parrish et al. 2006
San JoseFresnoWest LA
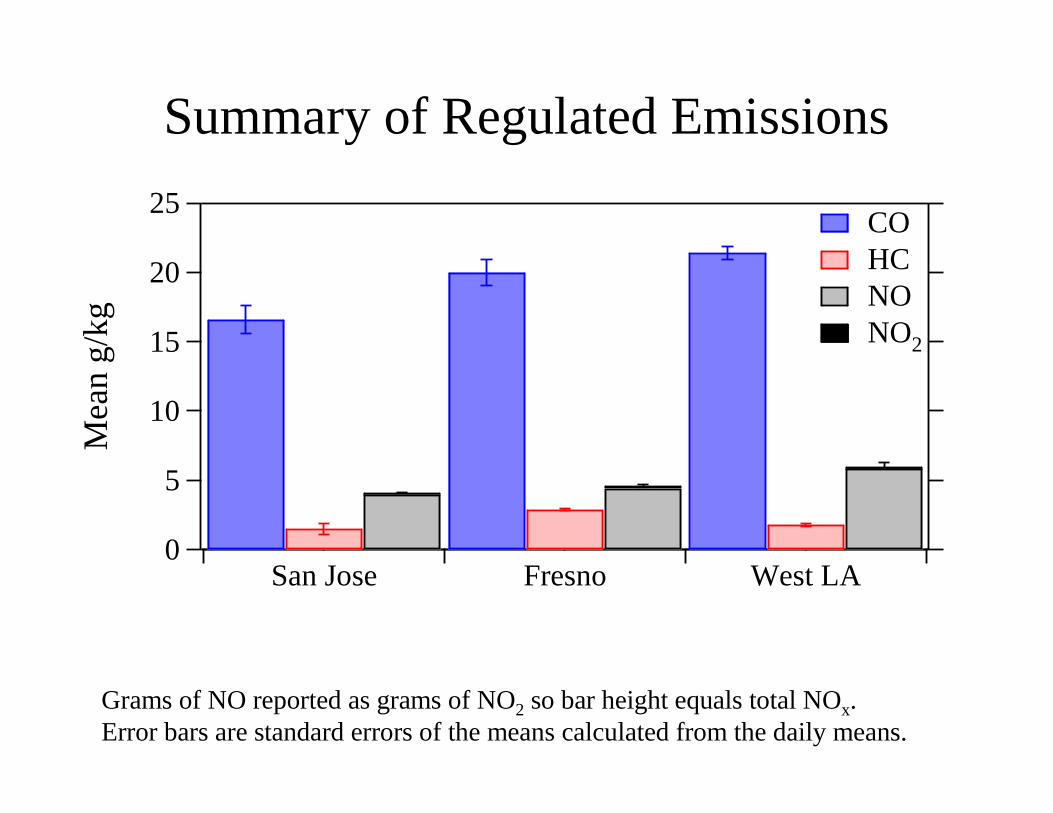
Summary of Regulated Emissions
25
20
15
10
5
0
Me
an
g/k
g
San Jose Fresno West LA
COHCNONO2
Grams of NO reported as grams of NO2 so bar height equals total NOx.Error bars are standard errors of the means calculated from the daily means.
Summary of Specialty Species
0.8
0.6
0.4
0.2
0.0
Me
an
g/kg
San Jose Fresno West LA
NH3
SO2
NO2
Baum et al. (1999) 0.35 g/kg Burgard et al. (2005) 0.47 ± 0.02 and 0.51 ± 0.01 Kean et al (2000 and 2006) 0.64 ± 0.04 and 0.4 ± 0.02Error bars are standard errors of the means calculated from the daily means.
There are still low hanging emissions…
14%38%31%West LA
12%34%27%Denver 2007
15%15%33%Fresno
16%17%34%San Jose
NOHCCOTop 1%
Contribute
If a study misses one vehicle out of 100, these are the potential errors in the resulting inventory
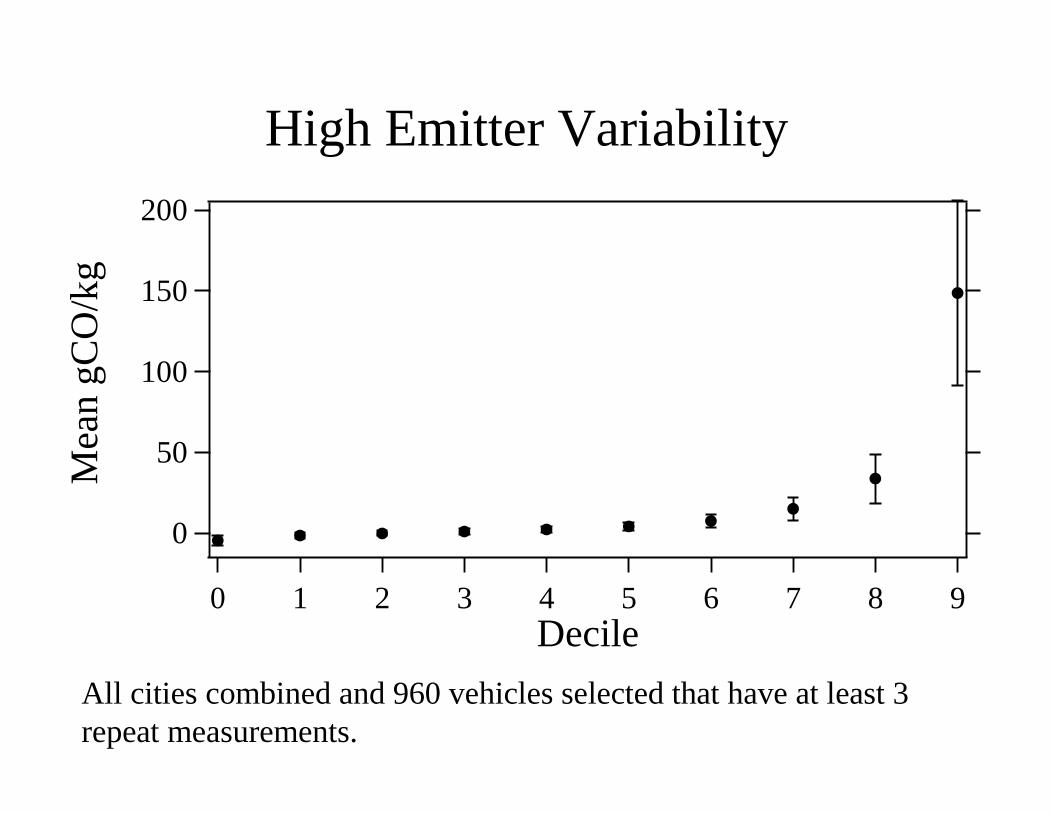
High Emitter Variability
All cities combined and 960 vehicles selected that have at least 3 repeat measurements.
200
150
100
50
0
Mea
n gC
O/k
g
9876543210Decile
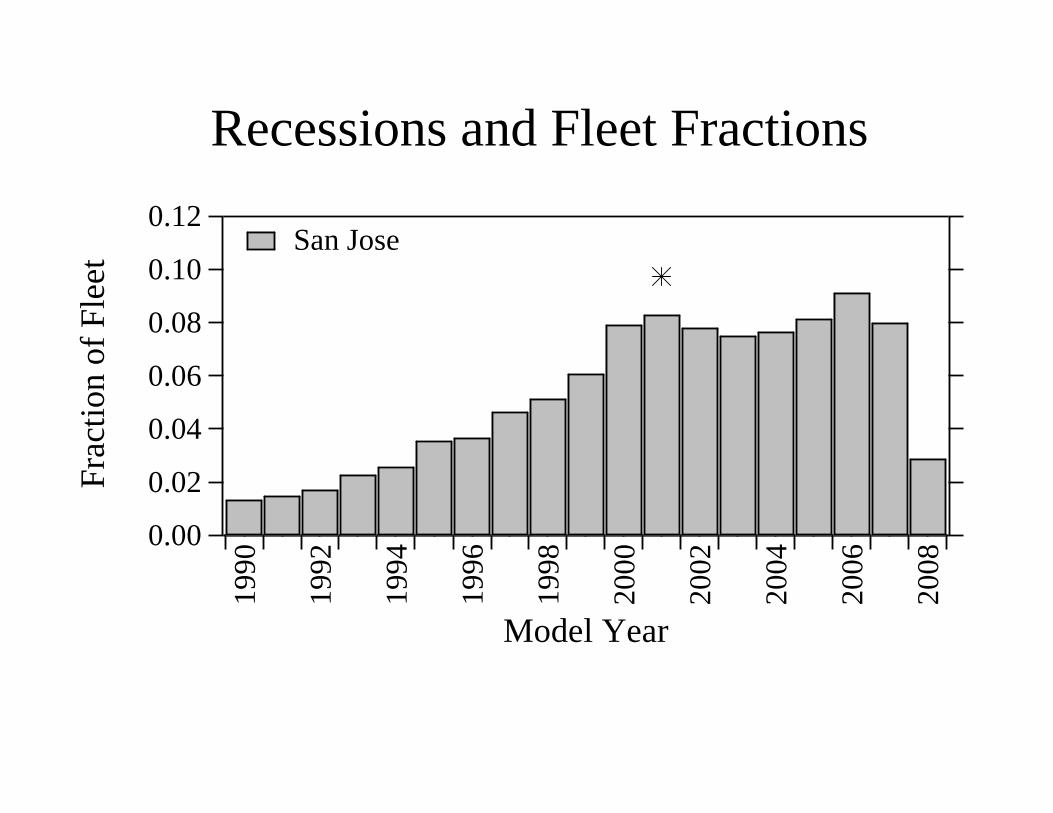
Recessions and Fleet Fractions
0.12
0.10
0.08
0.06
0.04
0.02
0.00
Fra
ctio
n o
f F
lee
t
19
90
19
92
19
94
19
96
19
98
20
00
20
02
20
04
20
06
20
08
Model Year
San Jose
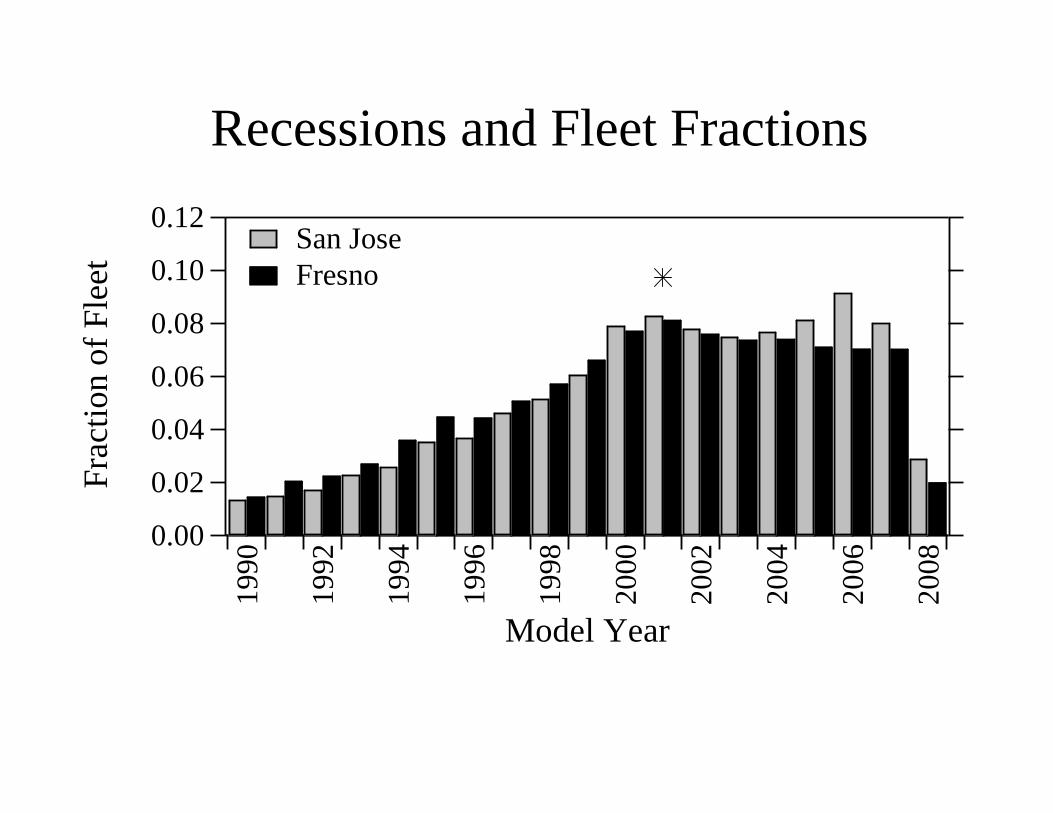
Recessions and Fleet Fractions
0.12
0.10
0.08
0.06
0.04
0.02
0.00
Fra
ctio
n of
Fle
et
19
90
19
92
19
94
19
96
19
98
20
00
20
02
20
04
20
06
20
08
Model Year
San JoseFresno
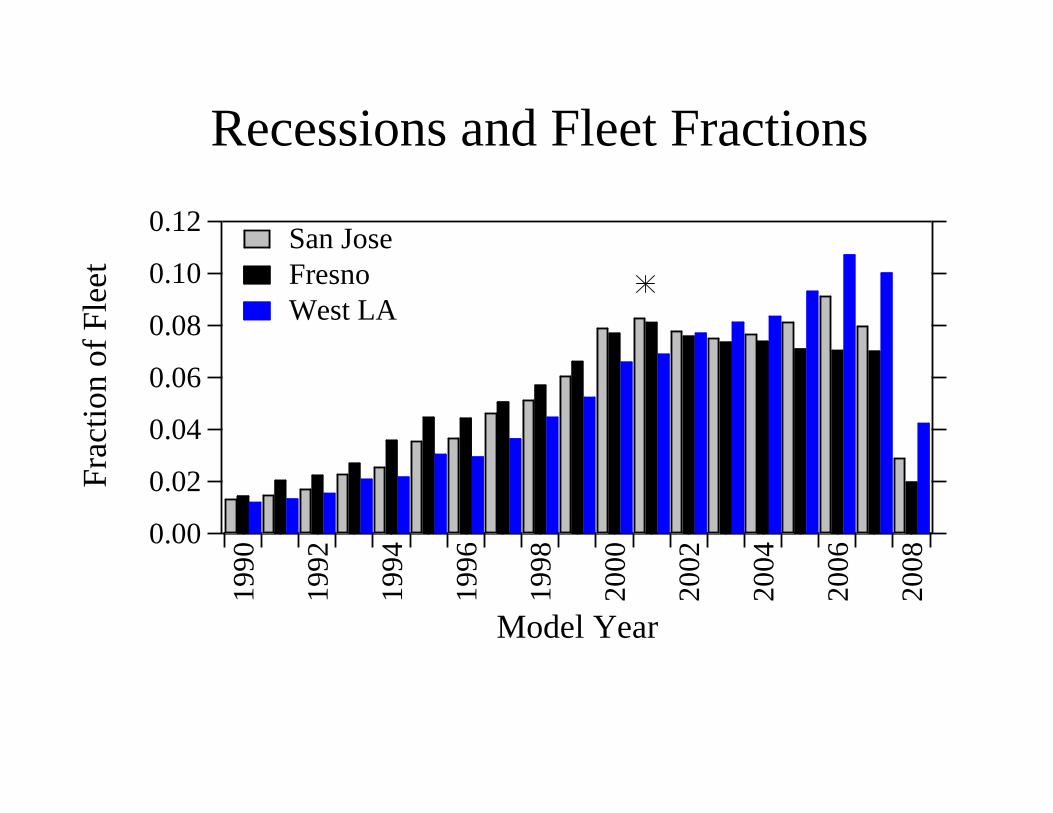
Recessions and Fleet Fractions
0.12
0.10
0.08
0.06
0.04
0.02
0.00
Fra
ctio
n of
Fle
et
19
90
19
92
19
94
19
96
19
98
20
00
20
02
20
04
20
06
20
08
Model Year
San JoseFresnoWest LA
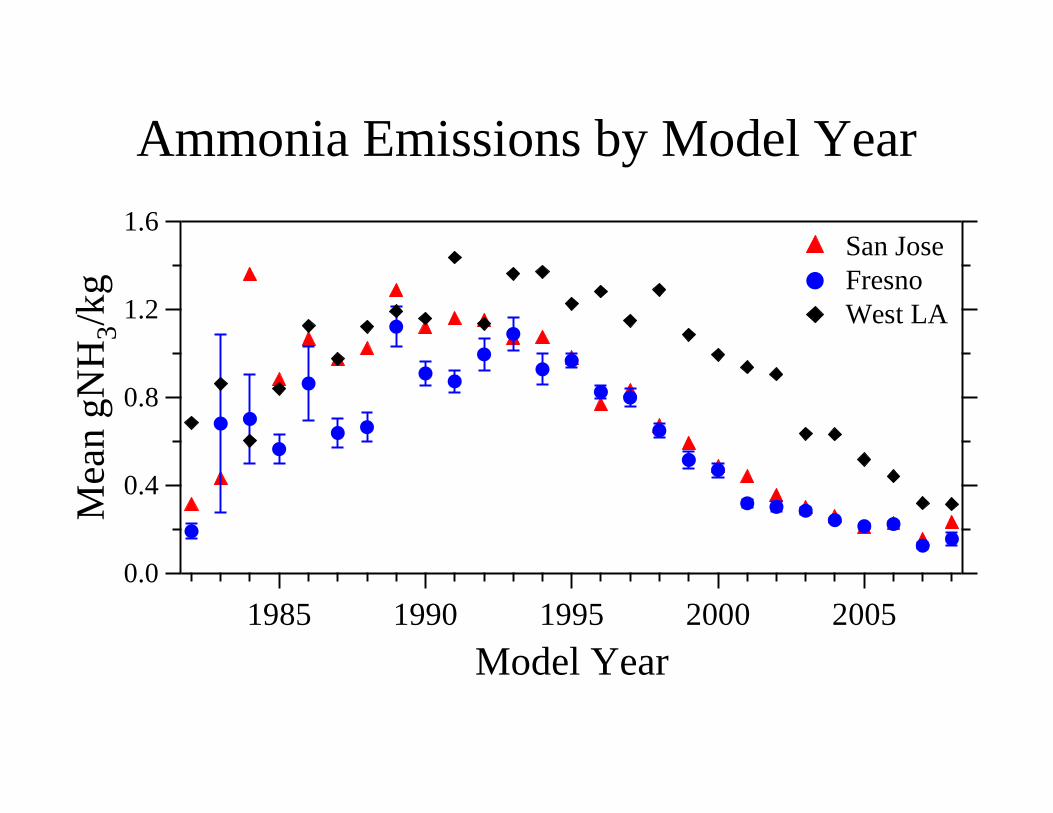
Ammonia Emissions by Model Year
1.6
1.2
0.8
0.4
0.0
Mea
n g
NH 3
/kg
20052000199519901985
Model Year
San JoseFresnoWest LA
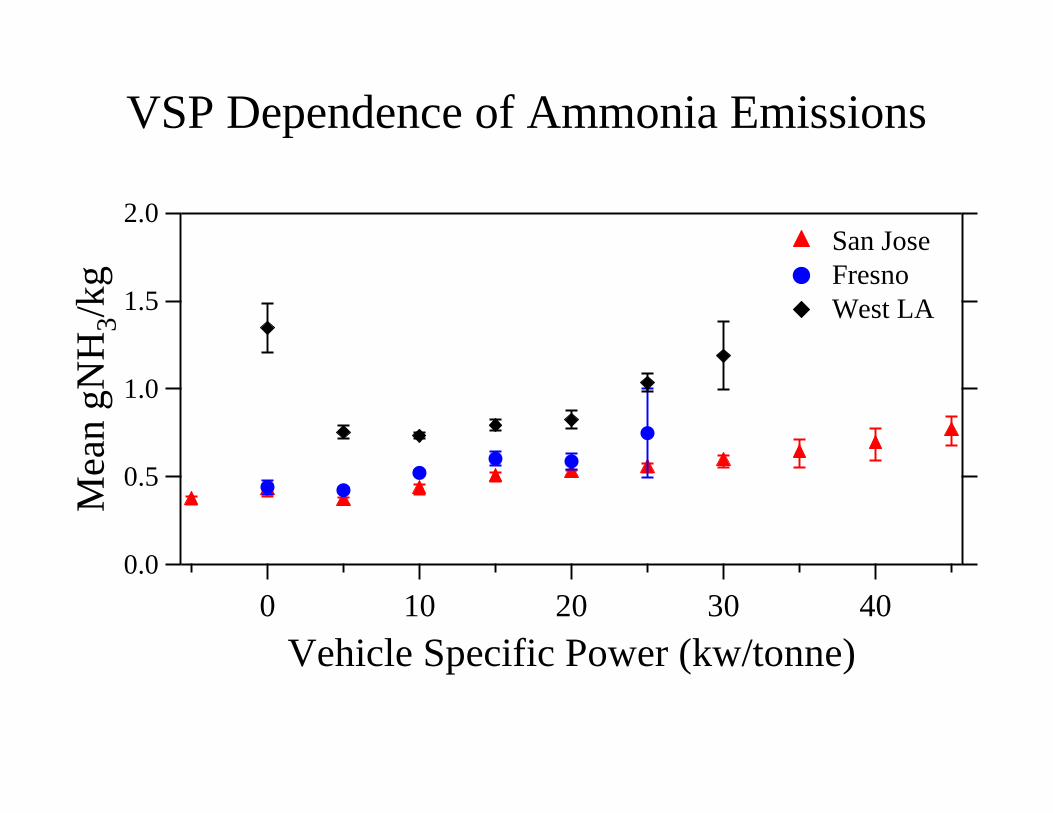
VSP Dependence of Ammonia Emissions
2.0
1.5
1.0
0.5
0.0
Mea
n g
NH 3
/kg
403020100
Vehicle Specific Power (kw/tonne)
San JoseFresnoWest LA
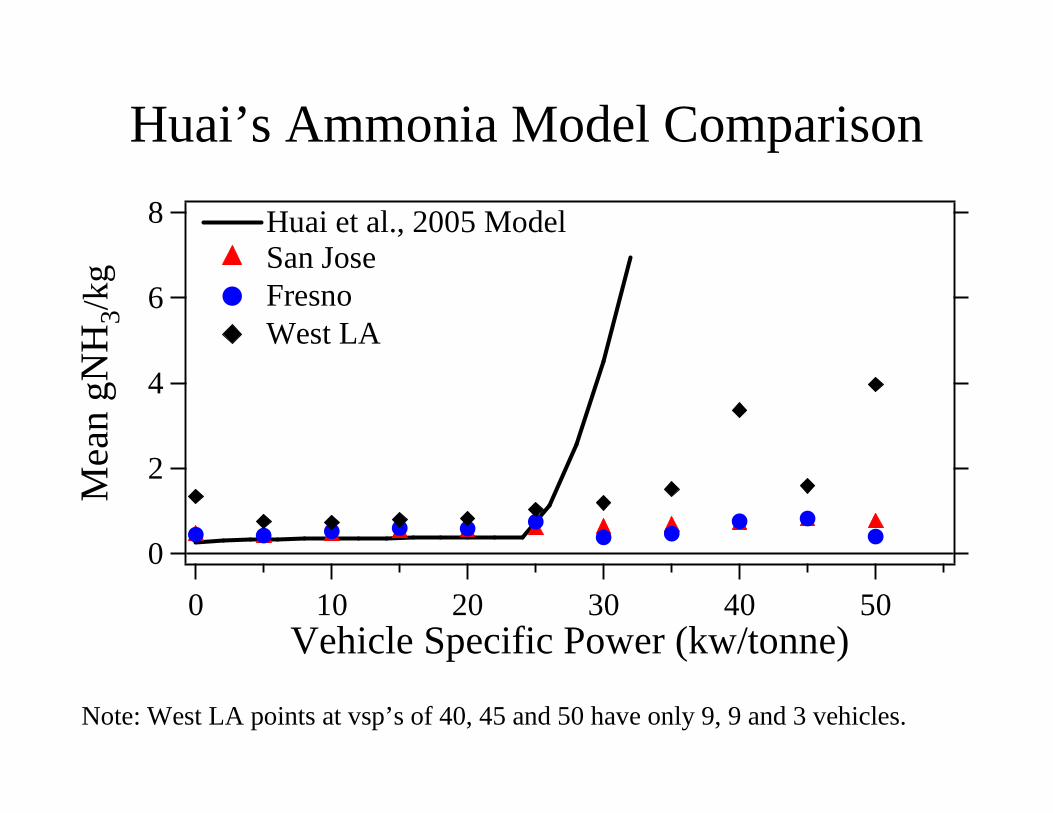
Huai’s Ammonia Model Comparison
Note: West LA points at vsp’s of 40, 45 and 50 have only 9, 9 and 3 vehicles.
8
6
4
2
0
Mea
n g
NH 3
/kg
50403020100Vehicle Specific Power (kw/tonne)
Huai et al., 2005 ModelSan JoseFresnoWest LA
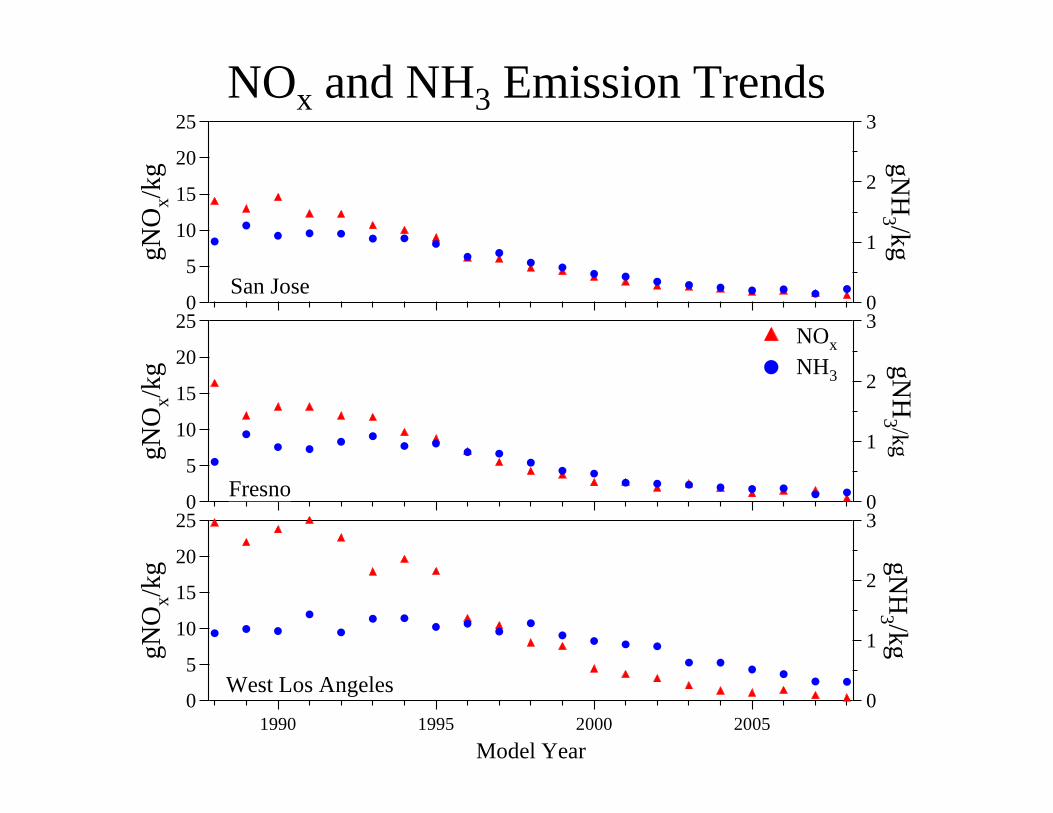
NOx and NH3 Emission Trends25
20
15
10
5
0
gNO
x/kg
3
2
1
0
gNH
3 /kg
San Jose
25
20
15
10
5
0
gNO
x/kg
3
2
1
0
gNH
3 /kg
NOx
NH3
Fresno25
20
15
10
5
0
gN
Ox/
kg
2005200019951990
Model Year
3
2
1
0
gNH
3 /kg
West Los Angeles
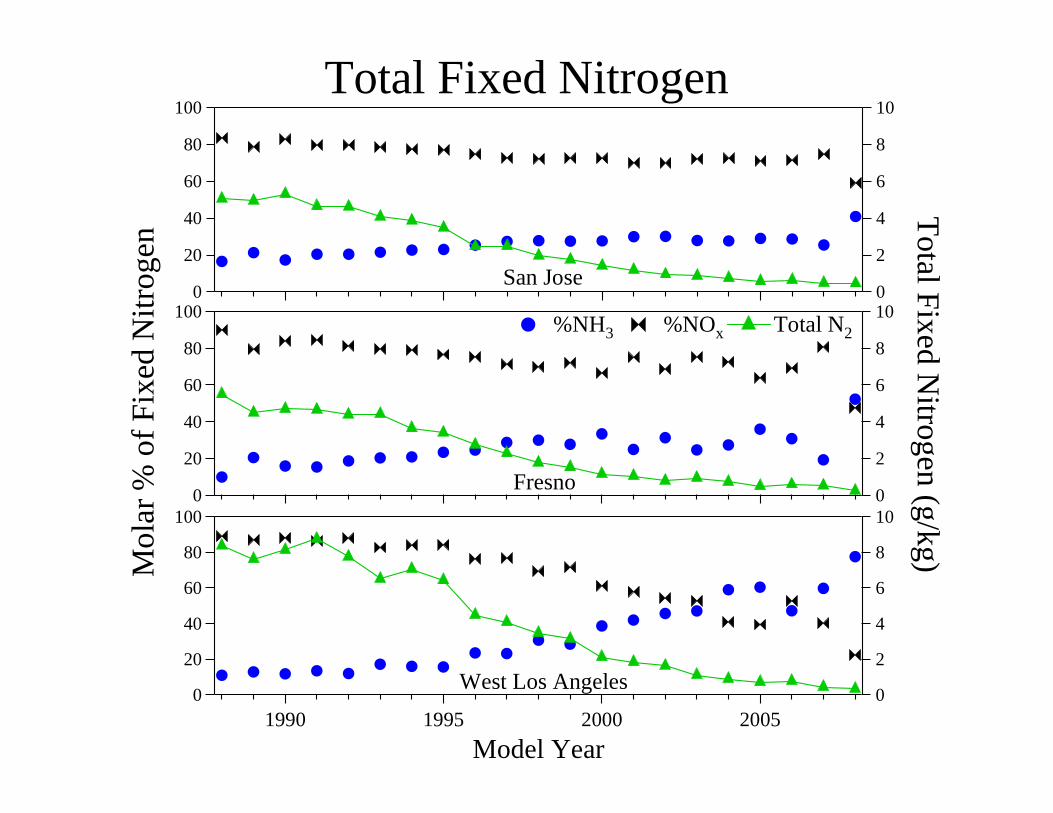
Total Fixed Nitrogen 100
80
60
40
20
0
10
8
6
4
2
0San Jose
100
80
60
40
20
0
10
8
6
4
2
0Fresno
%NH3 %NOx Total N2
100
80
60
40
20
02005200019951990
Model Year
10
8
6
4
2
0West Los Angeles
Mo
lar
% o
f Fix
ed N
itrog
enT
otal Fixed
Nitrog
en (g/kg)
2007 National Ammonia Inventory Comparison
330,0000.79West LA
210,0000.49San Jose / Fresno
National*
NH3 Short Tons
Mean
gNH3/kgCity
*Assumes 378,000,000 gal/day of gasoline and a density of 6.073 lbs/gallon and NH3 emissions are negligible from cold start gasoline and all diesel vehicles.
The US EPA 2007 Estimate is 307,000 short tons.
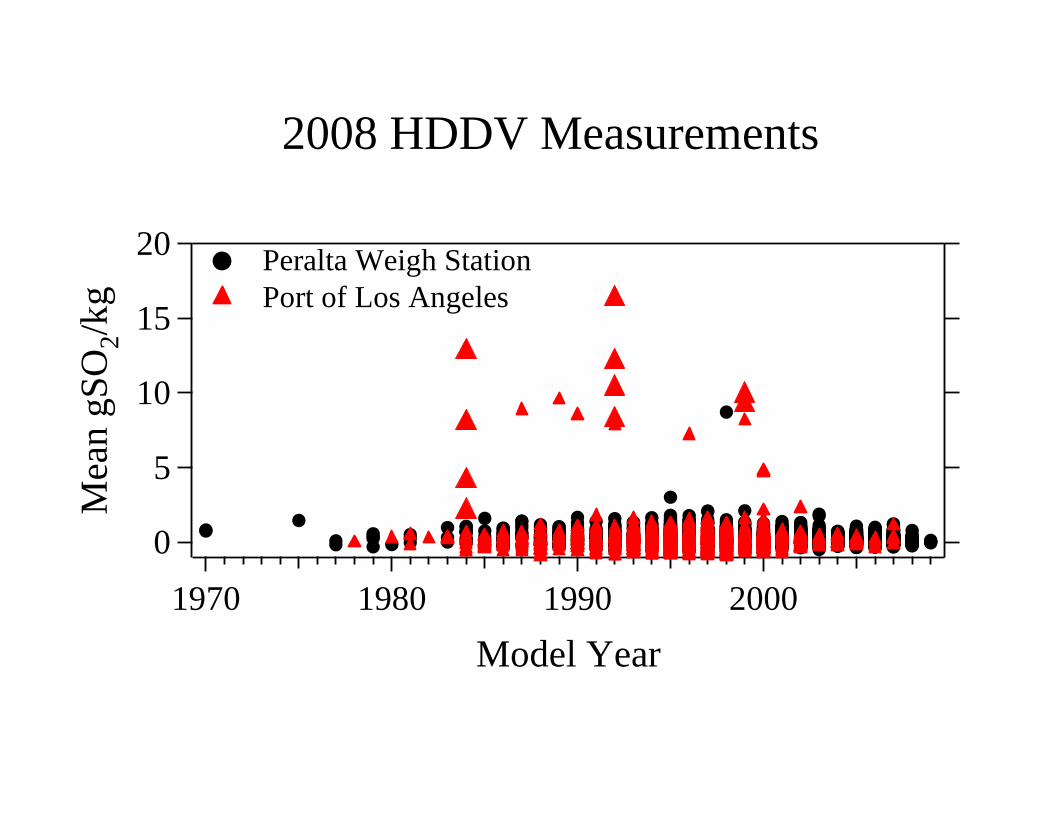
Sulfur Dioxide Emission by Model Year
0.5
0.4
0.3
0.2
0.1
0.0
Mea
n g
SO 2
/kg
2005200019951990
Model Year
San JoseFresnoWest LA
Hydrocarbon Interference
4
2
0
-2
Indi
vidu
al g
SO 2
/kg
120100806040200-20Individual gHC/kg
Fresno
20
15
10
5
0
Mea
n g
SO 2
/kg
2000199019801970
Model Year
Peralta Weigh Station Port of Los Angeles
2008 HDDV Measurements
Nitrogen Dioxide Emissions by Model Year
0.5
0.4
0.3
0.2
0.1
0.0
Mea
n g
NO 2
/kg
2005200019951990
Model Year
San JoseFresnoWest LA
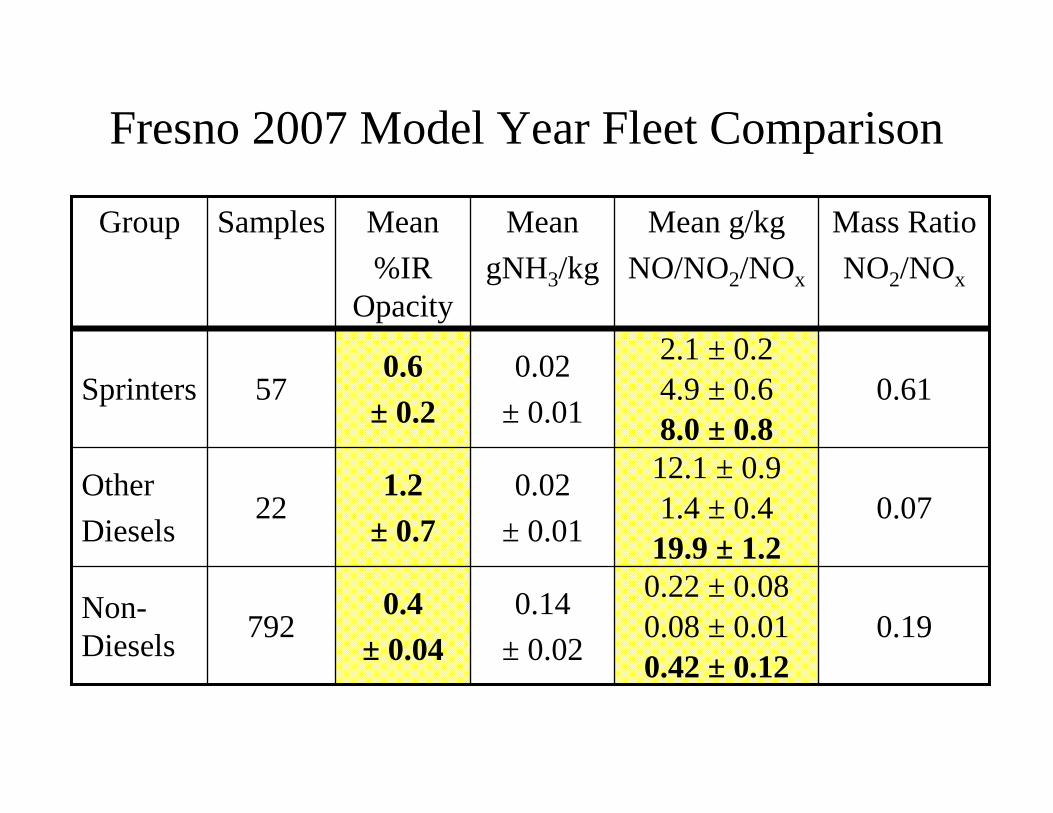
Fresno 2007 Model Year Fleet Comparison
0.190.22 ± 0.080.08 ± 0.010.42 ± 0.12
0.14
± 0.02
0.4± 0.04
792Non-Diesels
0.0712.1 ± 0.91.4 ± 0.419.9 ± 1.2
0.02
± 0.01
1.2± 0.7
22Other
Diesels
0.612.1 ± 0.24.9 ± 0.68.0 ± 0.8
0.02
± 0.01
0.6± 0.2
57Sprinters
Mass Ratio
NO2/NOx
Mean g/kg
NO/NO2/NOx
Mean
gNH3/kg
Mean
%IR Opacity
SamplesGroup
Conclusions• Similar reductions in regulated emissions since 1999
were found at the San Jose and West LA sites.
• New vehicles emit large percentages of their reactive nitrogen as ammonia (up to 80% at the West LA site). Largest ammonia emissions occur in ~15 year old vehicles and is heavily influenced by driving mode.
• Sulfur dioxide emissions show an unexpected model year dependence for older vehicles, likely due to a hydrocarbon interference.
• Nitrogen dioxide emissions are usually less than 5% of the total NOx, except for a group of diesel powered ambulances observed in Fresno.
Instrumentation.Final report to the California Air Resources Board, LMSC/D350962, 1973.
• Chaney, L.W., The remote measurement of traffic generated CO. Journal of the Air Pollution Control Association1983,33, 220-222.
• Bishop, G.A., Starkey, J.R., Ihlenfeldt, A., Williams, W.J., Stedman, D. H., IR long-path photometry, A remote sensing tool for automobile emissions. Anal. Chem.1989,61, 671A-677A.
• Stephens, R. D.; Cadle, S. H., Remote sensing of carbon monoxide emissions. J. Air Waste Manage. Assoc.1991,41, 39-46.
• Guenther, P.L., Stedman, D.H., Bishop, G.A., Bean, J.H., Quine, R.W., A hydrocarbon detector for the remote sensing of vehicle emissions. Rev. Sci. Instrum. 1995,66, 3024-3029.
• Bishop, G.A., Stedman, D.H., Measuring the emissions of passing cars. Acc. Chem. Res.1996,29, 489-495.
References• Bishop, G.A., Stedman, D.H. A decade of on-road emission
• Fujita, E.M., Croes, B.E., Bennett, C.L., Lawson, D.R., Lurmann, F.W., Main, H.H., Comparison of emission inventory and ambient concentration ratios of CO, NMOG, and NOx in California’s South Coast Air Basin. J. Air Waste Manage. Assoc. 1992, 42 264-276.
• Bishop, G.A., Stedman, D.H., Ashgaugh, L., Motor vehicle emissions variability. J. Air Waste Manage. Assoc. 1996, 46, 667-675.
• Parrish, D.D., Critical evaluation of U.S. on-road vehicle emission inventories. Atmos. Environ. 2006, 40, 228-2300.
• Baum, M.M., Kiyomiya, E.S., Kumar, S. Lappas, A.M., Kapinus, V.A., Lord III, H.C. Multicomponent remote sensing of vehicle exhaust by dispersive absorption spectroscopy. 2. Direct on-road ammonia measurements.Environ. Sci. Technol. 2001, 35, 3735 –3741.
• Burgard, D.A., Bishop, G.A., Stedman, D.H. Remote sensing of ammonia and sulfur dioxide from on-road light duty vehicle exhaust emissions.Environ. Sci. Technol. 2006, 40, 7018 – 7022.
• Kean, A.J., Harley, R.A., Littlejohn, D., Kendall, G.R. On-road measurement of ammonia and other motor vehicle exhaust emissions. Environ. Sci. Technol. 2000, 34, 3535 – 3539.
References
• Kean, A.J., Littlejohn, D., Ban-Weiss, G.A., Harley, R.A., Lunden, M.M. Trends in on-road vehicle emissions of ammonia. Environ. Sci. Technol. 2008, 43, 1565 – 1570.
• Huai, T., Durbin, T.D., Miller, J.W., Pisano, J.T., Sauer, C.G., Rhee, S.H., Norbeck, J.M. Investigation of NH3 emissions from new technology vehicles as a function of vehicle operating conditions. Environ. Sci. Technol. 2003, 37, 4841- 4847.
• Huai, T., Durbin, T.D., Younglove, T., Scora, G., Barth, M., Norbeck, J.M. Vehicle specific power approach to estimating on-road NH3 emissions from light-duty vehicles.Environ. Sci. Technol. 2005, 39, 9595-9600.
• MacArthur, R., Mobley, D., Levin, L., Pierce, T., Feldman, H., Moore, T. Koupal, J., Janssen, M., Emission characterization and emission inventories for the 21st century. EM 2009, 36 – 41.