14
PROCEEDINGS OF TECHCON® ASIA PACIFIC 2014 PAGE 245 On-Site Diagnosis of Transformers: Case Studies By Michael Krüger, Stefan Hoek Alan McGuigan, Wenyu Guo,

PROCEEDINGS OF TECHCON® ASIA PACIFIC 2014 PAGE 245
On-Site Diagnosis of Transformers: Case Studies
By
Michael Krüger, Stefan Hoek Alan McGuigan, Wenyu Guo,

PAGE 246 PROCEEDINGS OF TECHCON® ASIA PACIFIC 2014

PROCEEDINGS OF TECHCON® ASIA PACIFIC 2014 PAGE 247
ON-SITE DIAGNOSIS OF TRANSFORMERS: CASE STUDIES
Michael Krüger, Stefan Hoek, OMICRON Austria Alan McGuigan, Wenyu Guo, OMICRON Australia
Abstract With the advancing age of power transformers, a regular check of the operative condition becomes more and more important. Dissolved Gas Analysis (DGA) is a proven and meaningful method such that if increased proportions of H2 and hydrocarbon gases are found in the oil, the fault must be located as soon as possible. In order to find out the reason for high gas rates, further tests have to be performed. Common methods are: winding resistance measurement (static), On-Load Tap Changer (OLTC) test (dynamic resistance test), turns ratio and excitation current measurement, measurement of the leakage reactance and the measurement of capacitances and dielectric losses. Innovative new tools like Dielectric Response Analysis with Polarisation-Depolarisation Current (PDC) and Frequency Response Spectroscopy (FDS), the measurement of the transfer function with the Frequency Response Analysis (FRA), capacitance and dissipation factor measurement at different frequencies and the Partial Discharge (PD) measurement with modern synchronous multi-channel and multi-frequency PD systems enable more detailed diagnostic measurements on transformers. For the assessment of the danger potential of PD in transformers knowledge of the location of the PD faults is essential. A powerful tool for PD location is acoustical measurement with ultrasonic microphones together with UHF triggering. The paper describes all these new methods and illustrates them with practical case studies for the diagnosis and fault finding. Keywords Frequency response analysis (FRA), dielectric response measurement with PDC and FDS, partial discharge (PD) measurement with synchronous multi-channels and multi-frequencies technology, combined synchronous PD measurement with conventional electrical, UHF and acoustic sensors, PD location DIELECTRIC RESPONSE MEASUREMENT Water in oil-paper-insulation goes hand in hand with transformer ageing;it decreases the dielectric withstand strength, accelerates cellulose decomposition and causes the emission of bubbles at high temperatures. ‘State of the art’ for moisture measurements are equilibrium diagrams, where one tries to derive the moisture in the solid insulation (paper, pressboard) from moisture in oil. This method fails for several reasons [1]. To assess the insulation's water content some dielectric diagnostic methods were widely discussed and occasionally used during the last decade. The multilayer insulation of common power transformers consists of oil and paper and therefore shows polarization and conductivity effects. Dielectric diagnostic methods work in a range dominated by interfacial polarization at the borders between cellulose and oil, cellulose conductivity and oil conductivity. Moisture influences these phenomena. Temperature and the insulation construction have a strong impact too [2]. In [3] a comparison of the mentioned methods was analysed. FDS and PDC methods give rather reliable results and reflect also the influence of the temperature and the geometry by using an X-Y model. The results of the PDC measurement can be transformed from the time domain into the frequency domain. Although the results of PDC and FDS methods are comparable and can both be transformed from the time domain into the frequency domain and vice versa, both methods have advantages and disadvantages. If the FDS shall be used down to 100uHz, a measuring time of up to twelve hours is needed for one measurement e.g. the insulation gap between HV and LV winding. If also other

PAGE 248 PROCEEDINGS OF TECHCON® ASIA PACIFIC 2014
insulation gaps e.g. HV winding to tank or LV to TV winding shall be measured, even more time is necessary. The PDC measurement needs much less time but is limited to frequencies up to about 1Hz. A new approach combines both methods [4]. The FDS measurement is replaced by the PDC method in the low frequency range and the results are transformed into the frequency domain, whereas the FDS is used for higher frequencies, which can be done faster. Two input channels for simultaneous measurement of two insulation gaps make it even faster. New model curves for aged oil-pressboard insulation, an outcome of a research project at the University of Stuttgart make the results for aged transformers much more reliable compared to the standard model curves for new oil-pressboard insulation which have been to date.
Onsite measurement on an aged 133 MVA power transformer The transformer was manufactured in 1967, has a rated power of 133 MVA, a transformation ratio of 230 / 115 / 48 kV. The insulation gaps HV to LV, LV to TV (tertiary winding) and TV to tank were measured separately. The higher moisture content in the TV winding insulation agrees well with the service conditions of the transformer: the TV winding was not in use. Cellulose at lower temperatures stores more water in a transformer than warmer cellulose. Thus the dielectric methods allow for an elementary localization of wet areas in the insulation. Contrary to this, the moisture content in cellulose as derived from oil samples gives an average value. The result obtained from the relative saturation in oil as shown by an advanced equilibrium diagram agrees well with the dielectric analysis. However the conventional method of deriving the moisture in cellulose from moisture by weight in oil (ppm) gives too high a result. Ageing of oil and paper makes the application of equilibrium diagrams from literature sources impossible in most cases. This transformer was dried with an online drying system for about one and a half years. After drying the measurements were repeated. The FDS curves (figure 1) are measured from 1kHz down to 100mHz. The dashed parts from the FDS curves below 100mHz are measured in the time domain (figure 2) and then transformed into the frequency domain and shown as tan delta values.
Figure 1 FDS results
Figure 2 PDC results
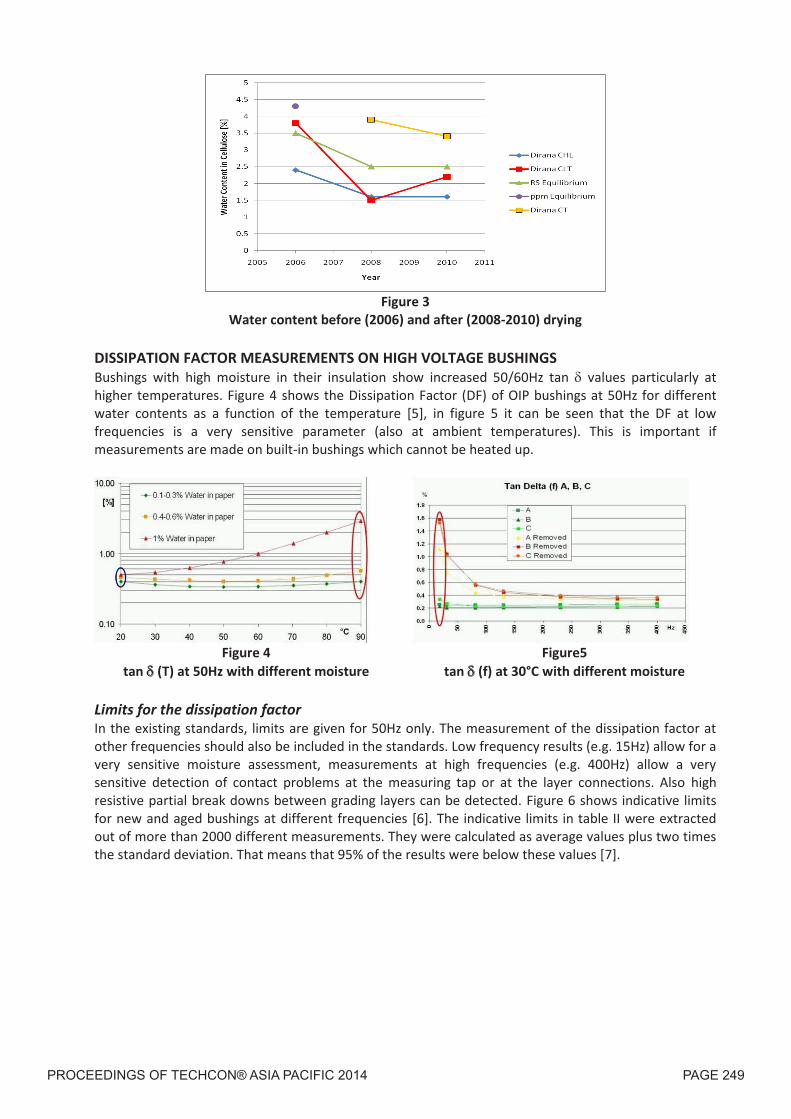
Figure 3 shows the water content in the solid insulation before and after drying. The moisture of the insulation HV to LV was reduced from 2.6% to 1.6%, the moisture of the insulation LV to TV was reduced from 4.3% to 1.5%. The moisture in the insulation from TV to tank is still quite high at 3.3%. To reduce the moisture in the TV winding, the winding should be loaded to the increase its temperature.
PROCEEDINGS OF TECHCON® ASIA PACIFIC 2014 PAGE 249
insulation gaps e.g. HV winding to tank or LV to TV winding shall be measured, even more time is necessary. The PDC measurement needs much less time but is limited to frequencies up to about 1Hz. A new approach combines both methods [4]. The FDS measurement is replaced by the PDC method in the low frequency range and the results are transformed into the frequency domain, whereas the FDS is used for higher frequencies, which can be done faster. Two input channels for simultaneous measurement of two insulation gaps make it even faster. New model curves for aged oil-pressboard insulation, an outcome of a research project at the University of Stuttgart make the results for aged transformers much more reliable compared to the standard model curves for new oil-pressboard insulation which have been to date.
Onsite measurement on an aged 133 MVA power transformer The transformer was manufactured in 1967, has a rated power of 133 MVA, a transformation ratio of 230 / 115 / 48 kV. The insulation gaps HV to LV, LV to TV (tertiary winding) and TV to tank were measured separately. The higher moisture content in the TV winding insulation agrees well with the service conditions of the transformer: the TV winding was not in use. Cellulose at lower temperatures stores more water in a transformer than warmer cellulose. Thus the dielectric methods allow for an elementary localization of wet areas in the insulation. Contrary to this, the moisture content in cellulose as derived from oil samples gives an average value. The result obtained from the relative saturation in oil as shown by an advanced equilibrium diagram agrees well with the dielectric analysis. However the conventional method of deriving the moisture in cellulose from moisture by weight in oil (ppm) gives too high a result. Ageing of oil and paper makes the application of equilibrium diagrams from literature sources impossible in most cases. This transformer was dried with an online drying system for about one and a half years. After drying the measurements were repeated. The FDS curves (figure 1) are measured from 1kHz down to 100mHz. The dashed parts from the FDS curves below 100mHz are measured in the time domain (figure 2) and then transformed into the frequency domain and shown as tan delta values.
Figure 1 FDS results
Figure 2 PDC results
Figure 3 shows the water content in the solid insulation before and after drying. The moisture of the insulation HV to LV was reduced from 2.6% to 1.6%, the moisture of the insulation LV to TV was reduced from 4.3% to 1.5%. The moisture in the insulation from TV to tank is still quite high at 3.3%. To reduce the moisture in the TV winding, the winding should be loaded to the increase its temperature.
Figure 3
Water content before (2006) and after (2008-2010) drying DISSIPATION FACTOR MEASUREMENTS ON HIGH VOLTAGE BUSHINGS Bushings with high moisture in their insulation show increased 50/60Hz tan values particularly at higher temperatures. Figure 4 shows the Dissipation Factor (DF) of OIP bushings at 50Hz for different water contents as a function of the temperature [5], in figure 5 it can be seen that the DF at low frequencies is a very sensitive parameter (also at ambient temperatures). This is important if measurements are made on built-in bushings which cannot be heated up.
Figure 4
tan (T) at 50Hz with different moisture Figure5
tan (f) at 30°C with different moisture Limits for the dissipation factor In the existing standards, limits are given for 50Hz only. The measurement of the dissipation factor at other frequencies should also be included in the standards. Low frequency results (e.g. 15Hz) allow for a very sensitive moisture assessment, measurements at high frequencies (e.g. 400Hz) allow a very sensitive detection of contact problems at the measuring tap or at the layer connections. Also high resistive partial break downs between grading layers can be detected. Figure 6 shows indicative limits for new and aged bushings at different frequencies [6]. The indicative limits in table II were extracted out of more than 2000 different measurements. They were calculated as average values plus two times the standard deviation. That means that 95% of the results were below these values [7].

PAGE 250 PROCEEDINGS OF TECHCON® ASIA PACIFIC 2014
FREQUENCY RESPONSE ANALYSIS (FRA) Sweep Frequency Response Analysis (SFRA) has turned out to be a powerful, non-destructive and sensitive method of evaluating the mechanical integrity of core, windings and clamping structures within power transformers by measuring the electrical transfer functions over a wide frequency range. This is usually done by injecting a low voltage signal of variable frequency into one terminal of a transformer’s winding and measuring the response signal on another terminal. This is performed on all accessible following windings, according to guidelines. The comparison of input and output signals generates a frequency response which can be compared to reference data, to other phases, or to sister transformers (figure 7). The core-and-winding-assembly of power transformers can be seen as a complex electrical network of resistances, self- and mutual inductances, ground capacitances and series capacitances. The frequency response of such a network is unique and, therefore, it can be considered as a fingerprint.
Geometrical changes within and between the elements of the network cause deviations in its frequency response. Differences between an FRA fingerprint and the result of an actual measurement are an indication of positional or electrical variations of the internal components. Different failure modes affect different parts of the frequency range and can usually be discerned from each other. Practical
Figure 6
Indicative limits for bushings [6]
Figure 7
Principle operation of SFRA

PROCEEDINGS OF TECHCON® ASIA PACIFIC 2014 PAGE 251
FREQUENCY RESPONSE ANALYSIS (FRA) Sweep Frequency Response Analysis (SFRA) has turned out to be a powerful, non-destructive and sensitive method of evaluating the mechanical integrity of core, windings and clamping structures within power transformers by measuring the electrical transfer functions over a wide frequency range. This is usually done by injecting a low voltage signal of variable frequency into one terminal of a transformer’s winding and measuring the response signal on another terminal. This is performed on all accessible following windings, according to guidelines. The comparison of input and output signals generates a frequency response which can be compared to reference data, to other phases, or to sister transformers (figure 7). The core-and-winding-assembly of power transformers can be seen as a complex electrical network of resistances, self- and mutual inductances, ground capacitances and series capacitances. The frequency response of such a network is unique and, therefore, it can be considered as a fingerprint.
Geometrical changes within and between the elements of the network cause deviations in its frequency response. Differences between an FRA fingerprint and the result of an actual measurement are an indication of positional or electrical variations of the internal components. Different failure modes affect different parts of the frequency range and can usually be discerned from each other. Practical
Figure 6
Indicative limits for bushings [6]
Figure 7
Principle operation of SFRA
experiences as well as scientific investigations show that currently no other diagnostic test method can deliver such a wide range of reliable information about the mechanical status of a transformer's active part. A transformer for 115kV was switched off by the differential relay after a ground fault in a substation. The FRA result is shown in figure 8. It can be clearly seen that there is a systematic shift of several resonances of phase B to lower frequencies. This is a typical sign for a deformation of the winding. This kind of deformation is called "Buckling". The deformation of the low voltage can be seen in figure 9.
Figure 8 Damaged LV winding
Figure 9 Damaged LV winding
PARTIAL DISCHARGE MEASUREMENT Partial Discharge (PD) measurement is a tool accepted worldwide for quality control of high voltage apparatus. Outside screened laboratories PD signals are very often superposed by noise pulses, a fact that makes a PD data analysis more difficult for both human experts and software expert systems. Therefore the handling of disturbances is one of the main tasks when measuring PD. PD measurements are often conducted under noisy conditions. The PD signal is superposed by stochastic noise pulses or even multiple PD sources, which will lead to a complex phase-resolved PD pattern that is not easy to analyse.
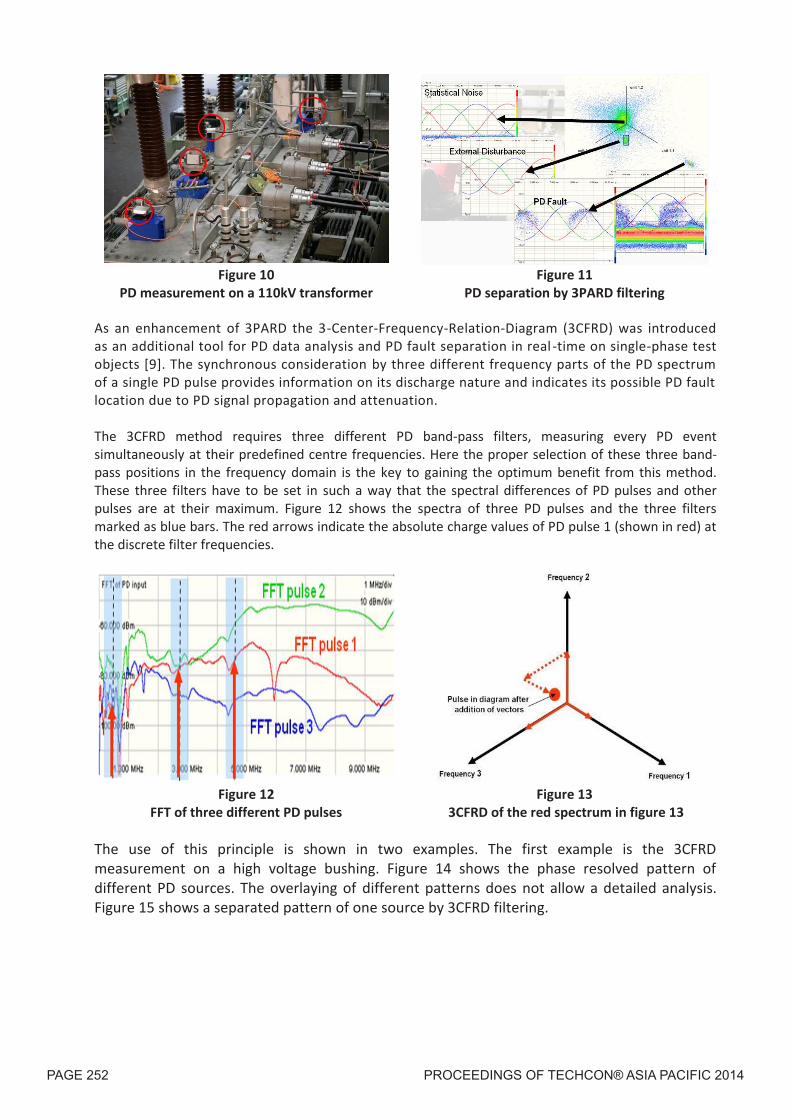
Modern methods of data evaluation A new field of evaluation methods is opened by fully synchronous multi -channel PD acquisition in order to gain more reliable measuring results combined with effective noise suppression. A technical overview of the system is given in [8]. Being able to perform synchronous multi-channel PD measurements, the 3-Phase-Amplitude-Relation-Diagram (3PARD) was introduced as a new powerful analysis tool to distinguish between different PD sources and noise pulses when measuring 3-phase high voltage equipment such as power transformers, rotating machines and cable systems [8]. PD measurement on a repaired transformer It can be seen in figures 10 and 11 that the three different clusters in the 3PARD diagram are generated by three different PD sources: statistical noise, pulse disturbances and inner partial discharges.
PAGE 252 PROCEEDINGS OF TECHCON® ASIA PACIFIC 2014
Figure 10
PD measurement on a 110kV transformer Figure 11
PD separation by 3PARD filtering As an enhancement of 3PARD the 3-Center-Frequency-Relation-Diagram (3CFRD) was introduced as an additional tool for PD data analysis and PD fault separation in real -time on single-phase test objects [9]. The synchronous consideration by three different frequency parts of the PD spectrum of a single PD pulse provides information on its discharge nature and indicates its possible PD fault location due to PD signal propagation and attenuation. The 3CFRD method requires three different PD band-pass filters, measuring every PD event simultaneously at their predefined centre frequencies. Here the proper selection of these three band-pass positions in the frequency domain is the key to gaining the optimum benefit from this method. These three filters have to be set in such a way that the spectral differences of PD pulses and other pulses are at their maximum. Figure 12 shows the spectra of three PD pulses and the three filters marked as blue bars. The red arrows indicate the absolute charge values of PD pulse 1 (shown in red) at the discrete filter frequencies.
Figure 12
FFT of three different PD pulses Figure 13
3CFRD of the red spectrum in figure 13 The use of this principle is shown in two examples. The first example is the 3CFRD measurement on a high voltage bushing. Figure 14 shows the phase resolved pattern of different PD sources. The overlaying of different patterns does not allow a detailed analysis. Figure 15 shows a separated pattern of one source by 3CFRD filtering.

PROCEEDINGS OF TECHCON® ASIA PACIFIC 2014 PAGE 253
Figure 10
PD measurement on a 110kV transformer Figure 11
PD separation by 3PARD filtering As an enhancement of 3PARD the 3-Center-Frequency-Relation-Diagram (3CFRD) was introduced as an additional tool for PD data analysis and PD fault separation in real -time on single-phase test objects [9]. The synchronous consideration by three different frequency parts of the PD spectrum of a single PD pulse provides information on its discharge nature and indicates its possible PD fault location due to PD signal propagation and attenuation. The 3CFRD method requires three different PD band-pass filters, measuring every PD event simultaneously at their predefined centre frequencies. Here the proper selection of these three band-pass positions in the frequency domain is the key to gaining the optimum benefit from this method. These three filters have to be set in such a way that the spectral differences of PD pulses and other pulses are at their maximum. Figure 12 shows the spectra of three PD pulses and the three filters marked as blue bars. The red arrows indicate the absolute charge values of PD pulse 1 (shown in red) at the discrete filter frequencies.
Figure 12
FFT of three different PD pulses Figure 13
3CFRD of the red spectrum in figure 13 The use of this principle is shown in two examples. The first example is the 3CFRD measurement on a high voltage bushing. Figure 14 shows the phase resolved pattern of different PD sources. The overlaying of different patterns does not allow a detailed analysis. Figure 15 shows a separated pattern of one source by 3CFRD filtering.
Figure 14 PRPD pattern without 3CFRD filtering
Figure 15 PRPD of one PD source with 3CFRD filtering
A second example for 3CFRD filtering is a measurement on a transformer. Figure 16 shows the PRPD at app. 40kV. The noise is about 10pC.
Figure 16
PRPD of one PD source without 3CFRD filtering Figure 17
3CFRD of the measurement in figure 16 An analysis with the 3CFRD is shown in figure 17. The filtered signal (figure 18) shows a clear pattern of internal void discharges with 5pC. Without this filtering these discharges cannot be seen, because they are below the noise level.
Figure 18
PD pattern of voids with 3CFRD filtering
PAGE 254 PROCEEDINGS OF TECHCON® ASIA PACIFIC 2014
ACOUSTICAL PD MEASUREMENT AND LOCATION The main benefits of acoustic PD measurement are the possibility of localizing the PD source to an accuracy of some centimetres. In the case of evidence for PD, the location of the potential PD source can be important to estimate the risk of a complete failure. The knowledge of PD location is also crucial for the assessment of the asset and the process of maintenance or repair. The acoustical signals are detected by several ultrasonic sensors on the tank wall of the transformer. The low level of electrical interference from outside the measurement setup constitutes one of the strengths of this method. The acoustic response of PD inside a transformer is typically measured by piezoelectric sensors in the frequency range of some tens of kHz up to some hundreds of kHz. Due to the resonant character of the sensors, the measured acoustic PD signal is inherently overlaid by oscillations as illustrated in Figure 19. For that reason the determination of the frequency content and proper signal form is difficult. Using the difference in arrival time of the acoustic PD signal at multiple sensors, algorithms compute the location of the PD source. The complex physical processes involved in sound propagation and the large structural differences between different transformers may be challenging during the measurement. The following parameters have to be considered:
The PD source position and the inner structure of the transformer mainly influence the propagation path.
More than one propagation path from source to the sensor is possible (direct oil, reflection, steel path).
The speed of sound depends on the propagation path (crossed medium), the frequency and temperature.
Depending on the position of the source and the inner structure of the transformer, direct oil path’s propagation may prevent a proper measurement by attenuating the signal too much.
The individual consideration of the measurement setup and the inner structure of the transformer are necessary, and a cautious interpretation of the measurement results by experienced persons is essential.
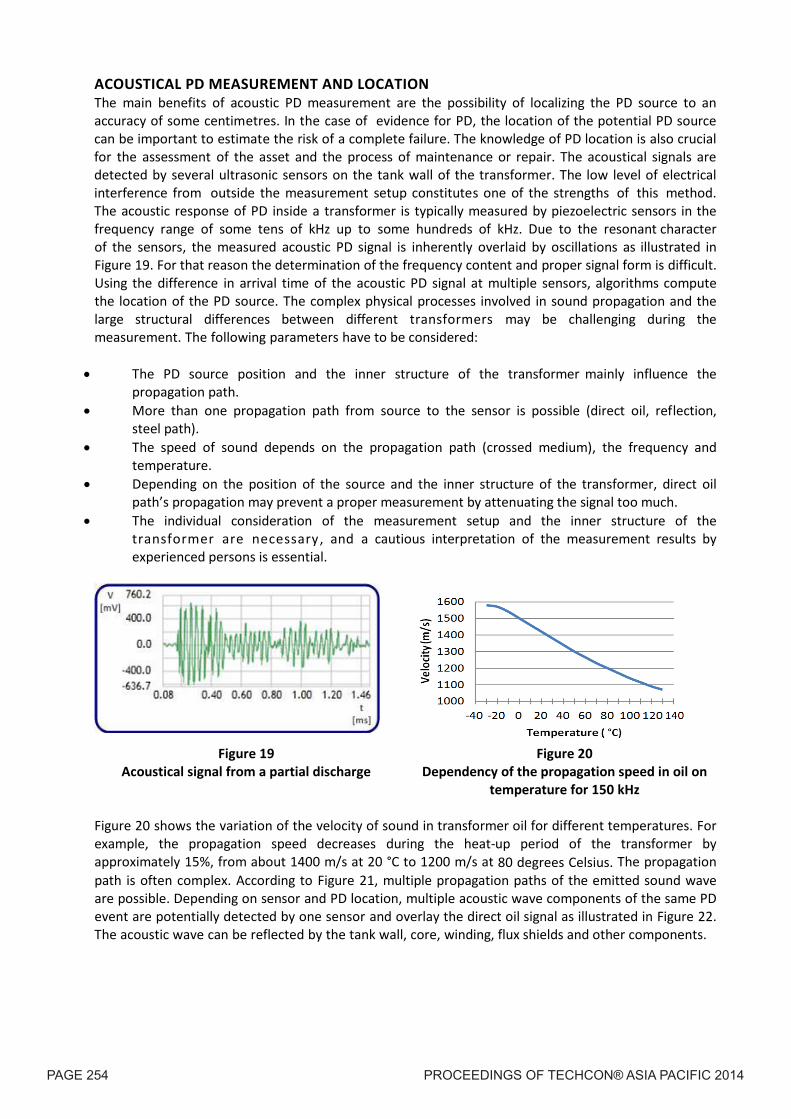
Figure 19 Acoustical signal from a partial discharge
Figure 20 Dependency of the propagation speed in oil on
temperature for 150 kHz Figure 20 shows the variation of the velocity of sound in transformer oil for different temperatures. For example, the propagation speed decreases during the heat-up period of the transformer by approximately 15%, from about 1400 m/s at 20 °C to 1200 m/s at 80 degrees Celsius. The propagation path is often complex. According to Figure 21, multiple propagation paths of the emitted sound wave are possible. Depending on sensor and PD location, multiple acoustic wave components of the same PD event are potentially detected by one sensor and overlay the direct oil signal as illustrated in Figure 22. The acoustic wave can be reflected by the tank wall, core, winding, flux shields and other components.
PROCEEDINGS OF TECHCON® ASIA PACIFIC 2014 PAGE 255
ACOUSTICAL PD MEASUREMENT AND LOCATION The main benefits of acoustic PD measurement are the possibility of localizing the PD source to an accuracy of some centimetres. In the case of evidence for PD, the location of the potential PD source can be important to estimate the risk of a complete failure. The knowledge of PD location is also crucial for the assessment of the asset and the process of maintenance or repair. The acoustical signals are detected by several ultrasonic sensors on the tank wall of the transformer. The low level of electrical interference from outside the measurement setup constitutes one of the strengths of this method. The acoustic response of PD inside a transformer is typically measured by piezoelectric sensors in the frequency range of some tens of kHz up to some hundreds of kHz. Due to the resonant character of the sensors, the measured acoustic PD signal is inherently overlaid by oscillations as illustrated in Figure 19. For that reason the determination of the frequency content and proper signal form is difficult. Using the difference in arrival time of the acoustic PD signal at multiple sensors, algorithms compute the location of the PD source. The complex physical processes involved in sound propagation and the large structural differences between different transformers may be challenging during the measurement. The following parameters have to be considered:
The PD source position and the inner structure of the transformer mainly influence the propagation path.
More than one propagation path from source to the sensor is possible (direct oil, reflection, steel path).
The speed of sound depends on the propagation path (crossed medium), the frequency and temperature.
Depending on the position of the source and the inner structure of the transformer, direct oil path’s propagation may prevent a proper measurement by attenuating the signal too much.
The individual consideration of the measurement setup and the inner structure of the transformer are necessary, and a cautious interpretation of the measurement results by experienced persons is essential.
Figure 19 Acoustical signal from a partial discharge
Figure 20 Dependency of the propagation speed in oil on
temperature for 150 kHz Figure 20 shows the variation of the velocity of sound in transformer oil for different temperatures. For example, the propagation speed decreases during the heat-up period of the transformer by approximately 15%, from about 1400 m/s at 20 °C to 1200 m/s at 80 degrees Celsius. The propagation path is often complex. According to Figure 21, multiple propagation paths of the emitted sound wave are possible. Depending on sensor and PD location, multiple acoustic wave components of the same PD event are potentially detected by one sensor and overlay the direct oil signal as illustrated in Figure 22. The acoustic wave can be reflected by the tank wall, core, winding, flux shields and other components.
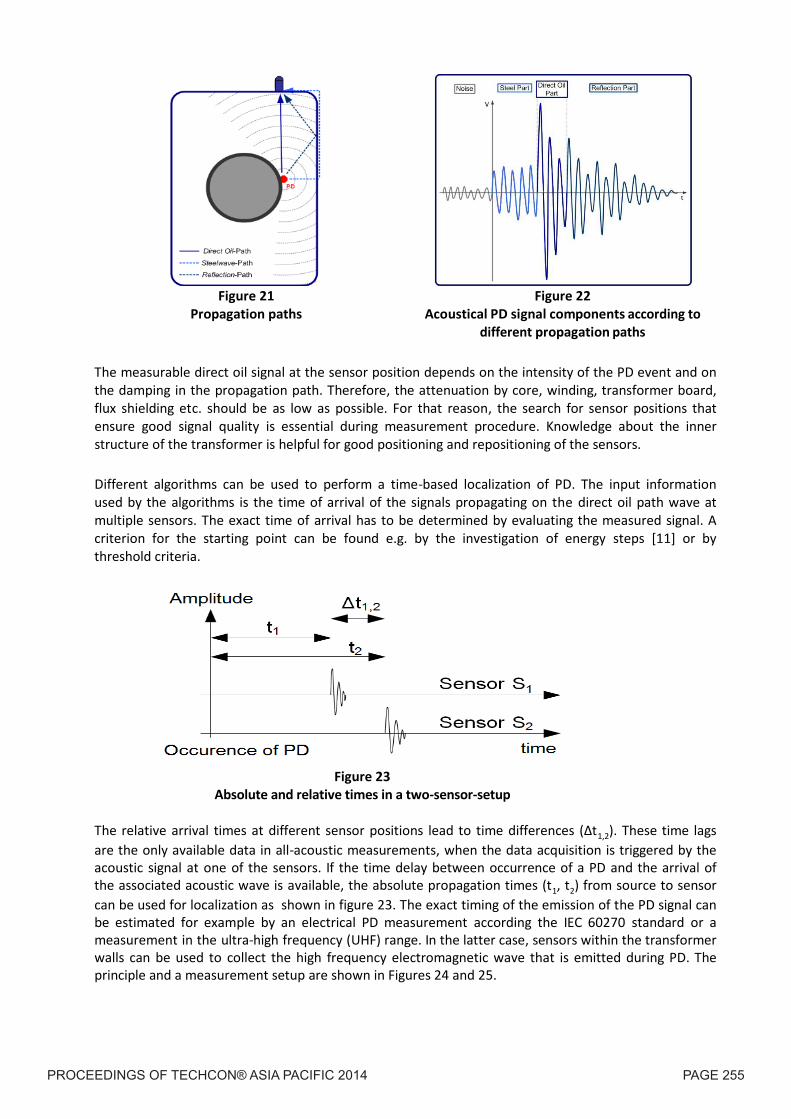
Figure 21
Propagation paths
Figure 22 Acoustical PD signal components according to
different propagation paths The measurable direct oil signal at the sensor position depends on the intensity of the PD event and on the damping in the propagation path. Therefore, the attenuation by core, winding, transformer board, flux shielding etc. should be as low as possible. For that reason, the search for sensor positions that ensure good signal quality is essential during measurement procedure. Knowledge about the inner structure of the transformer is helpful for good positioning and repositioning of the sensors. Different algorithms can be used to perform a time-based localization of PD. The input information used by the algorithms is the time of arrival of the signals propagating on the direct oil path wave at multiple sensors. The exact time of arrival has to be determined by evaluating the measured signal. A criterion for the starting point can be found e.g. by the investigation of energy steps [11] or by threshold criteria. The relative arrival times at different sensor positions lead to time differences (Δt1,2). These time lags are the only available data in all-acoustic measurements, when the data acquisition is triggered by the acoustic signal at one of the sensors. If the time delay between occurrence of a PD and the arrival of the associated acoustic wave is available, the absolute propagation times (t1, t2) from source to sensor can be used for localization as shown in figure 23. The exact timing of the emission of the PD signal can be estimated for example by an electrical PD measurement according the IEC 60270 standard or a measurement in the ultra-high frequency (UHF) range. In the latter case, sensors within the transformer walls can be used to collect the high frequency electromagnetic wave that is emitted during PD. The principle and a measurement setup are shown in Figures 24 and 25.
Figure 23
Absolute and relative times in a two-sensor-setup

PAGE 256 PROCEEDINGS OF TECHCON® ASIA PACIFIC 2014
Figure 24
UHF sensor setup for triggering Figure25
UHF sensor mounted on the main drain valve The distance between sensor and source is calculated using the available absolute or relative propagation times and an assumptive average propagation speed. With the determined distances and the sensor positions a geometrical localization of the PD source can be performed in several steps. Another advantage of the UHF triggering is the possibility of using an average out of many equally triggered signals to reduce the randomly occurring noise.
Figure 26
Piezoelectric sensors on the tank wall
PROCEEDINGS OF TECHCON® ASIA PACIFIC 2014 PAGE 257
Figure 24
UHF sensor setup for triggering Figure25
UHF sensor mounted on the main drain valve The distance between sensor and source is calculated using the available absolute or relative propagation times and an assumptive average propagation speed. With the determined distances and the sensor positions a geometrical localization of the PD source can be performed in several steps. Another advantage of the UHF triggering is the possibility of using an average out of many equally triggered signals to reduce the randomly occurring noise.
Figure 26
Piezoelectric sensors on the tank wall
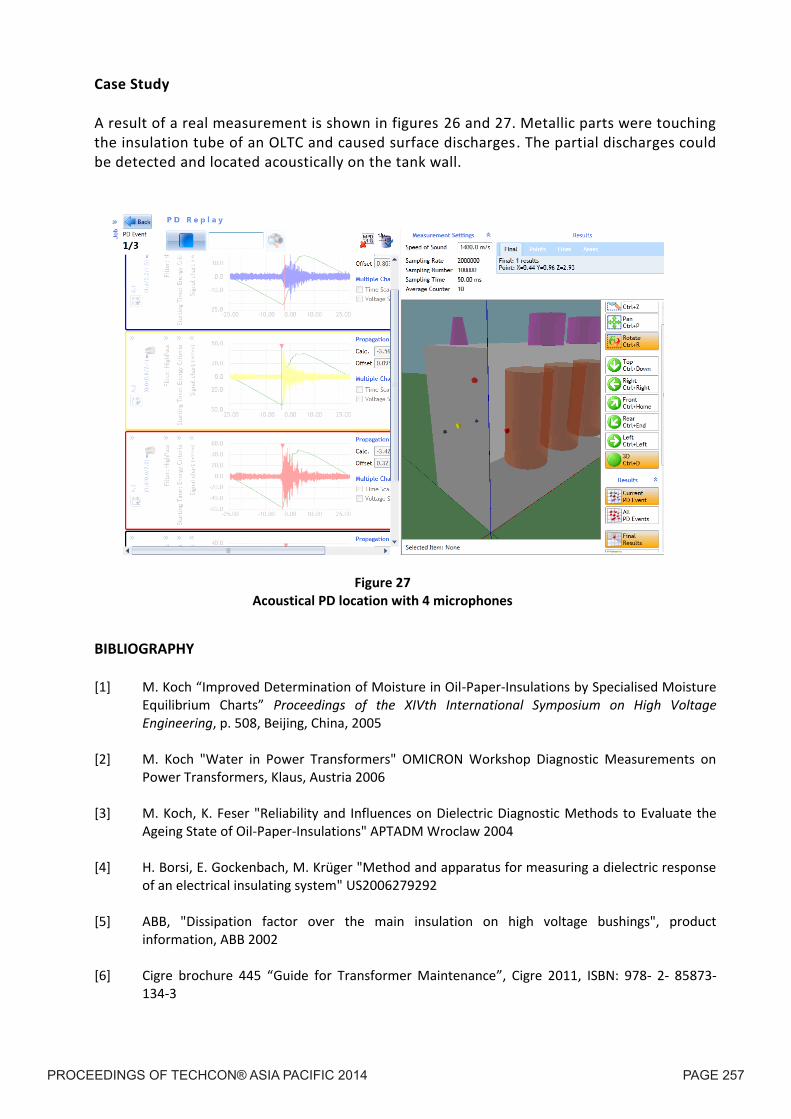
Case Study A result of a real measurement is shown in figures 26 and 27. Metallic parts were touching the insulation tube of an OLTC and caused surface discharges. The partial discharges could be detected and located acoustically on the tank wall.
BIBLIOGRAPHY [1] M. Koch “Improved Determination of Moisture in Oil-Paper-Insulations by Specialised Moisture
Equilibrium Charts” Proceedings of the XIVth International Symposium on High Voltage Engineering, p. 508, Beijing, China, 2005
[2] M. Koch "Water in Power Transformers" OMICRON Workshop Diagnostic Measurements on
Power Transformers, Klaus, Austria 2006 [3] M. Koch, K. Feser "Reliability and Influences on Dielectric Diagnostic Methods to Evaluate the
Ageing State of Oil-Paper-Insulations" APTADM Wroclaw 2004 [4] H. Borsi, E. Gockenbach, M. Krüger "Method and apparatus for measuring a dielectric response
of an electrical insulating system" US2006279292 [5] ABB, "Dissipation factor over the main insulation on high voltage bushings", product
information, ABB 2002 [6] Cigre brochure 445 “Guide for Transformer Maintenance”, Cigre 2011, ISBN: 978- 2- 85873-
134-3
Figure 27
Acoustical PD location with 4 microphones
PAGE 258 PROCEEDINGS OF TECHCON® ASIA PACIFIC 2014
[7] M.Krüger, A. Kraetge, M. Koch, K. Rethmeier et al. „New Diagnostic Tools for High Voltage
Bushings“, Cigre VI Workspot, Foz do Iguacu, April 2010 [8] K. Rethmeier, M. Krüger, A. Kraetge, R. Plath, W. Koltunowicz, A. Obralic, W. Kalkner,
“Experiences in On-site Partial Discharge Measurements and Prospects for PD Monitoring”, CMD Beijing 2008
[9] K. Rethmeier, A. Obralic, A. Kraetge, M. Krüger, W. Kalkner , R. Plath. "Improved Noise
Suppression by real-time pulse-waveform analysis of PD pulses and pulse-shaped disturbances", International Symposium on High Voltage on High Voltage Engineering (ISH), Cape Town, August 2009
[10] S. Hoek, R. Hummel et al. “Localizing partial discharge in power transformers by combining
acoustic and different electrical methods”, Conference Record of the 2012 IEEE International Symposium on Electrical Insulation (ISEI), San Juan, Puerto Rico, USA
[11] C. U, Große, H.-W. Reinhard, Schallemissionsquellen automatisch lokalisieren“ MP
Materialprüfung, Jahrg. 41, pp.342, Carl Hanser Verlag, München, Germany 1999
Biography Michael Krüger is Principal Engineer for Primary Testing with OMICRON Energy in Klaus, Austria. He studied electrical engineering at the University of Aachen (RWTH) and the University of Kaiserslautern (Germany) and graduated in 1976 (Dipl.-Ing.). In 1990 he received a PHD from the Technical University of Vienna. Michael Krüger has more than 35 year’s experience in high voltage engineering and insulation diagnosis. He has published many papers about electrical measurement on high voltage equipment, especially on power transformers and holds more than 15 patents. He is member of VDE, Cigre and IEEE and works in several working groups of OEVE, IEC and Cigre.


