On synchronization of heavy truck transmissions
Licentiate thesis
Department of Machine Design
KTH Royal Institute of Technology
SE-100 44 Stockholm
Daniel Häggström
KTH Industrial Engineering
and Management
TRITA – MMK 2016:02
ISSN 1400-1179
ISRN/KTH/MMK/R-16/02-SE
ISBN 978-91-7595-851-4
TRITA – MMK 2016:02
ISSN 1400-1179
ISRN/KTH/MMK/R-16/02-SE
ISBN 978-91-7595-851-4
On synchronization of heavy truck transmissions
Daniel Häggström
Licentiate thesis
Academic thesis, which with the approval of KTH Royal Institute of Technology, will be
presented for public review in fulfilment of the requirements for a Licentiate of Engineering
in Machine Design. The public review is held at Kungliga Tekniska Högskolan, room
”Gladan”, Brinellvägen 85, Stockholm on March 8, 2016 at 10:00.
Print: Universitetsservice US AB
iii
Department of Machine Design
KTH Royal Institute of
Technology
S-100 44 Stockholm
SWEDEN
TRITA - MMK 2016:02
ISSN 1400 -1179
ISRN/KTH/MMK/R-16/02-SE
ISBN 978-91-7595-851-4
Document type
Thesis
Date
2016-03-08
Author
Daniel Häggström
Supervisor(s)
Ulf Sellgren, Stefan Björklund Sponsor(s)
Scania CV AB
Volvo Group Trucks Technology
VINNOVA
Title
On synchronization of heavy truck transmissions
Abstract
Gear shifts are becoming more and more important as engines are adapted to low speed high
torque working conditions. Synchronizers are key components for successful gear shifts. To
adapt the synchronizers to new working conditions due to adaptations to new engines,
improved development tools are needed. The presented thesis describes the development of
two types of numerical models for the synchronization process, namely fluid-structure
interaction to simulate the pre-synchronization phase and thermomechanical FE models to
simulate the main synchronization phase. A methodology for developing friction models
based on a combination of physical testing and numerical simulations is presented.
Additionally, a comprehensive gear shift and synchronizer frame of reference section is
presented.
In paper A, two numerical fluid-structure interaction simulation models for assessing the pre-
synchronization phase are presented. Simulations show that the synchronizer functionality is
highly dependent on the gear shift maneuvering system, and that grooves in the synchronizer
surface have a positive effect on the oil evacuation during the pre-synchronization phase.
Paper B describes the development of a numerical thermomechanical model for simulating
the main synchronization phase. Two parameter studies were performed, one based on
external loads and one based on synchronizer geometry. The effect on the temperature
increase from differences in thermal properties between molybdenum and carbon friction
linings are presented.
In paper C, a verification and validation methodology for highly transient thermomechanical
processes was presented. Numerical verification, bulk temperature measurement, surface
temperature measurement and qualitative visual inspection were combined to verify and
validate the simulation model presented in paper B.
In paper D, a methodology combining physical testing with an thermomechanical simulation
model to develop a friction model was exemplified by a molybdenum coated synchronizer.
A simplified thermal model was developed to remove the dependence of full finite element
thermal models. The friction models shows good agreement with measured data.
Keywords
synchronization, synchronizers, gear shift, gearbox
Language
English
iv
SAMMANFATTNING
Betydelsen av växlingar i en växellåda har ökat, och synkroniseringsenheter är viktiga
komponenter för snabba och robusta växlingar. För att anpassa synkroniseringsenheterna till
nya arbetsförhållanden och laster krävs nya utvecklingsverktyg. Denna avhandling innehåller
två typer av numeriska modeller för att simulera synkroniseringsförloppet. Multifysikmodeller
som kopplar samman oljeflöde och solida kroppar används för att simulera
försynkroniseringsfasen. En termomekanisk modell används för att simulera
synkroniseringsfasen. En metod för att utveckla friktionsmodeller under synkroniseringsfasen
genom att kombinera fysisk provning med numerisk simulering presenteras. Dessutom finns
ett utförligt kapitel om synkroniserings- och växlingsteori.
I artikel A presenteras två olika ”Fluid-Structure interaction” (”Interaktion mellan vätskeflöde
och solida kroppar”) för att simulera försynkroniseringsfasen. Simuleringarna visar att
synkroniseringsenheter är väldigt beroende av de aktuatorer de är kopplade till, samt att
oljedräneringsspår i kontaktytan har en positiv effekt för försynkroniseringsförloppet.
Artikel B beskriver utvecklingen av en termomekanisk modell för att simulera
synkroniseringsförloppet. Två parameterstudier utfördes, en där de externa lasterna utvärderas,
och en där geometrin på synkroniseringsenheten utvärderas. Effekten av skillnaden i termiska
egenskaper hos molybden och kolfiber utvärderas också.
Artikel C beskriver metodik för verifiering och validering av termomekaniska simuleringar av
starkt transienta förlopp. En kombination av numerisk verifiering, temperaturmätning i
materialet, yttemperaturmätning samt kvalitativ visuell bedömning används för att verifiera
och validera simuleringsmodellen som utvecklades i artikel B.
I artikel D beskrivs en metodik för att kombinera fysiska prover med en uppdaterad
termomekanisk simuleringsmodell för att beskriva friktionsbeteendet under synkronisering.
Metoden exemplifieras med en molybdenbelagd synkroniseringsenhet. En förenklad termisk
modell utvecklas för att kunna beskriva friktionsbeteendet utan att använda tidskrävande finita
elementmodeller. Den nya friktionsmodellen överensstämmer väl med uppmätt data.
Nyckelord: synkronisering, växling, växellåda
v
PREFACE
The research presented in this thesis was carried out between January 2014 and November
2015 at Scania transmission development in Södertälje, Sweden and the Department of
Machine Design, KTH Royal institute of Technology in Stockholm, Sweden. I would like to
thank Scania CV AB, Volvo Group Trucks Technology and VINNOVA (project No. 2112-
04619) for financing this work.
A special thanks to my supervisors Ulf Sellgren and Stefan Björklund. I am grateful for their
support and for all our productive discussions. Their guidance has been crucial for this work.
Thank you Kenth Hellström, project manager for this project as well as my manager at Scania,
who has undeniably played a big role in making this project happen and keeping it running
smoothly and timely.
Thanks to the project team in Gothenburg, Irfan Muhammad, Viktor Berbyuk and Håkan
Johansson at Chalmers University of Technology and Magnus Andersson at Volvo Group
Trucks Technology. I’m certain our joint cooperation will make this project go even further.
Thanks to my co-authors Wiktor Stenström and Pär Nyman, as well as Karl Vestgöte, who
performed the physical test in our µ-comp rig. Thank you Niklas Melin, Scania CV AB, for all
help related to my simulations. Thanks to Anders Hedman at Volvo Group Trucks Technology
and Peer Norberg, Gustav Göransson and Mårten Dahlbäck at Scania CV AB as well as my
brothers Johan and Martin for reviewing my.
Thank you colleagues, both at Scania and KTH, for making the work interesting and fun, and
for teaching me new things all the time.
Last, but not least, thanks to my fiancé Tova for your support during what at times is long work
hours, and to our baby girl Wilma for always being happy and pulling my hair laughing every
time I get home from work.
Stockholm, March 2016
Daniel Häggström
vi
CONTENTS
1 INTRODUCTION ........................................................................................ 1
1.1 OBJECTIVE .................................................................................................................. 1 1.2 RESEARCH QUESTIONS ................................................................................................ 2 1.3 THESIS OUTLINE .......................................................................................................... 2 1.4 SWEDISH TRANSMISSION CLUSTER .............................................................................. 3
2 FRAME OF REFERENCE ......................................................................... 4
2.1 VIRTUAL PRODUCT DEVELOPMENT ............................................................................. 4
2.2 LUBRICATION REGIMES ............................................................................................... 5 2.3 GEAR SHIFT IN HEAVY TRUCK TRANSMISSIONS ........................................................... 6 2.4 SYNCHRONIZER TECHNOLOGY .................................................................................... 7
2.4.1 Different phases of synchronization....................................................................... 8
2.4.2 Preventing unsynchronized gear engagement ..................................................... 10 2.4.3 Pre-synchronization phase................................................................................... 11 2.4.4 Main synchronization phase ................................................................................ 12
2.4.5 Synchronizer failure modes.................................................................................. 13 2.4.6 Synchronizer testing ............................................................................................. 15
2.5 MANEUVERING SYSTEM ............................................................................................ 16 2.6 OTHER MEANS TO SYNCHRONIZE A GEARBOX ........................................................... 17
3 RESEARCH METHODOLOGY ............................................................. 18
3.1 FLUID-STRUCTURE INTERACTION MODEL TO SIMULATE PRE-SYNCHRONIZATION ...... 18 3.2 THERMOMECHANICAL MODEL TO SIMULATE MAIN SYNCHRONIZATION .................... 19
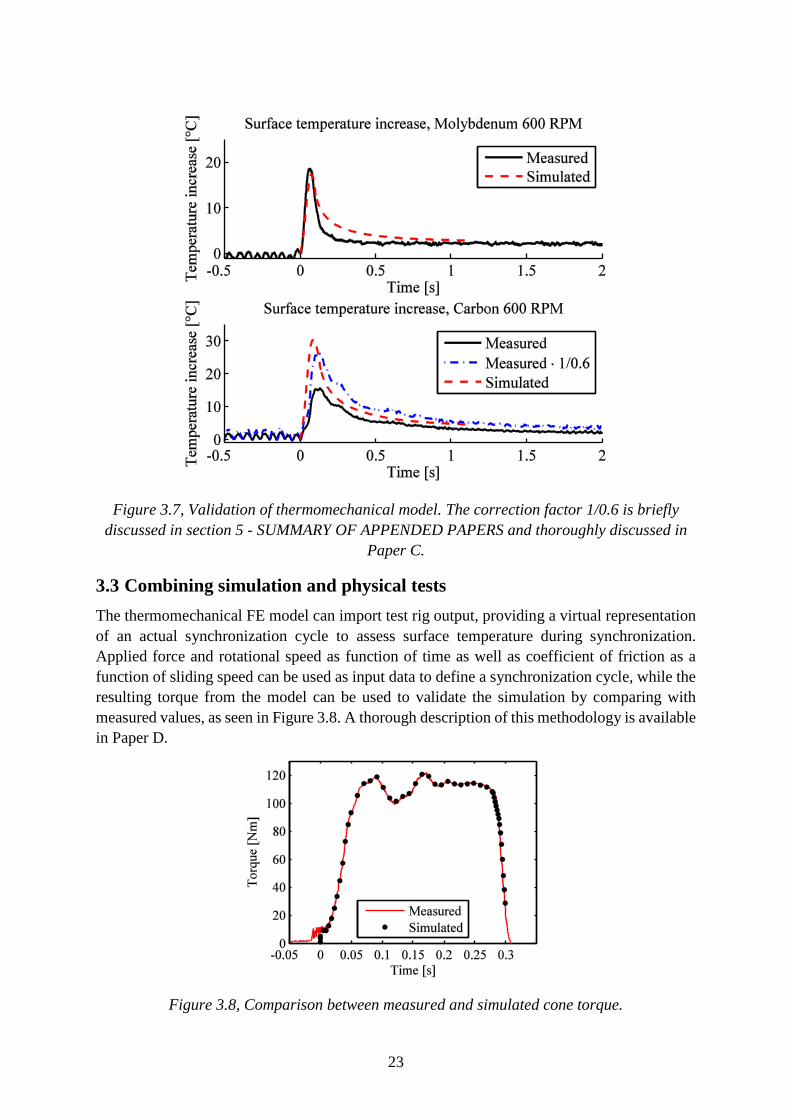
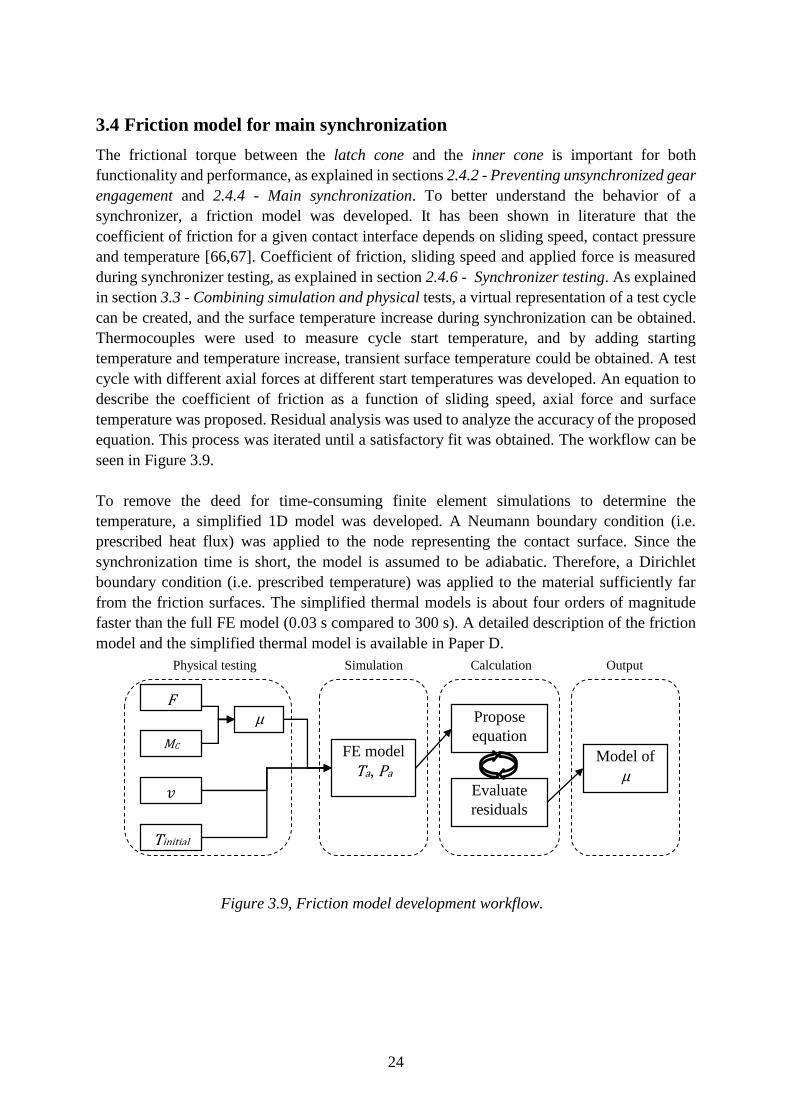
3.3 COMBINING SIMULATION AND PHYSICAL TESTS ........................................................ 23 3.4 FRICTION MODEL FOR MAIN SYNCHRONIZATION ....................................................... 24
4 RESULTS .................................................................................................... 25
4.1 PRE-SYNCHRONIZATION SIMULATION ....................................................................... 25
4.2 MAIN SYNCHRONIZATION SIMULATION ..................................................................... 26
4.3 FRICTION MODEL FOR MAIN SYNCHRONIZATION ....................................................... 27
5 SUMMARY OF APPENDED PAPERS .................................................. 30
6 DISCUSSION, CONCLUSIONS AND FUTURE WORK .................... 32
6.1 ANSWERS TO RESEARCH QUESTIONS ......................................................................... 32
6.2 HOW CAN THE PRESENTED THESIS BE USED ............................................................... 33 6.3 FUTURE WORK .......................................................................................................... 33 6.4 CONCLUSIONS ........................................................................................................... 34
7 REFERENCES ........................................................................................... 35
vii
LIST OF APPENDED PAPERS
This thesis consists of a summary and the following four papers:
Paper A
Daniel Häggström, Ulf Sellgren, Stefan Björklund. “Robust pre-synchronization in
heavy truck transmissions”. Presented at International Gear Conference, August 26-28
2014, Lyon, France.
The author performed the simulations and the data evaluation. The author did most of
the paper writing.
Paper B
Daniel Häggström, Wiktor Stenström, Ulf Sellgren, Stefan Björklund. “Parameter
study of the thermomechanical performance of heavy duty synchronizers”. Presented
at 15th International VDI Congress – Drivetrain for Commercial Vehicles 2015, June
16-17, Friedrichshafen, Germany.
The author performed the simulations and most of the data evaluation. The author did
most of the paper writing.
Paper C
Daniel Häggström, Wiktor Stenström, Ulf Sellgren, Stefan Björklund. “A verified and
validated model for simulation-driven design of heavy duty truck synchronizers”.
Presented at ASME 2015 Power Transmission and Gearing Conference, August 2-5
2015, Boston, USA.
The author performed the simulations and the data evaluation. The author planned and
contributed to the experimental work. The author did most of the paper writing.
Paper D
Daniel Häggström, Pär Nyman, Ulf Sellgren, Stefan Björklund. “Predicting friction in
synchronizer systems”. Article in press. Tribology International.
http://dx.doi.org/10.1016/j.triboint.2015.12.038
The author performed the simulations and contributed to the data evaluation. The author
contributed the experimental work. The author did most of the paper writing.
viii
ABBREVIATIONS AND ALTERNATIVE PART NAMING
AMT: Automated manual transmission
BL: Boundary lubrication
CAD: Computer-aided design
CFD: Computational fluid dynamics
CH: Crawler high / Crawler gear high split
CL: Crawler low / Crawler gear low split
CO2: Carbon dioxide
DCT: Dual clutch transmission
FE: Finite element
FEA: Finite element analysis
FEM: Finite element method
FL: Full film lubrication
GVW: Gross vehicle weight
ML: Mixed lubrication
MT: Manual transmission
RH: Reverse high / Reverse gear high split
RL: Reverse low / Reverse gear low split
RPM: Revolutions per minute
Latch cone is also known as blocker ring, baulk ring and synchronizer ring.
Inner cone is also known as synchronizer cone.
Driver is also known as hub.
Shift sleeve is also known as sleeve or collar.
ix
NOMENCLATURE
𝐹𝐴𝑥 Axial force applied on shift sleeve [N]
𝐹𝐴𝑥 𝑚𝑎𝑥 Maximum axial force from pneumatic actuator [N]
𝐹𝑆𝑝𝑟𝑖𝑛𝑔 Spring system force [N]
�̇�𝐴𝑥 Axial force ramp [N/s]
𝐺𝐷 Groove depth [m]
𝐺𝐻 Groove height [m]
𝐺𝑊 Groove width [m]
𝐼𝑚 Moment of inertia, component 𝑚 [kg∙m²]
𝐼𝑅 Reflected moment of inertia [kg∙m²]
𝐿 Length of simulation domain, simplified 3D model [m]
𝑃 Applied normal load [N]
𝑃𝑎 Contact pressure, evaluation point a [Pa]
𝑅𝐵 Radius of blocker teeth / shift sleeve contact [m]
𝑅𝐶 Cone radius [m]
𝑇 Temperature [K]
𝑇𝐶 Cone torque [Nm]
𝑇𝐼 Index torque [Nm]
𝑇𝑎 Temperature, evaluation point a [K]
𝑇𝑖𝑛𝑖𝑡𝑖𝑎𝑙 Temperature at start of synchronization [K]
𝑈 Sliding speed, simplified 3D model [m/s]
𝑊 Width of simulation domain, simplified 3D model [m]
𝑖𝑚 Ratio of gears between component 𝑚 and gear to be synchronized [-]
𝑛 Number of cones [-]
𝑡 Time [s]
𝑣 Sliding speed [m/s]
𝜃 Blocker teeth angle [rad]
α Cone half angle [rad]
𝜂 Dynamic viscosity [Pa∙s]
𝜇 Coefficient of friction [-]
𝜇𝐵 Coefficient of friction in blocker teeth / shift sleeve contact interface [-]
𝜇𝐶 Coefficient of friction in cone interface [-]
𝜇𝐶𝑚𝑖𝑛 Lowest coefficient of friction in cone interface with blocking function [-]
𝜔 Rotational speed [rad/s]
1
1 INTRODUCTION
Around 35% of the total cost of ownership for a long haulage truck is fuel expenses [1], and
together with the increased focus on CO2-reduction from authorities [2], customers and the
public [3], it is clear that energy efficiency is one of the main drivers in truck development. In
long haulage operation, roughly 20% of the energy losses can be attributed to the powertrain
[1], and 80% of the powertrain losses arise in the engine. The engine working conditions are
heavily influenced by the current gear ratio, which is a combination of available gear ratios in
the gearbox, rear axle ratio, wheel radius and gear selection strategy [4]. One way to increase
overall vehicle efficiency is to allow the engine to run at a lower speed with a higher torque
[5,6]. To cope with the power and efficiency demands, such powertrain would require more
gear shifts [7,8].
The higher torque from the engine requires gear wheels and a clutch that can handle the
increased torque, leading to a higher moment of inertia of the gearbox. To combine good
startability and low engine cruising speed, the total ratio spread of the gearbox has to increase,
leading to higher rotational speed differences during gear changes unless more gears are added
to the gearbox. As the gearbox is adapted to future powertrain concepts, future synchronizers
and gear shifting systems need to handle more frequent gear shifts with both higher moment of
inertia and rotational speed difference to synchronize. With more frequent gear shifts, the
performance, i.e. shift times, becomes more important to the overall transportation time as well
as driving comfort. Additionally, increased number of gear shifts increases the demand for
synchronizer and gear shift system robustness.
The market trend from manual transmissions to 2-pedal systems such as automated manual
transmissions [9] and dual clutch transmissions [10] means the synchronizer is controlled by
actuators and software rather than the driver’s direct input. This means that the synchronizer
load can be controlled and the trade-off between service life and performance can be made.
This gives a good potential to increase the robustness of the synchronizers by avoiding overload
and misuse situations from e.g. an unintentional selection of the wrong gear by the driver.
It is clear that the gear shifts affect the fuel consumption of and emissions from a vehicle [11],
and that there are a lot of potential energy savings that can be achieved by optimizing engine,
gearbox and control software together. The working conditions of synchronizers can also be
controlled to a greater degree than what was historically possible. This gives the gearbox
designers new challenges and new opportunities. To meet the new challenges and make use of
the new opportunities, new development tools are needed.
1.1 Objective
The presented research seeks to contribute to virtual, or model-based and simulation-driven,
design of gearbox synchronizers, to allow for faster gear shifts and more robust synchronizers.
The contribution of the papers to the overall goal are presented in Figure 1.1.
2
Figure 1.1, Appended papers contributions to overall goal.
1.2 Research questions
The main research question for this thesis is:
How can the state change (i.e. behavior) of the contact interface in a synchronizer be predicted
during pre-synchronization and main synchronization?
The main research question is divided into the following sub-questions:
How can the frictional behavior at transition between pre-synchronization and main
synchronization be predicted?
How does the coefficient of friction depend on the operating conditions during main
synchronization, and how can it be modeled to allow for more detailed systems
simulations?
How do external loads as well as different characteristic design parameters and their
interactions affect the nominal and local contact interface temperatures during
synchronization?
How can thermomechanical synchronization models be validated?
1.3 Thesis outline
Chapter 1 gives a short introduction to how gear shifts and synchronization affect the complete
vehicle, and why more research is needed on the topic. Chapter 2 gives detailed background
information of synchronization and gear shifts in general exemplified by a heavy duty truck
gearbox and its synchronizer. Chapter 3 presents the research methodology used in the thesis.
Chapter 4 presents the results. In chapter 5, the appended papers are summarized. Chapter 6
3
contains a discussion about the work and results, ideas for future work, and the conclusions
from this thesis. References are presented in chapter 7.
1.4 Swedish transmission cluster
Sweden is one of the leading nations in development and manufacturing of transmissions for
heavy duty vehicles. Starting 2016 [12], Swedish companies will supply gearboxes to four1 of
the seven2 leading European manufacturers of heavy duty commercial vehicles (Gross vehicle
weight, GVW > 16 000 kg) with a combined European market share (2014) of about 56% [13].
In Sweden, more than 5 000 persons work with development or manufacturing of heavy duty
transmission systems. To help maintain this position, the Swedish transmission cluster was
founded in 2011 as a collaboration between Scania CV AB, Volvo Group Trucks Technology,
KTH Royal Institute of Technology and Chalmers University of Technology. The purpose is
to support and synchronize technology-neutral transmission related research. The cluster is
partly financed by the Swedish Governmental Agency for Innovation Systems, VINNOVA.
This thesis joins previous theses in the cluster such as investigation of churning losses and
efficiency in gearboxes [14], lubricant flow and CFD methodology [15], running-in of gear
wheels [16] and surface stress evolution during running-in [17]. In addition to this thesis, the
current project includes development of models and a methodology for Pareto optimization of
synchronized gear shifts on a system level, i.e. the synchronizer and its surroundings [18]. The
cluster focuses on transmissions for heavy duty trucks with European classification N3 (GVW
> 12 000 kg)[19], which is roughly equivalent to US class 8 (GVW > 33 000 lb., ~ 15 000 kg)
[20]. However, the results might be transferable to other types of high-performing transmission.
1 Scania CV AB will supply MAN Truck and Bus, Volvo Group Trucks supplies Renault Trucks. 2 The previously mentioned manufacturers as well as Mercedes-Benz Trucks, DAF Trucks NV and Iveco.
4
2 FRAME OF REFERENCE
This section provides background information to the presented research.
2.1 Virtual product development
As the customer demands on the product and the product complexity increases, stricter
legislations such as emission and efficiency standards are introduced. Consequently, the
challenges, costs and risks in product development increase. To allow for better products with
shorter time to market, new development tools are needed. The trend in product development
is to use computer simulations to a large extent [21]. Systematic use of simulations during
product development is often referred to as model-based and simulation-driven design [22].
Concepts and solutions can be virtually assessed before prototypes are ordered. The advantages
compared to the old design-build-test method are many and the potential effects on product
quality and development time are large. Product performance can be improved by better
knowledge of the product limitations and operations, weight can be reduced by optimizing
topology [23], robustness can be increased by identifying weak spots that can be improved
[24], acoustic emissions can be reduced by altering the stiffness of the product [25], and so on.
More iterations in the product development can be performed since simulations can be very
time efficient, once you have the right models for the task, compared to manufacturing and
testing physical prototypes [21]. Cost can also be reduced, since less physical prototypes and
test rigs are needed. Simulations can also give answers to questions on a phenomena level that
testing cannot due to limitations in measurement techniques and feasibility of measuring all
relevant positions and all physical phenomena [26]. In short, better knowledge about the
product and its interactions with the surroundings can give a better product due to better tools
that assist development [27].
Advanced simulations can include several physical phenomena, i.e. multiphysics effects,
complex geometries and materials as well as transient and local interactions between parts.
However, decisions based on incorrect simulations can have huge consequences on
performance and reliability of the finished product [28]. Therefore, model verification and
validation is of utmost importance [29,30].
Many physical phenomena require treatment of several independent variables such as shape
(generally between 1 and 3 dimensions) and time (for transient analysis), as well as dependent
variables such as temperature and displacement. The problem can often be described by partial
differential equations (PDE). While analytical solutions to some PDEs exist, it is generally
impossible to find an analytical solution for real world engineering problems. However, the
solutions can be approximated by numerical methods [31]. The most commonly used is the
Finite Element Method (FEM, sometimes referred to as Finite Element Analysis, FEA, or
Finite Element, FE). The geometry, or simulation domain, is discretized into smaller elements.
The geometry can preferably be imported from the Computer Aided Design (CAD) systems
the design engineers use. The discretized geometry is often called “mesh”. An example of
original and discretized geometry is available in Figure 2.1. An approximation of the solution
is made in each discrete element, and then the elements are patched together to a global solution
5
[32]. For transient cases, the time is also discretized. Numerical methods are used to find the
solution [33,34]. Since the accuracy of the global solution depends on the per-element solution,
the elements have to be small enough so the local approximation is valid [35]. However,
smaller elements increase the number of elements, thus increasing computational time.
Figure 2.1, (a) Continuous CAD geometry and (b) discretized approximation of geometry.
2.2 Lubrication regimes
Figure 2.2 shows an example of a Stribeck curve [36]. The Stribeck curve was originally
developed to relate speed and friction in hydrodynamic bearings. The Stribeck curve describes
the relation between the coefficient of friction, 𝜇, and a function of the dynamic viscosity 𝜂,
relative rotational speed 𝜔 and applied load 𝑃. The Stribeck curve is often used to describe the
three traditional lubrication regimes [37]:
Boundary lubrication (BL), where the asperity contact carries the load.
Full film lubrication (FL), where the lubricant film carries the load, i.e. the surfaces are
separated by the lubricant.
Mixed lubrication (ML), where the load is carried in part by the asperities, and in part
by the lubricant.
Figure 2.2, Stribeck curve with the three lubrication regimes.
6
2.3 Gear shift in heavy truck transmissions
The following description is based on a Scania range-splitter gearbox and synchronizer, but
general enough to apply to most heavy duty gearboxes and to most synchronizers. Figure 2.3
shows an example of a heavy duty truck gearbox. It consists of an input shaft (1), lay shaft (2),
main shaft (3) and output shaft (4) mounted in the gearbox housings (5-7). The gearbox can be
described as three serially connected gearboxes: the splitter, the main gearbox and the range
unit. The splitter consists of gear wheel pairs 8 and 9. The main gearbox consists of gear wheel
pairs 11 for 1st gear, 10 for 2nd gear, 9 for 3rd gear, 12 for the crawler gear, 13a for the reverse
gear. The reverse idler gear is schematically shown as 13b. The range unit is a planetary gear,
where the ring gear is locked to the sun gear via 19a for high range gear, or to gearbox housing
6 and 7 via 19b for low range gear. This gives 2∙3∙2+2=14 forward gears and 2 reverse gears,
since crawler and reverse is not allowed on high range gear.
Table 2.1 shows the possible combinations.
Figure 2.3, Section cut of a heavy duty truck gearbox (Scania GRS905), including power flow
for gear 7 and close-up of splitter synchronizer.
Table 2.1, Gear number based on split, main gearbox and range position (Scania GRS905).
Main gearbox Low range High range
Low split High split Low split High split
1 1 2 7 8
2 3 4 9 10
3 5 6 11 12
Crawler CL CH Not used Not used
Reverse RL RH Not used Not used
7
The clutch disc (not shown in Figure 2.3), which is mounted on the input shaft (1), transfers
the torque from the engine to the gearbox. The torque is transferred via the active split step (8
or 9) to the lay shaft, and then to the main shaft via the selected main gearbox gear (9-13) and
to the output shaft via the range gear (19a or 19b). The output shaft is connected to the propeller
shaft, which is, via the rear axle, half shafts and potentially the hub reduction, connected to the
wheels. The gear wheels on the lay shaft (2) are rotationally locked to the shaft or integrated in
the shaft itself. The gear wheels on the main shaft (3) and input shaft (1) are free to rotate
around their shaft. The gear wheels are in constant mesh with each other. To transfer the driving
torque, the rotatable gear wheel are connected to its shaft by axially displaceable shift sleeves
(15-17). Note that gear wheel 9 is used for both splitter and main gearbox gear, and if gear
wheel 9 is engaged by both shift sleeve 15 and shift sleeve 16 the direct-drive is engaged, and
the torque is not transferred to the lay shaft thus increasing efficiency. For the unsynchronized
reverse gear and crawler gear, a dog clutch (18) is used instead of the synchronizer and shift
sleeve. The blue line schematically shows the power flow for gear 7.
As an example, assuming the retardation of the vehicle during gear shift is negligible, a gear
shift from 2nd to 3rd main gearbox gear, without any split or range shift, would be:
1 Initial states. The wheels rotate at a constant rotational speed, which makes the output
shaft rotate at a constant rotational speed. In the example, the range is not shifting, so the
main shaft also rotates at a constant speed. The rotational speed difference between the
main shaft and the gear wheel to be engaged is determined by the difference in gear ratio
between current and target gear as well as rotational speed of the main shaft.
2 Open the clutch. The gearbox is disconnected from the engine by separating the clutch
disc from the flywheel and pressure plate.
3 Engage neutral gear. Main gearbox shift sleeve is moved to neutral position.
4 Synchronize the rotational speeds. Since a new gear ratio will be engaged, there is a
mismatch between the main shaft rotational speed and the rotational speed of the gear wheel
to be engaged. Thus the gear wheel has to be braked to the target rotational speed, which
means braking the lay shaft, all meshing gear wheels, the input shaft and the clutch disc.
Note that a downshift would require speed increase of the previously mentioned
components. Synchronizers can be used to synchronize the mismatched rotational speeds.
Some alternatives to synchronizers are presented in section 2.6 - Other means to
synchronize a gearbox.
5 Engage gear. Main gearbox shift sleeve is moved to the engaged position for the target
gear.
2.4 Synchronizer technology
Synchronizers have been used for almost 100 years [38], and they represents one of the largest
improvements made in the history of automotive transmissions [39]. It is a mechanical machine
element that synchronizes the rotational speed of the gearbox during gear shifts and prevents
gear engagement during asynchronous rotational speeds. Additionally, the synchronizer is
often responsible for locking the selected gear in place when driving or braking torque is
transferred by the gear. Figure 2.4 shows the single cone synchronizer used in the gearbox in
8
Figure 2.3. The driver component is connected to the input shaft (1) for the split synchronizer
(15) and to the main shaft (3) for 2nd/3rd and 1st gear synchronizers (16, 17). The shift sleeve is
mounted on the driver and can move axially. The protruding blockers of the latch cone are
mounted in the slots in the driver. The coupling disc is mounted on the gear wheel, and the
inner cone is mounted in the holes of the coupling disc. A friction lining is applied to the latch
cone, in this case flame sprayed molybdenum. Sintered bronze, woven carbon fiber or carbon
compounds are also commonly used [40,41]. To transfer driving torque, the coupling disc is
locked to the driver by the shift sleeve. The teeth on the coupling disc and the teeth in the driver
have a “locking function”, which prevents gear disengagement during torque transfer. The
locking function is often in the form of a backwards taper angle. The wire spring temporarily
prevents gear engagement at start of synchronization.
A gearbox generally contains single cone, double cone, and triple cone synchronizers. To
achieve similar synchronization time between different gears, more cones are needed at lower
gears, because of the higher reflected moment of inertia due to higher gear ratios [42]. To the
reduced complexity in both simulation and testing, this thesis only considers single cone
synchronizers.
Figure 2.4, Example of synchronizer, Scania's current (2015) single cone synchronizer.
2.4.1 Different phases of synchronization
The synchronization process can be divided into different phases [43-47]. Figure 2.5 shows in-
truck measurements of an automated manual transmission gear shift, as well as the teeth
positions for five different synchronization phases:
9
1. Neutral. Initially, the shift sleeve is in the neutral position (around 50% of total stroke
length in the pneumatic actuator, since there is an in-gear position on both sides of the
neutral position).
2. Pre-synchronization. The shift sleeve leaves the neutral position to energize the spring
system. The spring system temporarily prevents gear engagement, i.e. the spring system
force 𝐹𝑆𝑝𝑟𝑖𝑛𝑔 exceeds the axial force applied on the shift sleeve 𝐹𝐴𝑥, as explained in
section 2.4.3 - Pre-synchronization.
3. Main synchronization. The rotational speed is synchronized. During this phase, the
latch cone blocks the gear engagement. Note that the position of pre-synchronization
and main synchronization is approximately the same. The shift sleeve does not move
axially during main synchronization. A small movement can be seen in the measured
data, but it is due to initial clearances closing and elastic deformation of components.
The main synchronization phase is further described in section 2.4.4 - Main
synchronization.
4. Blocker release. Synchronous rotational speed is reached, and the latch cone blocking
function is released.
5. Gear engagement. The shift sleeve is moved to an engaged position. Since the relative
angular position of the shift sleeve and the coupling disc is stochastic, the shift sleeve
might or might not come into contact with the coupling disc teeth [47,48].
Figure 2.5, (a) Stroke position, main shaft rotational speed, lay shaft rotational speed and
calculated gear wheel rotational speed during synchronization, measured in truck.
Synchronization phases schematically shown. (b) Phase 1: Neutral. (c) Phase 2: Pre-
synchronization, 𝐹𝐴𝑥 < 𝐹𝑆𝑝𝑟𝑖𝑛𝑔. (d) Phase 3: Main synchronization, 𝐹𝐴𝑥 ≥ 𝐹𝑆𝑝𝑟𝑖𝑛𝑔.
(e) Phase 4: Blocker release. (f) Phase 5: Gear engagement.
10
Many synchronization process definitions often include gear disengagement before neutral
position phase, and a free-flight phase after leaving neutral position and before entering pre-
synchronization phase and a teeth-teeth contact phase during gear engagement. In this thesis,
the pre-synchronization and the main synchronization phases have been studied.
2.4.2 Preventing unsynchronized gear engagement
To allow synchronization of the rotational speed, gear engagement must be avoided during
synchronization. The latch cone is mounted on the driver component with a small rotational
clearance. When the latch cone is positioned in its extreme positions as shown in Figure 2.6a,
the teeth block the axial motion of the shift sleeve, as shown in Figure 2.6b, preventing gear
engagement. Two torques acts on the latch cone: the cone torque, 𝑇𝐶, and the index torque, 𝑇𝐼
[49]. The cone torque arises from the friction between the latch cone and the inner cone, and
seeks to reduce the rotational speed difference between the cones to zero as well as to move
the latch cone towards its extreme position. The cone torque is [49,50]
𝑇𝐶 = ∑ 𝐹𝐴𝑥 ∙ (𝜇𝐶𝑖∙𝑅𝐶𝑖
𝑠𝑖𝑛 𝛼𝑖)𝑛
𝑖=1 (2.1)
𝑛 is the number of cones, 𝐹𝐴𝑥 is the axial force acting on the latch cone, 𝜇𝐶 is the coefficient
of friction between the cones, 𝑅𝐶 is the radius of the cones and 𝛼 is the cone half angle. The
index torque, which seeks to rotate the latch cone into its center position so that the shift sleeve
can pass the latch cone teeth, can be calculated by [49,47]
𝑇𝐼 = 𝐹𝐴𝑥 ∙ 𝑅𝐵 ∙ (1−𝜇𝐵∙𝑡𝑎𝑛 𝜃
𝜇𝐵+𝑡𝑎𝑛 𝜃) (2.2)
where 𝑅𝐵 is the radius of the teeth-teeth contact, 𝜃 is the angle of the blocker teeth and 𝜇𝐵 is
the coefficient of friction in the teeth-teeth contact. During synchronization, the inequality
𝑇𝐶 > 𝑇𝐼 has to be fulfilled to ensure that the gear cannot be engaged. The geometric definition
of 𝑅𝐶, 𝑅𝐵, 𝛼 and 𝜃 can be found in [47]. 𝜇𝐵 has a lower contribution to the torque balance than
𝜇𝐶 [51]. The lowest value for the coefficient of friction, 𝜇𝐶𝑚𝑖𝑛, for a single cone synchronizer
that still blocks the gear engagement, can be determined by
𝜇𝐶𝑚𝑖𝑛 =𝑅𝐵
𝑅𝐶∙ sin 𝛼 ∙ (
1−𝜇𝐵∙𝑡𝑎𝑛 𝜃
𝜇𝐵+𝑡𝑎𝑛 𝜃) (2.3)
11
Figure 2.6, (a) Rotational clearance between latch cone and driver. Note that 𝑇𝐶 and 𝑇𝐼 act
on the latch cone. (b) Latch cone in blocking position.
2.4.3 Pre-synchronization phase
At the beginning of synchronization, the conical surfaces are covered by lubricating oil and
there is a risk that the synchronizer is in the full film lubrication regime, i.e. there is a risk 𝜇𝐶
is lower than 𝜇𝐶𝑚𝑖𝑛, meaning the latch cone cannot block gear engagement. Therefore, another
system to prevent gear engagement is needed. For the synchronization system studied here, a
wire spring is used as pre-synchronization spring system. Another common design is to use
radial spring-loaded plunges or detents [52]. To move the shift sleeve axially past the pre-
synchronization position, the spring has to be compressed, which requires a certain axial force.
Before this axial force is reached, gear engagement is prevented. The process is schematically
shown in Figure 2.7. The oil film thickness decreases as the oil is squeezed out from the contact
interface. The coefficient of friction, here schematically shown, increases as the lubrication
regime transitions from full film lubrication to boundary lubrication. At the start of pre-
synchronization, the spring system needs to prevent gear engagement. When the coefficient of
friction exceeds 𝜇𝐶𝑚𝑖𝑛, the latch cone can block gear engagement.
12
Figure 2.7, The two different mechanisms to prevent gear engagement plotted against oil film
thickness and schematic coefficient of friction. The blue lines schematically represents
transitions between lubrication regimes.
The transition between pre-synchronization phase and main synchronization phase occurs
when the axial force applied to the shift sleeve, 𝐹𝐴𝑥𝑖𝑎𝑙, exceeds the spring system force,
𝐹𝑆𝑝𝑟𝑖𝑛𝑔. Some rotational speed synchronization can occur during pre-synchronization, since
even the low value for the coefficient of friction on the transition between the mixed lubrication
regime and the full film lubrication regime gives a small synchronization torque. Also, the drag
torque in the gearbox can synchronize the gearbox during an upshift. However, when the
transition to the main synchronization phase is complete, the latch cone must be able to block
gear engagement since the spring system can no longer prevent gear engagement.
2.4.4 Main synchronization phase
During the main synchronization phase, the rotational speed difference is reduced to zero. The
lubrication regime is boundary lubrication. To be able to engage the gear when synchronization
is finished, the axial force has to be significantly higher than the spring system force. The
coefficient of friction needs to be high enough for the latch cone to block gear engagement.
The acceleration or braking of a gearbox subsystem leads to frictional heating of the contact
interface. The following external parameters have been identified as the main loading
parameters during synchronization:
Rotational speed difference to synchronize [53,54].
Axial force during synchronization [53,54]. The transient axial force from a pneumatic
actuator can be approximated by [55]
𝐹𝐴𝑥 = {�̇�𝐴𝑥 ∙ 𝑡 𝑡 ≤ 𝐹𝑚𝑎𝑥 �̇�𝐴𝑥⁄
𝐹𝑚𝑎𝑥 𝑡 > 𝐹𝑚𝑎𝑥 �̇�𝐴𝑥⁄ (2.4)
13
�̇�𝐴𝑥 is the axial force ramp, 𝑡 is the time and 𝐹𝑚𝑎𝑥 is the maximum axial force the
actuator can deliver. For a manual transmission, the axial force is based on the drivers
input, which can be hard to describe mathematically since every driver and gear shift is
different [56].
Moment of inertia to synchronize. The moment of inertia of every component that will
be synchronized is reflected to the gear to be synchronized by 𝐼𝑅 = ∑(𝐼𝑚 ∙ 𝑖𝑚2 ), where
𝐼𝑅 is the reflected moment of inertia, 𝐼𝑚 is the moment of inertia of component 𝑚, and
𝑖𝑚 is the gear ratio between component 𝑚 and the gear to be synchronized [47,49,53].
Acceleration of the main shaft during gear shift due to vehicle acceleration. This can
either assist or resist synchronization. An example is available in Figure 2.8, where the
transient rotational speed difference is affected by the acceleration of the main shaft.
Drag torque, which either assists or resists synchronization depending on upshift or
downshift, since the drag torque always seeks to reduce the rotational speed of the
affected component [47].
Clutch drag, i.e. that the clutch transfers torque from the flywheel when the clutch is
supposed to be disengaged. This can either assist or resist synchronization, depending
on flywheel and clutch disc rotational speeds as well as up- or downshift.
Shift frequency and gearbox/oil temperature affects the initial temperature of the
synchronizer [53].
Additionally, synchronizer parameters such as cone radius and width, cone angle and
coefficient of friction affect the synchronization time and the load of the synchronizer.
Figure 2.8, Effect of main shaft acceleration on synchronization time.
2.4.5 Synchronizer failure modes
The main failure mode of a synchronizer is clashing, which is when the gear is engaged with a
remaining rotational speed difference, as shown in Figure 2.9. The symptoms of clash are a
“grinding” noise from the engagement teeth, and high impulses on the engagement teeth, which
will give plastic deformation and wear, as shown in Figure 2.10. Clash can be caused by several
issues, as shown in Figure 2.11. Full clash, i.e. no synchronization of rotational speeds is
performed before the clash, can arise from an inadequate pre-synchronization phase that never
allows the latch cone to block the gear engagement. Wear of the contacting surfaces that alters
14
the frictional properties of the synchronizer can also cause clash, since the latch cone cannot
block gear engagement if the coefficient of friction is too low. Sudden rotational speed changes
in the powertrain, from e.g. clutch disengagement during torque transfer or disturbances from
the vehicles anti-lock braking system, can temporarily reduce the indexing, i.e. overlap
between latch cone blocker teeth and the shift sleeve teeth, allowing for gear engagement. This
can cause both full or partial clash, i.e. some synchronization of rotational speeds has occurred.
High drag torque from the lubricating oil or a torque transferred over the clutch can create a
rotational speed difference after synchronous rotational speed is reached but before the gear is
engaged, which is a form of clash called desynchronization [49].
Figure 2.9, Schematic description of clash, 𝜔1 ≠ 𝜔2.
Figure 2.10, Coupling disc teeth after normal operation (bottom) and after clash (top).
15
Figure 2.11, Different causes of clash.
Failure modes such as hard shifting, i.e. a high shifting effort required, poor shifting comfort
and blockage, i.e. blocked gear engagement after synchronous rotational speed is reached due
to cone seizure can also be attributed to the synchronizer [49,52]. While those failure modes
also depend on the frictional properties of the synchronizer, they have not been studied in detail
in this thesis. Furthermore, failed engagement due to engagement tooth-on-tooth contact [57]
has not been studied in this thesis.
2.4.6 Synchronizer testing
The most common synchronizer test rig is likely the ZF/FZG SSP-180 Synchromesh Test Rig
[41], which is used in e.g. the CEC synchronizer test standard [58]. However, the test rig used
in this thesis is the truck variant of a µ-comp synchronizer test rig [59], which is similar to the
SSP-180 with respect to test parameters and procedure. The test rig used in this thesis is a larger
version of the rig that was used in [53,54], and is schematically shown in Figure 2.12. A electric
motor is used to accelerate the flywheel to its intended speed. When the intended rotational
speed is reached, the motor is turned off. The inner cone of the synchronizer is fixed to ground,
while the latch cone is mounted on the center shaft of the rig. A force is applied to the shift
sleeve by a hydraulic actuator until the shift sleeve has passed the synchronization position.
Lubricating oil is sprayed from the top of the synchronizer or through the center shaft of the
rig. During synchronization, rotational speed, oil temperature, shift sleeve position, applied
force and the resulting torque is measured. Measurement accuracy is presented in Paper D.
From that data, the coefficient of friction for a single cone synchronizer can be determined by
𝜇𝑐 =𝑇𝐶∙sin(𝛼)
𝐹𝐴𝑥∙𝑅𝐶 (2.4)
Clash
Full No synchronization work performed.
Partial Some synchronization work performed.
Inadequate pre-
synchronization
Too low coefficient
of friction between
cones, TI>TC
External
disturbances Desynchronization
Sudden
rotational
speed
changes in
powertrain
Mismatch
synchronizer/
manoeuvring
system
High drag
losses or
clutch drag
Too high
oil viscosity Wear,
changed
surface
topography
Too low
spring
system
force due to
e.g. wear
Lubricant
degradation
16
Figure 2.12, Schematic drawing of µ-comp test rig.
2.5 Maneuvering system
In AMT and DCT, the axial force applied to the synchronizer shift sleeve is generated by an
actuator instead of the force the driver applies to the gear lever. Additionally, the axial force in
the splitter and range group for a MT generally comes from actuators. Heavy duty trucks use
pneumatic actuators for several systems, including gear shift actuators. An example of a
maneuvering system for a synchronizer is shown in Figure 2.13, consisting of a valve unit, a
pneumatic actuator (cylinder, piston, position sensor) as well as gear shift shaft and fork. Main
design parameters include cylinder/piston diameter, diameter of air inlet and system mass.
Figure 2.13, Splitter maneuvering system.
17
2.6 Other means to synchronize a gearbox
The gearbox can also be synchronized by the engine. Before the synchronizer was introduced,
the driver was forced to “double clutch” [60] (not to be confused with the new transmission
type dual clutch transmission, DCT). To synchronize the rotational speed of the shaft and the
gear wheel to be engaged in an unsynchronized gearbox, the driver needed to open the clutch,
engage neutral gear, close the clutch, control the engine to the correct rotational speed for the
gear to be engaged, open the clutch, engage the gear, and close the clutch. This process required
skill and timing from the driver, offered poor driving comfort and might lead to long shift time
[61]. The same process is in some cases used today in AMT, but is controlled by the control
software instead of the driver [62]. An alternative to opening the clutch is to reduce the torque
from the engine so that the clutch does not transfer any torque, and then disengage or engage
the gear. The downside of this process is that the engine is slow to retard during upshifts.
Systems like an exhaust brake can be used to retard the engine, but that reduces the rotational
speed of the turbocharger, thus temporarily reducing the engine power after the gear shift.
However, for downshifts this process works well since the engine has good acceleration
performance.
To improve upshift performance without the use of synchronizers, a brake unit acting on the
lay shaft can be used. The brake unit is often a pneumatically operated wet multi-disc brake
directly connected to the lay shaft, and the synchronizers are replaced by dog clutches. Such a
gearbox is often called “unsynchronized”, which is not strictly correct. It might lack the
traditional cone shaped synchronizers for e.g. the main gearbox, but retain them in the splitter
range and retarder [63]), but the main gearbox gear shifts are synchronized by the brake unit.
Since the brake unit has similar properties as a synchronizer, i.e. boundary lubricated sliding
friction with rapidly changing relative rotational speed, parts of this research might be
applicable for such a system.
Instead of using a brake unit, an electric motor can be used [64]. With the increased focus on
vehicle hybridization, this solution might become more common in the future since an
electrical motor used to save fuel can also be used to synchronize the gearbox.
18
3 RESEARCH METHODOLOGY
This section contains a summary of the methodology used in this research. Two different types
of numerical simulations were used, namely fluid-structure interaction and thermomechanical
simulations. Additionally, physical tests were performed in a µ-comp rig.
3.1 Fluid-structure interaction model to simulate pre-synchronization
The blocking of gear engagement during asynchronous rotational speed is a pre-requisite for
successful synchronization. To study the relation between oil film thickness at end of pre-
synchronization and parameters such as spring system force, maneuvering system behavior,
and groove design, two multiphysics fluid-structure interaction models were developed and
simulated with the commercial FE software Comsol Multiphysics 4.4. One model, which is
axisymmetric, Figure 3.1, can be used to assess the effect of cone geometry and maneuvering
system. The simulation was run until the maneuvering force exceeded the spring system force.
The oil film thickness was evaluated at the end of the simulation. The other model which is 3D
with a simplified geometry, Figure 3.2, can be used to assess the effect of different axial
grooves in the contact surface. The oil outlets for both models were modelled by a Dirichlet
boundary condition enforcing zero pressure at the boundary. To avoid negative pressures in the
grooves, a cavitation model where the oil viscosity and density is reduced based on pressure,
was developed and implemented. To reach convergence, the 3D model had a lower applied
force than the 2D model. Instead of the stopping condition used in the 2D model, all 3D
simulations were run for one second. Thorough descriptions of the models are given in Paper
A.
Figure 3.1, 2D Fluid-structure interaction model.
19
Figure 3.2, Synchronizer (left), simplified 3D fluid-structure interaction model (top right),
and synchronizer grooves from a Volvo I-shift range synchronizer (bottom right).
3.2 Thermomechanical model to simulate main synchronization
A synchronizer’s behavior during synchronization is a combination of mechanical and thermal
effects. Mechanical effects include the moment of inertia to synchronize and the contact
mechanics between the interacting parts. Thermal effects include heat generated in the friction
surface during synchronization. Thermal expansion deforms the contacting surfaces and
localizes the contact area. A reduced contact area further focuses the heat generation, creating
a self-reinforcing process [54,66], also known as a thermoelastic instability. A multiphysics
thermomechanical model was developed and solved with the commercial FE tool Abaqus. The
model consists of two generalized axisymmetric parts, as shown in Figure 3.3. The modeling
steps are shown in Figure 3.4. The model was used to perform two parameter studies of a
synchronizer. The first study investigated how different external loads affect the temperature
increase in the synchronizer. The second study investigated how different synchronizer
geometries distribute the heat in the synchronizer by simulating synchronization processes with
the same load, but for different geometries. A thorough description of the model is available in
Paper B. Synchronizers with both molybdenum coating and carbon lining were investigated.
The material properties used is shown in Table 3.1. The carbon lining has significantly lower
thermal conductivity than molybdenum and steel, which affects the energy partition between
the cones. An implicit heat partition model was used, where an arbitrary heat partition was
applied to the contact, and a very high thermal conductance over the contact ensures thermal
continuity, to equalize the local temperature of the interacting surface patches.
20
Table 3.1, Material parameters for thermomechanical simulation.
Parameter Steel Carbon Molybdenum
Density [kg/m3] 7850 1050 10280
Young’s modulus [Pa] 206·109 50·109 329·109
Poisson’s ratio [-] 0.3 0.4 0.31
Coefficient of thermal expansion [1/K] 11·10-6 70·10-6 4.8·10-6
Thermal conductivity [(W/(m·K)] 48 0.65 138
Specific heat capacity [J/(kg·K)] 452 1770 250
The model was verified by reviewing and comparing output data such as cone torque and
energy levels to analytical estimates for cone torque, rotational speed and brake energy. There
were good agreements between simulated and analytical results, as shown in Figure 3.5. A
study of the discretization error was also performed, and it was shown that a sufficiently small
discretization in both space and time was used in the simulation.
The model was validated with bulk and surface temperature measurements as well as a
qualitative assessment of wear marks compared to high temperature areas of the synchronizer.
A pyrometer was installed in the inner cone to measure the surface temperature of the latch
cone during synchronization. The pyrometer installation can be seen in Figure 3.6. The
emissivity was determined experimentally by measuring the surface temperature of a pre-
heated synchronizer with both thermocouples and the pyrometer. The emissivity used in the
analysis was 0.89 for molybdenum and 0.87 for the carbon lining. Measured surface
temperature compared with simulated temperature can be seen in Figure 3.7. The agreement
for molybdenum synchronizers are good. For carbon synchronizers, a correction factor based
on the Abbott-Firestone curve was applied due to the large surface features and low thermal
conductivity of the carbon lining. A thorough description of the verification and validation
procedure, including the carbon lining correction factor, is available in Paper C.
21
Figure 3.3, Geometry and discretization of numerical model.
Figure 3.4, Thermomechanical model flowchart.
Fix inner cone. Apply an axial displacement to latch cone to establish contact.
Disable displacement boundary condition, apply a low force to maintain contact state.
Apply rotational speed to one or both cones. Increase force, reduce rotational speed of slave system based on torque and inertia until
synchronization is finished. Optional: Apply cooling to external surfaces.
Optional: Separate the cones. Apply cooling to contact surface.
Optional: Cooling.
Transfer data to MATLAB for analysis.
22
Figure 3.5, Thermomechanical model verification by comparing analytical estimates to FE
output data.
Figure 3.6, Pyrometer installed in test object.
23
Figure 3.7, Validation of thermomechanical model. The correction factor 1/0.6 is briefly
discussed in section 5 - SUMMARY OF APPENDED PAPERS and thoroughly discussed in
Paper C.
3.3 Combining simulation and physical tests
The thermomechanical FE model can import test rig output, providing a virtual representation
of an actual synchronization cycle to assess surface temperature during synchronization.
Applied force and rotational speed as function of time as well as coefficient of friction as a
function of sliding speed can be used as input data to define a synchronization cycle, while the
resulting torque from the model can be used to validate the simulation by comparing with
measured values, as seen in Figure 3.8. A thorough description of this methodology is available
in Paper D.
Figure 3.8, Comparison between measured and simulated cone torque.
24
3.4 Friction model for main synchronization
The frictional torque between the latch cone and the inner cone is important for both
functionality and performance, as explained in sections 2.4.2 - Preventing unsynchronized gear
engagement and 2.4.4 - Main synchronization. To better understand the behavior of a
synchronizer, a friction model was developed. It has been shown in literature that the
coefficient of friction for a given contact interface depends on sliding speed, contact pressure
and temperature [66,67]. Coefficient of friction, sliding speed and applied force is measured
during synchronizer testing, as explained in section 2.4.6 - Synchronizer testing. As explained
in section 3.3 - Combining simulation and physical tests, a virtual representation of a test cycle
can be created, and the surface temperature increase during synchronization can be obtained.
Thermocouples were used to measure cycle start temperature, and by adding starting
temperature and temperature increase, transient surface temperature could be obtained. A test
cycle with different axial forces at different start temperatures was developed. An equation to
describe the coefficient of friction as a function of sliding speed, axial force and surface
temperature was proposed. Residual analysis was used to analyze the accuracy of the proposed
equation. This process was iterated until a satisfactory fit was obtained. The workflow can be
seen in Figure 3.9.
To remove the deed for time-consuming finite element simulations to determine the
temperature, a simplified 1D model was developed. A Neumann boundary condition (i.e.
prescribed heat flux) was applied to the node representing the contact surface. Since the
synchronization time is short, the model is assumed to be adiabatic. Therefore, a Dirichlet
boundary condition (i.e. prescribed temperature) was applied to the material sufficiently far
from the friction surfaces. The simplified thermal models is about four orders of magnitude
faster than the full FE model (0.03 s compared to 300 s). A detailed description of the friction
model and the simplified thermal model is available in Paper D.
Figure 3.9, Friction model development workflow.
F
MC
µ
𝑣
Tinitial
FE model
Ta, Pa Evaluate
residuals
Model of
µ
Physical testing Simulation Calculation Output
Propose
equation
25
4 RESULTS
4.1 Pre-synchronization simulation
Figure 4.1 and Figure 4.2 show the results from pre-synchronization simulations from the 2D
and 3D model, respectively. It can be seen that parameters connected to the maneuvering
system, i.e. force ramp speed and maneuvering system mass, has a large effect on the pre-
synchronization behavior. No significant benefit from increasing the spring force beyond ~130
N can be seen in this specific system with these oil properties. Grooves in the contact surface
are highly beneficial, and the presence of grooves seems more important than groove design.
Figure 4.1, Results from 2D pre-synchronization model.
26
Figure 4.2, Results from 3D pre-synchronization model. Examples of grooves is available in
Figure 3.2.
4.2 Main synchronization simulation
Figure 4.3 shows the results from a study of the main synchronization external load parameters.
It can be seen that the rotational speed is the most important parameter showing an exponential
temperature increase with increasing rotational speed. An increased moment of inertia
increases synchronizer temperature approximately linearly, while the temperature increase
caused by an increased axial force is logarithmic. Figure 4.4 shows the results from the
geometrical parameter study. The most important parameters relate to the contact surfaces, and
the bulk geometry only has a small effect on the surface temperature.
27
Figure 4.3, Results from the external load parameter study.
Figure 4.4, Results from the geometrical parameter study. Category A-C relates to the
contact surface, i.e. angle difference between latch cone and inner cone contact surface as
well as straightness deviation on the latch cone. Category D-G relates to the bulk geometry,
with D being the Young’s modulus of the latch cone, E is the lining position (Latch cone or
inner cone), and F-G is geometrical properties of the latch cone. Full details are available in
Paper B.
4.3 Friction model for main synchronization
The coefficient of friction for the analyzed material and lubricating oil combination can,
according to Paper D, be described as:
𝜇𝐶 = 𝑐1 + 𝑐2 ∙ 𝑣 + 𝑐3 ∙ 𝑇 + 𝑐4 ∙ 𝐹𝐴𝑥 + (𝑐5 + 𝑐6 ∙ 𝐹𝐴𝑥) ∙ tanh(𝑐7 ∙ 𝑣) + 𝑐8 ∙ 𝑒𝑣 (4.1)
A similar sliding speed dependence of the coefficient of friction is presented in [66]. The values
for the coefficients 𝑐𝑖 are available in Paper D. Figure 4.5 shows a comparison between the
measured coefficient of friction and the friction model coefficient of friction for three different
28
axial forces at three different temperatures. This data was not a part of the analysis, and only
used for verification. Figure 4.6 shows a comparison between measured and calculated
coefficient of friction for all data points included in the analysis. There is good agreement
between measurements and calculations, except at low sliding speeds, i.e. close to the gear
engagement. Figure 4.7 shows a comparison between the simulated temperature from the
simplified model and the FE model, as well as a comparison between the measured coefficient
of friction and the friction model prediction based on temperature data from the simplified
thermal model.
Figure 4.5, Measured and friction model coefficient of friction.
29
Figure 4.6, Comparison between measured and calculated coefficient of friction for all data
points.
Figure 4.7, Comparison between simulated temperature increase with the simplified thermal
model and with the FE thermal model, as well as a comparison between the measured
coefficient of friction and the modelled coefficient of friction using the simplified thermal
model as source of temperature data for (a) Single cone synchronizer, (b) Double cone
synchronizer, outer contact interface.
30
5 SUMMARY OF APPENDED PAPERS
Paper A: Robust pre-synchronization in heavy truck transmissions.
The pre-synchronization phase was studied by simulating the evacuation of lubricating oil from
the contact surfaces. Two models were used. A 2D axisymmetric model that can be used to
investigate the interaction between the maneuvering system (actuator/driver behavior, gear
selector shaft and gear selector fork) and contact surface shape and parallelism. A 3D model
with simplified geometry that can be used to investigate the addition of grooves in the contact
surface.
It was shown that the pre-synchronization is highly dependent on the maneuvering system, and
the addition of grooves is beneficial.
Paper B: Parameter study of the thermomechanical performance of heavy duty
synchronizers.
A thermomechanical FE model to simulate the combined mechanical and thermal load during
synchronization was developed. Modeling complications such as how to define the contact
stiffness and how to model the rotational speed using an analysis procedure that does not
support moment of inertia were discussed. A simple method for implicit energy partition
between the two cones was presented. Both carbon fiber and molybdenum were used as friction
linings.
Two parameter studies were performed. The first parameter study investigated the effect of
different applied synchronizer loads, and showed that the rotational speed to synchronize has
a larger influence than the moment of inertia to synchronize and the axial force. The second
parameter study investigated the effect of the cone geometry, and showed that the cone surface
itself has a significantly larger influence over the resulting temperature increase than the bulk
geometry of the synchronizer has.
It was also shown that molybdenum coated synchronizers show similar thermal trends as a
carbon fiber coated synchronizer, but the temperature was significantly higher for the carbon
lined synchronizer due to the low thermal conductivity of the carbon fiber.
Paper C: A verified and validated model for simulation-driven design of heavy duty truck
synchronizers.
A methodology for verification and validation of thermomechanical synchronizer simulations
were presented. The numerical verification was described and the results showed that there
were good agreement between analytical values and simulated results. It was also shown that
the discretization error was negligible.
To validate the model, both bulk and surface temperature measurements were performed. Bulk
temperature measurements with thermocouples at three different positions showed good
agreement with simulated data just after synchronization, but no temperature peak during
synchronization was visible. This is not intuitive, and it was assumed to be the result of a high
31
thermal impedance in the interface between the thermocouple and bulk material. However, the
test validated the energy partition between the contacting parts. The surface temperature during
synchronization was measured with a pyrometer. The emissivity was determined
experimentally. Molybdenum coated synchronizers showed good agreement between
simulated and measured values. Simulated temperature values for carbon coated synchronizers
were significantly higher than measured values, and a correction factor based on the Abbott-
Firestone curve was proposed and discussed upon. With the correction factor, there was good
agreement between measured and simulated data for carbon synchronizers.
Paper D: Predicting friction in synchronizer systems
A methodology for developing friction models for synchronizers was proposed, and
exemplified by a molybdenum coated synchronizer. It was shown that the coefficient of
friction, sliding speed and surface temperature have strong mutual dependences. A test
procedure was developed for the µ-comp test rig to test different combinations of applied axial
force and temperature. Measured data for axial force, coefficient of friction and rotational speed
were imported into the thermomechanical model developed in Paper B to virtually represent
each test cycle to determine the temperature during real test cycles. The simulated torque
corresponded well with the measured torque. The combination of physical testing and
simulation yielded about 50 000 data points containing coefficient of friction, sliding speed,
axial force and surface temperature. Axial force was assumed to be proportional to contact
pressure on the nominally smooth surfaces.
An empirical description of the coefficient of friction as a function of sliding speed, axial force
and surface temperature was developed by least square analysis. The model showed good
correlation to measured data. Additionally, a simplified thermal model was developed to allow
for quick assessment of surface temperature as well as coefficient of friction. The model was
solved iteratively due to the strong dependence between coefficient of friction, sliding speed
and temperature. The thermal results corresponded well with results from the FE model, which
means the coefficient of friction results also corresponded well with measured data. The
simplified method is about four orders of magnitude faster than the full FE model (0.03 s
compared to 300 s).
32
6 DISCUSSION, CONCLUSIONS AND FUTURE WORK
6.1 Answers to research questions
How can the frictional behavior at transition between pre-synchronization and main
synchronization be predicted?
In paper A, the oil film thickness at the transition from the pre-synchronization phase to the
main synchronization phase is assessed. The oil film thickness is an indicator on what
lubrication regime the system is working in. The simulated oil film thickness is smaller than
the asperity heights, which would indicate boundary lubrication and successful pre-
synchronization.
How does the coefficient of friction depend on the operating conditions during main
synchronization, and how can it be modelled to allow for more detailed systems simulations?
A friction model was developed and presented in Paper D. The model represents the coefficient
of friction well during main synchronization. The coefficient of friction depends on the sliding
speed, the applied axial force and the contact temperature. Above ~0.5 m/s sliding speed, the
coefficient of friction of one cycle increases slightly with a reduced sliding speed. Around 0.5
m/s sliding speed, the coefficient of friction decreases rapidly. For a synchronizer, this means
that the gear engagement starts around this point. This property of the friction model is of
interest when studying gear engagement. A simplified thermal model was developed, to
efficiently predict the coefficient of friction, allowing the friction model to be implemented in
systems simulation of gear shifts and synchronizers. The simplified model removes the need
for full FE thermal simulations.
How do external loads as well as different characteristic design parameters and their
interactions affect the nominal and local contact interface temperatures during
synchronization?
How the temperature increase depends on three loading parameters as well as of geometrical
parameters are presented in paper B. Increasing the rotational speed to synchronize increases
the temperature exponentially. Increasing the moment of inertia to synchronize increases the
temperature linearly. An increase in maximum axial force increases the temperature
logarithmically. The contact surfaces straightness and parallelism are significantly more
important than the bulk geometry of the synchronizer. The interaction effects between
geometrical parameters are low, except for parameters related to the contact surface geometry.
Carbon and molybdenum synchronizers behave similarly, but the temperature increase in a
carbon synchronizer is significantly higher than in its molybdenum counterpart due to low
thermal conductivity in the carbon, which affects the heat partitioning between the cones.
How can thermomechanical synchronization models be validated?
33
In paper C, a thermomechanical synchronizer model is validated with surface temperature
measurements. The emissivity is determined experimentally. The reported temperature is an
average of a circular area with a diameter of 7 mm. The measurements validated the average
temperature over the measured area, as well as the time constant of the temperature increase.
A qualitative validation was performed by comparing high temperature areas to areas where
first signs of wear appears, which further validates the temperature distribution. Bulk
temperature measurements were used to validate the energy partition between the cones as well
as the cooling power in the test rig. However, due to high thermal impedance in the interface
between the thermocouples and the bulk material, these measurement could not be used to
validate the temperature peak during synchronization. Measures were taken to increase the
thermal conductance to the thermocouple, but the short synchronization time does not seem to
allow for accurate thermocouple measurement of peak temperatures.
6.2 How can the presented thesis be used
The author of this thesis has a background as a synchronizer design engineer, and has often
thought “If I, as a design engineer, was introduced to this thesis, how would I use it?”
The pre-synchronization simulations in paper A highlight how dependent the
synchronizer is on the actuator and maneuvering system. Even though the model is not
validated, I would use the results of paper A to qualitatively determine the effects from
different parameters during design.
The friction model presented in paper D is interesting for system simulation models,
both for quick, simplified models as well as multibody dynamics simulations.
Predicting failure from e.g. changed frictional properties due to adhesive wear is, of
course, highly valuable. If the surface temperature can be connected to synchronizer
failure, such models would significantly simplify synchronizer development.
6.3 Future work
To predict the systems service life and to be able to avoid overload situations which
would lead to e.g. adhesive wear by connecting the simulated temperature from paper
B to damage and degradation mechanisms for a molybdenum synchronizer to predict
failure.
To predict the thermal degradation by connecting the simulated temperature from paper
B to damage and degradation mechanisms for a carbon lined synchronizer.
Updating the friction model to reflect synchronizer degradation based on number of
performed synchronizations.
Friction model for carbon lined synchronizers with a dedicated manual transmission
fluid.
34
Include effects on surface temperature from tolerances as well as temperature
distributions in the sliding direction.
6.4 Conclusions
Numerical models for simulating the pre-synchronization phase were developed. It was
shown that the pre-synchronization phase is highly dependent on the maneuvering
system, and that there exists a non-linear relationship between the maneuvering system
and oil film thickness at end of pre-synchronization. It was also shown that grooves in
the synchronizer surface have a positive effect on pre-synchronization.
A numerical model for simulating the main synchronization phase was developed. Two
parameters studies were performed to assess the effect on synchronizer surface
temperature caused by external loads as well as synchronizer design parameters. It was
shown that the rotational speed to synchronize is the most important load parameter,
and that the bulk geometry of the synchronizer only has a small contribution to the
interface temperature.
A methodology for validating thermomechanical simulations for the highly transient
main synchronization phase by combining several methods was developed and
presented. Surface temperature measurements were performed. Simulated surface
temperature for molybdenum synchronizer corresponds well with measured surface
temperature. For a carbon synchronizer, a correction factor based on surface roughness
is proposed and discussed.
A methodology for developing friction models was presented and exemplified with a
molybdenum coated synchronizer. The friction model show good agreement with
measured data. A simplified thermal model for simulating the average transient contact
temperature has been developed.
35
7 REFERENCES
[01] Ludanek, H., Sandgren, G., & Roos, F. (2015). Drivetrain Functions for Reduction of
CO₂-Emissions and higher Comfort in future Powertrain Concepts with an integrated
Approach. VDI-Berichte 2256 (pp. 3-20). Friedrichshafen: VDI Wissensforum
GmbH.
[02] Fontaras, G., Rexeis, M., Hausberger, S., Kies, A., Hammer, J., Schulte, L., . . . Dilara,
P. (2014). Development of a CO₂ certification and monitoring methodology for Heavy
Duty Vehicles - Proof of Concept report. Luxembourg: European Commission Joint
Research Centre.
[03] Leiserowitz, A. (2007). International public opinion, perception, and understanding of
global climate change. Human Development Report 2007/2008. UNDP.
[04] Robinette, D., & Wehrwein, D. (2015). Automatic Transmission Gear Ratio
Optimization and Monte Carlo Simulation of Fuel Consumption with Parasitic Loss
Uncertainty. SAE International Journal of Commercial Vehicles 8(1), 45-62.
[05] Xin, Q., & Pinzon, C. F. (2014). Alternative Fuels and Advanced Vehicle Technologies
for Improved Environmental Performance - Towards Zero Carbon Transportation.
Kidlington: Woodhead Publishing.
[06] Keidel, S., Wetzel, P., Biller, B., Bevan, K., & Birckett, A. (2012). Diesel Engine Fuel
Economy Improvement Enabled by Supercharging and Downspeeding. SAE
International Journal of Commercial Vehicles 5(2), 483-493.
[07] Stoltz, T., & Dorobantu, M. (2014, July 22). Transmission potential to contribute to CO2
reduction - 2020 and beyond line haul perspective. Workshop on Emerging
Technologies for Heavy-Duty Fuel Efficiency. Washington: American Council for an
Energy-Efficient Economy & International Council on Clean Transportation.
[08] Keski-Hynnila, D. (2014, July 22). Engine Downsizing and Downspeeding. Washington:
American Council for an Energy-Efficient Economy & International Council on
Clean Transportation.
[09] Freudenthaler, H., Hummer, O., & Zhu, B. (2013). Development of commercial vehicle
transmissions for Chinese market - potentials and risks. VDI-Berichte 2187 (pp. 499-
502). Friedrichshafen: VDI Wissensforum GmbH.
[10] Volvo Group Trucks. (2014, July 14). Volvo Trucks launches a unique gearbox for
heavy vehicles. Press release. Göteborg: Volvo Group Trucks.
[11] Moawad, A., & Rousseau, A. (2014). Impact of Transmission Technologies on Fuel
Efficiency to Support 2017-2025 CAFE Regulations. SAE Technical Paper 2014-01-
1082.
[12] Scania CV AB. (2014, September 23). Scania starts gearbox cooperation with MAN.
Press release. Södertälje: Scania CV AB.
[13] Scania CV AB. (2015, March 26). Scania Annual Report 2014. Södertälje.
[14] Andersson, M. (2014). Churning losses and efficiency in gearboxes. Licentiate Thesis,
KTH Royal Institute of Technology. Stockholm: Universitetsservice US AB.
[15] Hartono, E. A. (2014). Study of Fluid Flow Inside The Gearbox. Licentiate Thesis,
Chalmers University of Technology. Göteborg: Department of Applied Mechanics,
Chalmers University of Technology.
[16] Sosa, M. (2015). Running-in of gears from a surface transformation and efficiency point
of view. Licentiate Thesis, KTH Royal Institute of Technology. Stockholm:
Universitetsservice US AB.
36
[17] Mallipeddi, D., Norell, M., Nyborg, L., & Sosa, M. (2015). Stress distribution over gear
teeth after grinding, running-in and efficiency testing. VDI-Berichte 2255(2) (pp. 973-
984). Munich: VDI-Wissensforum GmbH.
[18] Muhammad, I., Berbyuk, V., & Johansson, H. (2015, September 7-10). Modelling of
Heavy Vehicle Transmission Synchronizer using Constrained Lagrangian Formalism.
Intl. Conf. Engineering Vibration. Ljubljana.
[19] European Commission. (1970, February 23). Directive 70/156/EEC, Annex 2. Retrieved
April 17, 2014
[20] United States Environmental Protection Agendy. (2012, November 14). Vehicle Weight
Classifications | Emission Standards Reference Guide. Retrieved April 27, 2015, from
US EPA: http://www.epa.gov/otaq/standards/weights.htm
[21] Thomke, S. (1998). Simulation, learning and R&D performance: Evidence from
automotive development. Research Policy 27(1), 55-74.
[22] Sellgren, U. (1994). Simulation driven design - Necessity and feasibility. Stockholm:
KTH Royal Institute of Technology.
[23] Baskin, D. M., Reed, D. B., Seel, T. N., Hunt, M. N., Oenkal, M., Takacs, Z., &
Vollmer, A. B. (2008). A case study in structural optimization of an automotive body-
in-white design. SAE Technical Paper No. 2008-01-0880.
[24] Will, J. (2007). State of the Art–robustness evaluation in CAE-based virtual prototyping
processes of automotive applications. Proceedings Optimization and Stochastic Days
4.0. Weimar.
[25] Wang, J., Liu, G., Chang, S., & Wu, L. (2015). Topology Optimization of Gearbox to
Reduce Radiated Noise. ASME 2015 Power Transmission and Gearing Conference.
Boston.
[26] Shim, S., Jang, J., & Pharr, G. (2008). Extraction of flow properties of single-crystal
silicon carbide by nanoindentation and finite-element simulation. Acta Materialia
56(15), 3824-3832.
[27] Sellgren, U. (1999). Simulation-driven design: motives, means, and opportunities, Ph.D.
Thesis. Stockholm, Sweden: KTH Royal Institute of Technology.
[28] Oberkampf, W. L., & Roy, C. J. (2010). Verification and validation in scientific
computing. New York: Cambridge University Press.
[29] Oberkampf, W. L., & Trucano, G. T. (2007). Verification and Validation Benchmarks.
Albuquerque: Sandia National Laboratories.
[30] Kleijnen, J. P. (1995). Verification and validation of simulation models. European
Journal of Operational Research 82, 145-162.
[31] Tadmor, E. (2012). A review of numerical methods for nonlinear partial differential
equations. Bulletin of the American Mathematical Society 49(4), 507-554.
[32] Ottosen, N., & Petersson, H. (1992). Introduction to the Finite Element Method. Harlow:
Pearson Education Limited.
[33] Yang, Y., & Shieh, M. (1990). Solution Method for Nonlinear Problems with Multiple
Critical Points. AIAA journal 28(12), 2110-2116.
[34] Butcher, J. C. (2003). Numerical Methods for Ordinary Differential Equations.
Cornwall: John Wiley & Sons.
[35] Hughes, T. J., Cottrell, J. A., & Bazilevs, Y. (2005). Isogeometric analysis: CAD, finite
elements, NURBS, exact geometry and mesh refinement. Computer methods in
applied mechanics and engineering 194(39), 4135-4195.
[36] Stribeck, R. (1902). Die wesentliche Eigenschaften der Gleit-und Rollenlager. VDI-
Zeitschrift 36, 1341-1348.
37
[37] Lu, X., Khonsari, M. M., & Gelinck, E. R. (2006). The Stribeck curve: experimental
results and theoretical prediction. Journal of tribology 128(4), 789-794.
[38] Phillips, L. (2011). Cars 1895-1965. Bloomington: Xlibris Corporation.
[39] Volvo Trucks Europe Division, Public Relations. (2010, November 1). Feature:
Technology comes full circle – history of the gearbox. Press information. Göteborg.
[40] Wirth, M. A. (2012). Schleppmomente in Synchronisierungen von Fahrzeuggetrieben.
Ph.D. Thesis. Technische Universität München. Munich.
[41] Stahl, K., Höhn, B. R., Pflaum, H., & Wirth, M. (2012). Function of synchronizer
systems at low temperatures. 15th International Conference on Experimental
Mechanics. Porto.
[42] Sykes, L. M. (1994). The Jaguar XJ220 Triple-Cone Synchronizer A Case Study. SAE
Technical Paper No. 940737.
[43] Lovas, L., Marialigeti, J., & Rigal, J. F. (2006). Mechanical behaviour simulation for
synchromech mechanism improvements. Proceedings of the Institution of Mechanical
Engineers, Part D: Journal of Automobile Engineering 220(7), 919-945.
[44] Ricardo UK Ltd. (2007). Ricardo Gearshift Quality Assessment Manual.
[45] Kim, J., Sung, D., Seok, C., Kim, H., Song, H., Lim, C., & Kim, J. (2002). Development
of Shift Feeling Simulator for a Manual Transmission. SAE Technical Paper 2002-01-
2202.
[46] Hoshino, H. (1998). Simulation of Synchronization Mechanism of Transmission
Gearbox. International ADAMS User Conference.
[47] Häggström, D., & Nordlander, M. (2011). Development of a Program for Calculating
Gearbox Synchronization. Master Thesis, Luleå University of Technology. Luleå.
[48] Liu, Y. C., & Tseng, C. H. (2007). Simulation and analysis of synchronisation and
engagement on manual transmission gearbox. International journal of vehicle design
43(1-4), 200-220.
[49] Socin, R. J., & Walters, L. K. (1986). Manual Transmission Synchronizers. Automotive
Engineering Congress. Detroit.
[50] Abdel-Halim, N. A., Barton, D. C., Crolla, D. A., & Selim, A. M. (2000). Performance
of multicone synchronizers for manual transmissions. Proceedings of the Institution of
Mechanical Engineers, Part D: Journal of Automobile Engineering, 214(1), 55-65.
[51] Walker, P. D., & Zhang, N. (2011). Parameter study of synchroniser mechanisms
applied to dual clutch transmissions. International Journal of Powertrains, 1(2), 198-
220.
[52] Back, O. (2013, January). Basics of Synchronizers.
[53] Neudörfer, S. (2008). Termomechanische Einflüsse auf die Tribologie von
Synchronisierungen. Ph.D. Thesis. Gottfried Wilhelm Leibniz Universität Hannover.
Hannover.
[54] Spreckels, M. (2001). Einfluss der Temperaturverteilung auf das tribologische Verhalten
von Synchronisierungen. Ph.D. Thesis. Universität Hannover. Hannover.
[55] Richer, E., & Hurmuzlu, Y. (2000). A high performance pneumatic force actuator
system: Part I - nonlinear mathematical model. Journal of dynamic systems,
measurement, and control 122(3), 416-425.
[56] Moir, G. B. (1995). An investigation into objective measures of gear-shift quality.
Proceedings of the Institution of Mechanical Engineers, Part D: Journal of
Automobile Engineering, 209(4), 273-279.
[57] Bóka, G., Márialigeti, J., Lovas, L., & Trencséni, B. (2010). Face dog clutch engagement
at low mismatch speed. Periodica Polytechnica Transportation Engineering 38(1),
29-35.
38
[58] The Coordinating European Council. (2014, August 1). Evaluation of the Synchromesh
Endurance Life using the FZG SSP 180 synchromesh test rig. L-66-99 Issue 5.1.
Brussels.
[59] SK Hydroautomation GmbH. (2007). Test rigs. Retrieved from Retrieved April 09,
2014: http://www.sk-hydroautomation.de/
[60] Ore, T. G., Nellums, R. A., & Skotnicki, G. (1995). Improved synchronizers for truck
transmissions. SAE Technical Paper No. 952602.
[61] Bouffet, A. (2004). Evaluating Tribology of Synchronizer for Today's Manual
Transmissions. SAE Technical Paper 2004-01-2022.
[62] Bóka, G. (2011). Shifting Optimization of Face Dog Clutches in Heavy Duty Automated
Mechanical Transmissions. Ph.D. Thesis. Budapest University of Technology and
Economics. Budapest.
[63] Scania CV AB. (2014, May 14). Freewheeling retarder reduces fuel consumption. Press
release. Södertälje.
[64] Liu, H., Lei, Y., Li, Z., Zhang, J., & Li, Y. (2012). Gear-Shift Strategy for a Clutchless
Automated Manual Transmission in Battery Electric Vehicles. SAE International
Journal of Commercial Vehicles 5(1), 57-62.
[65] Acuner, R., Völke, K., Pflaum, H., & Stahl, K. (2014). Influence of Cone-Angle-
Difference on Performance of Synchronizers with Carbon Friction Linings. VDI-
Berichte 2218 (pp. 595-610). Friedrichshafen: VDI Wissensforum GmbH.
[66] Marklund, P., Mäki, R., Larsson, R., Höglund, E., Khonsari, M. M., & Jang, J. (2007).
Thermal influence on torque transfer of wet clutches in limited slip differential
applications. Tribology International 40(5), 876-884.
[67] Marklund, P., & Larsson, R. (2008). Wet clutch friction characteristic obtained from
simplified pin on disc test. Tribology International 41(9-10), 824-830.