ON THE ANGULAR RESOLUTION OF THE AGILE GAMMA-RAY IMAGING DETECTOR
S. Sabatini1,2, I. Donnarumma
1,2, M. Tavani
1,2,3, A. Trois
4, A. Bulgarelli
5, A. Argan
1, G. Barbiellini
6, P. W. Cattaneo
7,
A. Chen8, E. Del Monte
1, V. Fioretti
5, F. Gianotti
5, A. Giuliani
9, F. Longo
6, F. Lucarelli
10, A. Morselli
2,3,
C. Pittori10, F. Verrecchia
10, and P. Caraveo
9
1 INAF/IAPS-Roma, I-00133 Roma, Italy2 INFN Roma Tor Vergata, I-00133 Roma, Italy
3 Dip. di Fisica, Univ. Tor Vergata, I-00133 Roma, Italy4 INAF-OAC, I-09012 Capoterra, Italy
5 INAF/IASF-Bologna, I-40129 Bologna, Italy6 Dipartimento di Fisica and INFN Trieste, I-34127 Trieste,Italy
7 INFN-Pavia, I-27100 Pavia, Italy8 School of Physics, 1 Jan Smits Av., Braamfontein 2000 Johannesburg, SouthAfrica
9 INAF/IASF-Milano, I-20133 Milano, Italy10 ASI Science Data Center, I-00044 Frascati, Roma, Italy
Received 2015 March 12; accepted 2015 June 26; published 2015 August 10
ABSTRACT
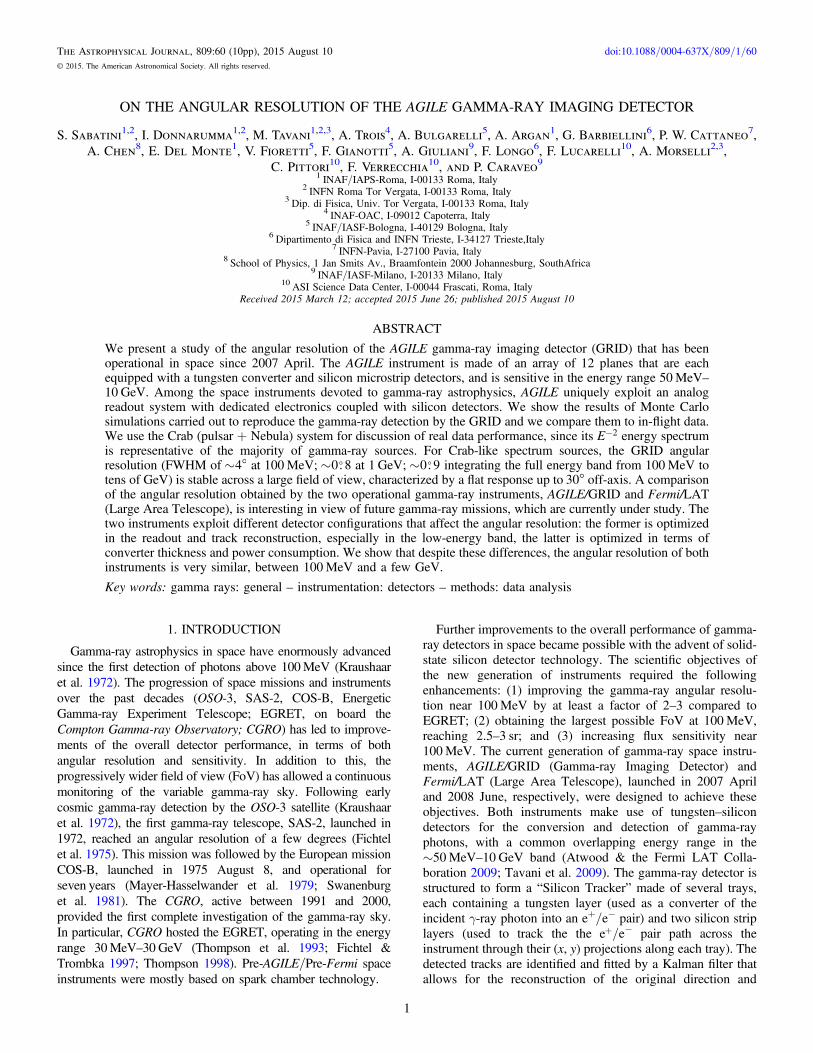
We present a study of the angular resolution of the AGILE gamma-ray imaging detector (GRID) that has beenoperational in space since 2007 April. The AGILE instrument is made of an array of 12 planes that are eachequipped with a tungsten converter and silicon microstrip detectors, and is sensitive in the energy range 50MeV–10 GeV. Among the space instruments devoted to gamma-ray astrophysics, AGILE uniquely exploit an analogreadout system with dedicated electronics coupled with silicon detectors. We show the results of Monte Carlosimulations carried out to reproduce the gamma-ray detection by the GRID and we compare them to in-flight data.We use the Crab (pulsar + Nebula) system for discussion of real data performance, since its E 2- energy spectrumis representative of the majority of gamma-ray sources. For Crab-like spectrum sources, the GRID angularresolution (FWHM of 4~ at 100MeV; 0. 8~ at 1 GeV; 0. 9~ integrating the full energy band from 100MeV totens of GeV) is stable across a large field of view, characterized by a flat response up to 30 off-axis. A comparisonof the angular resolution obtained by the two operational gamma-ray instruments, AGILE/GRID and Fermi/LAT(Large Area Telescope), is interesting in view of future gamma-ray missions, which are currently under study. Thetwo instruments exploit different detector configurations that affect the angular resolution: the former is optimizedin the readout and track reconstruction, especially in the low-energy band, the latter is optimized in terms ofconverter thickness and power consumption. We show that despite these differences, the angular resolution of bothinstruments is very similar, between 100MeV and a few GeV.
Key words: gamma rays: general – instrumentation: detectors – methods: data analysis
1. INTRODUCTION
Gamma-ray astrophysics in space have enormously advancedsince the first detection of photons above 100MeV (Kraushaaret al. 1972). The progression of space missions and instrumentsover the past decades (OSO-3, SAS-2, COS-B, EnergeticGamma-ray Experiment Telescope; EGRET, on board theCompton Gamma-ray Observatory; CGRO) has led to improve-ments of the overall detector performance, in terms of bothangular resolution and sensitivity. In addition to this, theprogressively wider field of view (FoV) has allowed a continuousmonitoring of the variable gamma-ray sky. Following earlycosmic gamma-ray detection by the OSO-3 satellite (Kraushaaret al. 1972), the first gamma-ray telescope, SAS-2, launched in1972, reached an angular resolution of a few degrees (Fichtelet al. 1975). This mission was followed by the European missionCOS-B, launched in 1975 August 8, and operational forseven years (Mayer-Hasselwander et al. 1979; Swanenburget al. 1981). The CGRO, active between 1991 and 2000,provided the first complete investigation of the gamma-ray sky.In particular, CGRO hosted the EGRET, operating in the energyrange 30MeV–30 GeV (Thompson et al. 1993; Fichtel &Trombka 1997; Thompson 1998). Pre-AGILE/Pre-Fermi spaceinstruments were mostly based on spark chamber technology.
Further improvements to the overall performance of gamma-ray detectors in space became possible with the advent of solid-state silicon detector technology. The scientific objectives ofthe new generation of instruments required the followingenhancements: (1) improving the gamma-ray angular resolu-tion near 100MeV by at least a factor of 2–3 compared toEGRET; (2) obtaining the largest possible FoV at 100MeV,reaching 2.5–3 sr; and (3) increasing flux sensitivity near100MeV. The current generation of gamma-ray space instru-ments, AGILE/GRID (Gamma-ray Imaging Detector) andFermi/LAT (Large Area Telescope), launched in 2007 Apriland 2008 June, respectively, were designed to achieve theseobjectives. Both instruments make use of tungsten–silicondetectors for the conversion and detection of gamma-rayphotons, with a common overlapping energy range in the∼50MeV–10 GeV band (Atwood & the Fermi LAT Colla-boration 2009; Tavani et al. 2009). The gamma-ray detector isstructured to form a “Silicon Tracker” made of several trays,each containing a tungsten layer (used as a converter of theincident γ-ray photon into an e+/e− pair) and two silicon striplayers (used to track the the e+/e− pair path across theinstrument through their (x, y) projections along each tray). Thedetected tracks are identified and fitted by a Kalman filter thatallows for the reconstruction of the original direction and
energy of the incident photon. The main source of contamina-tion in the detection of γ-ray photons is then by chargedparticle tracks, which can be confused with e+/e− pairs. Forthis reason, background rejection filters are used both on boardand on-ground, to process the data and obtain a finaldiscrimination and classification of the events.
An important parameter in the assessment of the overallinstrument scientific performance is the resulting angularresolution, i.e., the minimum distance at which two closesources are distinguished as separated. The point-spreadfunction (PSF) describes the response of an imaging instrumentto a point source and the angular resolution is usually describedby either the FWHM of the PSF radial profile or the 68%containment radius (CR68%) of the PSF. Key parameters of theinstrument configuration affecting the angular resolution ofγ-ray solid-state silicon detectors are:
1. the size of the silicon strips (the pitch) and the silicondetector readout system (e.g., either digital or analog),resulting in a different effective spatial resolution of theparticle trajectory due to charge coupling betweenadjacent silicon strips;
2. the distance between consecutive silicon planes that,combined with the spatial resolution, defines the limitingangular resolution;
3. the thickness of tungsten layers promoting gamma-rayphoton conversion, and at the same time inducingmultiple scattering that leads to a degradation of thecharged particle tracks; and
4. the reconstruction and event classification algorithms.
Table 4 in the appendix summarizes the main characteristicsof the AGILE and Fermi gamma-ray detectors, whoseconfigurations are different in several ways: the former isoptimized in the readout and track reconstruction, especially inthe low-energy band, and the latter is optimized in terms ofconverter thickness, geometrical area, and power consumption.An important difference between the two instruments, whichcan be crucial for the scientific performance of the instrument,is the readout system (analog for the AGILE/GRID and digitalfor Fermi/LAT).
In the following sections, we focus on the characterization ofthe AGILE/GRID angular resolution both from simulations andfrom in-flight data. In Section 2 we define the parameters thatare used across the paper to describe the instrument angularresolution; Section 3 describes the Monte Carlo (MC)simulation setup and data processing pipeline; Section 4 showsthe results from the MC simulations; Section 5 compares theresults of the simulation with the in-flight data angularresolution. This paper complements the work by Chen et al.(2013): here we focus on simulations characterizing the overallperformance of the GRID instrument, and in a special study ofCrab-like sources, the simulations that reproduce the behaviorof the majority of detected cosmic gamma-ray sources; we alsopresent a direct comparison of AGILE and Fermi in-flight datafor the Crab,1 and discuss the results concerning the angularresolution in terms of the different instrument configurations(Section 6), which can be crucial in the study of futuremissions.
2. THE ANGULAR RESOLUTION
For an imaging telescope, the response in terms of thereconstructed positions of a set of photons from a point-likesource in the sky defines its PSF. Since this function can beconsidered azimuthally symmetric in γ-ray telescopes forincidence angles within 30 as used in this paper, the effectof the dispersion can be described as a function of oneparameter: the angular distance α between reconstructed andnominal direction. Defining the PSF radial profile, P(α), as theprobability distribution per steradian of measuring an incomingphoton at a given angular distance α from its true direction, wetherefore have
d P dPSF 2 sin .( ) ( ) ( )a a p a a a=
In the following, we adopt two parameters that are widelyused in the literature to assess the angular resolution in terms ofthe “width” of the PSF (e.g., Thompson et al. 1993):
1. the FWHM of the probability distribution per steradian,P (a); and
2. the CR68% of the probability distribution, PSF(α).
The CR68% is strongly related to the source imagecompactness; since it takes into account the whole contributionof the source profile and is more affected by possible extendedtails. In contrast, the FWHM is mainly determined by thecentral core emission of the source.
3. SETUP AND DATA PROCESSING OF THE AGILESIMULATED DATA
In order to fully understand how the instrument configura-tion and the data analysis pipeline affect the final angularresolution of a gamma-ray telescope, we carried out dedicatedMC simulations of the AGILE/GRID, analyzing simulated datawith the same pipeline used to process in-flight data. Thesimulations were carried out using an available simulation tool(“GAMS,” GEANT AGILE MC Simulator; Cocco et al. 2002;Longo et al. 2002), implemented during the development phaseof the AGILE mission. The tool makes use of the GEANT3environment2 and takes into account all the main componentsof the AGILE instrument configuration: the spacecraft (bus)MITA and the AGILE payload, consisting of the CsI Mini-calorimeter, the silicon–tungsten Tracker, the Anticoincidencesystem, the X-ray detector (Super-AGILE), the thermal shield,the mechanical structure, and the lateral electronics boards. Thetool allows us to simulate a parallel front of a given directionfor both charged particles and/or photons and their interactionsacross the instruments. The spectral energy distribution of thefront can be monochromatic or with any given law. Thesimulated tracks are then processed by the DHSIM, the DataHandling SIMulator (Argan 2004; Argan et al. 2008), whichimplements the onboard algorithms for a first track reconstruc-tion, event classification, and background rejection (Giulianiet al. 2006). The DHSIM output is a data file in the same formatas the AGILE in-flight telemetry and can be processed usingthe same pipeline as that used for real data analysis. Furtherbackground rejection techniques are applied to the data on-ground, producing the final classification of the events. Thecurrently used filter for the scientific analysis of the AGILE/GRID data (“FM3.119”) was also used in this paper for theprocessing of the simulated data.
1 The case of the Vela pulsar has been addressed by Chen et al. (2013) and(Ackermann et al. 2013). 2 http://wwwasd.web.cern.ch/wwwasd/geant/index.html
2
The Astrophysical Journal, 809:60 (10pp), 2015 August 10 Sabatini et al.
Each simulation contains 2 × 10⁵ photons that cross thetracker and the data are analyzed with the same pipeline as forreal data. Typical efficiency after background rejection within30 off-axis angle is 30%~ , leaving therefore a set of
5 104~ ´ events classified as photons and used for ourcalculations in the paper.
4. THE ANGULAR RESOLUTION FOR SIMULATEDAGILE/GRID DATA
With the aim of investigating the dependence of thetelescope angular resolution upon the energy of incomingphotons and their incident direction in the FoV, we carried outsimulations of parallel fronts of photons by varying thoseparameters.
We describe the incident direction as the composition of azenith angle θ (i.e., the angular distance of the incoming photondirection from the vertical axis of the Tracker, also named theoff-axis angle) and an azimuthal angle ϕ (i.e., the angulardistance between a given axis in the instrument plane and theprojection of the incoming direction in the plane). Since thedetector response is mostly azimuthally symmetric, we expectthe main dependence to be upon θ. Simulations were carriedout for the following values of these angles: 1 , 30 , 50( )q =
3; 0 , 45( )f = . Two different sets of simulations wereperformed:
1. parallel fronts of monochromatic photons of energies 50,100, 200, 400, 1000, 5000MeV; and
2. parallel fronts of photons with a Crab-like photonspectrum of the type E 2.1- , in the energy range30MeV–50 GeV.
The simulated data are analyzed with the same pipeline asthat used for the real data. In particular, data were analyzedusing the most recent pipeline for the data processing(“BUILD21”) and instrument response functions (“I0023”).
4.1. Monochromatic Photons
Monochromatic simulated data can be used for an idealcharacterization of the instrument response and were simulatedfor different energies and different incident directions aspreviously described.According to the definitions given in Section 2, Tables 1 and
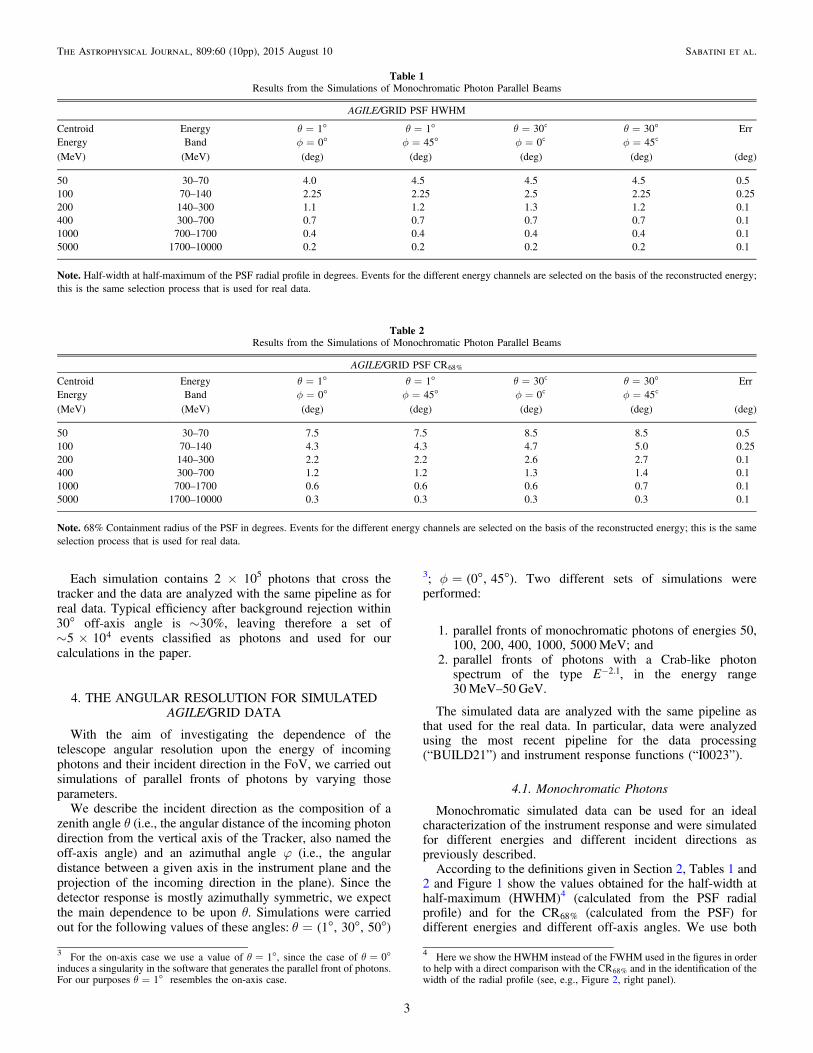
2 and Figure 1 show the values obtained for the half-width athalf-maximum (HWHM)4 (calculated from the PSF radialprofile) and for the CR68% (calculated from the PSF) fordifferent energies and different off-axis angles. We use both
Table 1Results from the Simulations of Monochromatic Photon Parallel Beams
Note. Half-width at half-maximum of the PSF radial profile in degrees. Events for the different energy channels are selected on the basis of the reconstructed energy;this is the same selection process that is used for real data.
Table 2Results from the Simulations of Monochromatic Photon Parallel Beams
Note. 68% Containment radius of the PSF in degrees. Events for the different energy channels are selected on the basis of the reconstructed energy; this is the sameselection process that is used for real data.
3 For the on-axis case we use a value of 1q = , since the case of 0q = induces a singularity in the software that generates the parallel front of photons.For our purposes 1q = resembles the on-axis case.
4 Here we show the HWHM instead of the FWHM used in the figures in orderto help with a direct comparison with the CR68% and in the identification of thewidth of the radial profile (see, e.g., Figure 2, right panel).
3
The Astrophysical Journal, 809:60 (10pp), 2015 August 10 Sabatini et al.
parameters for simplifying the comparison with previouspapers, related both to gamma rays or to other wavelengths.In the rest of the paper we prefer adopting the FWHM todescribe the angular resolution of the instruments in order to bemore compliant with the definition in the multi-frequencydomain.
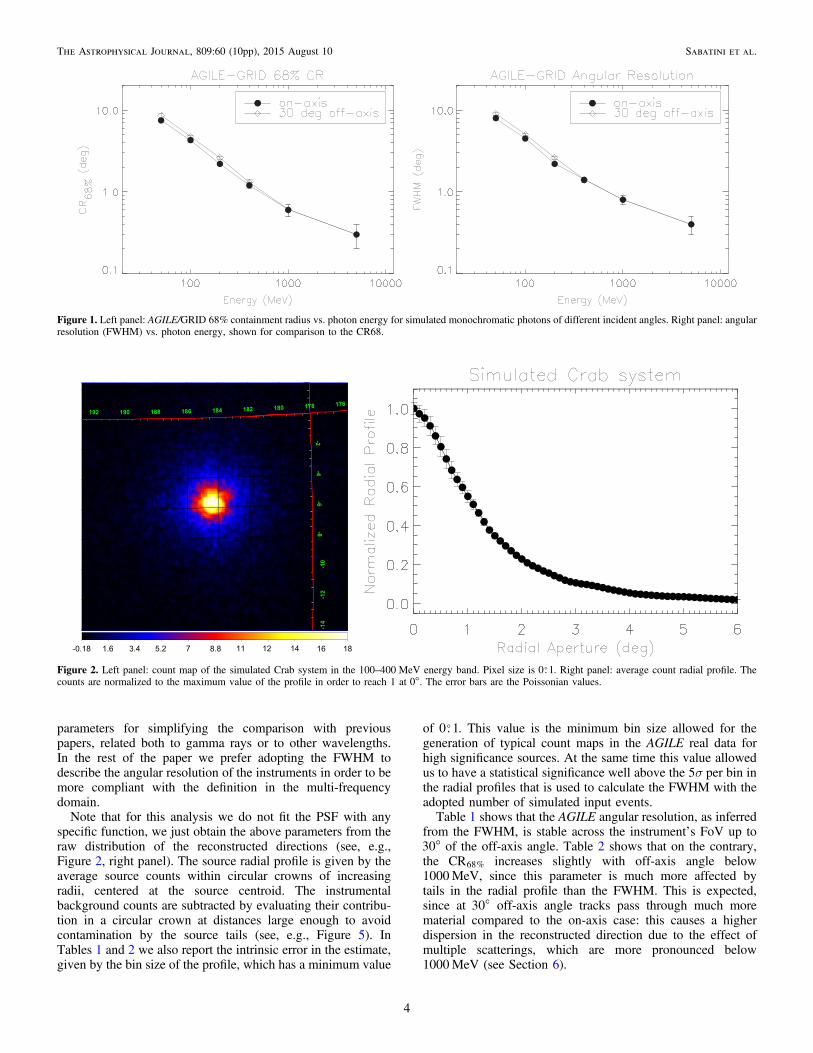
Note that for this analysis we do not fit the PSF with anyspecific function, we just obtain the above parameters from theraw distribution of the reconstructed directions (see, e.g.,Figure 2, right panel). The source radial profile is given by theaverage source counts within circular crowns of increasingradii, centered at the source centroid. The instrumentalbackground counts are subtracted by evaluating their contribu-tion in a circular crown at distances large enough to avoidcontamination by the source tails (see, e.g., Figure 5). InTables 1 and 2 we also report the intrinsic error in the estimate,given by the bin size of the profile, which has a minimum value
of 0. 1 . This value is the minimum bin size allowed for thegeneration of typical count maps in the AGILE real data forhigh significance sources. At the same time this value allowedus to have a statistical significance well above the 5σ per bin inthe radial profiles that is used to calculate the FWHM with theadopted number of simulated input events.Table 1 shows that the AGILE angular resolution, as inferred
from the FWHM, is stable across the instrument’s FoV up to30 of the off-axis angle. Table 2 shows that on the contrary,the CR68% increases slightly with off-axis angle below1000MeV, since this parameter is much more affected bytails in the radial profile than the FWHM. This is expected,since at 30 off-axis angle tracks pass through much morematerial compared to the on-axis case: this causes a higherdispersion in the reconstructed direction due to the effect ofmultiple scatterings, which are more pronounced below1000MeV (see Section 6).
Figure 1. Left panel: AGILE/GRID 68% containment radius vs. photon energy for simulated monochromatic photons of different incident angles. Right panel: angularresolution (FWHM) vs. photon energy, shown for comparison to the CR68.
Figure 2. Left panel: count map of the simulated Crab system in the 100–400 MeV energy band. Pixel size is 0. 1 . Right panel: average count radial profile. Thecounts are normalized to the maximum value of the profile in order to reach 1 at 0. The error bars are the Poissonian values.
4
The Astrophysical Journal, 809:60 (10pp), 2015 August 10 Sabatini et al.
4.2. Simulations of Crab-like Sources
Simulations of Crab-like spectrum sources were carried outas previously described and as an example, Figure 2 shows acount map obtained from the MC simulated data for the100–400MeV energy band at the 30 , 0( ) incident direction(left panel) and the average radial profile of the source (rightpanel). The map was obtained by the simulated event list usingthe same pipeline as that for producing real data maps.
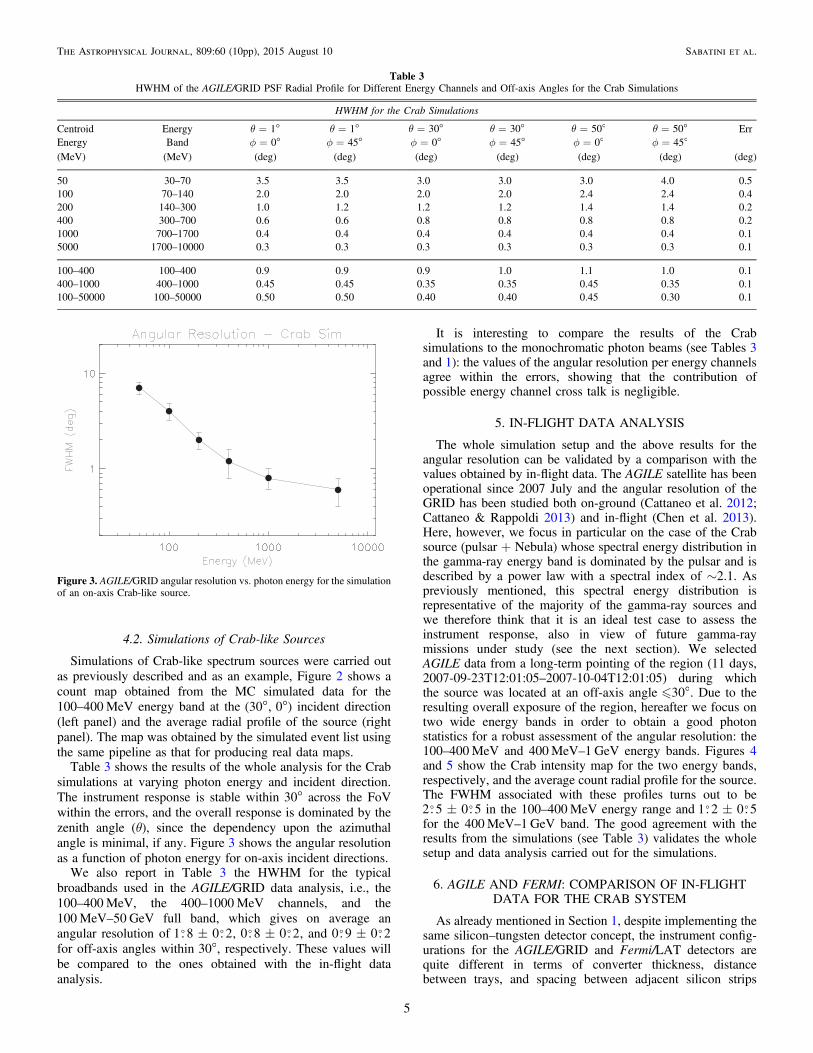
Table 3 shows the results of the whole analysis for the Crabsimulations at varying photon energy and incident direction.The instrument response is stable within 30 across the FoVwithin the errors, and the overall response is dominated by thezenith angle (θ), since the dependency upon the azimuthalangle is minimal, if any. Figure 3 shows the angular resolutionas a function of photon energy for on-axis incident directions.
We also report in Table 3 the HWHM for the typicalbroadbands used in the AGILE/GRID data analysis, i.e., the100–400MeV, the 400–1000MeV channels, and the100MeV–50 GeV full band, which gives on average anangular resolution of 1. 8 0. 2 , 0. 8 0. 2 , and 0. 9 0. 2
for off-axis angles within 30, respectively. These values willbe compared to the ones obtained with the in-flight dataanalysis.
It is interesting to compare the results of the Crabsimulations to the monochromatic photon beams (see Tables 3and 1): the values of the angular resolution per energy channelsagree within the errors, showing that the contribution ofpossible energy channel cross talk is negligible.
5. IN-FLIGHT DATA ANALYSIS
The whole simulation setup and the above results for theangular resolution can be validated by a comparison with thevalues obtained by in-flight data. The AGILE satellite has beenoperational since 2007 July and the angular resolution of theGRID has been studied both on-ground (Cattaneo et al. 2012;Cattaneo & Rappoldi 2013) and in-flight (Chen et al. 2013).Here, however, we focus in particular on the case of the Crabsource (pulsar + Nebula) whose spectral energy distribution inthe gamma-ray energy band is dominated by the pulsar and isdescribed by a power law with a spectral index of ∼2.1. Aspreviously mentioned, this spectral energy distribution isrepresentative of the majority of the gamma-ray sources andwe therefore think that it is an ideal test case to assess theinstrument response, also in view of future gamma-raymissions under study (see the next section). We selectedAGILE data from a long-term pointing of the region (11 days,2007-09-23T12:01:05–2007-10-04T12:01:05) during whichthe source was located at an off-axis angle 30 . Due to theresulting overall exposure of the region, hereafter we focus ontwo wide energy bands in order to obtain a good photonstatistics for a robust assessment of the angular resolution: the100–400MeV and 400MeV–1 GeV energy bands. Figures 4and 5 show the Crab intensity map for the two energy bands,respectively, and the average count radial profile for the source.The FWHM associated with these profiles turns out to be2. 5 0. 5 in the 100–400MeV energy range and 1. 2 0. 5 for the 400MeV–1 GeV band. The good agreement with theresults from the simulations (see Table 3) validates the wholesetup and data analysis carried out for the simulations.
6. AGILE AND FERMI: COMPARISON OF IN-FLIGHTDATA FOR THE CRAB SYSTEM
As already mentioned in Section 1, despite implementing thesame silicon–tungsten detector concept, the instrument config-urations for the AGILE/GRID and Fermi/LAT detectors arequite different in terms of converter thickness, distancebetween trays, and spacing between adjacent silicon strips
Table 3HWHM of the AGILE/GRID PSF Radial Profile for Different Energy Channels and Off-axis Angles for the Crab Simulations
Figure 3. AGILE/GRID angular resolution vs. photon energy for the simulationof an on-axis Crab-like source.
5
The Astrophysical Journal, 809:60 (10pp), 2015 August 10 Sabatini et al.
(see Table 4). In the case of the AGILE/GRID, the silicontracker is composed of 10 tungsten converter planes ofhomogeneous thickness (0.07 radiation length each), plus twoadditional planes without a converter (for a total of 12 planes);the overall GRID radiation length is ∼1X (Barbielliniet al. 2002; Prest et al. 2003). The Fermi/LAT has 12 tungstenplanes of ∼0.03 radiation length thickness (“LAT-front”) andan additional set of four tungsten planes of 0.18 radiationlength (“LAT-back”), plus two planes without a converter(Atwood & the Fermi LAT Collaboration 2009). In bothinstruments, each tungsten plane is interleaved with two layersof silicon strip detectors that are sensitive to charged particlesand are used for the x, y positioning of the e+/e− pair trackresulting from the pair conversion. The ratio of strip pitch to
vertical spacing between tracker planes is 0.007 for both Fermi/LAT and AGILE/GRID.An important difference between the two instruments is the
silicon tracker readout system, which is analog for AGILE/GRID and digital for Fermi/LAT. Barbiellini et al. (2002) andPrest et al. (2003) extensivelydescribe the GRID’s dedicatedfront-end electronics, characterizing the effective spatialresolution for particle incidence between 0 and 30 andcomparing the performances of digital and analog readouts.Although the GRID analog readout is structured to read onlyodd-numbered strips with no signal pickup at even-numberedstrips (“floating strip readout”), the capacitive couplingbetween adjacent strips allows us to obtain a completesampling of the particle hit positions, discriminating between
Figure 5. Left panel: AGILE/GRID count map of the Crab system (pulsar + Nebula) in the 400–1000 MeV energy band. Right panel: average count radial profile:blue data points are in-flight data, while the gray shaded region shows the profile of the simulated crab system with errors. The counts are normalized to the maximumvalue of the profile in order to reach 1 at 0.
Figure 4. Left panel: AGILE/GRID count map of the Crab system (pulsar + Nebula) for the period 2007-09-23T12:01:05-2007-10-04T12:01:05 in the 100–400 MeVenergy band; the white circle shows the maximum aperture (6) used to produce the radial profile of the source shown in the right panel; green circles show the crownregion used to estimate the background emission (7 °. 5–8 °. 5 radius). Right panel: average count radial profile: blue data points are the in-flight data, while the grayshaded region shows the profile for the simulated crab system with errors. The counts are normalized to the maximum value of the profile in order to reach 1 at 0. Thesource in the upper left corner is Geminga.
6
The Astrophysical Journal, 809:60 (10pp), 2015 August 10 Sabatini et al.
hits involving directly read and unread microstrips. Typically,each particle hit is characterized by a signal spread out overseveral adjacent readout-strips (a “cluster”). GRID eventsproduce energy deposition histograms per cluster, which arevery well characterized and typically result in 2–3 triggeredstrips depending on off-axis angle (Fedel et al. 2000;Barbiellini et al. 2002). Note that also for on-axis incidence,a cluster is composed of a minimum of two strips. The effectivespatial resolution obtained by the GRID for particle incidencebetween 0 and 30 is 40 msd m~ , substantially less than thesilicon microstrip size of 121 mm (see Figure 15 in Barbielliniet al. 2002). The advantage of the analog versus the digitalreadout for the resulting spatial resolution of silicon stripdetectors is discussed in Barbiellini et al. 2002 for the AGILEtracker configuration, showing an improvement of a factor of 2(i.e., 40 msd m~ versus 80 msd m~ ).
The Fermi/LAT system is based on a digital readout. TheLAT Tracker is non-homogeneous and is characterized by twodifferent values for the angular resolution, one for the “LAT-front” and the other for the “LAT-back” (Ackermannet al. 2013). In the following, we only use LAT-front datafor comparison with the AGILE/GRID, proving the bestangular resolution for Fermi. Also note that Fermi usuallyoperates in scanning mode, with sources observed most of thetime at large off-axis angles, with a consequent degradation of
the angular resolution for a given source, compared to the on-axis performance.In order to compare the angular resolution of the two
instruments at similar conditions, we selected Fermi data of theCrab system in pointing mode. We therefore analyzed acomparable set of data, with an exposure ensuring similarphoton statistics and with both gamma-ray detectors in pointingmode. The AGILE data in pointing mode5 that was used for thiscomparison are the data described in Section 5. The Fermi dataconsist of 4 days of integration in the period 2012-07-04T23:24:44–2012-07-08T10:44:43 during which the satellitewas stably pointing at the Crab following a gamma-ray flaringepisode, with the source located at 10 of the off-axis angle inthe FoV. We used the best available quality cut for the Fermidata, (the“ULTRA-CLEAN” event class, LAT-front photons,P7REP) in order to optimize the angular resolution of the data.We focus on the analysis of two representative energy bandsfor AGILE in order to have robust statistics for bothinstruments: 100–400MeV and 400–1000MeV.Figure 7 shows the intensity maps for the two gamma-ray
telescopes in the two energy bands and Figure 8 shows thecorresponding radial profiles. The resulting angular resolutiondeduced from the in-flight data are the same, even though the
Figure 6. Comparison of the expected limiting values for the angular resolution (dot–dashed cyan line) to the measured ones (red points). Left panel: AGILE/GRIDsimulated Crab data. Right panel: Fermi/LAT PSF68 (http://www.slac.stanford.edu/exp/glast/groups/canda/lat_Performance.htm). Top panels: the overall limitingangular resolution is plotted in cyan and is obtained by the combination of: (1) the ratio of the spatial resolution to the distance of consecutive trays (dashed blue line);and (2) the multiple scattering limit (red dot–dashed line). Bottom panels: percentage deviation of the measured angular resolution from the overall expected limitingvalue.
5 An analysis of AGILE/GRID data in “spinning mode” will be discussed in aforthcoming paper by F. Lucarelli et al. (2015, in preparation).
7
The Astrophysical Journal, 809:60 (10pp), 2015 August 10 Sabatini et al.
AGILE data show a more pronounced non-Gaussian tail, due tothe converter thickness: the FWHM is 2. 5 0. 5 and1. 2 0. 5 in the energy ranges 100–400MeV and400MeV–1 GeV, respectively.
As already mentioned, several factors determine theinstrument angular resolution as a function of gamma-rayphoton energy, including: (1) multiple scattering; (2) theeffective spatial resolution; (3) the photon energy reconstruc-tion; (4) specific particle track reconstruction algorithms; and(5) quality cuts. Figure 6 shows the relative contribution ofthese factors as a function of energy for both trackers, AGILEand Fermi. Regarding the multiple scattering, we assume aneffective radiation length per tray of 0.085 and 0.04 for AGILE/
GRID and Fermi/LAT, respectively, taking into account thecontributions of the tungsten converter and the supportingmaterial.6 The top panels show that the multiple scatteringeffect dominates the overall angular resolution up to 700MeVand 350MeV for the two instruments. The bottom panels showthe percentage deviation of the measured angular resolution tothe overall expected limiting value. The amplitude of thedeviation quantifies the reconstruction accuracy, which is
Figure 7. AGILE/GRID (left panels) and Fermi/LAT (right panels) in-flight count maps for the Crab region in the 100–400 MeV and 400–1000 MeV energy bands,respectively. The pixel size is 0. 25 . Note that the color intensity scale is set so that each map has the maximum value of the scale corresponding to the Crab peakcounts.
6 In the case of AGILE the effective radiation length due to the supportingmaterial for each tray is X0.015~
from laboratory measurements; since Fermihas a similar tray structure (Atwood & the Fermi LAT Collaboration 2009) weassume a similar contribution of X0.01~
.
8
The Astrophysical Journal, 809:60 (10pp), 2015 August 10 Sabatini et al.
optimized in different energy ranges for the two instruments:the accuracy is below 40% up to 400MeV in the case ofAGILE and above 2 GeV in the case of Fermi. Besides thedifferent tracker configuration, crucial features distinguishingthe two instruments and affecting the final reconstructionaccuracy are the effective spatial resolution and the quality ofthe reconstruction algorithms.7 Therefore we believe that inview of future gamma-ray missions (e.g., Galper et al. 2013;Morselli et al. 2013) the optimization of the angular resolutionshould not only rely on a reduced converter thickness, but alsoon the implementation of an analog readout system if the powerbudget allows it, together with an optimization of thereconstruction algorithms.
7. CONCLUSIONS
The current generation of gamma-ray space instruments isbased on silicon detector technology and associated electronics.Both AGILE/GRID and Fermi/LAT show a quite stableperformance in orbit, which is the basis for prolongedoperations (AGILE is in its 9th year of life in space and Fermiis in its 8th year). Compared to the previous generation, theinstrument performance improvements both in terms ofsensitivity and angular resolution are well established.
In this paper, we summarized the main results concerning theGRID angular resolution, a crucial feature of the AGILEinstrument, on the basis of the scientific performance of agamma-ray detector together with its FoV and backgroundrejection capabilities at energies below 400MeV, allowing forthe best exploitation of the instrument configuration. Weshowed that the AGILE/GRID angular resolution is optimizedgiven the overall characteristics of the detector and allows forstate-of-the-art mapping of Galactic and extragalactic regions/sources: the FWHM for off-axis angles in the range of 0°–30°is 4~ at 100MeV, and 0. 8~ at 1 GeV. The angular resolutionis quite uniform in the FoV up to 30 off-axis. The FWHMobtained from in-flight data in pointing mode is 2. 5 , in therange of 100–400MeV, and 1. 2~ in the 400MeV–1 GeV.
Although the AGILE/GRID multiple scattering due to theheavy converter is relatively high, we have proved that acrucial role is played by the optimization of the readout system(analog) of the silicon tracker and of the particle trackreconstruction algorithms.8
The GRID angular resolution as a function of gamma-rayenergies is shown in Figure 1 as resulting from simulations.These values are in good agreement with those deduced fromin-flight data as demonstrated in this paper for Crab-likesources.Furthermore, by a direct comparison of in-flight data of the
Crab system, we find that despite the differences in structure,geometry, readout system, and overall size, the AGILE/GRIDand Fermi/LAT-front show similar angular resolutions atenergies between 100MeV and 1 GeV, due to differentoptimizations of the readout systems and reconstructionalgorithms.
We acknowledge several discussions with our colleagues ofthe Fermi Team. The AGILE mission is funded by the ItalianSpace Institute (ASI), with scientific and programmaticparticipation by the Italian Institute of Astrophysics (INAF)and the Italian Institute of Nuclear Physics (INFN). Ourresearch is partially supported by ASI grants I/042/10/0,I/028/12/0, and I/028/12/02. We would like to thank thereferee for the careful review and for providing valuablecomments that helped to improve the contents of this paper.
APPENDIXTHE AGILE/GRID VERSUS FERMI/LAT
AGILE is an ASI Small Scientific Mission (Tavani et al.2009) with a total weight of 320 kg. It carries a scientificinstrument dedicated to high-energy astrophysics whose heartis the GRID. Complementary items are the imaging Super-
Figure 8. Average count radial profiles for circular apertures of increasing radii at steps of 0. 25 of the Crab (pulsar + Nebula); in-flight data for the AGILE/GRID(blue data points) and Fermi/LAT (red data points). Left panel: 100–400 MeV energy range. Right panel: 400–1000 MeV energy range.
7 Note that ongoing developments for the track reconstruction algorithms andevent classifications for both AGILE (updated FM filter) and Fermi/LAT(PASS8) may lead to further improvements of the current angular resolution.
8 It is interesting to note that the AGILE Tracker configuration is quite similarto the basic element of the gamma-ray instrument currently under study for theGAMMA-400 mission (Galper et al. 2013). The analog readout of a silicontracker with AGILE-like characteristics is required to optimize the angularresolution with a thick converter (which in the case of GAMMA-400 iscurrently designed to be X0.08~
per plane).
9
The Astrophysical Journal, 809:60 (10pp), 2015 August 10 Sabatini et al.
AGILE detector, which is sensitive in the range 20–60 keV(Feroci et al. 2007), the Mini-calorimeter (Labanti et al. 2006),and the Anticoincidence system (Perotti et al. 2006). AGILEwas launched in 2007 April and is operational in an equatorialorbit of an average height of 530 km.
Fermi is a NASA mission of a large class with a broadinternational Collaboration. Its imaging gamma-ray instrumentis based on a 16-unit Tracker (LAT; Atwood & the Fermi LATCollaboration 2009), which is complemented by a massiveCalorimeter and an Anticoincidence system. Fermi waslaunched in 2008 June in an orbit with inclination of 25 andan average height of 550–600 km.
Table 4 summarizes the main parameters of the twoinstrument configurations, which are relevant for the angularresolution determination.
REFERENCES
Ackermann, M., Ajello, M., Allafort, A., et al. 2013, ApJ, 769, 54Argan, A., et al. 2004, in Proc. IEEE-NSS, 1, 371Argan, A., Tavani, M., Trois, A., et al. 2008, in NSS IEEE (IEEE), 774Atwood, W. B. & the Fermi LAT Collaboration 2009, ApJ, 697, 1070Barbiellini, G., Fedel, G., Liello, F., et al. 2002, NIMPA, 490, 146Cattaneo, P. W., Argan, A., Boffelli, A., et al. 2012, NIMPA, 674, 55Cattaneo, P. W., & Rappoldi, P. 2013, NIMPB, 239, 241Chen, A., Argan, A., Bulgarelli, A., et al. 2013, A&A, 558, 37Cocco, V., Longo, F., & Tavani, M. 2002, NIMPA, 486, 623Fedel, G., Barbiellini, G., Liello, F., et al. 2000, Proc. SPIE, 4140, 274Feroci, M., Costa, E., Soffitta, P., et al. 2007, NIMPA, 581, 728Fichtel, C. E., Hartman, R. C., Kniffen, D. A., et al. 1975, ApJ, 198, 163Fichtel, C. E., & Trombka, J. I. 1997, Gamma-Ray Astrophysics, Vol. 1386
(NASA Reference Publication)Galper, A. M., et al. 2013, in Proc. Int. Cosmic-Ray Conf. arXiv:1306.6175Giuliani, A. 2003, The Kalman Algorithm for the AGILE Mission, PhD thesis,
Univ. MilanGiuliani, A., Cocco, V., Mereghetti, S., Pittori, C., & Tavani, M. 2006,
NIMPA, 568, 692Hartman, R. C., Bertsch, D. L., Bloom, S. D., et al. 1999, ApJS, 123, 79Kraushaar, W. L., Clark, G. W., Garmire, G. P., et al. 1972, ApJ, 177, 341Labanti, C., Marisaldi, M., Fuschino, F., et al. 2006, Proc. SPIE, 6266, 62663Longo, F., Cocco, V., & Tavani, M. 2002, NIMPA, 486, 610Mayer-Hasselwander, H. A., Kanbach, G., Sieber, W., et al. 1979, ICRC,
1, 206Morselli, A., Argan, A., Barbiellini, G., et al. 2013, NuPhS, 239, 193Perotti, F., Fiorini, M., Incorvaia, S., Mattaini, E., & Sant’Ambrogio, E. 2006,
NIMPA, 556, 228Prest, M., Barbiellini, G., Bordignon, G., et al. 2003, NIMPA, 501, 280Swanenburg, B. N., Bennett, K., Bignami, G. F., et al. 1981, ApJ, 243, 69Tavani, M., Barbiellini, G., Argan, A., et al. 2009, A&A, 502, 995Thompson, D. J., Bertsch, D. L., Fichtel, C. E., et al. 1993, ApJS, 86, 629Thompson, D. J., et al. 1998, Proc. 4th CGRO Symp., AIP Conf. Ser., 410, 39Yang, H. J., Roe, B. P., & Zhu, J. 2005, NIMPA, 555, 370
Table 4A Comparison Between the AGILE/GRID and Fermi/LAT
Parameter AGILE/GRID Fermi/LAT
Number of towers 1 16Total number of Tracker planes 12 18Vertical spacing (s) between adjacent
planes1.8 cm 3.2 cm
Silicon tile size 9.5 × 9.5 cm2 8.95 × 8.95 cm2
Silicon detector array for each plane 4 × 4 4 × 4Silicon-strip pitch ( Pd ) 121 mm 228 mmReadout pitch 242 mm 228 mmSignal readout analog digitalRatio sPd 0.007 0.007
Tungsten converter thickness per plane 0.07 Xo 0.03 Xo (front)0.18 (back)
Number of planes with W converter 10 12 (front)4 (back)
On-axis total radiation length 0.9 0.5 (front)0.8 (back)
Total n. of readout channels 36,864 884,736Power consumption/channels 400 μW 180 μW
10
The Astrophysical Journal, 809:60 (10pp), 2015 August 10 Sabatini et al.