61
On the Causes of On the Causes of Species Species Jody Hey Jody Hey Rutgers University Rutgers University

On the Causes of SpeciesOn the Causes of Species
Jody HeyJody Hey
Rutgers UniversityRutgers University


We need to understand species• We can’t understand biological diversity We can’t understand biological diversity
without understanding what species are without understanding what species are and how they come into beingand how they come into being
• ConservationConservation– We need to preserve biological diversityWe need to preserve biological diversity– Individual species, and species diversity, Individual species, and species diversity,
are key biomarkers are key biomarkers • Many people’s careers, not just biologists, Many people’s careers, not just biologists,
depend on understanding some part of depend on understanding some part of biological diversitybiological diversity– medicine, agriculture, horticulture, medicine, agriculture, horticulture,
tourismtourism

• For each question, present a way of For each question, present a way of approaching the answerapproaching the answer
• While addressing three different While addressing three different questions, develop a statistical, questions, develop a statistical, population genetic approach to population genetic approach to understanding species understanding species
• The first question is fairly specific The first question is fairly specific and narrowand narrow
• Later questions are more generalLater questions are more general
Ask a series of questions

Questions about species?Questions about species?
1.1. How much gene exchange goes on How much gene exchange goes on during speciation? during speciation?
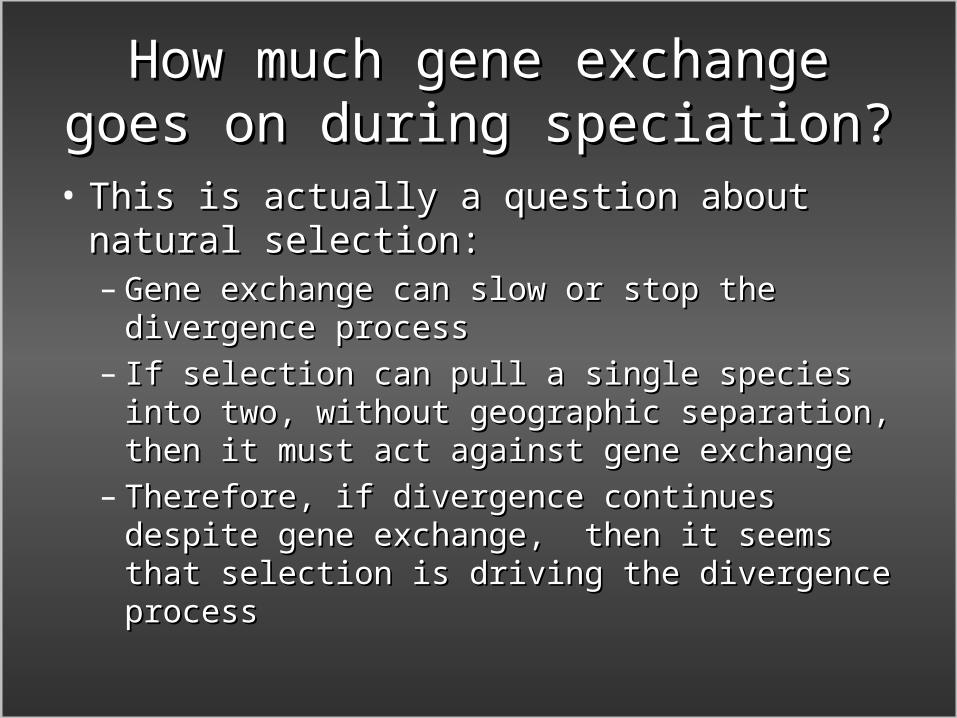
How much gene exchange How much gene exchange goes on during speciation? goes on during speciation?
• This is actually a question about This is actually a question about natural selection:natural selection:– Gene exchange can slow or stop the Gene exchange can slow or stop the
divergence processdivergence process– If selection can pull a single species into If selection can pull a single species into
two, without geographic separation, then two, without geographic separation, then it must act against gene exchangeit must act against gene exchange
– Therefore, if divergence continues despite Therefore, if divergence continues despite gene exchange, then it seems that gene exchange, then it seems that selection is driving the divergence processselection is driving the divergence process

Darwin’s Darwin’s Principle of DivergencePrinciple of Divergence
• Darwin thought Darwin thought that a single that a single species in one species in one large population large population could diverge, via could diverge, via the action of the action of natural selection, natural selection, into two separate into two separate speciesspecies
Darwin (1859)Darwin (1859)

Darwin’s Principle of Divergence
• More individuals in a species can be More individuals in a species can be successful if they vary in their form and successful if they vary in their form and lifestylelifestyle
• In a large population, over a wide area, In a large population, over a wide area, natural selection can lead to larger natural selection can lead to larger variations among the individuals of a variations among the individuals of a speciesspecies
• These variations can become the basis for These variations can become the basis for new species being formed, due to natural new species being formed, due to natural selection acting in different ways on large selection acting in different ways on large populations populations
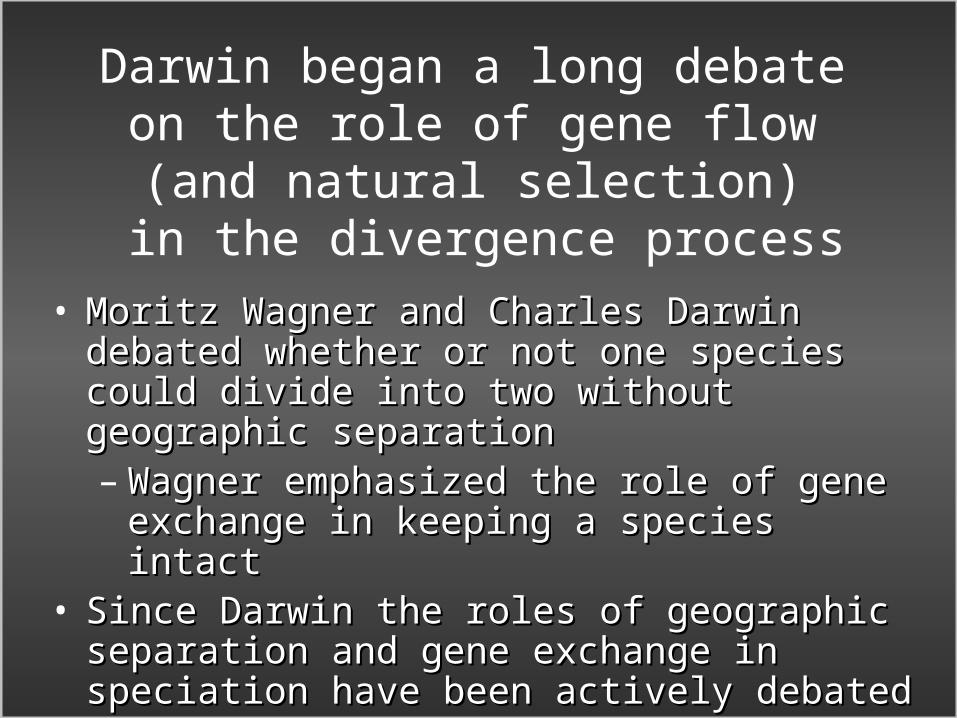
Darwin began a long debate on the role of gene flow (and natural selection)
in the divergence process• Moritz Wagner and Charles Darwin debated Moritz Wagner and Charles Darwin debated
whether or not one species could divide into whether or not one species could divide into two without geographic separationtwo without geographic separation– Wagner emphasized the role of gene Wagner emphasized the role of gene
exchange in keeping a species intactexchange in keeping a species intact• Since Darwin the roles of geographic Since Darwin the roles of geographic
separation and gene exchange in speciation separation and gene exchange in speciation have been actively debatedhave been actively debated– Allopatric versus Sympatric speciationAllopatric versus Sympatric speciation

Building a statistical model of divergence
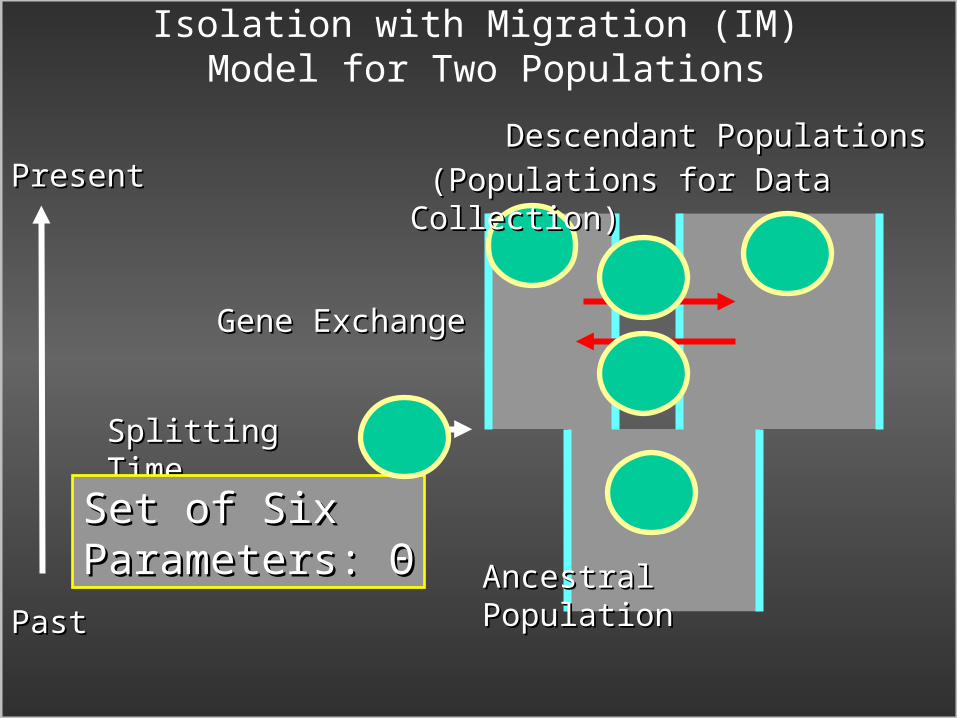
Isolation with Migration (IM) Model for Two Populations
PastPast
PresentPresent
Ancestral PopulationAncestral Population
Descendant PopulationsDescendant Populations
Splitting TimeSplitting Time
Gene ExchangeGene Exchange
NNAA
tt
NN11 NN22mm11
mm22
Set of Six Set of Six Parameters: Parameters: ΘΘ
(Populations for Data Collection)(Populations for Data Collection)
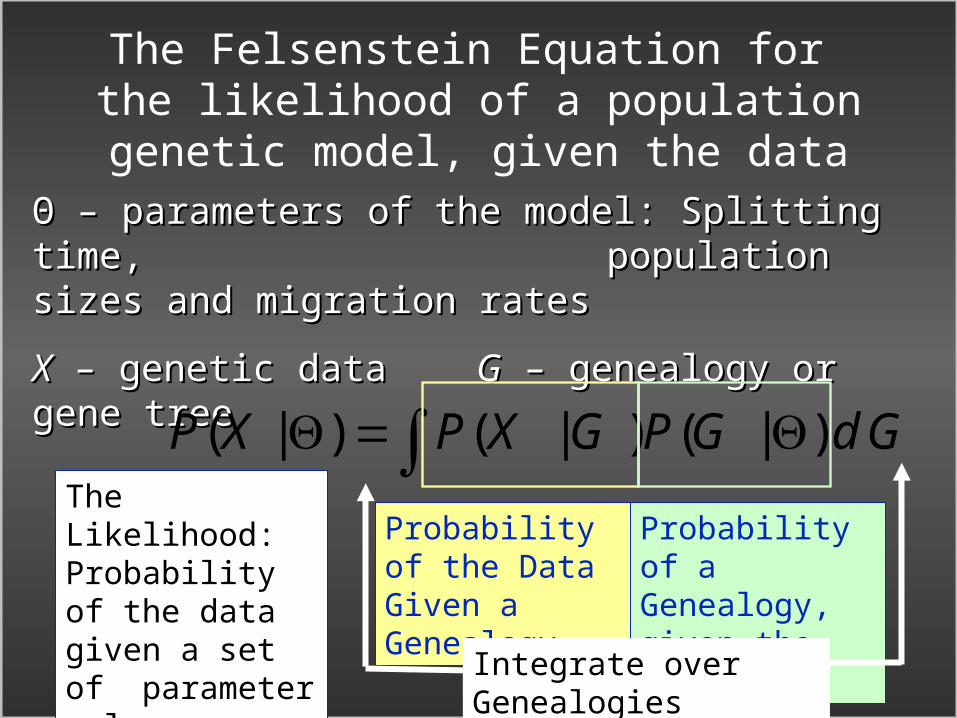
Θ – parameters of the model: Splitting time, Θ – parameters of the model: Splitting time, population sizes and migration ratespopulation sizes and migration rates
XX – genetic data – genetic data GG – genealogy or gene tree – genealogy or gene tree
The Likelihood: Probability of the data given a set of parameter values
The Felsenstein Equation for the likelihood of a population genetic
model, given the data
Probability of the Data Given a Genealogy
Probability of a Genealogy, given the Parameters
GdGPGXPXP )|()|()|(
Integrate over Genealogies

Nielsen & Wakeley (2001) Applied the the Felsenstein Equation to the Isolation-Applied the the Felsenstein Equation to the Isolation-
with-Migration model. Developed a Bayesian approach with-Migration model. Developed a Bayesian approach using Markov Chain Monte Carlo (MCMC) to sample using Markov Chain Monte Carlo (MCMC) to sample model parameters from the posterior distributionmodel parameters from the posterior distribution
•Assume: (1) selective neutrality, Assume: (1) selective neutrality, (2) no recombination within loci, (3) (2) no recombination within loci, (3) free recombination between locifree recombination between loci
•Results are histograms (bar Results are histograms (bar charts) representing a curve for charts) representing a curve for each parameter in the Isolation-each parameter in the Isolation-with-Migration modelwith-Migration model
•Each curve is an estimate of the Each curve is an estimate of the posterior probability density for one posterior probability density for one parameterparameter
0
0.001
0.002
0.003
0.004
0.005
0.006
0.007
0.008
0 0.2 0.4 0.6 0.8 1 1.2
Divergence Time
Pro
bab
ility
dGXGPGPXP )|()|()|(
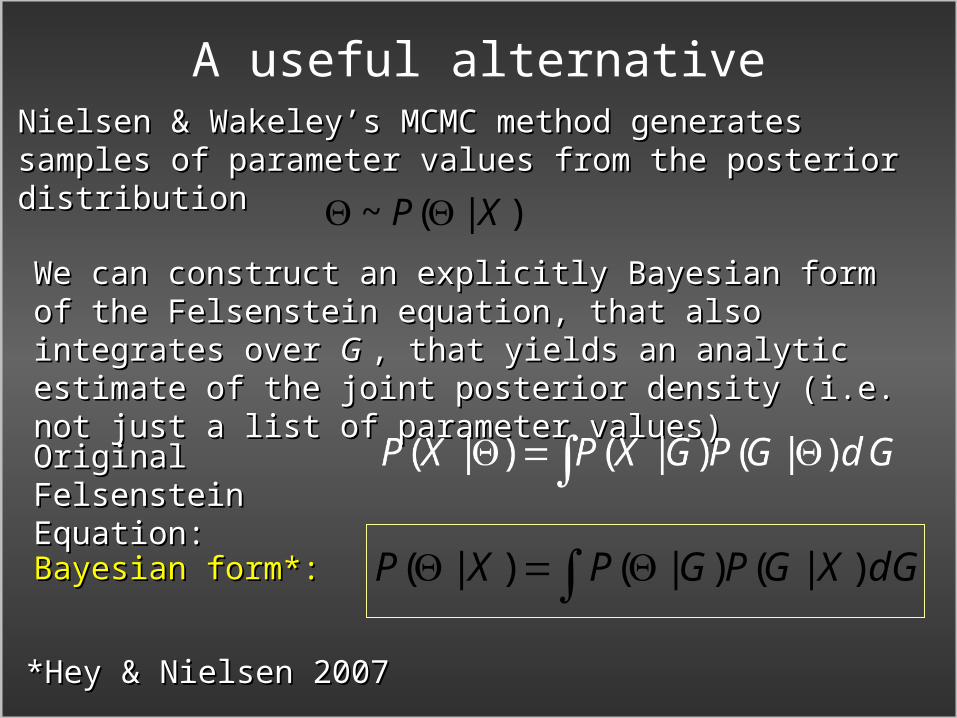
A useful alternativeNielsen & Wakeley’s MCMC method generates samples Nielsen & Wakeley’s MCMC method generates samples of parameter values from the posterior distributionof parameter values from the posterior distribution
We can construct an explicitly Bayesian form of the We can construct an explicitly Bayesian form of the Felsenstein equation, that also integrates over Felsenstein equation, that also integrates over GG , that , that yields an analytic estimate of the joint posterior yields an analytic estimate of the joint posterior density (i.e. not just a list of parameter values)density (i.e. not just a list of parameter values)
*Hey & Nielsen 2007*Hey & Nielsen 2007
)|(~ XP
Original Felsenstein Original Felsenstein Equation:Equation:
Bayesian form*:Bayesian form*:
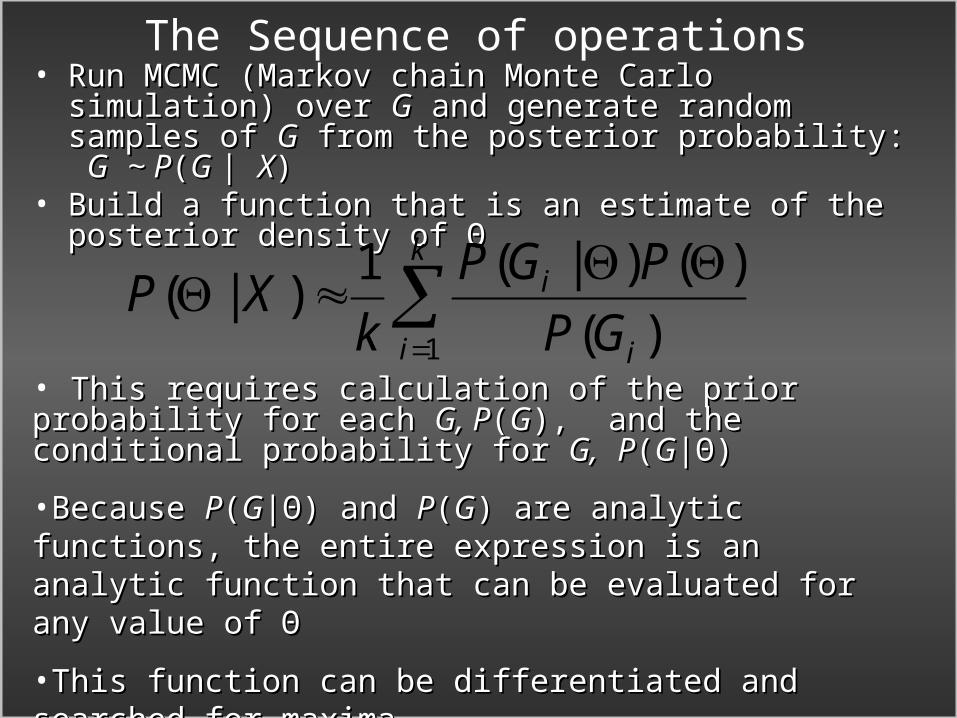
The Sequence of operations• Run MCMC (Markov chain Monte Carlo simulation) Run MCMC (Markov chain Monte Carlo simulation)
over over GG and generate random samples of and generate random samples of GG from the from the posterior probability: posterior probability: GG ~ P~ P((G G | | XX))
• Build a function that is an estimate of the posterior Build a function that is an estimate of the posterior density of density of ΘΘ
k
i i
i
GP
PGP
kXP
1 )(
)()|(1)|(
• This requires calculation of the prior probability for This requires calculation of the prior probability for each each G, PG, P((GG),), and the conditional probability for and the conditional probability for G,G, PP((GG||ΘΘ))
•Because Because PP((GG||ΘΘ)) and and PP((GG) ) are analytic functions, the are analytic functions, the entire expression is an analytic function that can be entire expression is an analytic function that can be evaluated for any value of evaluated for any value of ΘΘ
•This function can be This function can be differentiated and searched for differentiated and searched for maxima maxima

Extending the method to more than two populations
• Assume that we know the phylogeny Assume that we know the phylogeny of the sampled populations or speciesof the sampled populations or species
• Adding more populations does not Adding more populations does not introduce new mathematical issues introduce new mathematical issues
• The method can handle several The method can handle several populations, if the phylogeny is knownpopulations, if the phylogeny is known– However the number of demographic However the number of demographic
parameters becomes quite large for parameters becomes quite large for multiple populationsmultiple populations
Hey (2010) Mol Biol Evol
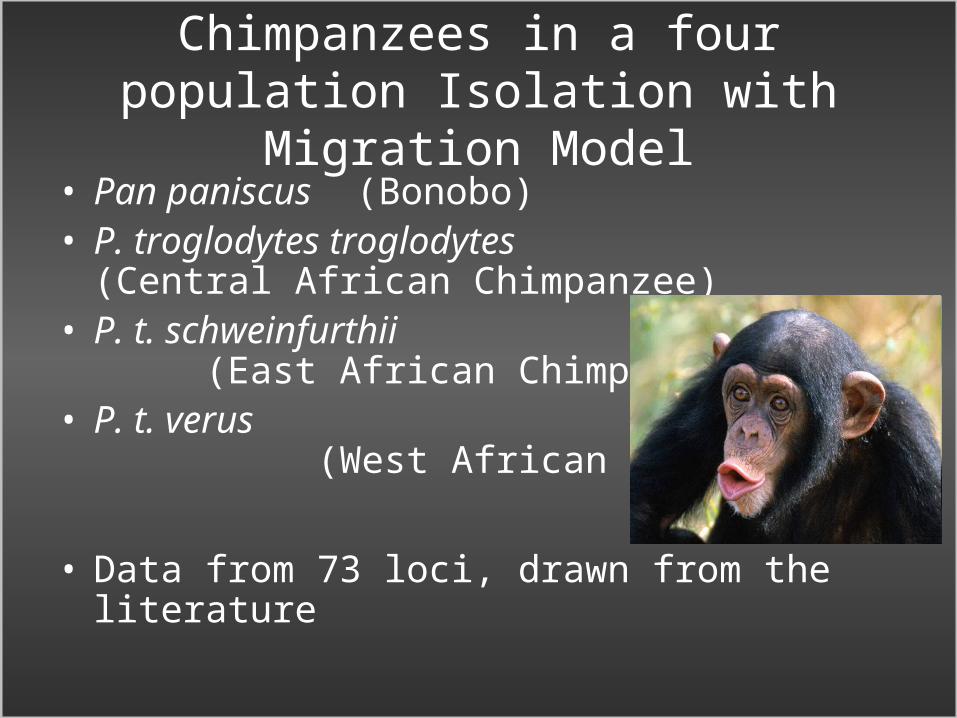
Chimpanzees in a four population Isolation with Migration Model
• Pan paniscus (Bonobo)• P. troglodytes troglodytes (Central
African Chimpanzee)• P. t. schweinfurthii (East
African Chimpanzee)• P. t. verus (West
African Chimpanzee)
• Data from 73 loci, drawn from the literature
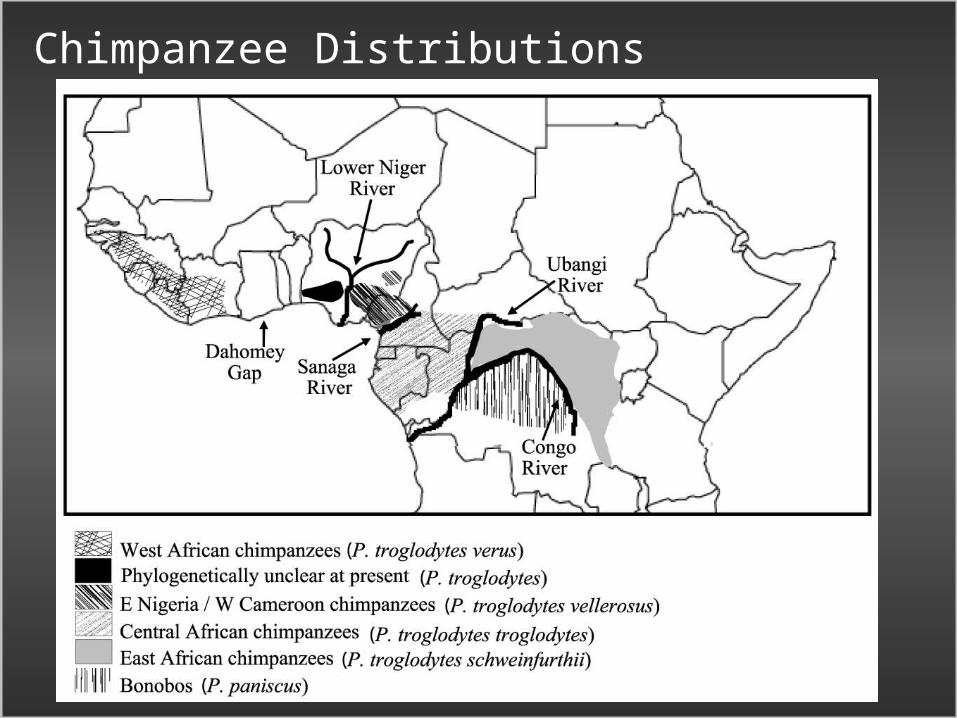
Chimpanzee Distributions
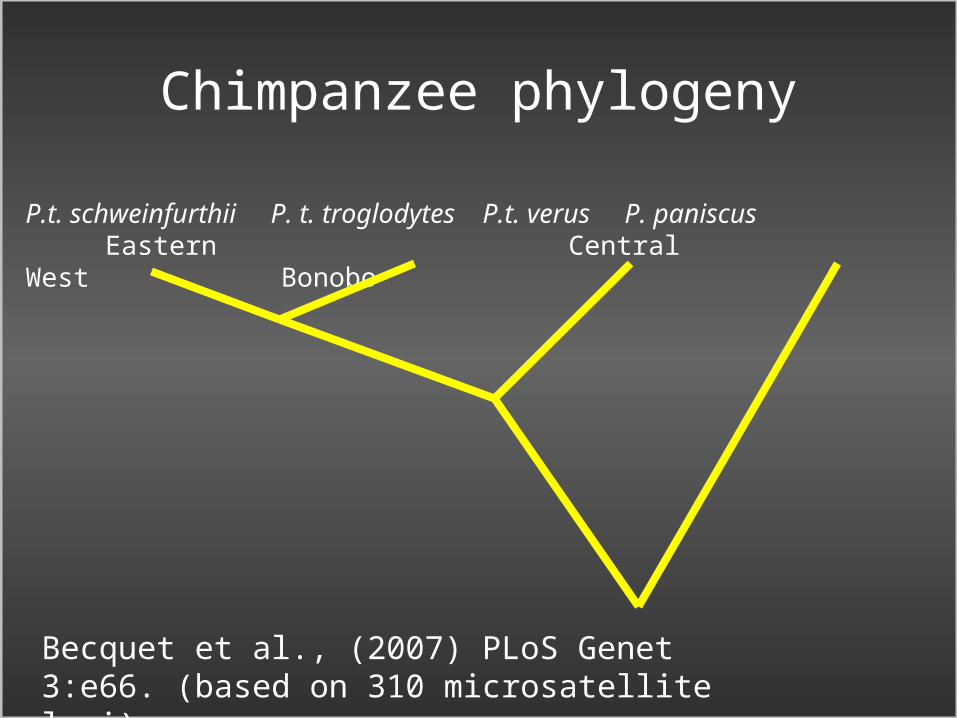
Chimpanzee phylogeny
P.t. schweinfurthii P. t. troglodytes P.t. verus P. paniscus Eastern Central West Bonobo
Becquet et al., (2007) PLoS Genet 3:e66. (based on 310 microsatellite loci)

A Four Population Isolation-with-Migration Model
EasternEastern CentralCentral WesternWestern BonobBonoboo
7 Population sizes
3 Split times
18 Migration Rates
Some Parameters extend over multiple time periods
EasternEastern CentralCentral WesternWestern BonobBonoboo
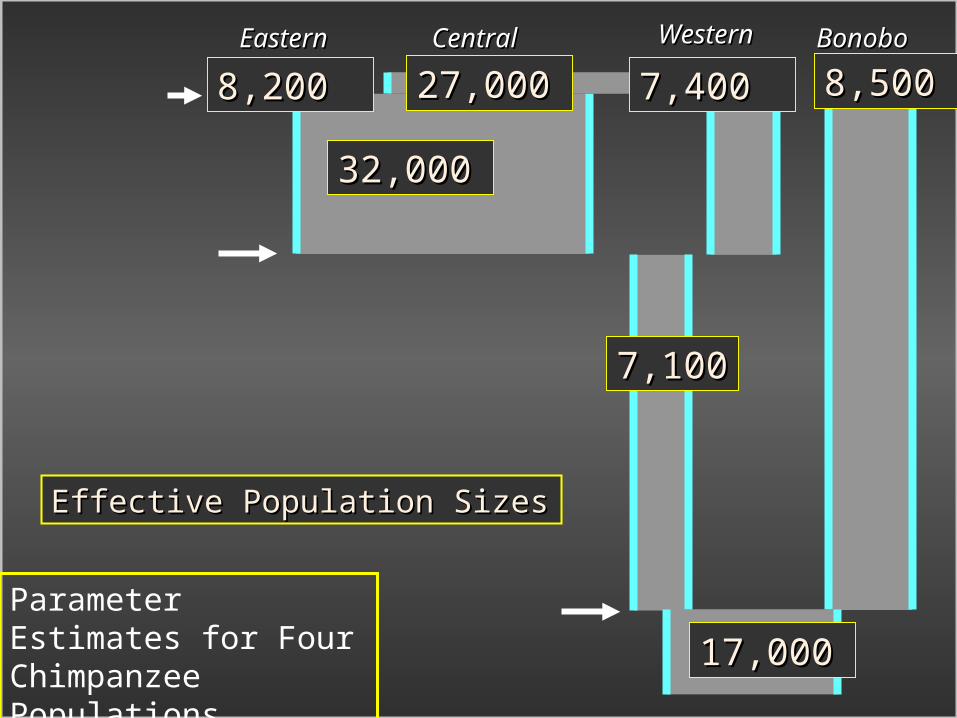
Parameter Estimates for Four Chimpanzee Populations
8,2008,200 27,00027,000 7,4007,400 8,5008,500
32,00032,000
7,1007,100
17,00017,000
Effective Population SizesEffective Population Sizes

EasternEastern CentralCentral WesternWestern BonobBonoboo
Parameter Estimates for Four Chimpanzee Populations
8,2008,200 27,00027,000 7,4007,400 8,5008,500
32,00032,000
7,1007,100
17,00017,000
Effective Population SizesEffective Population Sizes
Splitting Times in yearsSplitting Times in years
93,000 yrs 93,000 yrs
460,000 yrs460,000 yrs
930,000 yrs 930,000 yrs
Non-zero MigrationNon-zero Migration

How much gene flow occurs between diverging populations?
• Conducted a literature survey of studies that used the IM program to study divergence– Included studies of populations or
species pairs that are reported to be divergent for phenotypic or ecological traits
– Included studies that report numerical parameter estimates for the population migration rate (2NM)
Postdoc Catarina Pinho

0
10
20
30
40
0.0-0.1
0.1-0.2
0.2-0.3
0.3-0.4
0.4-0.5
0.5-0.6
0.6-0.7
0.7-0.8
0.8-0.9
0.9-1.0 1-2 2-3 3-4 4-5 5-6 6-7 7-8 8-9 9-1
0
10-100
2NM
# o
f O
bse
rvat
ion
sDistribution of 2NM estimates
Questions about species?Questions about species?
1.1. How much gene exchange goes on How much gene exchange goes on during speciation? during speciation?
2.2. How do we sample from species if How do we sample from species if we don’t know their boundaries?we don’t know their boundaries?

How do we sample from species if we How do we sample from species if we don’t know their boundaries?don’t know their boundaries?
• Humans are not omnipotent Humans are not omnipotent detectors of divergencedetectors of divergence
• If some divergence has occurred but If some divergence has occurred but is partly hidden to investigators . . .is partly hidden to investigators . . .
• Then individuals might be mistakenly Then individuals might be mistakenly assigned to populations and …assigned to populations and …
• Assessments of divergence may be Assessments of divergence may be incorrectincorrect

•Identify the range of a speciesIdentify the range of a species •From patterns of variation try From patterns of variation try to identify populationsto identify populations
•Sample individuals from each Sample individuals from each populationpopulation
•Study and draw conclusions Study and draw conclusions about divergenceabout divergence
The Sampling DilemmaThe Sampling Dilemma
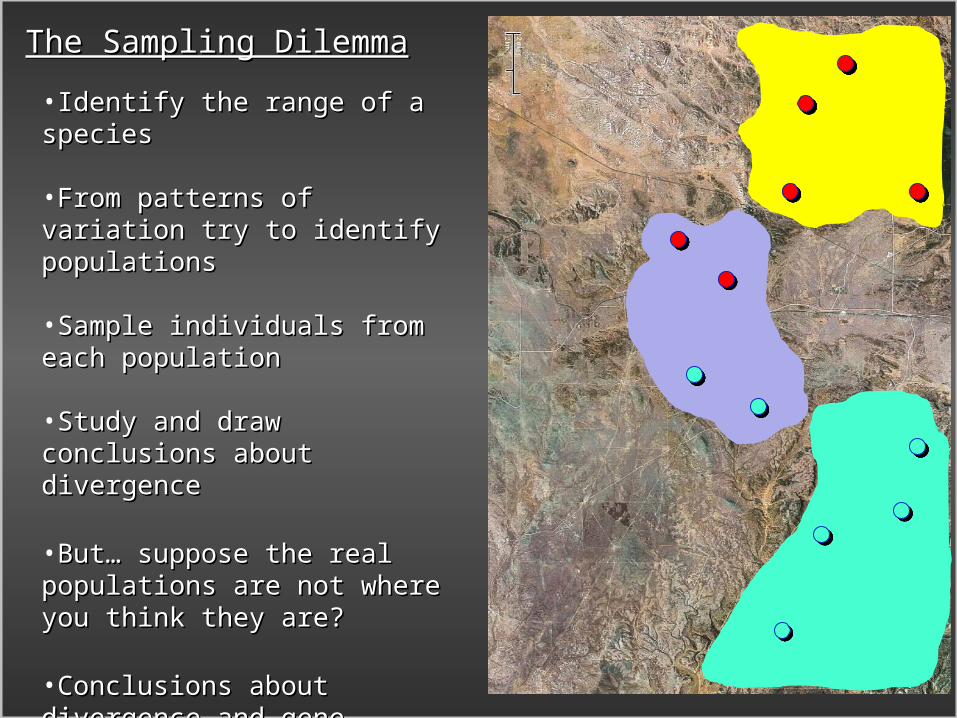
•Identify the range of a speciesIdentify the range of a species •From patterns of variation try From patterns of variation try to identify populationsto identify populations
•Sample individuals from each Sample individuals from each populationpopulation
•Study and draw conclusions Study and draw conclusions about divergenceabout divergence
•But… suppose the real But… suppose the real populations are not where you populations are not where you think they are?think they are?
•Conclusions about divergence Conclusions about divergence and gene exchange will be and gene exchange will be wrongwrong
The Sampling DilemmaThe Sampling Dilemma

Genetic identification of populationsGenetic identification of populations
• Populations can be identified without phenotypes or Populations can be identified without phenotypes or geography using only genetic data (e.g. geography using only genetic data (e.g. STRUCTURE program, Pritchard et al 2000)STRUCTURE program, Pritchard et al 2000)– Population assignments minimize departures from genetic Population assignments minimize departures from genetic
disequilibria within loci (Hardy Weinberg) and between loci disequilibria within loci (Hardy Weinberg) and between loci (Linkage)(Linkage)
• Two steps to studying divergence: Two steps to studying divergence:
(1) identify populations(1) identify populations
(2) study divergence of the populations that have been (2) study divergence of the populations that have been identifiedidentified
• However two-step analyses run the risk that results might be However two-step analyses run the risk that results might be based on incorrect assignmentbased on incorrect assignment
• Is it possible to estimate assignment simultaneously with a Is it possible to estimate assignment simultaneously with a study of divergence?study of divergence?
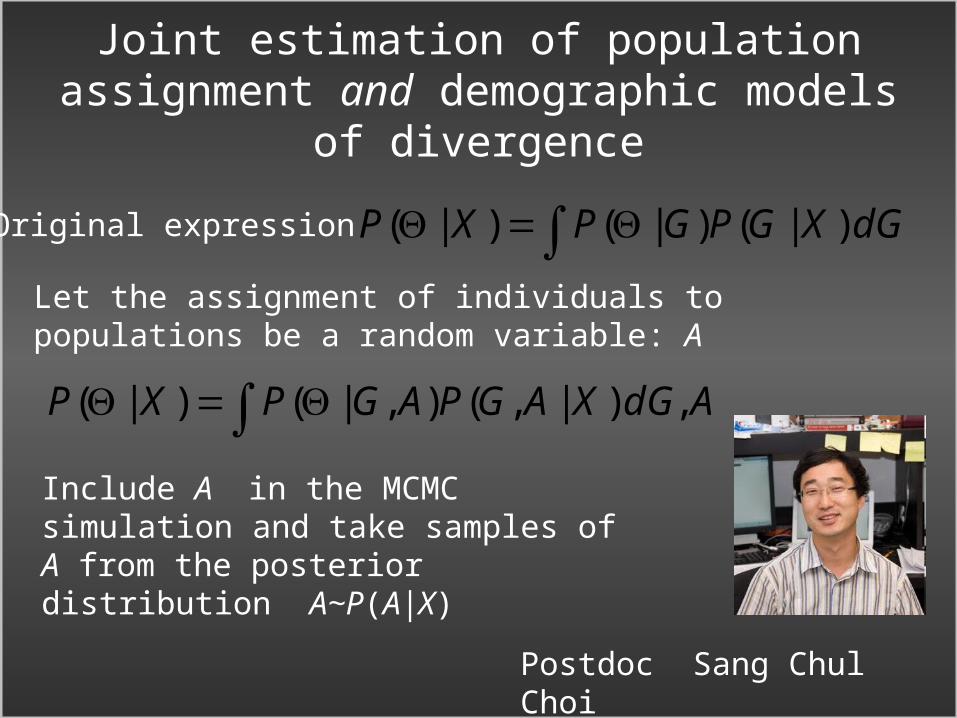
Joint estimation of population assignment and demographic models of divergence
Postdoc Sang Chul Choi
dGXGPGPXP )|()|()|(Original expression
Let the assignment of individuals to populations be a random variable: A
AdGXAGPAGPXP ,)|,(),|()|(
Include A in the MCMC simulation and take samples of A from the posterior distribution A~P(A|X)
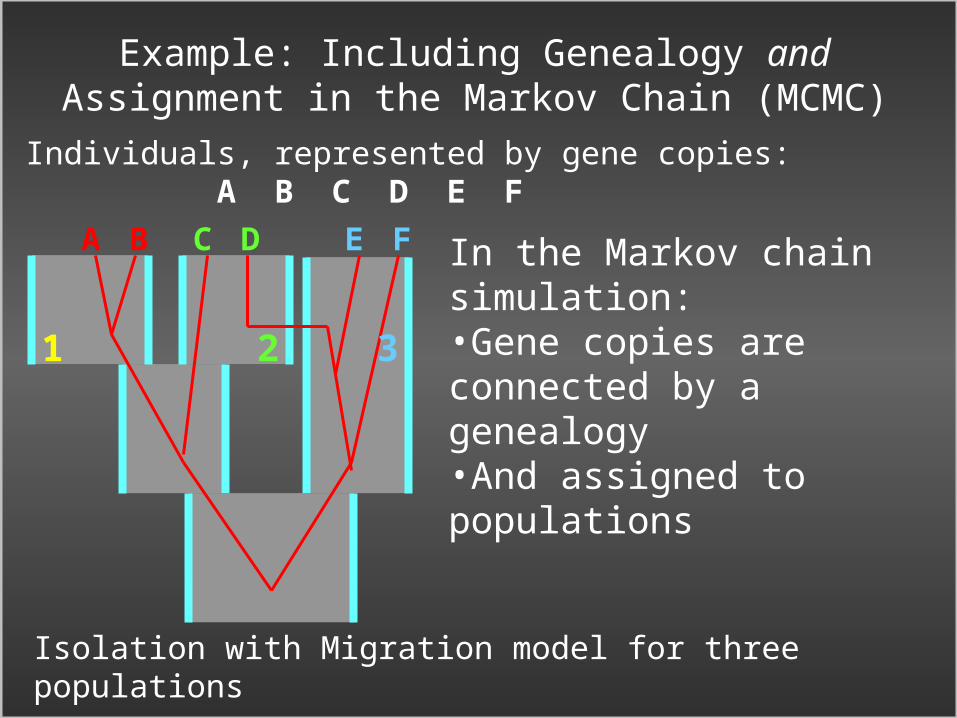
1 2 3
A B C D E F
Individuals, represented by gene copies:A B C D E F
Isolation with Migration model for three populations
In the Markov chain simulation:•Gene copies are connected by a genealogy•And assigned to populations
Example: Including Genealogy and Assignment in the Markov Chain (MCMC)
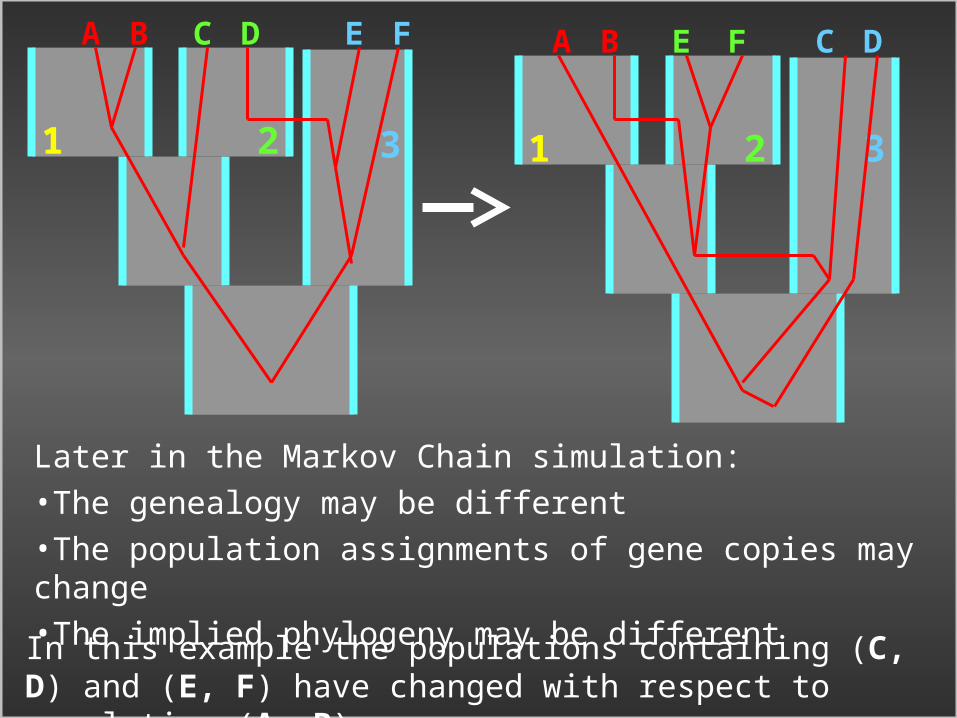
1 2 3 1 2 3
A B C D E F A B E F C D
Later in the Markov Chain simulation:•The genealogy may be different•The population assignments of gene copies may change•The implied phylogeny may be different
In this example the populations containing (C, D) and (E, F) have changed with respect to population (A, B)

Example from Common Example from Common chimpanzeeschimpanzees
• P. t. troglodytesP. t. troglodytes (Central African (Central African Chimpanzee)Chimpanzee)
• P. t. schweinfurthiiP. t. schweinfurthii (East African Chimpanzee) (East African Chimpanzee)• P. t. verus P. t. verus (West African Chimpanzee) (West African Chimpanzee)• 10 individuals from each subspecies10 individuals from each subspecies• Data from 9 loci (Fisher et al 2006)Data from 9 loci (Fisher et al 2006)• Assume a three population phylogenyAssume a three population phylogeny• Estimate Assignment Estimate Assignment and and the parameters of the parameters of
the Isolation with Migration modelthe Isolation with Migration model

Assignment estimateAssignment estimate
Eastern Central Western
True Assignment
Estimated Assignment
uncertainty

Phylogeny and Splitting time Phylogeny and Splitting time estimatesestimates
E: Eastern C: Central W: Western
E C W E C W E W C
T1
T1T1T2 T2 T2
P(Tree|X)
= 73.5%
P(Tree|X) = 15.7%
P(Tree|X)
= 10/8%

Questions about species?Questions about species?
1.1. How much gene exchange goes on How much gene exchange goes on during speciation? during speciation?
2.2. How do we sample from species if How do we sample from species if we don’t know their boundaries?we don’t know their boundaries?
3.3. Which diverging populations do we Which diverging populations do we identify as separate species?identify as separate species?

Thinking about Divergence: Thinking about Divergence: from Populations to Speciesfrom Populations to Species
1.1. One population becomes structured or One population becomes structured or divided, and divergence begins divided, and divergence begins
– Alleles and traits begin to become fixed Alleles and traits begin to become fixed • Reduced hybrid fitness may occurReduced hybrid fitness may occur
– Population Genetic ProcessPopulation Genetic Process
2.2. At some point the separate populations are At some point the separate populations are recognizable as species recognizable as species
– Semantic process (subjective & human) Semantic process (subjective & human)
3.3. Species continue to diverge Species continue to diverge – Phylogenetic ProcessPhylogenetic Process
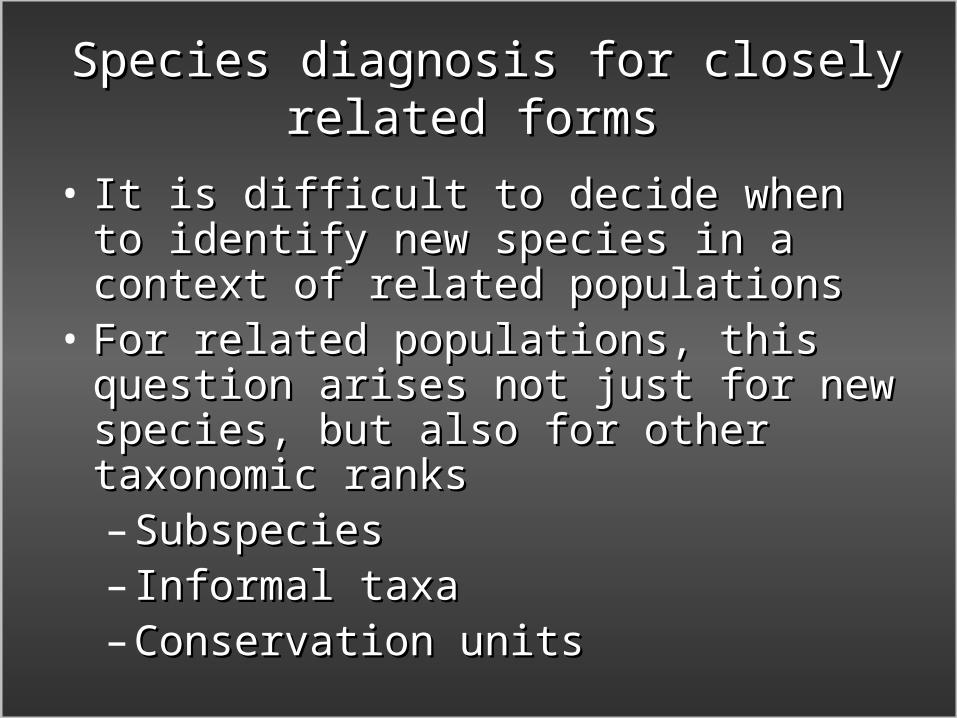
Species diagnosis for closely Species diagnosis for closely related forms related forms
• It is difficult to decide when to It is difficult to decide when to identify new species in a context of identify new species in a context of related populationsrelated populations
• For related populations, this question For related populations, this question arises not just for new species, but arises not just for new species, but also for other taxonomic ranksalso for other taxonomic ranks– SubspeciesSubspecies– Informal taxaInformal taxa– Conservation unitsConservation units

Divergence magnitude varies Divergence magnitude varies continuouslycontinuously
Continuously varying components of Continuously varying components of divergence:divergence:
• Gene flow between related Gene flow between related populations/species varies continuouslypopulations/species varies continuously
• Population specific fixations, by genetic Population specific fixations, by genetic drift or selection, can be many or few and drift or selection, can be many or few and can occur anywhere in the genomecan occur anywhere in the genome

“…“…how entirely vague and arbitraryhow entirely vague and arbitrary
is the distinction between is the distinction between
species and varieties.” species and varieties.”
(Darwin 1859, p. 24) (Darwin 1859, p. 24)
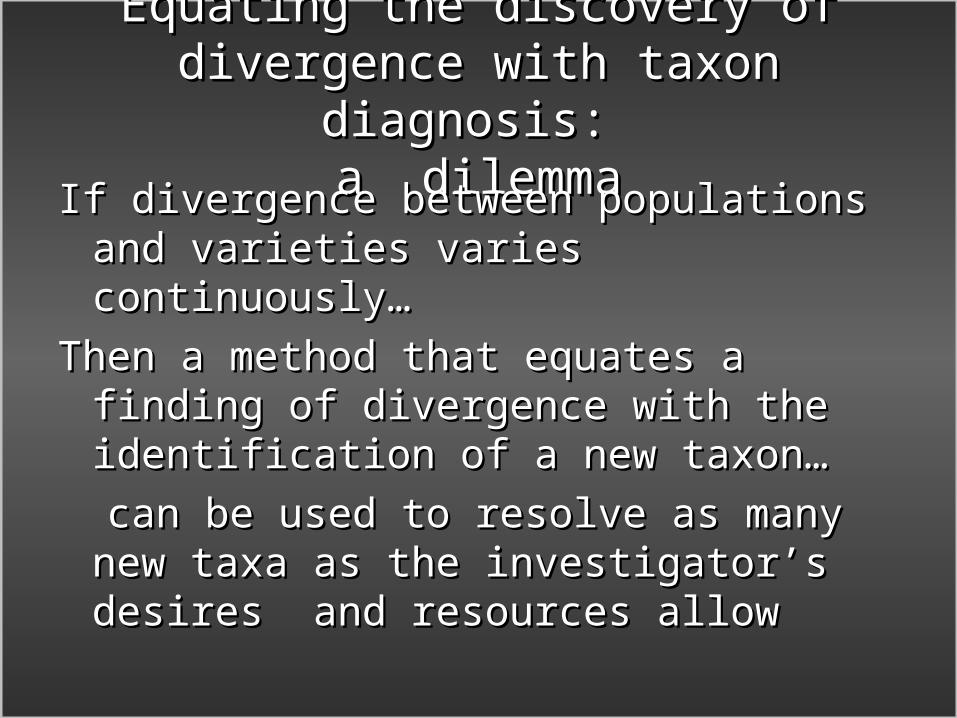
Equating the discovery of Equating the discovery of divergence with taxon diagnosis: divergence with taxon diagnosis:
a dilemmaa dilemmaIf divergence between populations and If divergence between populations and
varieties varies continuously…varieties varies continuously…
Then a method that equates a finding Then a method that equates a finding of divergence with the identification of divergence with the identification of a new taxon…of a new taxon…
can be used to resolve as many new can be used to resolve as many new taxa as the investigator’s desires taxa as the investigator’s desires and resources allow and resources allow

Quantitative methods that equate a finding Quantitative methods that equate a finding of differentiation* with species diagnosisof differentiation* with species diagnosis
• genetic distance method of Good & Wake genetic distance method of Good & Wake (Good & Wake 1992)(Good & Wake 1992)
• correlated distance matrixes (Puortocorrelated distance matrixes (Puorto et al. et al. 2001)2001)
• population aggregation analysis (PAA), population aggregation analysis (PAA), (Davis & Nixon 1992)(Davis & Nixon 1992)
• Templeton’s tests for cohesion, Templeton’s tests for cohesion, (Templeton 2001)(Templeton 2001)
• phylogenetic/composite tree-based phylogenetic/composite tree-based methods (Brooks & McLennan 1999)methods (Brooks & McLennan 1999)
• cladistic haplotype aggregation (CHA) cladistic haplotype aggregation (CHA) (Brower 1999)(Brower 1999)
* Meaning of differentiation varies with the method* Meaning of differentiation varies with the method

The Probability of Detecting a True The Probability of Detecting a True Difference Increases with Sample sizeDifference Increases with Sample size
0
0.5
1
1.5
2
2.5
3
0 1 2
Trait Value
Group 1Group 2
Suppose that two populations (in any context, not just Suppose that two populations (in any context, not just species diagnosis), have a true but small difference ?species diagnosis), have a true but small difference ?
Then the probability of detecting that difference is a Then the probability of detecting that difference is a function of the sample sizefunction of the sample size
Probability of detectionProbability of detection

Some cases of divergence are clear to everyone, Some cases of divergence are clear to everyone, and species designations may seem objective and species designations may seem objective
Lake MalawiLake Malawi
But within unambiguously identified taxa But within unambiguously identified taxa divergence is also commondivergence is also common
Labeotropheus Labeotropheus trewavasaetrewavasae
LabeotreopheusLabeotreopheus feullebornifeulleborni

Some cases of divergence are clear to everyone, Some cases of divergence are clear to everyone, and species designations may seem objective and species designations may seem objective
But within unambiguously identified taxa But within unambiguously identified taxa divergence is also commondivergence is also common
LabeotreopheusLabeotreopheus feullebornifeulleborni

Some cases of divergence are clear to everyone, Some cases of divergence are clear to everyone, and species designations may seem objective and species designations may seem objective
Pictures from Konings (2001) The Cichlids of Lake MalawiPictures from Konings (2001) The Cichlids of Lake Malawi
Labeotropheus Labeotropheus trewavasaetrewavasae

How can we diagnose taxa objectively?
For taxa at and below the rank of For taxa at and below the rank of species?species?
• If divergence varies continuouslyIf divergence varies continuously• And we wish to avoid having the rate And we wish to avoid having the rate
of species diagnosis increase with of species diagnosis increase with sample sizesample size
• We will need some sort of threshold We will need some sort of threshold criterion for identifying new taxacriterion for identifying new taxa

Methods based on thresholdsMethods based on thresholds
• Population migration rate (Population migration rate (NmNm) < 0.5 ) < 0.5 Porter (1990) Porter (1990)
• Nei’s D greater than 0.15 (HightonNei’s D greater than 0.15 (Highton et al. et al. 1989; Highton 1990). 1989; Highton 1990).
• Characters treated as fixed if they are at > Characters treated as fixed if they are at > 95% frequency (Wiens and Servedio, 95% frequency (Wiens and Servedio, 2000) 2000)
• DNA barcoding, COI divergence > 10x DNA barcoding, COI divergence > 10x within species variation (Hebert et al., within species variation (Hebert et al., 2004)2004)

Problems with threshold methodsProblems with threshold methods1.1. Any threshold value will be partly Any threshold value will be partly
arbitraryarbitrary– There is no escaping this There is no escaping this – Many species appear to be Many species appear to be
objectively distinctobjectively distinct– But within such species we find a But within such species we find a
vast gray area in which taxon vast gray area in which taxon diagnosis must be arbitrarydiagnosis must be arbitrary
2.2. No single threshold measure can No single threshold measure can capture the complexities of the capture the complexities of the divergence process divergence process

Problems with a single threshold Problems with a single threshold measure: Example using measure: Example using FFstst
• FFstst reflects the proportion of variation that reflects the proportion of variation that lies between populationslies between populations
• Any single value of Any single value of FFstst is fully consistent is fully consistent with two very different models:with two very different models:1.1. Can be used to estimate migration rate, under Can be used to estimate migration rate, under
an equilibrium model of gene flow and genetic an equilibrium model of gene flow and genetic driftdrift
2.2. Can be used to estimate divergence time, Can be used to estimate divergence time, under a model with zero gene flowunder a model with zero gene flow
• By itself By itself FFstst is probably not a good is probably not a good measure of divergence for taxon measure of divergence for taxon diagnosisdiagnosis

The need to assess two The need to assess two components of historycomponents of history
• Divergence can be due to adaptation and Divergence can be due to adaptation and genetic drift following population splittinggenetic drift following population splitting– As time since separation increases, so does As time since separation increases, so does
divergencedivergence
• Alternatively Divergence can be due to Alternatively Divergence can be due to long-standing population structure with long-standing population structure with limited gene flowlimited gene flow– Divergence is at equilibrium between mutation, Divergence is at equilibrium between mutation,
drift and gene flow, it will not increasedrift and gene flow, it will not increase
• A single threshold-based indicator of A single threshold-based indicator of divergence cannot distinguish between divergence cannot distinguish between these two processesthese two processes
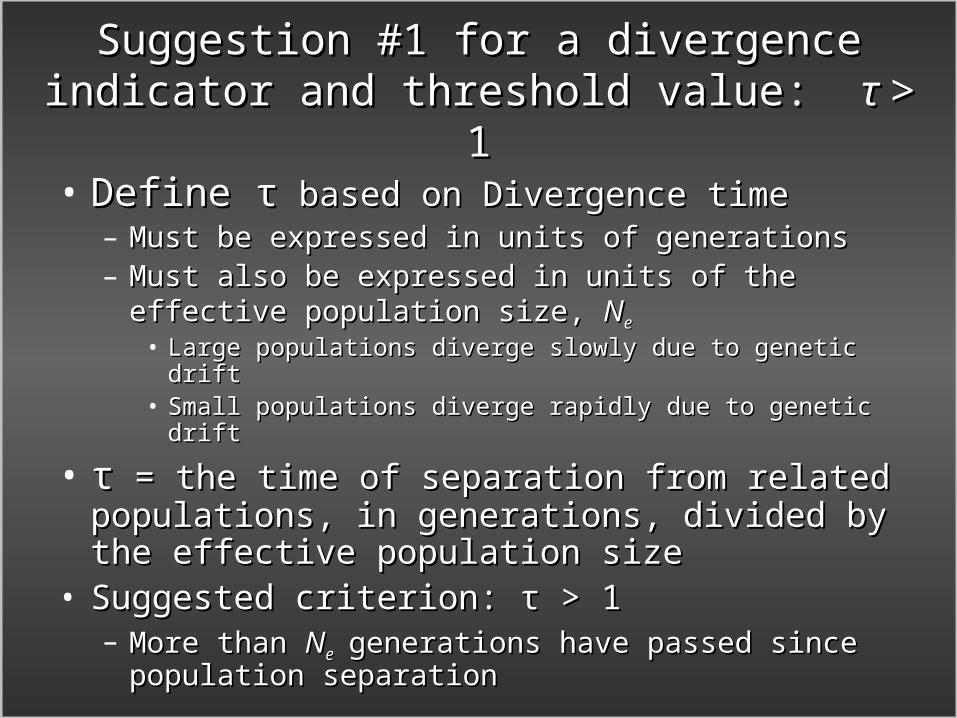
Suggestion #1 for a divergence indicator Suggestion #1 for a divergence indicator and threshold value: and threshold value: ττ > > 11
• Define Define ττ based on Divergence time based on Divergence time – Must be expressed in units of generationsMust be expressed in units of generations– Must also be expressed in units of the effective Must also be expressed in units of the effective
population size, population size, NNee • Large populations diverge slowly due to genetic driftLarge populations diverge slowly due to genetic drift• Small populations diverge rapidly due to genetic driftSmall populations diverge rapidly due to genetic drift
• ττ = the time of separation from related = the time of separation from related populations, in generations, divided by the populations, in generations, divided by the effective population sizeeffective population size
• Suggested criterion: Suggested criterion: ττ > 1> 1– More than More than NNe e generations have passed since generations have passed since
population separationpopulation separation
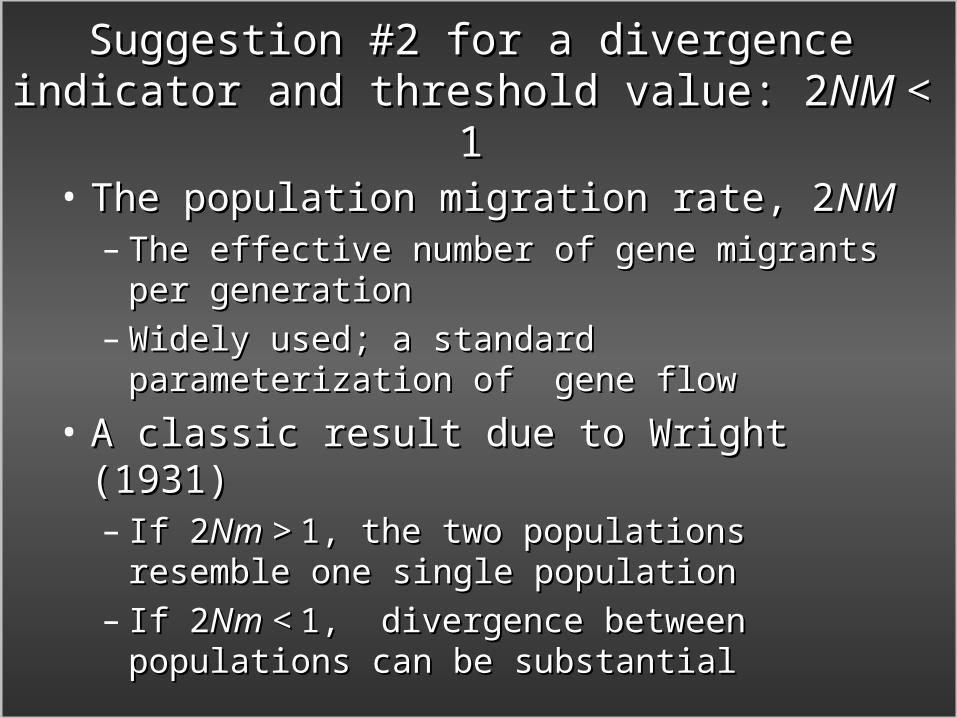
Suggestion #2 for a divergence indicator Suggestion #2 for a divergence indicator and threshold value: 2and threshold value: 2NMNM < < 11
• The population migration rate, 2The population migration rate, 2NMNM– The effective number of gene migrants The effective number of gene migrants
per generation per generation – Widely used; a standard Widely used; a standard
parameterization of gene flow parameterization of gene flow
• A classic result due to Wright (1931)A classic result due to Wright (1931)– If 2If 2NmNm > > 1, the1, the two populations two populations
resemble one single populationresemble one single population– If 2If 2NmNm < < 1, 1, divergence between divergence between
populations can be substantial populations can be substantial

ττ and 2and 2NNNN can be estimated from can be estimated from the parameters in an Isolation with the parameters in an Isolation with
Migration modelMigration model
PastPast
PresentPresent
Ancestral PopulationAncestral Population
Descendant PopulationsDescendant Populations
Splitting TimeSplitting Time
MigrationMigration
NNAA
tt
NN11 NN22mm11
mm22

Example: Western African chimpanzee Example: Western African chimpanzee ((Pan troglodytes verusPan troglodytes verus) and the central ) and the central African chimpanzee (African chimpanzee (P. t. troglodytesP. t. troglodytes))
(Won and Hey, 2005)(Won and Hey, 2005)
• 48 loci from the literature 48 loci from the literature • IM computer programIM computer program• Won & Hey 2005Won & Hey 2005
Yong-Jin Won, Ewa University, South Korea

Parameter Estimates and Parameter Estimates and Assessing divergence criteriaAssessing divergence criteria
• Divergence time: 422,000 yearsDivergence time: 422,000 years
28,133 generations (15 years/generation)28,133 generations (15 years/generation)
• P.t.verus P.t.verus estimated effective size: estimated effective size: NNee 7,600 7,600
ττ = 28,133/ 7,600 = 3.7 = 28,133/ 7,600 = 3.7
• P.t.troglodytes P.t.troglodytes estimated estimated NNe:e: 2 27,900 7,900
ττ = 28,133/ 27,900 = 1.01 = 28,133/ 27,900 = 1.01• Population Migration ratePopulation Migration rate
P. t. verus P. t. verus →→ P. t. troglodytes P. t. troglodytes
22NM NM = 0.59= 0.59
P. t. troglodytes P. t. troglodytes →→ P. t. verus P. t. verus
22NM NM = 0.0= 0.0* meets species criteria* meets species criteria
( ( ττ > 1*) > 1*)
(2(2NM NM < 1*)< 1*)
( ( ττ > 1*) > 1*)
(2(2NM NM < 1*)< 1*)

Could it really work?
• Can Can ττ and 2NM realistically be the basis for and 2NM realistically be the basis for taxon diagnosis? taxon diagnosis? – e.g. for identifying conservation unitse.g. for identifying conservation units
• The threshold values are partly arbitrary, The threshold values are partly arbitrary, but the method would be objective but the method would be objective
• But …But …– The method assumes a neutral model and The method assumes a neutral model and
overlooks adaptationoverlooks adaptation– Would investigators really be willing to Would investigators really be willing to
give up the traditional reliance on salient give up the traditional reliance on salient phenotypes?phenotypes?

Summing up three questions:Summing up three questions:
1.1.How much gene exchange goes on during speciation? How much gene exchange goes on during speciation? • Usually little, but gene exchange is commonUsually little, but gene exchange is common• Indirect evidence of an important role for natural selection, Indirect evidence of an important role for natural selection,
and for Darwin’s and for Darwin’s Principle of DivergencePrinciple of Divergence
2.2.How do we sample from species if we don’t know How do we sample from species if we don’t know their boundaries?their boundaries?• By using a demographic model of divergence that has By using a demographic model of divergence that has
assignment uncertainty built into itassignment uncertainty built into it
3.3.Which diverging populations do we identify as Which diverging populations do we identify as separate species?separate species?• It is up to us It is up to us • It can be done with some objectivity by using threshold It can be done with some objectivity by using threshold
criteria based on quantitative models of divergencecriteria based on quantitative models of divergence

Summing upSumming up
• All questions have been addressed All questions have been addressed with a common approachwith a common approach
• Relying on the Felsenstein equation Relying on the Felsenstein equation and the isolation with migration and the isolation with migration model is theoretically reductionist:model is theoretically reductionist:
– Uses a neutral model, with several key Uses a neutral model, with several key simplifying assumptionssimplifying assumptions
– Conceptually simpleConceptually simple– Computationally demanding Computationally demanding

Acknowledgements
• Rasmus Nielsen – UC Berkeley
• Sang Chul Choi• Yong Wang• Catarina Pinho• Yong-Jin Won
• NSF, NIH, US National Marine Fisheries


