On the Design of Compliance Governance Dashboards for Effective Compliance and Audit Management Patrícia Silveira, Carlos Rodríguez, Fabio Casati, Florian Daniel, Vincenzo D’Andrea University of Trento, Italy {silveira,crodriguez,casati,daniel,dandrea}@disi.unitn.it Claire Worledge Deloitte Conseil, Paris, France [email protected]Zouhair Taheri PricewaterhouseCoopers Accountants, Rotterdam, Netherlands [email protected]Abstract. Assessing whether a company’s business practices conform to laws and regulations and follow standards and best practices, i.e., compliance gover- nance, is a complex and costly task. Few software tools aiding compliance go- vernance exist; however, they typically do not really address the needs of who is actually in charge of assessing and controlling compliance, that is, com- pliance experts and auditors. We advocate the use of compliance governance dashboards, whose design and implementation is however challenging for at least three reasons: (i) it is fun- damental to identify the right level of abstraction for the information to be shown; (ii) it is not trivial to visualize different analysis perspectives; and (iii) it is difficult to manage the large amount of involved concepts, instruments, and data. This paper shows how to address these issues, which concepts and models underlie the problem, and, eventually, how IT can effectively support com- pliance analysis in Service-Oriented Architectures. Keywords: Compliance, Auditing, Compliance governance dashboard, Com- pliance models, Indicators 1 Introduction Compliance is a term generally used to refer to the conformance to a set of laws, regulations, policies, or best practices. Compliance governance refers to the set of procedures, methodologies, and technologies put in place by a corporation to carry out, monitor, and manage compliance. Compliance governance is an important, expensive, and complex problem to deal with: It is important because there is increasing regulatory pressure on companies to meet a variety of policies and laws (e.g., Basel II, MiFID, SOX). This increase has been to a large extent fueled by high-profile bankruptcy cases (Parmalat, Enron, WorldCom, the recent crisis) or safety mishaps (the April 2009 earthquake in Italy
Transcript
On the Design of Compliance Governance Dashboards for Effective Compliance and Audit Management
Patrícia Silveira, Carlos Rodríguez, Fabio Casati, Florian Daniel, Vincenzo D’Andrea
University of Trento, Italy {silveira,crodriguez,casati,daniel,dandrea}@disi.unitn.it
Abstract. Assessing whether a company’s business practices conform to laws and regulations and follow standards and best practices, i.e., compliance gover-nance, is a complex and costly task. Few software tools aiding compliance go-vernance exist; however, they typically do not really address the needs of who is actually in charge of assessing and controlling compliance, that is, com-pliance experts and auditors. We advocate the use of compliance governance dashboards, whose design and implementation is however challenging for at least three reasons: (i) it is fun-damental to identify the right level of abstraction for the information to be shown; (ii) it is not trivial to visualize different analysis perspectives; and (iii) it is difficult to manage the large amount of involved concepts, instruments, and data. This paper shows how to address these issues, which concepts and models underlie the problem, and, eventually, how IT can effectively support com-pliance analysis in Service-Oriented Architectures.
Compliance is a term generally used to refer to the conformance to a set of laws, regulations, policies, or best practices. Compliance governance refers to the set of procedures, methodologies, and technologies put in place by a corporation to carry out, monitor, and manage compliance.
Compliance governance is an important, expensive, and complex problem to deal with: It is important because there is increasing regulatory pressure on companies to meet a variety of policies and laws (e.g., Basel II, MiFID, SOX). This increase has been to a large extent fueled by high-profile bankruptcy cases (Parmalat, Enron, WorldCom, the recent crisis) or safety mishaps (the April 2009 earthquake in Italy
has already led to stricter rules and certification procedures for buildings and con-struction companies). Failing to meet these regulations means safety risks, hefty pe-nalties, loss of reputation, or even bankruptcy [11].
Managing and auditing/certifying compliance is a very expensive endeavor. A re-port by AMR Research [6] estimates that companies will spend US$32B only on governance, compliance, and risk in 2008 and more than US$33B in 2009. Audits are themselves expensive and invasive activities, costly not only in terms of auditors’ salaries but also in terms of internal costs for preparing for and assisting the audit – not to mention the cost of non-compliance in terms of penalties and reputation.
Finally, the problem is complex because each corporation has to face a large set of compliance requirements in the various business segments, from how internal IT is managed to how personnel is trained, how product safety is ensured, or how (and how promptly) information is communicated to shareholders. Furthermore, rules are some-times vague and informally specified. As a result, compliance governance requires understanding/interpreting requirements and implementing and managing a large number of control actions on a variety of procedures across the business units of a company. Each compliance regulation and procedure may require its own control mechanism and its own set of indicators to assess the compliance status of the proce-dure [1]. Today, compliance is to a large extent managed by the various business units in rather ad-hoc ways (each unit, line of business, or even each business process has its own methodology, policy, controls, and technology for managing compliance) [15]. As a result, today it is very hard for any CFO or CIO to answer questions such as: Which rules does my company have to comply with? Which processes should obey which rules? Which processes are following regulations? Where do violations occur? Which processes do we have under control? [19]. Even more, it is hard to do so from a perspective that not only satisfies the company but also the company’s auditors, which is crucial as the auditors are the ones that certify compliance.
To address these and similar compliance problems, the EU has funded projects that bring together corporations, auditors, and researchers in conceptual modeling, process monitoring, business intelligence, and service computing. This paper is the result of a combined effort from two such projects (Compas [www.compas‐ict.eu] and Master [www.master‐fp7.eu]). It presents a conceptual model for compliance and for com-pliance governance dashboards (CGDs), along with a dashboard architecture and a prototype implementation. The aim of CGDs is to report on compliance, to create an awareness of possible problems or violations, and to facilitate the identification of root-causes for non-compliant situations.
The dashboard is targeted at several classes of users: chief officers of a company, line of business managers, internal auditors, and external auditors (certification agen-cies). These two latter typically focus on a fairly narrow set of processes and examine historical data to verify non-compliant situations and how they have been dealt with. Via the dashboard, they also have access to key compliance indicators (KCIs) defined for each process. Managers (especially high-level ones) are interested in a much broader set of compliance regulations and at quasi-real time compliance information that allows them to detect problems as they happen and identify the causes, so that they can correct them before they become (significant) violations. They have access and navigate through the entire set of regulations, business processes, and business units and also observe the overall compliance status (through aggregate KCIs). In
addition, once problems are identified (unsatisfactory values for indicators) they drill-down to the root of the problem.
Technically, building a dashboard that shows a bunch of indicators and that allows drill-downs is easy. Indeed, the main challenges in this case are conceptual more than technological [18]. These challenges, which also correspond to the main contributions of this paper, are: 1. Provide a conceptual model for compliance and for compliance dashboards that
covers a broad class of compliance issues. Identify the key abstractions and their relationships. Otherwise the dashboard loses its value of single entry point for compliance assessment.
2. Combine the above broadness with simplicity and effectiveness. The challenge here is to derive a model that, despite being broad, remains simple and use-ful/usable. If the abstractions are not carefully crafted and kept to a minimum, the dashboard will be too complex and remain unused. Models that are too generic are often too complex to use. As we have experienced, this problem may seem easy but is instead rather complex, up to the point that discussions on the conceptual model in the projects took well over a year. There is no clarity in this area, and this is demonstrated by the fact that while everybody talks about compliance, there are no generic but simple compliance models readily available.
3. Define, besides the conceptual abstractions, a user interaction and navigation model that captures the way the different kinds of users need to interact with the dashboard, to minimize the time to accesses spent in getting the information users need and to make sure that key problems do not remain unnoticed.
4. Derive a model that is in line with the criteria and approach that auditors have to verify compliance. In this paper, this last contribution is achieved “by design”, in that the model is derived also via a joint effort of two of the major auditing com-panies and reflects the desired method of understanding of and navigation among the various compliance concerns.
In the following, we first introduce our conceptual model for compliance and then the compliance management lifecycle. We then focus on the dashboard and present a structural and navigational model for compliance, describe the architecture and proto-type, and then compare the work done with prior art and existing tools.
2 The Problem of Compliance Management
To characterize the compliance management problem intuitively introduced above, we now generalize the problem in terms of two models of its most important con-cepts, their relationships, and the dynamics that describe their adoption in practice.
2.1 Concepts and Terminology
Despite the increasing awareness of compliance issues in companies and the recogni-tion that part of the compliance auditing task can be easily automated, i.e., assisted by means of software tools [11][14][15], there is still a lot of confusion around. This is
especially true for the IT community, which would actually be in charge of aiding compliance governance with dedicated software. To help thinking in terms of audit-ing, in the following we aim to abstract a wide class of compliance problems into a few key concepts that are also the ones understood by auditors. The resulting model does not cover all possible compliance problems, but our goal is to strike a balance between coverage and simplicity. So far, we didn’t find any such model in literature. The model is illustrated in Fig. 1.
We read the model from the top-left corner: The Regulation entity generalizes all those documents that regulate or provide guidelines for the correct or good conduct of business in a given business domain. Common examples of regulations are legisla-tions (e.g., MiFID, The Electronic Commerce Directive), laws (e.g., SOX, HIPAA), standards (e.g., CMMI, CoBIT, ISO-9001), and contracts or SLAs. Typically, a regu-lation defines a set of rules or principles in natural language, which constrain or guide the way business should be conducted. Complying with a regulation means satisfying its rules and principles. Yet, a company might be affected by only some of the rules or principles stated in a given regulation. The selection of the pertaining ones represents the requirements for compliance management, commonly expressed in terms of con-trol objectives and control activities. A regulation expresses multiple requirements, and a requirement might relate to one or more regulations.
Assessing compliance demands for an interpretation and translation of the re-quirements provided in natural language in an actionable rule description (especially in the case of principle-based regulations) [9][10]. This is modeled by the Rule entity, which represents actionable rules expressed either in natural language (using the company’s terminology and telling exactly how to perform work) or, as desirable in a formalism that facilitates its automated processing (e.g., Boolean expressions over events generated during business execution). Rules are then grouped into policies, which are the company-internal documents that operatively describe how the compa-ny intends achieving compliance with the selected requirements. Typically, policies represent a grouping of the requirements into topics, e.g., security policies, QoS poli-cies, and similar.
At a strategic level, compliance is naturally related to the concept of risk. Non-compliant situations expose a company to risks that might be mitigated. For example, a non-encrypted message that is sent through the network might violate a security compliance rule, which, in turn, might put at risk sensitive information. Risk mitiga-tion is the actual driver for internal compliance auditing. The Risk entity represents the risks a company wants to monitor; risks are associated with compliance require-ments. For the evaluation of whether business is executed in a compliant way or not, we must know which rules must be evaluated in which business context. We therefore assume that we can associate policies with specific business processes (though this can easily be generalized to the case of projects, products, and similar). Processes are composed of activities, which represent the atomic work items in a process.
The actual evaluation of compliance rules is not performed on business processes (that is, on their models) but on their concrete executions, i.e., their instances. Execut-ing a business process means performing activities, invoking services, and tracking progression events and produced business data (captured by the Execution data enti-ty). In addition, e.g., separation of duties, it is necessary to track the actors and roles of execution of activities. When evaluation of a rule for a process/activity instance is
negative, it corresponds to violations, which are the core for the assessment of the level of compliance of a company and the computation of KCIs.
The model in Fig. 1 puts into context the most important concepts auditors are in-terested in when auditing a company. The actual auditing process, then, also looks at the dynamic aspect of the compliance management problem, that is, at how the com-pany decides which regulations are pertaining, how it implements its business processes, how it checks for violations, and so on. In short, the auditing process is embedded in a so-called compliance management life cycle, which we discuss next.
2.2 The Compliance Management Life Cycle
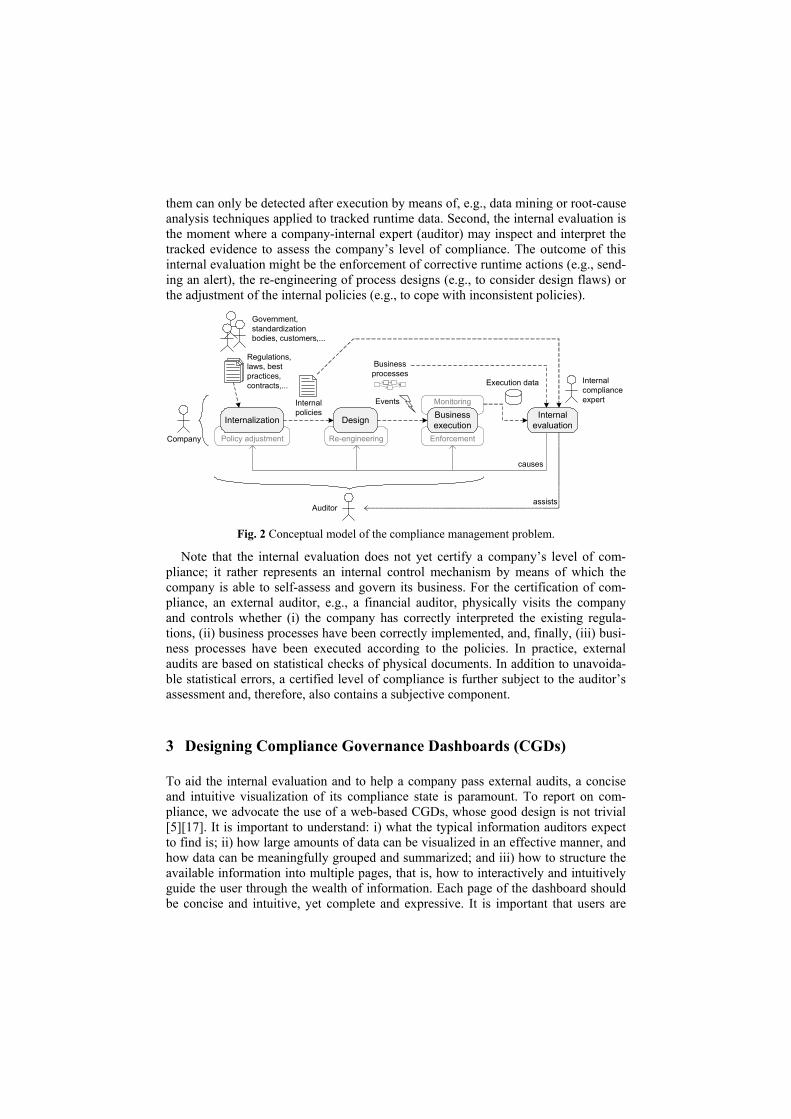
In everyday business a company is subject to a variety of different regulations. It is up to the company to understand, select, and “internalize” them that affect its business, thus producing a set of internal policies (internalization phase in Fig. 2). The latter then drive the design of the company’s business practices, yielding a set of business processes that are possibly designed compliantly (design phase), meaning that they are designed to respect the internal policies. To provide evidence of the (hopefully) compliant execution of designed business processes, the company also defines a set of events, often also called “controls” or “control points”.
Process and event definitions are consumed in the business execution phase, where the company’s employees perform the tasks and duties specified in the process mod-els. Ideally (but not mandatorily), this execution is assisted by software tools such as workflow management or business process execution systems, also able to collect compliance-specific evidence and to generate respective execution events (the execu-tion data), which can be stored in an audit trail or log file for evaluation.
The internal evaluation phase serves a twofold purpose: First, it is the point where collected data can be automatically analyzed to detect compliance violations. Indeed, designing compliant processes is not enough to assure compliance, as in practice there are a multitude of reasons for which deviations from an expected business process might happen (e.g., human factors, system downtimes). Some of such problems can be detected during runtime, resulting in the generation of respective events; some of
ExecutionDataViolationRule
Policy
Requirement
1..N
1..N
0..N
0..N
0..N
0..N0..N
0..N
Sub-process
RoleActor0..N0..N
1..N0..N
Business process
1..1
Risk0..N1..N
1..1
Best Practices
Law
Standard
Security
QoS
Activity0..N1..1
1..N
1..1
Regulation
0..N
1..N
Fig. 2 Conceptual model of the compliance management problem.
Fig. 1 The compliance management life cycle, articulated into phases, products, and actors Execution
DataViolationRule
Policy
Requirement
1..*
0..*
0..*
0..*
0..*0..*
0..*
Sub-subject
RoleActor0..*0..*
1..*0..*
Business subject
1
Risk0..*
1
Best Practices
Law
Standard
Security
QoS
Activity0..*1
1
Source
1..*
0..*
1..*
1..*
1..*
Fig. 1 Conceptual model of the compliance management problem.
them can only be detected after execution by means of, e.g., data mining or root-cause analysis techniques applied to tracked runtime data. Second, the internal evaluation is the moment where a company-internal expert (auditor) may inspect and interpret the tracked evidence to assess the company’s level of compliance. The outcome of this internal evaluation might be the enforcement of corrective runtime actions (e.g., send-ing an alert), the re-engineering of process designs (e.g., to consider design flaws) or the adjustment of the internal policies (e.g., to cope with inconsistent policies).
Policy adjustment Re-engineering Enforcement
Monitoring
Internalization Design Business execution
Internal evaluation
Regulations, laws, best practices, contracts,...
Internal policies
Business processes
Events
Execution data
Auditor
Government, standardization bodies, customers,...
Internal compliance expert
assists
causes
Company
Fig. 2 Conceptual model of the compliance management problem.
Note that the internal evaluation does not yet certify a company’s level of com-pliance; it rather represents an internal control mechanism by means of which the company is able to self-assess and govern its business. For the certification of com-pliance, an external auditor, e.g., a financial auditor, physically visits the company and controls whether (i) the company has correctly interpreted the existing regula-tions, (ii) business processes have been correctly implemented, and, finally, (iii) busi-ness processes have been executed according to the policies. In practice, external audits are based on statistical checks of physical documents. In addition to unavoida-ble statistical errors, a certified level of compliance is further subject to the auditor’s assessment and, therefore, also contains a subjective component.
To aid the internal evaluation and to help a company pass external audits, a concise and intuitive visualization of its compliance state is paramount. To report on com-pliance, we advocate the use of a web-based CGDs, whose good design is not trivial [5][17]. It is important to understand: i) what the typical information auditors expect to find is; ii) how large amounts of data can be visualized in an effective manner, and how data can be meaningfully grouped and summarized; and iii) how to structure the available information into multiple pages, that is, how to interactively and intuitively guide the user through the wealth of information. Each page of the dashboard should be concise and intuitive, yet complete and expressive. It is important that users are
immediately able to identify the key information in a page, but that there are also facilities to drill-down into details.
Designing CGDs requires mastering some new concepts in addition to those dis-cussed above. Then, the new concepts must be equipped with a well-thought naviga-tion structure to effectively convey the necessary information. Here, we do not focus on how data are stored and how rules are evaluated; several proposals and approaches have been conceived so far for that (see Section 5), and we build on top of them.
3.1 A Conceptual Model for CGDs
In Fig. 3 we extend the conceptual model (Fig. 1) to capture the necessary constructs for the development of a CGD (bold lines and labels represent new entities and their respective interrelations). The extensions aim at (i) providing different analysis pers-pectives (in terms of time, user roles, and organizational structures), (ii) summarizing data at different levels of abstraction, and (iii) enabling drill-down/roll-up features (from aggregated data to detailed data, and vice versa).
The Dashboard view entity represents individual views over the compliance status of the company. A view is characterized by the user role that accesses it, e.g., IT spe-cialists, compliance experts, managers, or similar. Each of these roles has different needs and rights. For instance, managers are more interested in aggregated values, risk levels, and long time horizons (to take business decisions); IT personnel are ra-ther interested in instance-level data and short time spans (to fix violations). A view is further characterized by the time interval considered for the visualization of data (e.g., day, week, month, or year), also providing for the historical analysis (e.g., last year) and supporting different reporting purposes (operative, tactical, strategic). Finally, a view might be restricted to only some of the business units in the company, based on the role of the user. Business units can be composed by other business units, forming a hierarchical organizational structure. In summary, views support different summari-zation levels of the overall available data, ranging over multiple granularity levels.
Effective summarization of data is one of the most challenging aspects in the de-sign of CGDs, commonly instrumented by indicators [13]. An indicator is a quantita-tive summarization of a particular aspect of interest in the business, i.e., a metric of how well an objective is being reached. Typically, KPIs (key performance indicators), are used to summarize the level at which business objectives are reached. In our con-text, we speak about KCIs, referring to the achievement of the stated compliance objectives (e.g., the number of unauthorized accesses to our payroll data).
In general, indicators are computed out of a variety of data and functions; in the context of compliance assessment, however, indicators can typically be related to the ratio of encountered violations vs. compliant instances of a process or activity. As an abstraction of indicator values, we can define taxonomies (e.g., low, medium, high) and use colors (e.g., red, yellow, green) for their intuitive visualization. The same considerations hold for risk levels, which represent the level of summarization that is appropriate for long-term, strategic perspectives and are usually computed out of the values of indicators and additional (external) data.
Dashboard view
Time interval
Business unit
Activity
Rule
Execution dataIndicatorRisk level
0..*
Sub-unit
0..*
Sub-process
0..*
1
1..* 1..* 1..*1
0..*
11
0..*
0..*
1
1 0..*
0..*
0..*
0..10..1
0..* 1..*
1..* 1..*1..*0..*
1
1
computed over
Actor
0..*
0..*
0..*
1..*
Role
0..*
0..*
Violation
0..*
0..*
Requirement PolicyRisk
0..1
0..*
Business subject
1..*
Fig. 3 Conceptual model for CGDs (dashboard-specific constructs are highlighted in bold).
The described model extension aims at relating general compliance concepts with concepts that are specific to the design of dashboards. The model is general and ex-tensible, so as to allow for the necessary flexibility to accommodate multiple concrete compliance scenarios.
3.2 Navigation Design
After discussing the static aspects of the design of CGDs, we now focus on the dy-namic aspect, i.e., on how to structure the interaction of users with the dashboard, and on how users can explore the data underlying the dashboard application. Specifically, on top of the conceptual model for CGDs, we now describe how complex data can be organized into hypertext pages and which navigation paths are important.
For this purpose, we adopt the Web Modeling Language (WebML [3]), a concep-tual modeling notation and methodology for the development of data-intensive web applications. We use the language for the purpose of illustration only (we show a simplified, not executable WebML schema) and intuitively introduce all the necessary constructs along with the description of the actual CGD navigation structure.
The WebML hypertext schema (Fig. 4) describes the organization of our ideal web CGD. It consists of five pages (the boxes with the name labels in the upper left cor-ner), Compliance Home being the home page (note the H label). Each page contains a number of content units, which represent the publication of contents from the data schema in Fig. 3 (the selector condition below the units indicates the source data entity). Usually, there are many hyperlinks (the arrows) in a hypertext schema, representing the possible navigations a user might perform, but, for simplicity, we limit our explanation to only those links that represent the main navigation flow. Links carry parameters, which represent the selection performed by the user when activating a link (e.g., the selection of a process from a list). For the purpose of report-ing on compliance, we define a new content unit (not part of the WebML), the com-pliance drill-down unit, which allows us to comfortably show compliance data in a table-like structure (see the legend in Fig. 4 and the examples in Fig. 5).
Compliance drill-down unit: The unit allows a user to explore bidimensional and hierarchically organized data for compliance assessment. The selector condition of the unit specifies the two dimensions and the hierarchical nesting of concepts (NEST operator). Cells in the table represent the level of compliance of the first dimension with the second dimension; compliance levels are computed based on detected violations and represented by means of different colors.
Fig. 4 WebML hypertext schema structuring the navigation of CGD concepts and data.
Let’s examine the CGD’s structure (Fig. 4): The home page of the CGD provides insight into the compliance state of the company at a glance. It shows the set of most important indicators (Main indicators multidata unit) and a set of indicators grouped by their policy (IndByPolicy hierarchical index unit). Then, we show the (BU‐nits/Regul.) unit that allows the user to drill-down from business units to processes and from regulations to policies. A click on one of: i) the processes leads the user to the Regulations by Activity page; ii) regulations leads her to the Rules by BusinessU‐nits page; and iii) the cell of the table leads her to the Rules by Activity page. After the selection of a process, in the Regulations by Activity page the user can inspect the compliance state of each activity of the selected process with the given regulations and policies (RegByActivity), a set of related indicators (BPIndicators unit; the unit consumes the Process parameter), and the details of the selected process (Process data unit). Similar details are shown for policies in the Rules by BusinessUnits page, which allows the user to inspect the satisfaction of individual compliance rules at business
unit or process level (RulesByBU). A further selection in the compliance drill-down units in these last two pages or the selection of a cell in the BUnits/Regul. unit in the home page leads the user to the Rules by Activity page, which provides the user with the lowest level of aggregated information. It visualizes the satisfaction of the com-pliance rules of the chosen policy by the individual activities of the chosen process (RulesByActivity), along with the details of the chosen policy and process and their respective indicators. A further selection in this page leads the user to the Compliance violations page, which shows the details of the violations related to the chosen process/policy combination at an instance level in the Violations index unit.
The navigation structure in Fig. 4 shows one of the possible views over the data in Fig. 3, e.g., the one of the internal compliance expert. Other views can easily be added by restraining access to data and defining alternative navigation structures. Each page provides a different level of summarization (overview, process-specific, policy-specific, process- and policy-specific, violation instances), guiding the user from high-level information to low-level details. The time interval to be considered for the visualization can be chosen in each of the pages.
3.3 CGDs in Practice
To provide the look-and-feel idea we have implemented, in Fig. 5 we illustrate screenshots from our prototype CGD. The screenshots show views that clarify and consistently present our ideal CGD. Fig. 5(a) shows the Compliance Home page (Fig. 4), Fig. 5(b) the Rules by Activity page, and Fig. 5(c) the Compliance violations page. Compliance Home concentrates on the most important information at a glance, con-
densed into just one page (compare with Fig. 4). It represents the highest granularity of information. The five colored indicators (top left) are the most relevant, showing the most critical non compliant regulations. The gray indicators (right) report on the compliance with the three main policies. In the bottom, there is the interactive com-pliance drill-down table containing the compliance performance of business units and processes (rows) in relation to regulations and policies (columns). The user can easily reach lower levels of granularity by drilling down on the table or navigating to pages. For instance, the Rules by Activity page condenses lower level information concerning a combination of Business Process 1.1 and the company’s SOX policy. The colors of the cells represent the compliance performance of each combination. For instance, the Business activity 32.1 presents a critical situation regarding Rule 3 of SOX ‐ Section 301 (red cell) and weak performance regarding Rule 5, and Rule 6 (yellow cells).
A drill-down on the red cell, for instance, leads us to the Compliance violations page, which provides the lowest level of abstraction in form of a table of concrete, registered violations of the selected rule. The page illustrates the main information that must be reported to assist internal and external auditors. The data in the particular page reports all violations of one activity in Business Process 1.1 of Business Unit 1, detected considering Rule 3 of SOX ‐ Section 301. Each row of the table represents a distinct violation and the columns contain the typical information required by audi-tors, e.g., responsible of activity, dates and times, mitigation action, outcome of miti-gation action, type of applied control, cause of violation, frequency of control activity.
(a) Compliance Home page of the CGD with graphical widgets for the visualization of indicators and the compliance drill-down table.
(b) Rules by Activity page with process-
specific indicators and activity-level
compliance info.
(c) Compliance violations page with low-level details about individual violations for business processes and activities.
Fig. 5 Example CGD screenshots of our prototype implementation.
The amount and position of the graphical widgets for indicators, tables, summaries, and so on are chosen in accordance with our short-term memory and the convention of most western languages that are read from left to right and from top to bottom [5].
4 Implementation and Usage
The above described concepts are a joint result of the Compas and Master projects, which involve Deloitte and PricewaterhouseCoopers as industrial and auditing part-ners who participated in the design of and approved the models. Both projects share the same functional architecture from a reporting point of view (Fig.6). The CGD is set on the top of a data warehouse (optimized for reporting purposes) that implements the conceptual model described in Fig. 3. It is however important to recognize that this does not affect the logic behind the conceived navigation structure (Fig. 4), which represents a best practice for the rendering of compliance information to auditors, according to the experience by the industrial partners involved in the project.
Business processes
Business execution
Policies, event defs
Process engine
Monitoring
Event log
Business data
Data warehouse
AuditorCompliance
expert
Employees Web services
Compliance governance dashboard
ETL
Fig. 6 Functional architecture for logging business executions and reporting on compliance.
Both projects produce case studies that have been input - along with the experience of Deloitte and PwC - to the design of the dashboard. As an example in this paper we briefly describe the WatchMe scenario, developed in the Compas project. This scena-rio deals with compliance regarding licenses and QoS polices for a mobile virtual network operator (MVNO) in the context of online sales of digital artifacts. The MVNO provides video and audio streams to its mobile phone clients based on pre-defined plans. For instance, the Per-view plan states that clients can acquire (invoke a service) only n streams at price p, while the Time-based plan states that clients can acquire any number of times any possible streams from StartDate till EndDate of the plan. In addition to those plans, the MVNO has also to comply with the licenses de-fined by each video provider. For instance, Video1 can be downloaded and played with any audio; instead, Video2 can only be used with one specific audio stream.
To govern compliance in this scenario, all compliance concerns are expressed in domain specific languages (DSLs), which are translated to Esper rules for complex event processing during runtime. Events and detected violations are logged and stored in a data warehouse to be used for the computation of KCIs (e.g., amount of viola-tions, clients satisfaction index, average of unauthorized streaming downloads). Dif-ferent summarization levels and perspectives of analysis are implemented according to the WebML schema in Fig. 4; compliance drill-down units and KCIs (cf. Fig. 5-a) are rendered according to the users’ roles; e.g., violation details (low level) to internal auditors or IT personnel for root-cause analysis and main KCIs to external auditors as a start point for the auditing process.
The front-end of the dashboard is an interactive web application. The appealing graphical rendering of indicators is based on FusionCharts widgets, while the com-pliance drill-down table is AJAX-based. Queries over data are dynamically computed on the server and only rendered inside the client browser. The server-side support is based on Java and JSP. The data warehouse collects execution events, and indicators and process reconstructions are computed at ETL time (weekly or daily).
5 Related Work
Compliance has been investigated in several contexts yielding a variety of approach-es. In the following, we discuss related work in three areas that fall in the context of this paper, namely, compliance modeling, compliance dashboards, and Business Ac-tivity Monitoring (BAM).
Most of the compliance modeling efforts have been done with the aim of checking compliance, and, therefore, the resulting models consist in formalisms for expressing low-level rules for the compliance requirements. For instance, in [7] the problem of static (i.e., before process execution) compliance checking of process models against compliance rules is addressed by expressing the models in pi-calculus and the corres-ponding rules in linear temporal logic; then, model checking techniques are used to determine whether a process model complies with the rules or not. In [2], policies are modeled and checked as deontic sentences (i.e., rules are of the form “it is obligatory that X...” or “it is permitted that Y...”); then, a system can be compliant even if viola-tions occur, in which case, a second-level set of rules might be applied, for which, again, compliance needs to be checked. A similar modeling technique is presented in [8], in which Format Contract Language (FCL), a combination of defeasible logic and deontic logic, is used to express normative specifications. Once the FCL specification is built, control tags can be derived from it and used to annotate the process model so that control concerns can be visualized in the process model space.
To the best of our knowledge, there are no works on dashboards that specifically address the problem of visualizing compliance concerns. However, there are some works that, in part, deal with the problems we address in this paper. For example, [1] studies the problem of designing visualizations (i.e., the representation of data through visual languages) for risk and compliance management. Specifically, the study is focused on capturing the exact information required by users and on provid-ing visual metaphors for satisfying those requirements. In [4], the business perfor-mance reporting is provided in a model-driven fashion. The framework provides: data model, navigation model, report template model, and access control model, which jointly help designing a business performance dashboard. However, none of men-tioned approaches provides suitable navigation models supporting different analysis perspectives, summarization levels, and user roles.
Business Activity Monitoring (BAM) has gained a lot of attention during the last decade, and many tools have been proposed to support it. BAM aims at providing aggregated information suitable for performing various types of analysis on data ob-tained from the execution of activities inside a business. For example, tools such as Oracle BAM, Nimbus and IBM Tivoli aim at providing its users with real-time visual
information and alerts based on business events in a SOA environment. The informa-tion provided to users comes in the form of dashboards for reporting on KPIs and SLA violations. The compliance management part of these tools (if any) comes in the form of monitoring of SLA violations, which need the SLA formal specifications as one of its inputs. In our work, we take a more general view on compliance (beyond SLAs, which are a special case to us) and cover the whole lifecycle of compliance governance, including a suitable dashboard for reporting purposes.
It is important to notice that we do not provide any new compliance checking tech-nique; we rather focus on how to make the most of existing approaches by putting on top of them a visualization logic that is validated by auditors themselves, an aspect that is at least as important as checking compliance. Our work mainly focuses on the case of compliance and provides a conceptual model for both compliance and dash-boards, i.e., we present the relevant concepts regarding compliance and visualization and show the interplay of these two aspects. The purpose is that of providing com-pliance dashboard designers with a holistic and comprehensive view of the business and compliance aspects that characterized a good CGD.
6 Conclusions and Future Work
In this paper we have discussed a relevant aspect in modern business software sys-tems, i.e., compliance governance. Increasingly, both industry and academia are in-vesting money and efforts into the development of compliance governance solutions. Yet, we believe compliance governance dashboards in particular, probably the most effective means for visualizing and reporting on compliance, have mostly been neg-lected so far. It is important to implement sophisticated solutions to check com-pliance, but it is at least as important (if not even more) to effectively convey the results of the compliance checks to a variety of different actors, ranging from IT spe-cialists to senior managers.
Our contribution is a conceptualization of the issues involved in the design of compliance governance dashboards in service- and process-centric systems, the defi-nition of a navigation structure that naturally supports drill-down and roll-up features at adequate levels of detail and complexity, and a set of concrete examples that dem-onstrate the concepts at work. Our aim was to devise a solution with in mind the real needs of auditors (internal and external ones) and – more importantly – with the help of people who are indeed involved every day in the auditing of companies.
As a continuation of this work, we are planning to perform extensive usage studies in the context of the projects mentioned earlier. First, such studies will allow us to assess the acceptance of the proposed CGD by auditors in their everyday work. Second, the studies will allow us to understand which support for actions for mitigat-ing compliance problems or violations directly through the dashboard is desirable.
Acknowledgements: This work was supported by funds from the European Commis-sion (contract N° 216917 for the FP7-ICT-2007-1 project MASTER and contract N° 215175 for the FP7-ICT-2007-1 project COMPAS).
References 1. R. Bellamy, T. Erickson, B. Fuller, W. Kellogg, R. Rosenbaum, J. Thomas, T. Vetting
Wolf. Seeing is believing: Designing visualizations for managing risk and compliance. IBM Systems Journal, 46(2), pp. 205-218, 2007.
2. J. Brunel, F. Cuppens, N. Cuppens-Boulahia, T. Sans, J. Bodeveix. Security Policy Com-pliance with Violation Management. Proceedings of the 2007 ACM Workshop on Formal Methods in Security Engineering, pp. 31-40, 2007.
3. S. Ceri, P. Fraternali, A. Bongio, M. Brambilla, S. Comai, M. Matera. Designing Data-Intensive Web Applications. Morgan Kaufmann Publishers Inc., USA, 2002.
4. P. Chowdhary, T. Palpanas, F. Pinel, S.-K. Chen, F.Y. Wu. Model-driven Dashboards for Business Performance Reporting. Proceedings of the 10th IEEE International Enterprise Distributed Object Computing Conference, pp. 374-386, 2006.
5. S. Few. Information Dashboard Design: The Effective Visual Communication of Data. O'Reilly Media, Inc., p. 223, 2006.
6. J. Hagerty, J. Hackbush, D. Gaughan, S. Jacobson. The Governance, Risk Management, and Compliance Spending Report, 2008-2009: Inside the $32B GRC Market. AMR Re-search, 2008.
7. Y. Liu, S. Müller, K. Xu. A static compliance-checking framework for business process models. IBM Systems Journal, 46(2), pp. 335-361, 2007.
8. S. Saqid, G. Governatori, K. Naimiri. Modeling Control Objectives for Business Process-Compliance. Business Process Management, pp.149-164, 2007.
9. C. Giblin, S. Müller, B. Pfitzmann. From Regulatory Policies to Event Monitoring Rules: Towards Model-Driven Compliance Automation. IBM Research Report RZ 3662, Zurich, October, 2006.
10. K. Namiri, N. Stojanovic. A Semantic-based Approach for Compliance Management of Internal Controls in Business Processes. CAISE’07, pp. 61-64, 2007.
11. H. Trent. Products for Managing Governance, Risk, and Compliance: Market Fluff or Relevant Stuff? In-Depth Research Report, Burton Group, 2008.
12. J. Lam. Operational Risk Management – Beyond Compliance to Value Creation. White Paper, Open Pages, 2007.
13. L. Imrey. CIO Dashboards: Flying by Instrumentation. Journal of Information Technology Management, 19(4), pp. 31-35, 2006.
14. G. Evans, S. Benton. The BT Risk Cockpit – a visual approach to ORM. BT Technology Journal, 25(1), 2007.
15. E. Sloane, E. Rosow, J. Adam, D. Shine. JEDI - An Executive Dashboard and Decision Support System for Lean Global Military Medical Resource and Logistics Management. Proceedings of the EMBS Annual International Conference, pp. 5440-5443, 2006.
16. M.P. Papazoglou. Compliance Requirements for Business-process-driven SOAs. E-Government Ict Professionalism and Competences Service Science, July, Volume 280/2008. pp. 183-194, 2008.
17. A. Read, A. Tarrel, A. Fruhling. Exploring User Preference for the Dashboard Menu De-sign. In Proceedings of the 42nd Hawaii International Conference on System Sciences, pp. 1-10, 2009.
18. E. Allman. Complying with Compliance. ACM Queue, 4(7), pp. 18-21, September, 2006. 19. J. Cannon, M. Byers. Compliance deconstructed. ACM Queue, 4(7), pp. 30-37, September,
2006. 20. E. Oberortner, U. Zdun, and S. Dustdar: Tailoring a Model-Driven Quality-of-Service DSL
for Various Stakeholders. Workshop on Modeling in Software Engineering (MiSE), 2009. 21. F. Daniel, F. Casati, V. D'Andrea, S. Strauch, D. Schumm, F. Leymann, E. Mulo, U. Zdun,
S. Dustdar, S. Sebahi, F. de Marchi, M. Hacid: Business Compliance Governance in Ser-vice-Oriented Architectures. Proceedings of AINA'09, IEEE Press, May 2009.


![Aris Governance Risk Compliance[1]](https://static.documents.pub/doc/80x56/5525e85b4a79599d488b4dd2/aris-governance-risk-compliance1.jpg)


