483 ON THE GENERAL CIRCULATION IN THE SUBARCTIC PACIFIC Donald R. Reed and James D. Schumacher Pacific Marine Environmental Research Laboratory, NOAA Seattle, Washington 98115 ABSTRACT This work attempts to summarise the major features of surface circulation in the subarctic Pacific from lat. 40 N to the Bering Strait! ~ Effects of the density distribution geostrophic flov! and wind drift are considered. The Subarctic Current is a slov, eastward drift between lat. 40 and 50'N; in winter speeds increase about fourfold as a result of strong eastward winds. Speeds in the swifter Kamchatka Current-Oyashio may al.so be enhanced by vinter winds. The Alaskan Stream flows westward along the Alaska Peninsula and Aleutian Islands at peak speeds in excess of 100 cm/s, but it does not seem to have any large seasonal variation. Coastal currents of f Oregon-Washington generally reverse with a reversal in the seasonal vinds. Off southeast Alaska, the northward coastal currents are enhanced by vinter winds. The coastal Renai Current on the west side of the Gulf of Alaska increases in speed from about 25 to 100 cm/s in the fall as a result of a maximum in freshwater discharge. The Ruzoshio and Alaskan Stream undergo occasional large interannual variations; the processes in neither system are completely under- stood, however. El Nino events also produce dramatic changes in water properties and perhaps currents! along the eastern margin of the North Pacific' The climatological map of near-surface flow can be used to provide estimates of the movement and transit time of material in the ocean. Off Oregon-Washington and southeast Alaska, winter storms cosnunly cause shorevard movement that is greater than the alongshore flow. INTRODUCTION The task of attenspting to summarise the relevant features of the circulation of a large region of the ocean is a rather awesome one. The upper ocean is often rife with eddies and disturbed by large temporal cbanges, and it is difficult to obtain a firm grasp of the major features of flow for even a limited area from the results of a single survey of a few weeks. When one attempts to use data from «any surveys over various memsoms and many years, interpretation is subject to numeroussources of + a s shauera aal n 0. Toe'bias aditms! ~ vtocaeliaas ot tbsp Rortshos oe e'be Facy yea ~ eg 5mrieeSehrieg5S 2% mmtmbae Xtas, Soesbala, las+iia 1,S naSa Cosset.y Snaa TacE. }arne ~e Salk-~MI~54 lss5-
Transcript
483
ON THE GENERAL CIRCULATION IN THE SUBARCTIC PACIFIC
Donald R. Reed and James D. Schumacher
Pacific Marine Environmental Research Laboratory, NOAASeattle, Washington 98115
ABSTRACT
This work attempts to summarise the major features ofsurface circulation in the subarctic Pacific from lat. 40 N tothe Bering Strait! ~ Effects of the density distribution geostrophic flov! and wind drift are considered. The SubarcticCurrent is a slov, eastward drift between lat. 40 and 50'N; inwinter speeds increase about fourfold as a result of strongeastward winds. Speeds in the swifter Kamchatka Current-Oyashiomay al.so be enhanced by vinter winds. The Alaskan Stream flowswestward along the Alaska Peninsula and Aleutian Islands at peakspeeds in excess of 100 cm/s, but it does not seem to have anylarge seasonal variation. Coastal currents of f Oregon-Washingtongenerally reverse with a reversal in the seasonal vinds. Offsoutheast Alaska, the northward coastal currents are enhanced byvinter winds. The coastal Renai Current on the west side of theGulf of Alaska increases in speed from about 25 to 100 cm/s inthe fall as a result of a maximum in freshwater discharge. TheRuzoshio and Alaskan Stream undergo occasional large interannualvariations; the processes in neither system are completely under-stood, however. El Nino events also produce dramatic changes inwater properties and perhaps currents! along the eastern marginof the North Pacific'
The climatological map of near-surface flow can be used toprovide estimates of the movement and transit time of material inthe ocean. Off Oregon-Washington and southeast Alaska, winterstorms cosnunly cause shorevard movement that is greater than thealongshore flow.
INTRODUCTION
The task of attenspting to summarise the relevant features of thecirculation of a large region of the ocean is a rather awesome one. Theupper ocean is often rife with eddies and disturbed by large temporalcbanges, and it is difficult to obtain a firm grasp of the major featuresof flow for even a limited area from the results of a single survey of afew weeks. When one attempts to use data from «any surveys over variousmemsoms and many years, interpretation is subject to numerous sources of
+ a s shauera aal n 0. Toe'bias aditms! ~ vtocaeliaas ot tbsp Rortshos oe e'be Facy yea ~eg 5mriee Sehrieg 5S 2% mmtmbae Xtas, Soesbala, las+iia 1,S naSa Cosset.y Snaa TacE. }arne~e Salk-~MI~54 lss5-
484
uncertainty and possible error. Furthermore, the fundamental nature ofsame of the methods used to infer flow has not in every case undergonerigorous verification- Finally, the presentations of circulations areoften incomplete; for instance, effects of vind drift. and vave transportare frequently ignored. With these caveats in mind, ve-vill attempt toreview the state of lcnovledge of the circulation of the North Pacific northof about 1st. 40'N; our goal is to emphasize features that would have majoreffects on the drift of material.
First, we vill examine the major types of motion that are generallyimportant components of ocean currents. The climatological mean upper-ocean circulation in the subarctic Pacific is then shown and discussed.examination of seasonal and interannual pertnrbations on the mean flow isalso attempted. Finally, we highlight certain features of flow that may beespecially relevant to the fate of debris in the ocean.
Types of Notion
To clarify much af the discussian to follow, some elementary conceptsof the nature of the major kinds of ocean currents vill be explained.Those that seem important to ua in the context of this presentation aregeostrophic flow, wind and wave drift, long vaves, and tidal currents.Geostrophic Flow
Geostrophic or Berth-turned! flov results from a balance betveen thedensity or pressure gradient force and the deflecting force of the Earth' srotation. No actual statement is made about vhether flow results from thedensity distribution or the density field results from the flow. In gen-
thoughy ve consider the density f ield to result fram unequal coolingand heating, variable freshvater input, and the large-scale stress of thewinds. The requirements for pure geostrophic flow are quite restrictive asteady state, straight-line flow, no friction, and no change in flow alongits path McLellan 1965!!, but many recent comparisons indicate that flowbelow the windmixed upper layer is generally at least quasi-geostrophic within a fe» percent of an exact force balance!. Hence, geostrophic flowcalculations are a powerful tool, and they can be based on the very largedata set of hydrocasts conductivity-temperature-depth and Nansen bottlecasts! built up over decades. Furthermore, the calculations often appearto be valid even in relatively shallov water Schumacher and Kinder 1983 ! pand intermediate reference levels �,000 and 1,500 m! in the deep ocean inthe northern Pacific aeea to result in only slight deficiencies in speed Raid and Arthur 1975!. Nsch of the information presented below is basedon uae of the geoatrophic relation.
Wind and Wave Drift
The direct action of wind stress on the sea surface produces currents;in addition, vaves also form, and they in turn have a residual velocity inthe direction of the wave train as a result of Che fact that the particleorbita decrease in sine witb depth Pond and Pichard 1978, for example! .This wind drift El@tan floe! and vave driit Stoitea drift! may result inappreciable speeds in the upper 50 m or so during times of strong vinds.< schematic representation of the possible combined ef facts of geostrophiclovi wind drift, and wave drift is given in Figure L ~ Xt appears that
485
~ Wind
0 cm/sec l0 20Om
200
Coa
600
800
P~e 1 -Repteeeatative exaep1e of the coabiaed ef fecte of geoetzophicfhe, phd Chift, cab «eve drift.
486
eEkman spirals" surface current 45' to the right of the wind, with veloc-ity decreasing and turning clockwise with depth! seldom obtain in the realocean, and the combined effects of wind and wave drift seem to produce aflow of nearly constant direction which does not diminish greatly untilnear the bottom of the mixed layer James 1966; McNally 1981! ~ Precisemeasurements of the exact behavior of wind and wave drift are very hard tomake because of the difficulty of separating tbe components and eliminatingthe effects of other flows. Mcnally �981! analyzed a large set of drifterdata which suggests that the upper 30 m moved at about 1.5X of the «indspeed at 20' to the right of the «ind dir'ection. This approximation is usedhere.
Long Waves
The long waves examined hare are planetary waves and ReI.vin waves.Other types of long waves exist but are, except for tidal currentsdiscussed below, not believed to be of general importance to the problemsto be dealt with. Although it may be an oversimplification, planetary~aves may be thought of as highly curved ocean currents that result frominteractions with bottas topography or from strong velocity shear. Some ofthe observed variability in thermal and density structure results fromthese features, especially in the subtropical gyre Hagaard 1983! ~Planetary waves seem to be prevalent in the Ruroshio but are not commonfeatures of the Alaskan Stream Reed and Schumacher 1984!. Since we cannotproperly specify them and their effects on surface flow, they will not bedealt with further. Kelvin waves are long boundary waves near a coastlineot' the Equator! that are often initiated by large changes in the wind Voorbis et al. 1984!. They are quite important along the Equator andappear to be a major factor in the initiation of El Nino events and their'poleward spreading Wyrtki 1975! ~ Thus, some of the large interannualchanges seen in the subarctic Pacific are linked to these waves.Tidal Currents
Currents associated with the rise and fall of the tide are typicallyonly ca. 2 cm/s in the deep ocean but can easily be 20 cm/s in water depthsof 100 m Dietrich 1963!. Ience, they are of no importance to processessuch as larval drift in the open ocean, but their relatively highvelocities in shallow water make thea a critical factor for the movement ofmaterial in the nearshore environment.
CLimatological Mean Circulation
figure 2 shows tbe paths of a number of drifting buoys from a study byMcIally et al �983!; the data are not examined in detail bere, and thefignre is only meant as an aid to orient tbe viewer to the larger-scalefeatures of the Ilortb Pacific near-surface circulation. Note the Kuroshioand its eastward flo», which forms the northern boundary of the subtropicalgyre, and the North Equatorial Current and the countercurrent to the south.The gubarctic Gnrrent and flow into the Calf of Alaska are also shown-@gore 3 shows the tracks of drifters Reed 1980! that «ere deployed in theQas4n Stream bmt followmd nones of recirculation south into the SuharcticCurrent and baclr. into the Calf of klaska. One drifter moved into thecoastal 4nai Current lte will concentrate helm on features of theamharctic circulation
487
Vg
i.
/.r
b
eQ|Q
Qh 'I I,pvf 0
~ EZe
Z
V!M ]
Os
Q
z
K !~x,"
QK '0-
4 4ltJ W
X o
g' e'W
4J
WW
4 4o a
JJ44k
O$h Cl0 'CI
kk W
Cl4 4JO 'A
V
g
< 0C!
IWO 4!
V ~
lt 00OCl4 r54
I cAJ
cv ~
5t~C5 0 U44
g
488
Ch0 r0 Ch
CICJ
~ Rcl W
I4J COCl w
W m4
Il4
CIO IXI
WIO '0CJ 4l
CI'Ct DCct~ el gIO 4~W0 ~
O00 Wa oO
~ A4J I4W
W0 W
0W
8I IP
4J0 m
CCI 0lC
I4 e
489
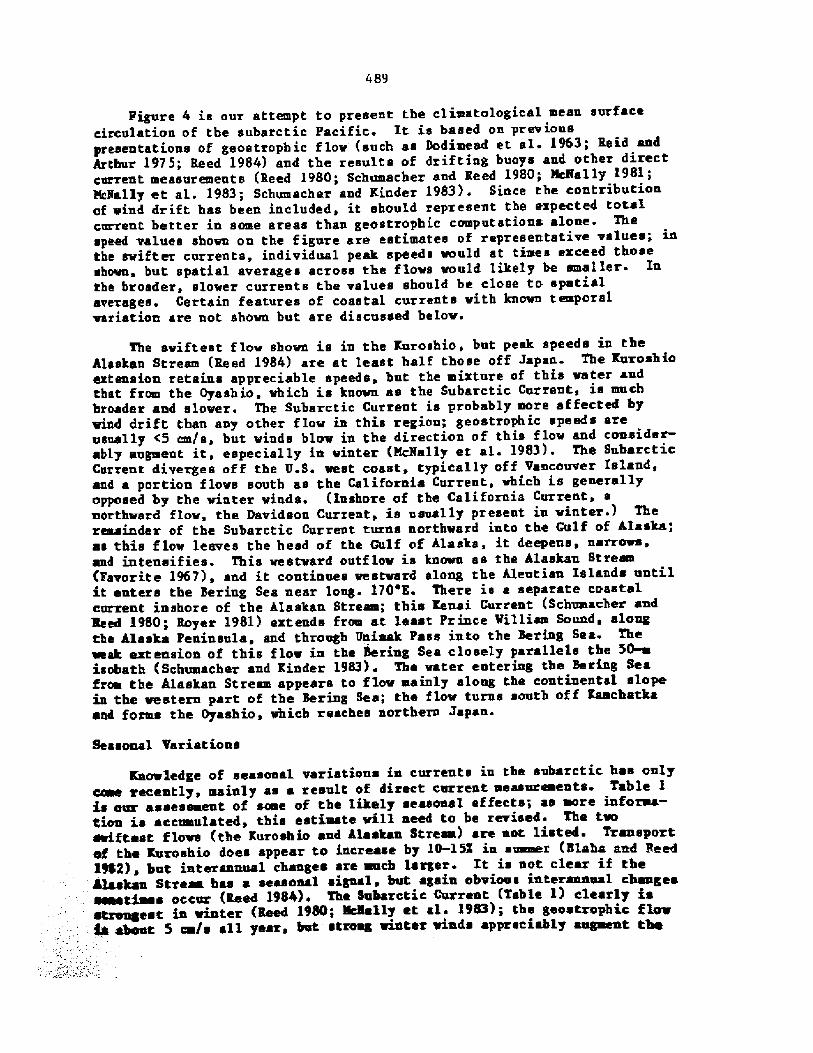
Figure 4 is our attempt to present the climatological mean surfacecirculation of the subarctic Pacific It is based on previouspreseatations of geostrophic flow such as Dodimead et al. 1963; Raid aadArthur 197 5; Reed 1984! aad the results of drifting buoys aad other directcurrent measurements Reed 1980; Schumacher and Reed 1980; Mcmally l981;McNaliy et al. 1983; Schumacher and Kinder 1983!. Since the contributionof «ind dr ift has been included, it should represent the expected totalcurrent better in some areas than geostrophic computations alone. Thespeed values shown on the figure are estimates of representative values; intha swifter currents, individual peak speeds would at times ezceed those~ howa, but spatial averages across the flows would likely be smaller. Iaths broader, slower currents the values should be close to spatialaverages Certain features of coastal currents with known temporalvariation are aot shown but are discussed below.
The swiftest flow shown is in the Xuroshio, but peak speeds in theAlaskan Stream Reed 1984! are at least half those off Japan The Kuroshioexteasion retains appreciable speeds, but the mixture of this water aadthat from the Oyashio, which is known as the Subarctic Current, is smchbroader and slower. The Subarctic Current is probably more affected bywind drift than any other flow in this region; geostrophic speeds areusually <0 cm/s, but winds blow ia the direction of this flow aad consider-ably augment it, especially in winter McNally et al. 1983!. The SubarcticCurrent diverges off the U.S. west coast, typically off Vancouver Island,and a portion flows south as the California Current, which is generallyopposed by the winter winds. Inshore of the California Current, anorthward flow, the Davidson Current, is usually preseat in winter.! Theremainder of the Subarctic Current turns northward into the Gulf of Alaska;ms this flo» leaves the head of the Gulf of Alaska, it deepens, narrows.mnd intensifies. This westward outflow is knowa as the klaskan StreamCFavorite 1967!, and it continues westward along the Aleutian Islands untilit enters the Bering Sea near long. 170'E. There is a separate coastalcurrent inshore of the Alaskan Stream', this Renal Current Schuaacher andIsed 1980; Royer 1981! extends from at l.eeet Prince William Sound, alongthe Alaska Peninsula, and through Unimak Pass into the Beriag Sea. Themak extension of this flow ia the bering Sea closely parallels the 5'isobath Schumacher and Rinder 1983!. The water entering the Bering Seafrom the Alaskan Stream appears to flow mainly along the contineatal slopein the western part of the Bering Sea; the flow turns south of f Kamchatkaand forms the Oyashio, which reaches northern Japan.
Seasonal. Variations
Knowledge of seasonal variatioas im currents in the subarctic hms onlycree recently, mainly as a result of direct current measurements Table 1is our assessment of some of the likely seasoaal effects; as more informa-tion is accumulated, this estimate will meed to be revised. The tmSwiftest flows the Kuroshio and Alaskan Stream! are aot listed Transportof the Kuroshio does appear to increase by 10-15Z in summer Ilaha and Need1952!, bat iateraaaual changes are mach larger. Xt is not clear if theAlaskan Stre~ has a seasonal signal, bmt again obvious iateraaaual. changes~ eeetiams occur Reed 1984! The Sabarctic Current Table I! clearlyetxegest in winter Reed 19N; Wally et al. 1983!; the geoatrophic Qow4 abet 5 ca/s all year, but stxoag winter winds appreciably aagmemt the
490 0 fV
0 0 CDCXl
W0
CD
49l
Table I.--Estimates of the seasonal variation in various surfacecurrent regimes in the eubarctic Pacific.
Minimum Hsxinamflow speed flow speed
cm/e! Direction Time cm/s! directionCurrent or
region Time
Minter 20Snbar ctic
Current
Lat.V'-50 s!
Summer
Southvard Mint er 50KamchatkaCurrent
Soutbvard30Summer
Bering Sea Summer flow along5~ isobath!
VariableVariable Winter
KenaiCurrent
7525Winter,sprlllg!summer
So uthwe stSouthwest Pall
Alaska,southeast
coastal
Northward Winter 20Summer Nortbva zd
Oregon-Mashingtoncoasts
Wia ter 20Spr ing- 20susme r
Horth
flaw in the mixed layer. The Kamchatka Current probably has significantwind drift southward ia vinter. Raid �913! concluded that this currenthaa increased baroclinic structure and geostropbic flov in winter, butObtaai �970! casts doubt on this being a large-scale general feature oftbe flov.
The remainder of this section deals vith coastal currents Zn tbeeastern gering Sea, the coastal flow along the 50m isobath appears to havegreater speeds in vi.nter than summer Scbumacher and Rinder 1983!, pres~ably through some action of the winds. Iu this and other areas of tbeshallow gering Sea, intermittent ice melt in winter may also providelocaliaed, occasional sources of buoyancy that enhance geostzophic f Low.ibe XerLai Current undergoes a relativeLy Large and rapid increase ia speedin the fall usually October!; this change is not mainly produced by windsbut is the result of a dramatic increase in freshwater drainage at thistime Scbumacber and Reed 1980; Royer 1981!. Tn the coastal ~aters ofsoutheast hlaska, direct current measureaents and sea level suggest enincreaae in northward speeds in vinter Lagerloef et al. 1981; Reed amd
. Scbumacber 1981!, probably as a result of persistent winds fram the soutb.Ceaatml currents off 0regon amd Iasbimgton also se~ to change seasonally.
492
flov is typically southward in spring and suauaer in conjunction withcoastal upvelling, but a northvard flow the bavidson Current! exists invinter Buyer and Smith. 1983!- Some of these changes probably result fromlocal. vind stress, hut the large-scale winds and alongshore pressuregradient may also be important Hickey 1981! ~
Interannual Variations
By interannual variations, we mean changes that occur intermittently;smae of them may happen most often in one season, but they do not occurevery year. The Kuroshio path undergoes large changes every fev years; onemode is relatively straight flow along the coast of Japan, and the other isa large offshore meander Taft 1972!. Changes in speed and transport alsoseem to occur, but variations in relation to mechanisms may not have beencompletely resolved' Recent data Reed 1984! have revealed an interannualchange in speed and transport of the eastern part of the Alaskan Stream asshown in Figure $. In February-March 1980 the source waters of the streamhad all entered the head of the Culf of Alaska, and peak speeds vere about100 cm/s In August-Septmaber 1981 about balf of the source water enteredthe stream betveen long. 150 and 165 V; peak speeds to tbe east vereonly about 50 cm/s, but values along the kleutians were similar during thetwo cruises. It vas suggested Reed 1984! that this large-scale change,which is not entirely seasonal, resulted from the effects of differentialvertical displacement of the pycnocline caused by an unusual distributionof wind-stress curl in the region of the inflowing source waters.
kt least one other interannua1. event is of importance to the subarcticPacific' .the El Nino phenasenon. Narked changes in vater temperature andsea level may occur all along the eastern margin of the Pacific and intothe Gulf of Alaska Enfield and Allen 1980!, and these anomalies arepresumably accompanied by some changes in currents. Cannon et al. inpresa! concluded that since about 1920 the EI Nina events of 1941, 1958,and 1982 have produced major changes as far north as the Gulf of klaska;the large tropical El Iino of 1972 did not cause large anomalies north ofCalifornia, however. Some of these, changes appear to be caused byanomalous northward flow Smith and Buyer 1983! associated vith a long wavepropagating from the Equator, but drifter tracks in winter 1982-83 suggestthat the process vae also aided by anomalously strong northward vind drift T. C. Royer pere. commun.!. The effects of EI Nino events may be felt fromsouthern California to the Calf of Alaska, and even into the Bering Sea,for a distance of about 300 km off the coast, but elsevhere the effectsseem to be much less marked. This process nay affect the drift of material~ s a result of the amaalous currents produced.
Inferences on the Fate of Debris
For assessing the likely «ovement of material on the surface of tbeoceans one would like an actual current forecast similar to weatherforecasters In the absence of such information, climatological information<Fig 4! can be useful. For example, if an object entered the ocean offnorthern Japan, it should arrive off the U.8. vest coast about 2 years
B the object extended above the eater, direct windage effectsmight apWeciahly lessen this time. ke another erample, aesanae thatmaterial entered the Renai current near long 150 'N. kboat 40 days later
493
Figure 5--~opoteatial topography ia dye a! of the eea aerface, referredto 1,500 lB, February � March 1980 aud kuguat-September 1981 fraa Reel1984! .
494
it should be asar Unimak Pass at long. 165'S;- during the fall velocitymaximum, it may traaeit this distance in about 1 5 days'
Qhsa material enters the nearsbore eavironmeat, climatologicalinformation should be used with coasiderable caution. Waters thatnormally move alongshore may be transported toward share by a storm ofbrief duration For example, this is apt to happen ia winter off Oregonand Washington, where material is frequently driven onshore and litters tbebeaches. Rater velocities associated with strong winds probably exceed 3Ocm/s, which is greater than tbe typical alongshore velocities. Thus,material moving east ia the southern part of the Subarctic Current maycontiaue south ia the California Curreat or be driven ashore, mainlydepending on local weather conditions. Similar processes occur along thecoast off southeast dlaska. Finally, tidal currents may play a role incoastal waters, where water displacements during balf a tidal cycle aretypically about 5 hm Dietrich 1963!. Thus, material msy be transportedinto bays or estuaries at times.
Currents that affect the drift of material. are quite variable in spaceand time. One seldom has adequate information to make reliable diagnosticpredictions of trajectories- Models are useful, however, becauseprobability can supplement the limited deterministic information.
LITERATURE CITED
Blahs, J., aad R. Reed.
1982. Fluctuations of sea level ia the «cetera North Pacific andinferred flow of tbe Kuroshio J. Phys. Oceanogr. 12:669-678 ~
Cannon, G. k., D. K ~ Reed, and P. E. Pullen.In press. Comparison of Bl Sino events off tbe pacific Northwest. In
V. S. Rooster editor!, El Sino effete in the eastern subarcticPacific.
Dietrich, G.1963. General oceanography. d. Riley, N.Y., 588 p.
Dodimead, k. J., P. Favorite aad T. Hiraao.1963. Review of oceanography .of the subarctic Pacific region. Int.
North Pac. Pish, Comm. Bull. 13, 195 p.
Enfield, D. E ~ , and J. S. kllen.1980. On the structure and dynamics of monthly mean sea level
anomaliea along the Pacific coast of Sortb and. South America. J.Phys. Ocsanogr. 10;557-578.
Favorite, F.1967- The Alaskan Stream. Int. North Pac. Fish. Comm, Iull. 21, 20 p
Iictsy, 5. S.1981 klongshore coherence oa the Pacific Northwest continental shelf
January-april l975!. J. Phys. Ocsanogr. 11:822-835 ~
495
Buyer, k., and R. L. Smith.1983- Physical oceanography of continental shelves: Pacific
North~est. Rev. Geophys. Space Phys. 21. 1155-1157
Ja«es, R. W,1966 ~ Ocean tber«al structure forecasting. U.S. Nav. Oceanogr.
Off., Spec. Publ. 105, Wash., D ~ C., 217 p.
Lagezloef, G. S. E., R. D. Miueuch, and J. D. Scbumacber.1981. Low-frequency variations in currents near the shelf break:
Nortbeast Gnl f of Alaska. J. Phys. Oceanogz 11:627%38.4
lhgaard,l983 . On the potential energy of baroclinic Rossby waves in the North
Pacific. J. Phys. Oceanogr. 13:38-42.
KcLellan, H. J.1965. Elements of physical oceanograpby. Pergamou Press, Oxford,
l51 p.
Mcnally, G. J.1981. Satellite-tracked drift buoy observations of tbe near-surface
flow in the eastern mid-latitude North Pacific. J. Geophys ~ Res86:8022-8030.
NcNally, G. J., V CD Patsert, A. D. Xirwan, Jr., and k. L. Vastano1983 ' The near-surface circulation of the North Pacific using
satellite tracked drifting buoys J. Geophys ~ Ras. 88:7505-7518 '
Ohtani, X.1970. Relative transport in the klaskan Strea« in winter J.
Oceanogr. Soc. Jpn. 26:271-282 ~
Pondf Sag and G. L Pickard.1978. Introduction to dyne«ic oceanography. Pergamon Press, Oxford,
241 p.
Reed, R K.1980. Direct measurement of recirculation in the Alaskan Stream- J.
Phys. Oceanogz. IO:976-978.
1984. Plow of the klaakau Stream and its variations Deep-Sea Res31:369-386.
Reed, R. K., and J. D. Scbumacher1981. Sea level variations in relation to coastal flow around the
Gulf of klaska. J. Geophys. Res. 86:6543&546 '
1984. kdditioual current «easurcments in the klaskan Strea« nearKodiak Island. J. Phys. Oceanogz 14:l239-1246.
197S. Interpretation of maps of geopotential anosaly for the deepPacific Ocean. J. Mar. Res. 33:37-52. Suppl.!
Royer, T. C.1981. Baroclinic transport in the Gulf of Alaska. Part II: Fresh
mater driven coastal current. J. Mar. Res ~ 39;251-266 ~
Schumscher, J. D-, and T. 8- Xinder.
1983. Low-frequency current regiIms over the Bering Sea shelf. J.Phys. Oceanogr. 13:607&23.
Schumscher, J. D., end R. X. Reed ~1980. Coastal flow in the northwest Gulf of hlaska: The Xenai
Current. J. Ceophys. Res. 85:668G-6686 ~
Smith, R. L., snd k Buyer.1983. kdvection along the vest coasts of the kaericae during 81 Nino.
khstr.! EOS, Trans. Ae. Geophys. Union 64:1045.
Taft, E. k.
1972. Characteristics of the flmr of the Xuroshio south of Japan. In8 Stanmel and X. Yoshida editors}, Xuroshio: Its physicalaspect ~, p. l6S-216. Univ. Tokyo Press, Tokyo.
Voorhia! k.! J. R. Luyten, C. Needell, and J. Thomson.f984. Mind-forced variability of upper ocean dynamics in the central
Pacific during PEQUOD. J. Phys. Oceanogr. 14;615-622.
Myr tki ! X,1975. El line � The dynamic response of the equatorial Pacific Ocean
to atmospheric forcing. J. Phys. Oceanogr- 5:572"584.
497
OCEANOGRAPHIC FACTORS AFFECTING THE PREDI CTABI LITTOF DRIFTIMG OBJECTS AT SEA
Jerry A.. GeltOffice of Oceanography aud Marine Services, NOAA
Seattle, washington 98115
movement «ithin the oceans is turbulent. One of the obviousimplications of tbis stateaeut is tbat there is a random oruncertain character to the path that any particle may take- Thissuggests that, altbough the most probable or mean path of afloating object may be well defined by the most probable or meancurrents, there is error or uncertainty that is associated. withthe predicted particle trajectories. This paper vill discuss therelationships bet«een oceanographic processes and this uncertainty.
The path of a floating object can be thought of as aLagrangian trajectory. Its buoyancy imposes au importantconstraint and limits its motions to the special subset of t«o-dimensional movement. T«o&imensional surface motion evenrandom or turbulent! is subject to the kinematic constraintsassociated with the incompressibility of water. This means thatany vertical motion of the upper layers of the ocean must becoupled to a corresponding convergence or divergence of thesurface currents. Convergences act to collect or concentratefloating particles antispreadiag or reduced uncertainty!;whereas divergences vill act to scatter and spread out floatiugparticles' As a familiar example, tbe small-scale foam lines and"tide ripe" seen in coastal waters represent strong collection orprocesses where the vertical «ster movement in the surface layertotally dominates diffusive or turbulent scattering processes.The significance of these processes on the predictability offuture flotsam positions is discussed in this paper. A number ofoceanographic processes can potentially contribute to tbeconvergence or divergence of the surface currents. On thelargest midocean scales the curl of the wind stress field andRosaby waves contribute to these processes. Both of theseprocesses typical.ly have strong signatures in the baroclimictemperature and salinity fields; the use of these signatures asfactors in predicting trajectories is considered On the smallerscaLe of the continental shelf, tbe effects of variablebathymetry can become important ia the prediction problem. Evencloser to shore, coastline configuration, fresh«ater runoff andtidal currents can all become important mechanisms. Each ofthese mechanisms is discussed.
s. Sbeaera oak n 0 Tensile ekitare!i ttocevaisss of the Sow~ oa cbe sate +ac xesece-ag hrSe n a i, m-xs n ~r lss4. s ~t 1~. n il.- s-s- he- ce r., sow xw. n.~, tuaa-~ass-sere-ss. ass.
498
INTRODUCTION
For ages people have gone to beaches and found flotsam that hastraveled possibly over truly global distances to arrive at some particularspot. Glass ball floats found along the Pacific coast of the U.S. are oneexampLe; dr'iftwood found along the Arctic coast of ALaska is another.anyone who has spent time at sea knows that drift can be puzlling, even onlocal scales. For examples where is the buoy that came loose during thenight, or for that matter, what are the odds of successful recovery duringa man overboard drill in rough seas' On even smaller scales, seweroutfalls deliver material into the ocean or into the marine environmentvith the absolute conviction that it vill be lost and not accumulate in thevicinity at which it was injected into the system.
Mobility of the ocean surface is obvious to any observer. Mixing andmoving are clearly operating over a wide range of time and length scales.Trajectory analysis is the intent to determine particle pathvays whichaccount for all of this movement and spreading. This type of analysis canbe considered from a source point of view i-e., something entered thewater here, and one vouId like to know where it vill be as time goes on!,or from vhat is known as a receptor point of viev i.e., this is the spotwhere something vas found, and I would like to knov vhere it came from, aodhow long it took to get bere!. In either case it is necessary to knowabout the various scales of movement and spreading that are found in theoca an i
For the purposes of this paper, I will confine my attention to objectsthat are buoyant and thus constrained to move vith at least some part oftheir structure at the surface of the ocean. I vill also concentrate ontrajectories of particles at sea and not consider the processes that affectbeaching. I «ill attempt to go over some of the factors that control themovement of floating objects and the uncertainties surrounding theestimates of this movement-
The next section of this paper will discuss the ways ve typicallydivide movementa into currents on the one hand, and mixing or syreadingterms on the other. Zn addition, I vill discuss the typical oceanicrelationships between advective and diffusive scales. The third section. ofthis paper vill cover scaling discussions for a number of oceanographicproceeses to estimate their influence on spreading, and thus the"findability" of-objects adrift on the ocean surface. The final section ofthis paper will discuss mixed comyutational and tracking methods for use intrajectory analysis.
Xmr CmntgNTS, TILBVmrCE, mn UNCZRTalNTY
%mt ve think of aa average or mean currents clearly depend on vhattime and syace scales ve wish to consider. Xn moat cases, the choice is acompromise between «hat we would like to know and the amount of data thatia availabLe For exampIe, with only flotsam data, ve could aay that theaverage or mean currents seem to run from the North Pacific to the Oregoncoast because we find glass ball floats there!, or that the coastalcurrents east of Poiat Sarra» all run from the east since the driftwoodtherm haa its origins in the valley of the Mackenxie!, while the currents
499
to the south and west of Point Serrow all run to the north through theChukchi Sea since all the driftwood there haa its origin in the YukonValley!. h little travel up and down the west coast of the U.S. clearlyshows that the mean currents exhibit some variance since glass ball floatsare widely distributed. Starting from these admittedly simple examples. wewould like to consider a more quantitative way of looking at what we. callthe "mean currents" and its variance. We vill then try and see if thisquantitative information can be used to make some estimates about the easeof tracking or finding floating objects at sea.
h nore or less traditional starting point for midocean currentestimates is the geostrophic equations, and what is known as the dynamicheight method of current analysis" Fomin 1964!. When used with averageseasonal data, these familiar techniques give the large-scale circulationpatterns that are used in most marine atlases and provide the conventionalwisdom about which vay the vater flows. Many of the results presented byauthors in this conference are based on this type of analysis. Detailedmeasurements of vater movements and density fields indicate that even whenthe geostrophic relationships are true, small imbalances can lead to time-dependent changes in the f lov, and so-called quasi-geoatrophic motions areobserved Pedlosky 1979!. These quasi-geostrophic motions can be analyxedaa Iossby waves and appear in the atmosphere as the familiar high-lowpatterns that are seen on weather maps. In the oceans, these are mesoscaleeddies, rings, or thermal anomalies such as thought to be responsible forKl Iino patterns. On still smaller scales, we find current variationsassociated vith internal vaves, windrows, or Langmuir cells, and thisnesting of still smaller and smaller scales can go on ad infinitum- Inpractice, we must draw the line somevhere and make a pragmatic separationin what is really a continuum of scales of motion. In this separation wedecide that scales above some certain level will be resolved, and these«ill be called "currents;" scales below that level vill not be resolved andthese vill be cal.led "turbulence" or "uncertainty." Obviously, oneperson's turbulence could be another person's currents, and often is- Forthis work, I vill stick to traditional, midocean seal.es and considercurrents to be geostrophically balanced.
Given geostrophic current patterns, what can we do about all the othervariations and uncertainties that are left out of our definitionT Toreally answer vhat they mean, ve would have to know what they all mean,which is out of the question. Fortunately, there are smse relativelysimple models that ve can use to represent these uncertainties in astatistical. way. One of the easiest to understand and most useful wasoriginally proposed by Einstein while he was working on studies of Krownianmtion Csanady 1973!- This model is baaed o» the idea of a random walk,ice ~ that in each successive time step, an object will move in a randomstep, either north, south, east, or west «ith a probability of 25I for eachoption Statistical analysis shows that after a number of such steps thedistribution of possible positions «ill take oa a two&imnsional, Gaussianchapel and if one were to repeat the experiment with a large number ofcases, their cumulative distribution «omld look exactly like the classicalnotation to the diffusion equation, or the so-called distribution ofvariables equation Sverdrnp et al 1942!. This simple conceptual modelt'tea provides a framework which allows me to relate mncertainty to the
. esffeeta seen in turbulence or larae-scale eddy diffuaioa. Tn the ocean,rome authors have matched distribution af variables with the
500
distribution equations and eval.usted effective eddy coefficients Proudman1953; Defant 1961!. This vill allow at Least an order of magnitudeestimate of «hat the oceanic levels of spreading should be. That is tosay, from these coefficients ve can go back to the random walk theory andcalculate the random mean increase in particle separation and thusestablish a relationship between the eddy coefficients, uncertainty, andthe average spreading velocity for drifting particles.
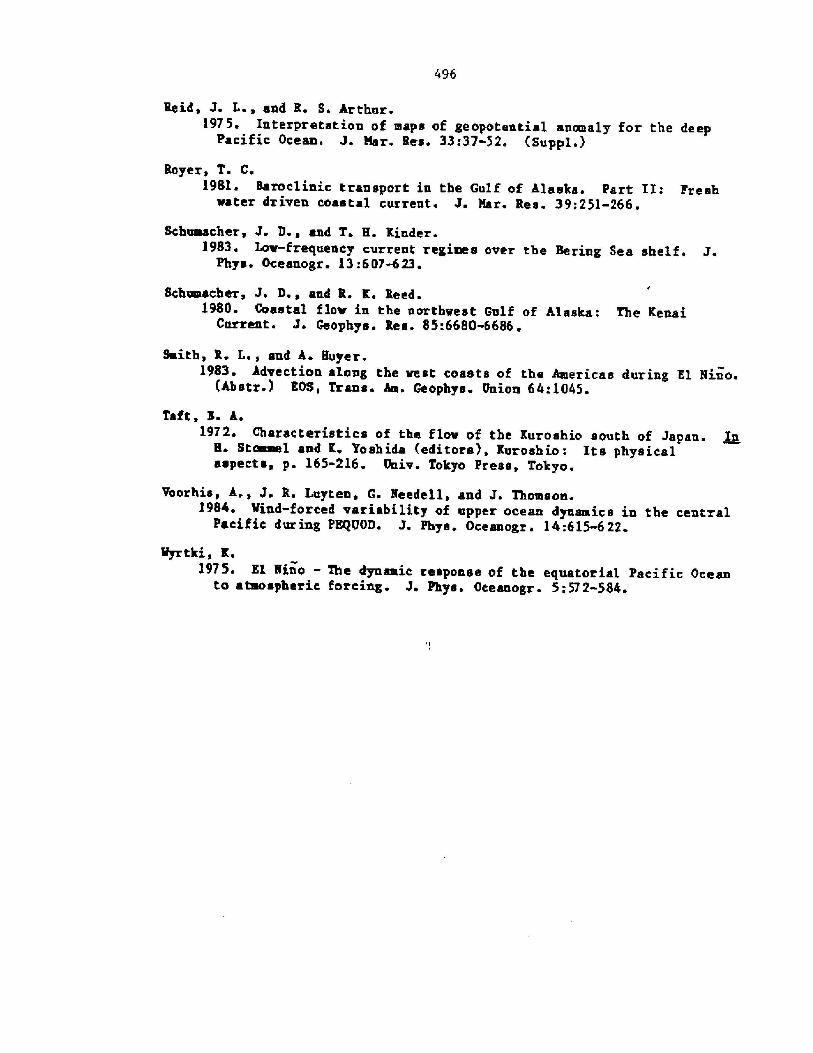
To provide a more concrete example, Figures la, lb, Ic, and ldindicate the results of a seriea of random walk experiments superimposed ona 1-knot current. In each case ~ 10 particles vere tracked over a period of100 h, «ith increasing diffusion velocities random step size ! andcorrespondingly bigger advective eddy diffusion coefficients or uncertaintyvalues. The values of diffusion coefficients shovn here span typicalmidocean values that are obtained from tide distribution studies. On thelov side Fig ~ la! ve see that vith a diffusion coefficient of about LOthe corresponding spreading velocities are 0.08 of s knot, and most of theparticles vould be expected to lie within a circle 10 to 15 nmi after about4 days of travel. On the high ~ ide Fig. Ld!, with a diffusion coefficientof about 5 x 10 ~ there is an equivalent spreading velocity of about 0.5knot, and the particles are likely to be scattered over a 40 to 50 nmicircle after 4 days of travel.
Before leaving our simple model for drift calculations ve should pointout that any floating object vil.l be influenced by surface vinds, as veILas by the currents. The relative magnitude of this effect vill depend onthe exposed area and the relative subsurface drag. For the present work,ve vill consider this to be relatively unimportant with the reservationthat in saae special cases, the trajectory analysis would be quite wrong ifthese effects «ere not includedi
From vhat is presented in Figures la-ld, it is seen that even inrelatively steady or noaturbulent, midocean regions, the uncertaintyassociated «ith the position of a drifting object is likely to increase t'oa number of miles over the space of a fe» days. Thus, if the aim is tofind an object that is small or offers lov visibility, then recovery ortree'king «ill always be difficult. We vill nov consider a series ofoceanographic processes that may counteract the potential spreading ofobjects and thee may' improve the odds of predicting trajectory pathways.
OCRkSOGlULPRIC PROCESSES
Any floating object aust remain on the surface of Che ocean. Thisconstraint impoeea a» important coupling between the possible surfacetrajectory pathmays that it could take and the vertical velocities in theupper layer of the ocean. Sustained vertical velocities upvelling ordovnvelling! have often been identified «ith anomalous biological activity.They also clearly affect the spreading or concentration of surface watersand, consequently, anything that ia floating in them- In the simple,conceptual model. that mas introduced in the last section one can look atsome oceanographic processea that induce vertical velocity> dovnveLIing inparticlmlar, and eatiaate «bather they might have a significant effect omthe «mcertainty of being able to track or locate objects at sea.
cn~o
zX Y
ROLkI LUI 4JV Q~ cn
~ CL:
h~
cACXCA
X C!+o
cn ~I OlQNZNY CDPa
aQW
I- gLJ ~O u.
LklLLI O
X ZQ CDcn cll
M Ik
O O
cn
o CV
cnCK
Z YCDo cn
IZ OLkl LuI LkiIk CL~ cn
cn g
~ I
hP Yoo cn
Cg OI LVLk O.~ cn
cn g
LLI ~X: ~Lkl ~
A X
cnCI. I-
O
LJuJCAC3'CA
Cl
CD
I o
III
I- gO IkQ u
lJJw CD>uK ZCD CDcn cA
U LkLkO O
CAC7-CA
E 42+
IQnZ ~Yo0D
el
gO V.~ LULsJ CD>uX Zoacn cn
LI
O O
4 4Jg ~0
4J0 VC 4I
nJl
00 0~ r4 00kk aV 4J
~ rt W
a L~ 6
0 4Je ar4 CJ
OV tl48
~ a WC4 OII~ a
Vg
Cl ehCC
00lk
kl
Okk
0 V0
Lla
40 000
gl MV kk
a
0 kJ0 a
M 0Ik
0 0W
V0I ~
~ m 00Ik OI-a
aa
~ I Akk
Sok
Z Yoo cn
LV Ikl
cn ~Z
LV IX~ 0C
u <W LkI~ ZCL I-
LkIUl
Cfcn
CC!
CD
O +
c' h'
O u.U 4JUJ O> UZ ZO Ocn cA
Lk UO O
kk
g4kk
4P V4l
D44 0
C0~ av
W
aM '0
4
4PW0 e
WV W
e4
4llk OII
aCk
4IIk ala
l4
lg ~g4 N
kkV 4
a00 0a
00kk a0 M
aM '0
0 kka a
M 0ke
04J WV W~ l ~
C le OI I
Alg0
0 JC0 u
~ illSse
502
On the largest oceanic scales, vertical velocity is associated withdivergences or convergences of the Ekman transport, and this in turn isproportional to the curl of the wind stress. This is representedschematically in Figure 2 where the Ekman convergence teads to dePress thethermocline. Major centers of Ekmaa convergence are associated withmidocean gyres. Such places are known to have a tendency oa large scalesto accumulate floating material. This is clear from the concentrations ofsargassum weed in the Sargasso Sea aad relatively high concentrations oftazballs fouad on Bermuda beaches. To get a slightly more quantitativeestimate of this effect, it can be seen that the vertical velocityestimates presented by Vyrtki �961! and Munk �966! for the bottom of thepycnocline in the Pacific were on the order of 10 cm/s and discussed insome detail. by Overstreet and Rattray �969!. Using this aad t' he geometzyshown in Figure 2, a simple calculation shows that the resulting diffusionvelocity would be negative, i.e., a convergence rather than a spreading,but that the magnitude of the term would be several orders of magnitudebelow the point ~here it would affect the distx ibution shown in Figure la.Thus, this scale of oceanic circulation would have no detectable effect onthe spreading of objects at sea.
Svrface ieger convergence caused bg Ekman flowproportionni to the curl of the >rind stress
HORIZOmk
CONVERGENCEHOR tZONT kCONVERGENCE
.: wind stress.:::.::.-~.
HOR IZONT kCONVERGENCE HORIZONTAL
CONVERGENCE
VERT lCAL FLO'8 OOMN THROUGH
THERHOCL JNE
Figure 2.� Schematic represeatatioa of convergent Kkmam layeras expected ia a midoceaa gyre,
503
A second large-scale oceanic circulation featur thre at results in a~C~ s;ence in the uPPer layer is the subarctic bounderun ary region ia thekfth pacific. Tbi ~ pemanent feature is veil know ta pacificeanographers and is des ribed in saae detail by Reed and Wird �977!,0 tltatiVe estimates of the convergence velocitiee can be obtam d f<gc sork done by Nden I9 0! ig ~ 3! ~ Froa this, ve can see that in the<cinity of lat. 40'l, s convergence jn the surface currents is evident,
sldsrhg that the Ek an drift is confined to the top fey tens of ~tersgis is equivalent to a convergence velocity on the order of p I k ot ~< ssrtb south line vbich extends for about Ipp mi. Tbia is nbvionslvions y a~age estimate, but it indicates that this process is of significant«gnitnde tO affeCt the lover rangeS Of spreading ve |sight eXpeCt in theOpen ocean and several orders of aagnitude aore important than thecosvsrgcllce associated vith the aidocean gyres. For higher energyturbulence situations in the ocean, this process i ~ still not likely to
F 'ts 1% nants of g cR ai
%1 pof«<l I rth Pacific. A ~ i diniadicate the iree '
p t i+ April l%5, %gprQtyl f~ loden
504
significantly improve our ability to make trajectory estimates of driftpositions beyond a fev days
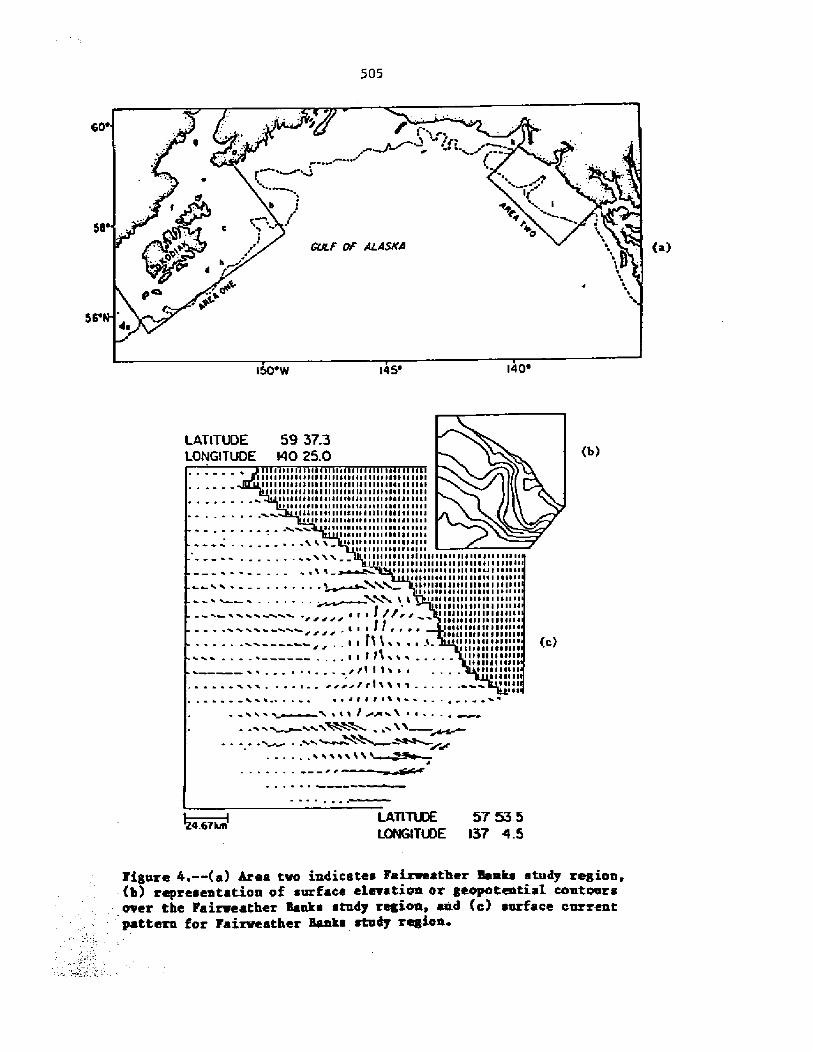
The preceding tvo paragraphs discussed midocean processes. As oneencounters the continental. shelf, there are additional processes that can,induce horizontaL convergencea that are strong enough to overcome theexpected spreading velocities that are associated vith typical turbulenceestimates ~ The first such process has to do with bathymetry and the widthof the shelfy Ceostrophic flows tend to follow bathymetric contours forcases where the baroclinic adjustment is not accomplished such that a levelof no~tion is established. A discussion of this process includingrelevant examples is presented by Gait �980!. Pigure 4 indicates thesurface circulation over the 1'airweather Banks region of the AlaskaContinental Shelf. Currents floving north past Fairveather Banks encounteran abrupt narrowing of the shelf and the current is compressed closer tothe shore. The co vergent velocities in this case are nearly 0 ' 25 knotsFrom our previous arg sents, ve eee that these convergences are easilystrong enough to make this a region where spreading tendencies vould besuppressed, and consequently, the collection of flotsam is likely. Becauseof the complex shelf topography of the Alaskan coast, many examples of thistype of bathymetrically induced collection points can be found.
The continental shelf is a region vhere freshvater coastal inputs mixvith ocean vaters of higher salinity to form fronts which provide otherregions in vhich we can expect the possibility of significant convergences.Typically. relatively fresh water vill float along the coastline and spreadseaward, pushing a narrow mixing front ahead of it as it ove'rrides the moredense seawater. This narrov mixing front is a collection zone that canoften totally overcome spreading tendencies. As an example, an oil spillfroa the grounded tanker Alvenus in August 1984 encountered such a frontproduced by freshwater runoff froa the Mississippi-Atchafalaya drainagebasin. After moving nearly 30 nmi, the oil had only spread to a width of1G m. This is obviously soaevhat of an extreme case, bnt the tendency isgeneral vherever there is significant freshvater coastal currents producedby Localized runoff. Many such drainage systems are found in the northeastPacific, including the vinter circuLation patterns from the Columbia lhverand a well-defined flow along the Alaskan Peninsula that has been describedby Royer �981!,
<n many shelf areas tidal flow can interact vith bathymetry andproduce horiaontal currents The convergences associated vith these flovstend to be the strongest around the mouth of shallow submarine canyons orat the head of dredged channels. These can form the strongest convergencesever observed in the marine environment, and in such cases may totallydominate the horisomtal spreading. Tn one study near the head of Montereyanyom, drogues that vere initially deployed over a aeveralmile area
within a fev hours ended np in an area soae 10 m across N. Broenkov pere ~coamn. 1974!. Xn this case, the convergent velocities compIetelydominated the spreading velocities in small harbors e.g., Baltimore!,actual aaelstroas have been observed vith a core pressure drop equivalentto 5 to lG ca of water. Incoming tidal vaves can underride less salineestuarine waters and produce strong convergence lines so-calledriptidee"! which typically collect flotsaa. These are cosssonly observed
most ef the large estmariea around the northeast Pacific. Sy their
505
<45'I50'W
LATITUDE 59 37.3
LONGITUDE l40 25.0I I I II I I I I ~ II IIIIII II I I II II I I I I III
~ I I I I I I Il ~ I I I I I I ~ 111 ~ I ~ 111111111 ~ 92 I ~ 111 ~ ~I II I II IIIIIIIII IIIIIIII II I I I I I IICI II I III
I I I I I I I I I I I I I I I I I I I I I II I I I I I I II I I ~ I ~ I I111IIII ~ I ~ ~ ~ I ~ lllilll I lllll ~ ill 1 llll111 ~ I II ~ I ~ ~ Il ill liill ~ 11 II I ~ I I I I III I
I I I I I i ~ I I I I I I i I I I I I I I I I i I I ~ I I ~ I IIl I ~ ~ ~ I ~ 111 ~ Il ~ ~ IIII I ~ I ll I I ~ I I
II ~ 111 ~ II ~ ~ III I I ~ I I ~ II ~ ~ ~Ililll I IIII I ~ I Ii I I ~ IIliil ~ ~ I I I I I ~ ~ III ~ I I ~
11 ~ I I I I I ~ I I I ~ l I I II I I I I I I I I I I Ii I I I I I I ~ I I I I I I I ~ I I I ~ I I I 11
Ill ~ III I ~ I ~ III II III IIIIII II I I IIIIIIl % 'i ~ I I ~ I ~ ~ l I 1 I'I ~ i I I I I I ~ I ~ ll I ~ ~ ~ ~ ~ I
1 i i ~ 11 ~ ~ ~ I ~ II I ~ ~ ~ I ~ I ~ I ~ II IIII»IIIIIIIIIIIII I IIII«I l I I ~ ~ ~ ~ I I I I ~ ~ I ~ ~ I I ~ 11 11
XNN ll I ~ IIIIIII ~ IIIIIIIIIIII /I um'rr rrr ~ I ~ II ~ I ~ I ~ I ~ I ~ I ~ ~ I ~
111 1 I r ~ ~ ~ I ~ IIII ~ ~ ~ I ~ I ~ ~ ~ ~ I ~~ Ill I ~ ~ ~ ~ ~ I ~ ~ IIII
.. I I I l 1 i i . i l. Iillill ~ ~ ~ ~ ~ ~ ~ ll ~/ r 1111 ~ ~ ~ ~ i ~ ~ I ~ ~, . ~ I F ill w w w ... I lliiiliiilii
. ~ ~ e.. rill I le l 1 IIIIIII~ W WW . ~ ~ 1 rrrrII I %'l 92 1 .. ~ Ilil~ il~ --iii.--. ~ ~ ~ iiliI'lii .. ~ . i' ~
' ~ 'll 8 r8%% ~ ~ ~ ~ ~
LATITU3E 57 53.S
LQNQTtDE I37 4.54.67|III
Figme 4.-- a! Area tm iadicatea Faireeather Santa stoke region,- b! repreaeatation of aurfaca clevatioa or geopoteatial coatoergover the Fairveather IIaaka stadt region, cad c! asrface curreotyattera for Paiareather Kaama stadt replica.
506
sses can only be present over a part of a tidalnature, these intense processes can ocycle and only occur nears oreho e where large bathymetric variations arepresent.
SUHKLRT AND CONCLUSIONS
Particle or flotsam trajectories can be cal.culated from watermovements Xn virtually all cases, the complete details of the watermovement and the currents are pragmatically divided into a deterministic,
It tlknown, and often considered steady portion, and an everything elseThe everything else term ia usually assumed to have random properties andbaaed on this, a simple statistical model can be developed that, introducesthe concept of spreading velocity that has the effect of increasing theuncertainty associated with predicting where a particle may end up. Anumber of oceanographic processes that result in surface convergence werediscussed. For each of these cases, the tendency of the convergencevelocity to counter the spreading velocity was quantitatively examined.For openmcean processes, we find that the subtropical gyres have virtual],yno significant effect on spreading over length seal.es of hundreds of milesor a few days. The subarctic front in the North Pacific may marginallytend to reduce spreading tendencies, but concentrations of trajectories orflotsam distributions are unlikely. Over the continental shelf,bathymetric and baroclinic processes can lead to convergences that aretypically the same order ae the spreading velocities associated withcharacteristic estimates of ocean turbulence. As these are a ssociated withtopographic features snd river runoff, they tend to be persistent featuresand may offer a rationale for developing flotsam search procedures, or atleast improving the possibility of more accurate trajectories. yinallytmsall-scale features associated with tidal movement can produce locallystrong convergencea that will act as collection mechanisms for flotsam.These cases provide short-term guidance for developing flotsam recoveryplans.
Xa all cases, particularly in open ocean regions, the prospects ofrecovering low-profile flotsam simply by going out and looking, for it, arenot good. The odds of recovery periods of a few days may be improvedsignificantly if the flotsam's visibility can be enhanced either opticallyor electronically- This suggests that valuable or troublesome objectsshould be fitted with such devices as emergency locator transponders sndstrobea.
LITERATURE CZTED
Csanady, G. Ti
1973. Turbulent diffusion in the environment. D. Reidel Public CoBoston, 248 p.
Defant, A-
1961. Physical oceanography, Vol 2 Pergamon Press, N T- t >9g PFomin, L~ H~
1964 ' The dynamic method in oceanography. glaevier PubI.- Co- ~ N'T'209 p
507
g]t,J > ~]980. k f iuit e-el enent so]ution procedure for the t 1z ~ interpolation ofin conp]ex regions ~ J. Phys Ocean . 10: 9
pbyssa] I ecipes >ep gea Re
R and H. Rat tz yer h oles of vertical velocity and eddy cond~ t ity in
t hezm! c] ine ~
Ped]osM ~ dynggics springe'r Verlag I T p
pzsudaa l oceanography. Nethuen & Co, Ltd. Lo ~ p ~R R and 8 P Laird
]977. k study of the subarctic boundary region in the vestern ForthPacific. J. Oceanogr. Soc. Jpn. 33;247-253.
Eohn, G. I.1970. Aspect s of the aid-Faci f ic transition xone. J. Geophys. Res.
75: 1097-1109.
4ytrg Ti C,1'981 baroc] inic transport in the Gulf of blas@a. Part II. k fresh
eater driven coastal current. J. Mar. Res. 39:251-266.
5verdrep, E. U ~, N ~ W. Johnson, and R. I. Planing.]9@2 The oceans: Their physics, cheaistry, and general biology.
Prentice-Eall !nc y Englewood Cliffs, I. J. ~ ]>< p.
lyrtti, t.]96]. The thermoha]ine circulation in relation to the general
circulation in the oceans. leep-Sea Res ~
508
TOWARD k POPULATION DYNAMICS OF MARINE DEBRIS
Tim Gerrodette
Southwest Fisheries Center Honolulu LaboratoryNational Marine Fisheries Service, NOAA
Honolulu, Hawaii 96812
Adopting a population dynamics viewpoint can provide auseful overview of the problem of marine debris. This paperoutlines the information needed to establish an understanding ofthe population dynamics of marine debris, notes ezisting sourcesof data which could provide such information, points outpotential gapa of information, snd suggests experiments orsampling vhich could help fill those gape. First, s typology ofmarine debris is needed; because the kinds of marine debris varyso widely, separate estimates of "birth" and "death" rates villbe needed for each "species." Data on birth or generation ratesof marine debris must include not only "species" and abundance,hut location and seasonality. Mortality or degeneration rates ofmarine debris can be summarized vith a survivorship curve ~hlthough decay of the material is the only true death, forcertain applications debris can be considered dead by being caston a beach or by sinking to the ocean bottom. Fouling organismsmay contribute to decreasing buoyancy snd hence hasten thesinking of objects such as ropes and trawl netting. An importantquestion is the choice of units to be used in a quantitativedescription of marine debris. The choice of units will depend onthe type of debris, and meaningful units should have the propertyof independence. The choice of units will also reflect whetherthe impact of marine debris is being measured on fish stocks,fishing operations themselves, vessel navigation snd safety, ormarine bird and aaaeal populations.
INTRODUCTION
ks the final formal presentation of this vorkshop, this paper villattempt to provide an overview of the technical aspects of the marinedebris problem, especially as identified in the last few days, to notegapa in our information vhich need to be filled by future research. and tomake some provocative comments vhich may stimulate thinking in the vorkinggroup sessions which are the next phase of the workshop. As a conceptualframework for the discussion, I propose to talk about debris in terms ofpopulation dynamics, that is, to treat debris aa a population of objects
Q a~ S~ $4REtg'4 ees so 0» reehise clif ere! ~ seeceesiese eg she uerheheS es the tate eel ~eef assize neheie e IS rS seveehee 1 >4SJ ueee44 e Reveii » 1 s nes ceeemr sulk ieeh~i snsk ~srs sere-54I i%83 ~ ~ ~ ~ ~ ~ r I sulk ee ~
50tp
~~ dynamics >e vish to describe. ds uith a biolo ogical population, thetasks a re t o de t ermine hou %any neu jndxvidelation through irtha and immigration! and hou nanb' s are entering the
ou many individuals are through deaths and eaigration!aav ion, per unit time.av . tion the number of individuals of ea h k deac ind of debriscan be calculated.
t ere a ted in the dynanics of marine debriefthere are aesthetic reasons for objecting to the t
sho�ld not ignore these reasons, since for the generalns ~y be uo ~ t important to uobiliaing people t h le o ep,as Heilson l985! has ahoun. There are also, a number of
be j.nterested xn. 'the auon t h l. s uork shop
d turtle populations. 'Rat de«rva~ h e are strong r easons f or f ishermen
o b concerned about the amount of debri~ xn the oceoperations by fouling nets or p
h' ' ~ pro'p liar, debri ~ b ou s a s«iousgd vhen lost gear continues to fish, it is an unreported source ofsortality not taken into account in calculations and recouuendationa fornanagement of the f ishery resource.
Our perception of bphich kind of debris is of greatest interest andisportance vill depend on uhether ue are measuring the impact of debris onfish, seals, or ships- k drifting hauser might be a navigational hasardfor a ship, but poses no danger to a seabird, uhile the plastic top of aaizgack of beer is mora dangerous to a seabird than a ship. People uithdifferent interests uay therefore have different perceptions of hou serioustbe probleo of oerioe debris is eed ebet eboeld be done to eorreet it.
Population Statics
The population dynamics of aarine debris is a neu scientificdiscipline. 5efore ue can get to the dynamics, therefore, ue aust dealvxth arne preliminary population statics. The first problem is to identifythe different kinds of debris. Pollouing our biological n«aphorb ve m ycall these different "apeciea" of debris. Several papers in this uor"s Phave presented "apeciea lists " especially froe the Pacxf<» Bahlbe ggarrell 1985; Ieilaan i985!. The uide variety of debris means that t e
elation dynamics say be different for each "species."~ld keep jn aind that neu "species" may evolve in
e ' ~ ua be given eithero«"+ding stack siaea of aarxne debri ~ uay g'r relative abundance. In thas arkahop, sevseveral papers have
e«i+ates of stock axae, exther froaron beach surveys ~ aaghtinga freya a ahap Dahlberge ~ l985; Jones and
although u eat~to af standing stock only deacra es t eFargicular paiat in tixae, a eupotim ca+ ~auide clues to Ae 4ynmica of the population.
em increase ar 4ecgeaae, and species compo ' ' e.
f+<++g weather ca~gigian,s, fossa 4iffereat heights a
5l0
surface, from different beaches, and so on. A simple, standardized programof observation and sampling will therefore often give more useful resultsthaa a more elaborately but inconsistent, program.
Jones and Perrero �98'! have summarized clearly the problems withestimates of debris abundaac» made from ships. Some types of debris aremuch harder to see than others, size is very hard to estimate since largeparts of some items are submerged, and in aay case the sightingprobabilities depend on aea state, buoyancy, color, and other factors'These are serious problems which must be overcome if sighting rates ofdebris are to be translated into estimates of absolute abundance. Butshipboard sighting rates of debris can still be useful as relativeabundance indicators. Programs of regular searching for marine debriscould be expanded to include more vessels wherever such observations do notinterfere with the normal mission of the ship. We should think about morepassive and automatic means of collectiag data. Perhaps high-resolutionsonar could be used to detect large pieces of gear, or a simple grapplinghook could be towed behind the ship. Collecting data Ln several differentways has the additional advantage that we cern gain some insight into howsome observations may be biased. For example, we could compare visualobservation of debris from a ship with the amouat caught on a hook duringthe same periods Or we could compare the amounts caught on several hookstound at differeat depths.
We have to choose some units to describe the stocks of debris.Nerrell �985! reported the amount of debris on Alaskan beaches both asnumber per kilometer and as kilogram per kilometer and noted that numberand weight did not always show the same trends. For debris items which arediscrete and which come in similar sizes, the number of each "species" wil.lbe a suitable unit, but for others which come in variable sizes. the choiceis not so easy. With fragments of nets, for example, we could use number,might, l.iuear measure, or surface area. What is the best unit to describet'his populationT Suitable units should express an equal impact and beiadependent of one another. If we choose numbers of net fragments as ouranil it implies that a 100-m net fragment has the same impact as a lornfragment. If we choose a liaear measure, it implies that a l00w netfragment is equal in its impact to ten 10m fragments. Which is true forthe impact oa fish stocksf Which is true for the impact on marine mammalsTThis is aa area for future investigation. Ideally, we would like to use aunit which ia more closely related to the impact the debris is causing,such as the relative fishing, powers of l0- and 100~ net fragments- This,however, requires a clearer mechanistic understanding of how drifting netfragments affect fish, mamsal, amd bird popnlatioas. For the present time>we will simply note that a» appropriate choice of units to describe debrisdepeads on �! the type of debris, and �! the target population--that is,whether the impact of debris is being measured on fishing operations, onvessel safety, or on fish, masssal, bird, or turtle populations.
Population Dynamics
Io» wm coma to the dynamics of marine debris. Individual. items ofdebris caa enter the population through births or imugration and leave itthrough deaths or emigration Let us leave aside the discussion of birthend death rates for just a moment and consider the migration of marine
debris. Since debris cannot swim, we assume that a good approximation ofmigration routes can be calculated fram a knowledge of ocean currents Reedand Schumacher 1985; Seckel 1985!. Individual items which are highlybuoyant, such as styrofoam objects, might be influenced by wind more thancurrents. This makes the problem a bit more complicated, but since generalwind patterns are well known and the relative contributioas of vincl andcurrent can be estimated, this presents no fundamental problem In general,then, the migration patterns of marine debris can be fairly well estimatedfor any "species" of iaterest from existing information on currents andwinds. It is well to remember that much of our knowledge of surface cur-rents comes from observation of scientific floating objects~rift bottlesand buoys � so that knowledge should be quite applicable to fIoafing debris.
The heart of population dynamics is the estimation of birth and deathrates. We would like to be able to describe how many ae» nets are "born"each year in the ocean. We would like birth rates to be broken down by"species," location, season, and type of fishing operation. Hov of courseone of the basic differences betveen biological species and debris"species" is that biological individuals reproduce their own kind, whiledebris is produced as a result of man's activities. We therefore expectthat for marine debris, in contrast to a biological population, Chere willbe no relation between recruitment and standing stock. Instead, birthrates will be related to amount of fishing' Actually it is possible thatthis may not be strictly true and that there may be some stock-recruitmentrelationship for marine debris. If objects of debris interfere withfishing operations and cause other gear to be last, then the stock iscontributing to the recruitment of new individuals in the population. Forexample, a large ball of trawl netting may foul a gill net and cause it tobreak away or to be abandoned.
Like human births, we caa divide births of marine debris into twokinds: planned and unplanned. The marine debris equivalent of plannedparenthood is the deliberate dumping of trash or worn-out gear at sea.Unplanned parenthood is the accidental loss of gear. Ihta on accidentallosses could be estimated by reports from fishermea or from observers onfishing boats Low et al. 1985!. If average rates of gear loss forvarious types of fishing operations could be calculated, they could then beapplied to total fishing activity. Such estimates would be minimumestimates of birth rates since births due to deliberate dumping are notiacluded. Certainly, ve need more information on these deliberate births.
The estimation of mortality rates presents other problems First ofall we should consider the meaning of death for marine debris. The decayor disinCegration of debris is certainly death, but effective death mightoccur before that. It depends on «hich group ve are measuring the impactof debris. Debris vhich sinks is removed from the population as far aspelagic fishing operations are concerned, but not as far as benthic fishing,operations are concerned- Debris cast ashore is removed from thepopulation as far as vessel safety is concerned, but not as far as sealsare concerned. This means that we vill have to decide on what group ve aremeasuring the impact of debris before the meaning of death is clear.
The decl.ine in abundance over time in a population can be smaerised«ith a survivorship cmrvei Figure l shows three general shapes that
512
O Z A X D
TIME
Figure l.� Three general types of survivorship curves-
survivorship curves of marine debris might take. The top curve sho«s apopulation in which most iadividnals survive for most of the lifespan, theabecome "senescent" more or less simultaneously. In the middle curve, aconstant number of individuals die in each unit of tine, «bile iu tbe lowercurve, there is a constant rate of mortality per unit of time. Different"species" of debris will certainly bave different survivorship curves. Veneed to establish the general shape of the survivorship curve for each"species" and to establish the time scale along the horisontal axis. 5pesit take days, months, or years for debris to dieT
Another factor we need to consider is that although aa individual itemof debris may not die by disappearing from the ocean, it may change itscondition in such a way that it becomes leos effective Carr et aI. �985!and bligh �985! reported observations particularly directed at tbisimportant question. The impact of s 1ost gill net is quite differentdepending on whether the gill net is stretched open or tangled up. Even ifa drifting net remains open its effectiveness must decline «ith time as itbecomes fouled with algae, barnacles, and other organisms Figure 2 sbo«sso me simple hypothetical possibiHties of decline in effectiveness over
The top curve shows a situation in which ef fectiveness remains highfor a while, then declines rather rapidly. The middle figur~ shows a
513
CPJV!LLJ
UJ
O UJ4 LLLLI
T1NIE
Figure 2.� Several possibilities for declining effectiveness ofindividual items of marine debris with time.
linear decrease in effectiveness with time, while the Lower curveillustrates a situation in which theatre is an initial rapid decline followedby a Longer period in which the debris continues to have an impact, thoughat a reduced level. As with survivorship, tbe important things we need toestablish are the general shape of the effectiveness curve for each"species" of debris and the time scale on the horisontaL azia.
The impact of a yopulatiou of marine debris is a product of theeffectiveness and survivorship curves. Figure 3 illustrates this idea. ~sa simple example, linear declines in relative effectiveness and inabundance with time are shown. Their product, however, whicb indicates theimpact of this particular "species" of debris, is not Linear~ Putting itmre formally, let q t! be the average effectiveness catchabilitycoefficient in fisheries parlance! and u t! tbe number of items of aparticular debris "species," both functions of time. Then the total impactof e g., total number of fish caught by! this 'kind of debris is
q t! n t! dt0
514
TIIHE
Pigure 3- � Iapsct of a population of debris as a function of time.The impact is a product of the effectiveness and abundancefunctions.
I
There are three general causes of death: �! deterioration ofnaterial as a result of exposure to seawater, sunlight, oxidation,biologicel agents, and the nechanical agitation of the ocean; �! sinkingby loss of buoyancy through eater absorption and by fouling «ith marineorgeuisns; end �! stranding of eaterial o» the shore. What fraction ofdeaths is due to each of these three causesT kt the present time evenrough estiaates do not seea to exist for floating narine debris ~
The physical deterioration of rope and netting material could beestinated froa the nanufacturer's specificati.ons; otherwise saae simpleeR'«inents could shou hou long various materials might last. Xn general,uu hnou that modern synthetic nateria1s have a long life. In fact, it iethe durability of these naterials that is one of tbe fundeaentel causes ofthe debris problea. Civsn thi ~ long potential life, uhat does eventuallyhappen to narine debrist Xf it does not deteriorate, end if it is not
~ested by a nerine organisa, tbere are only tuo other ueys it can die:either it sinhs or it is cast up on a beach.
515
Loss of buoyancy can occur «hen an item of debris gradually absozbswater and also «hen marine organisms grow on it The main organisms whichcould grov on floating debris and weigh it down are certain speciea ofbarnacles. Since the calcified barnacle shell is denser than water, aheavy growth of barnacles could cause an object which was originallyslightly buoyant to become heavier than water and sink. How quickly thisvill happen depends on the original buoyancy of the object, and on the rateof settlement and grovth of barnacles. Figure 4 illustrates this for threeitems of debris vith different originsi. huoyancies ~ The items of debrishave positive buoysncies which deczesse only slightly vith time. Thenegative buoyancy of barnacles changes greatly «ith time, probablyaccording to some S-shaped curve similar to the one shown. The, f irst itemof debris is so buoyant that barnacles will never cause it to sink ~ Thesecond item of debris requires a heavy growth of barnacles to developbefore it vill sink, vhile the third item is only slightly buoyant and isquickly pulled down hy the barnacles. The greatest unknovns are the ratesof settlement and growth of the barnacles and other organisms denser thanseawater!, but these could be established with some relstivei.ystraightfovard, though not necessarily easy or cheap, expeziments.
R 0 ClLd
C9IU
K K O UJCh
a lL
Figure 4.� Possible changes in buoyancy of items of debris with time dueto the growth of barnacles oz other organisms with density greater thanthat of seawater. En the ezaayles showa, the growth of barnacles «ouldcause debris items 3 snd 2 to sink, but not item 1-
516
Ihat happens after an object has begun sinking depends on severalfactors. Of course if the object ia dense enough it will continue to sinkto the bottom of the ocean. But if its density is close to that ofseawater, the compressibility of the material relative to that of seawateris important. Material which is more compressible than seawater willcontinue to siak, even vhea the barnacles die and fall of f deep in theocean. On the other hand, material less coapreasible than seawater couldsink to aad remain at an intermediate depth.
The third possible fate of an item of marine debris is stranding on ashore. It is difficult to estimate ho» much material is eventually removedfrom the ocean in this vay. Monitoring a beach and recording the amount ofdebris which accumulates aay give a relative indication of abundance, butit does not tell us what fraction of a particular kind of debris ands up ona beach. Fearshore this fraction could be substantial. One possibleapproach in coastal «aters is to attach sonic or radio taga to a sample ofdebris and monitor the fate of these tags. Such an experiment would alsohave to consider the possi.bility that some items of debris could bedeposited on a beach, but later washed ont again; these could be termed"born-again" debris kway from the continental land masses, oa the otherhand ~ the probability of death due to deposit on a beach appears to bequite low. Since the oceans move in large circular gyrea, and sincesurface waters tend to converge toward the centers of these gyres, afloating object, if it did not deteriorate or sink, could continue to goaround and around. There is anecdotal evidence for some objects beingafloat for many years.
SUl9QRT kgb CONCLUSIONS
This paper haa provided a brief description of the marine debrisproblem, approached from a population dynamics viewpoint. This descriptionaddresses mainly the fate of marine debris. It concentrates oa describinghow much, vhen, and Were. Prom this information, the impact of a givenamount of debri.s on fishing operations or on vessel safety could beestimated by computing aa encounter rate. To estimate the impact of thisdebris on populations of fish, birds, turtles, and mammals, however, wouldrequire more than a simple encounter rate. It would also requireiaforaatioa on the behavior, physiology, aad ecology of these aaimals,topics beyond the scope of marine debris population dynamics.
Attempts to reduce the amount cf aarine debris can be viewed as takingoae of tvo basic approaches: to increase the death rates or to reduce thebirth rates. Prograas which remove debris from beaches or proposals torequire certain rates of degradability in fishing gear are aimed atiacreasiag death rates of debris. programs which seek to reduce the amountof debris created, either through legal or financial incentives, are aimedat reducing birth rates. Either can be an effective means of populationcontrol- I hope ve can find a suitable combiaation of these tvo approachesin the working group meetings which are next
517
LITERATURE CITED
Carr, H. A., E. H. Amarai, A. W. Rulbert, and R. Cooper.1985. Underwater survey of simulated lost demersal and lost
commercial gill nets off New England. In R. S. Shomura and H. O.Yoshida editors!, Proceedings of the Workshop on the Fate andImpact of Marine Debris, 26-29 November 1984, Honolulu, Hawaii.V. S. Dep. Commer., NOAA Tech. Memo. NKFS, NOAA-TM-NMPS-SWPC-54.[See this document. ]
Dahlberg, M. L., and R. H. Day.1985. Observations of manmade objects on the surface of ghe North
Pacific Ocean. In R. S. Shomura and R. 0. Yoshida editors!,Proceedings of the Workshop on the Fate and Impact of MarineDebris, 26-29 November 1984, Honolulu, Hawaii. U. S ~ Dep. Coaster.,NOAA Tech. Memo. NMPS, NOAA-TM-NMFS-SWFC-54. [See this document.]
Rigb, W. I,.1985. Some consequences of lost fishing gear. In R. S. Shomura and
H 0. Yoshida editors!, Proceedings of the Workshop on the Fateand Impact of Marine Debris, 26-29 November 1984, Honolulu, Hawaii.V S. Dep. Commer., NOAA Tech. Memo. NMFS, NOM-TM-NMFS-SWPC-54.[See this document.]
Jones, L ~ L., and R. C Perrero1985. Observations of net debris and associated entanglements in the
North Pacific Ocean and Bering Sea, 1978-84. In R. S Shomura andR. 0. Yoshida editors!, Proceedings of the Workshop on the Pateand Impact of Marine Debris, 26-29 November 1984, Honolulu, Hawaii.U.S ~ Dep. Commer, NOAA Tech. Memo. NMFS, NOAA-TM-NMFS-SWPC-54.[See this document.]
L.-L., R K. Nelson, Jr. ~ and R. E. Narita.1985. Net loss from trawl fisheries off Alaska. In R. S. Shomura
and R. 0 ~ Yoshida editors!, Proceedings of the Workshop on thePate and Impact of Marine Debris, 26-29 November 1984, Honolulu,Hawaii. U.S. Dep. Commer., ROM Tech. Memo. NMFS, NOAA-TM-lAIPS-SWFC-54. [See this document.]
Merrell, T. R., Jr.1985. Fish nets and other plastic litter on Alaska beaches. In R.
Shomura and R ~ 0 ~ Yoshida editors!, Proceedings of the Workshopon the Pate and Impact of Marine Debris, 26-29 November 1984,Honolulu, Hawaii- U.S. Dep. Commer, NOAA Tech Memo. NMFS, NOM-TM-NMFS-SWFC" 54. [See this document. ]
Ne i leon, J.1985. The Oregon experience. In R. S. Shomnra and H. 0 Yoshida
editors!, Proceedings of the Workshop on the Fate and Impact ofMarine Debris, 26-29 November 1984, Honolulu, Hawaii. U.S. Dep.Coeur., NOAA Tech. Memo. NMFS, NOAA-TM-NMFS-SWFC-54. [See thisdocument. ]
518
Reed, D. K., and J. D. Schumacher.1985- On the general circulation in the subarctic Pacific. In R. S.
Shomura and H. 0. Yoshida editors!, Proceedings of the Workshop onthe Fate and Impact of Narine Debris, 26-29 November 1984,Honolulu, Hawaii. U.S. Dep. Commer., NOAA, Tech Nemo. NMFS, NQAA;TM-NNFS-SWFC-54. [See this document.]
Seckel, C- R.
1985 Currents of the tropical and subtropical North Pacific Ocean.In R. S. Shomura and H. 0. Yoshida editors!, Proceedings of theWorkshop on the Fate and Impact of Narine Debris, 26-29 November1984, Honolulu, Hawaii. U.S. Dep. Commer., NOAA Tech- Nemo. NNFS,NOAA;TN-NMFS-SMFC-54. [See this document. l
519
THE OCEANIC CIRCUIATION IN HAWAIIAN WATERS: FACTS!HYPOTHESES, AND PIANS FOR FURTHER INVESTIGATIONS
Abstract only!
Lorenz NagaardDepartn!ent of Oceanography
University of HawaiiHonolulu, Hawaii 96822
According to Robinson Eddies in Narine Science, Ne» York,1983!, "It is now well known that the mid-ocean flow ie almosteverywhere dominated by so-called synoptic or meso-scale eddies "This is even more true near major topographical features like theHawaiian Ridge where. in addition to quasi-geostrophic motions Rossby waves, synoptic eddies!, barotropic snd baroclinic tidalcurrents and currents associated with wind waves and surf, are ofstrong, and in some locations of dominating influence-
Examples of direct and indirect current observations vill bepresented. These observations illustrate how extremely difficultthe predictions of the fate of marine debris in the Hawaiianwaters is.
In view of the very limited knowledge that we have about theoceanic circulations in Hawaiian waters, a major research project,called "Hawaiian Ocean Experiment ROE!," is planned for theperiod 1986-91. Background and plans of this comprehensive, interdisciplinary, cooperative oceanographic study of Hawaiian waters to include the inhabited Hawaiian Islands and the NorthwesternHawaiian Islands! vill be outlined.
L 8 ~ shss!ore eea 8 ~ 0, TO Sh Qe e4 i ters! ! Proc sea is 8 s of the metk ShOP ee the Pate Se!i Zapectef m!ri!se bsbcis ~ 28-29 seseeber 1984! lhmleIo! %costi. S 5 Sep i ces!eerie ! sosa Tech. Ãs!se.%%8! sosk-~lass sate S4 l985


![North Pacific Carbon Cycle Response to Climate Variability on … · 2020. 2. 22. · al., 2003; Brix et al., 2004; Keeling et al., 2004] and OSP in the northeast subarctic Pacific](https://static.documents.pub/doc/80x56/60b9503716e5ec4997000d66/north-pacific-carbon-cycle-response-to-climate-variability-on-2020-2-22-al.jpg)

