28
On the Goal Line for Fit4More Joe Kaeser CFO Citigroup’s 20th Annual Global Industrial Manufacturing Conference March 6, 2007
On the Goal Line for Fit4More
Joe KaeserCFO
Citigroup’s20th Annual Global Industrial Manufacturing ConferenceMarch 6, 2007
Page 2 March 2007 Investor Roadshow
Disclaimer
This document contains forward-looking statements and information – that is, statements related to future, not past, events. These statements may be identified by words as “expects,” “anticipates,” “intends,” “plans,” “believes,” “seeks,”“estimates,” “will” or words of similar meaning. Such statements are based on our current expectations and certain assumptions, and are, therefore, subject to certain risks and uncertainties. A variety of factors, many of which are beyond Siemens’ control, affect its operations, performance, business strategy and results and could cause the actual results, performance or achievements of Siemens worldwide to be materially different from any future results, performance or achievements that may be expressed or implied by such forward-looking statements. For us, particular uncertainties arise, among others, from: changes in general economic and business conditions (including margin developments in major business areas); the challenges of integrating major acquisitions and implementing joint ventures and other significant portfolio measures; changes in currency exchange rates and interest rates; introduction of competing products or technologies by other companies; lack of acceptance of new products or services by customers targeted by Siemens worldwide; changes in business strategy; the outcome of investigations and legal proceedings as well as various other factors. More detailed information about certain of these factors is contained in Siemens’ filings with the SEC, which are available on the Siemens website, www.siemens.com and on the SEC’swebsite, www.sec.gov. Should one or more of these risks or uncertainties materialize, or should underlying assumptions prove incorrect, actual results may vary materially from those described in the relevant forward-looking statement as expected, anticipated, intended, planned, believed sought, estimated or projected. Siemens does not intend or assume any obligation to update or revise these forward-looking statements in light of developments which differ from those anticipated.
Page 3 March 2007 Investor Roadshow
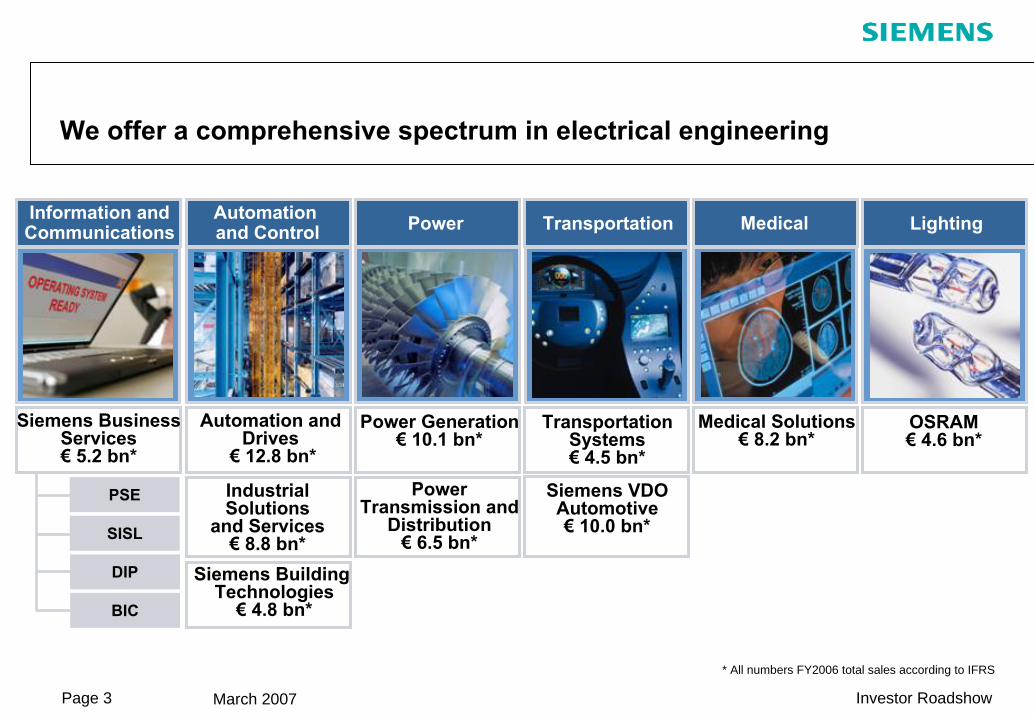
We offer a comprehensive spectrum in electrical engineering
Information andCommunications MedicalPowerAutomation
and Control LightingTransportation
Siemens BusinessServices€ 5.2 bn*
Medical Solutions€ 8.2 bn*
Power Generation€ 10.1 bn*
PowerTransmission and
Distribution€ 6.5 bn*
Automation andDrives
€ 12.8 bn*
Industrial Solutions
and Services€ 8.8 bn*
Siemens Building Technologies
€ 4.8 bn*
OSRAM€ 4.6 bn*
* All numbers FY2006 total sales according to IFRS
TransportationSystems€ 4.5 bn*
Siemens VDOAutomotive€ 10.0 bn*
PSE
SISL
DIP
BIC
Page 4 March 2007 Investor Roadshow
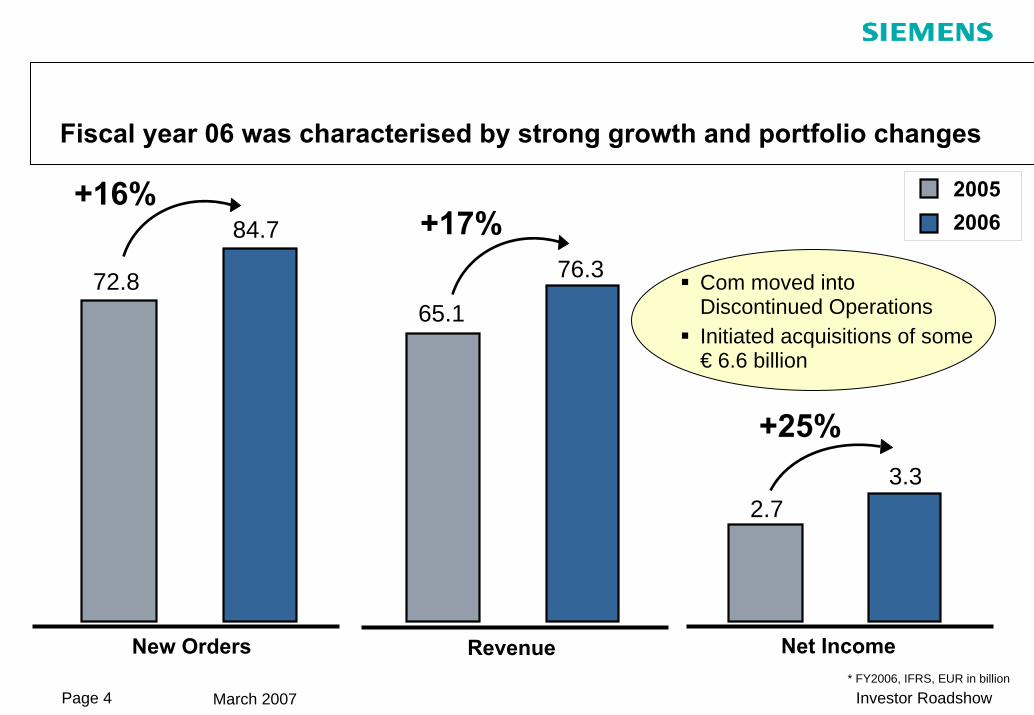
Fiscal year 06 was characterised by strong growth and portfolio changes
* FY2006, IFRS, EUR in billion
New Orders Revenue Net Income
20052006
72.8
84.7
65.1
76.3
2.73.3
+16%+17%
+25%
Com moved intoDiscontinued OperationsInitiated acquisitions of some€ 6.6 billion
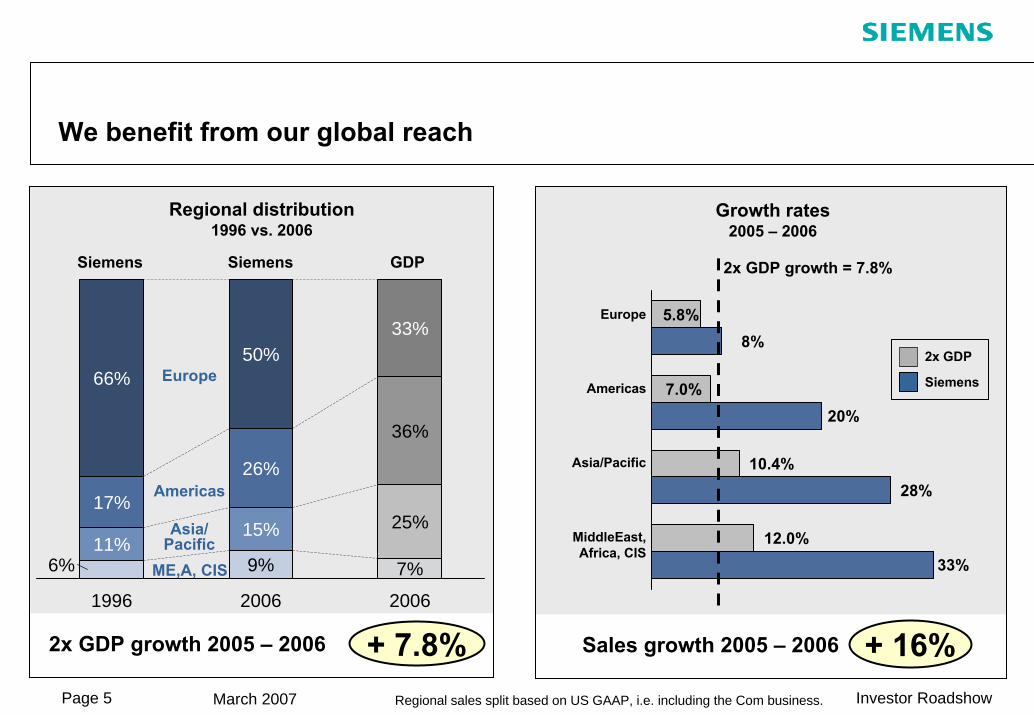
Page 5 March 2007 Investor Roadshow
We benefit from our global reach
2x GDP growth 2005 – 2006 + 7.8% Sales growth 2005 – 2006 + 16%
Siemens
66%
17%
11%6%
1996
50%
26%
15%
9%
2006
33%
36%
25%
7%
2006
2x GDP growth = 7.8%
Europe
Americas
Growth rates2005 – 2006
Regional distribution1996 vs. 2006
GDPSiemens
ME,A, CIS
Asia/Pacific
Europe
Americas
Asia/Pacific
MiddleEast,Africa, CIS
Siemens
2x GDP
5.8%
7.0%
10.4%
12.0%
8%
20%
28%
33%
Regional sales split based on US GAAP, i.e. including the Com business.
Page 6 March 2007 Investor Roadshow
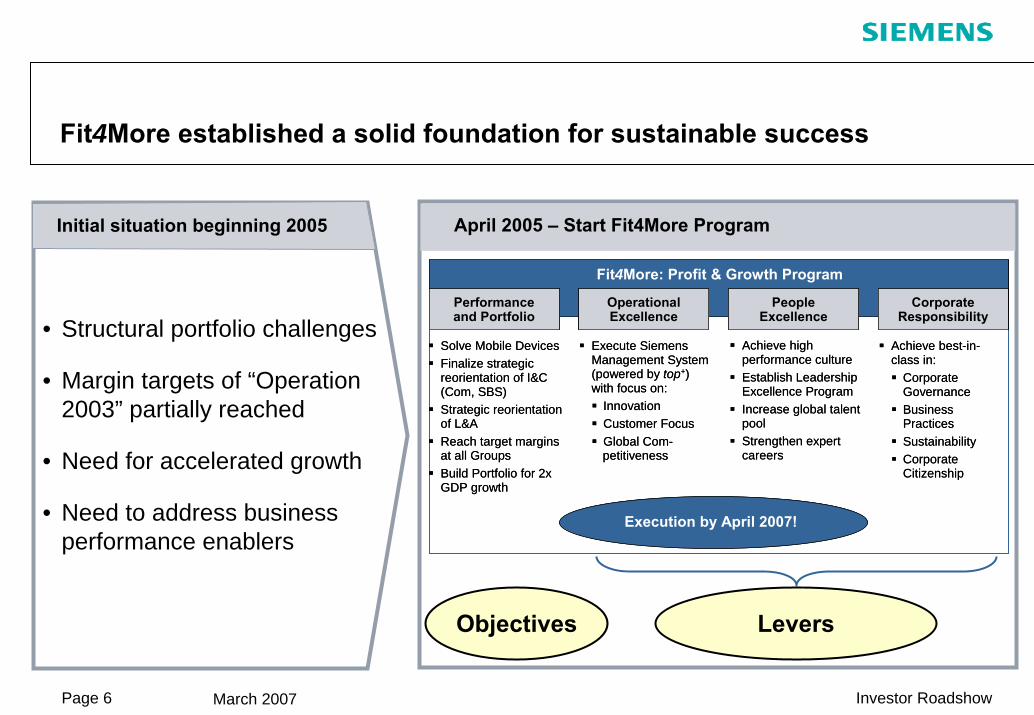
Fit4More established a solid foundation for sustainable success
• Structural portfolio challenges
• Margin targets of “Operation 2003” partially reached
• Need for accelerated growth
• Need to address business performance enablers
Initial situation beginning 2005 April 2005 – Start Fit4More Program
Objectives Levers
Execute Siemens Management System (powered by top+) with focus on:
InnovationCustomer FocusGlobal Com-petitiveness
Achieve high performance cultureEstablish Leadership Excellence ProgramIncrease global talent poolStrengthen expert careers
Solve Mobile DevicesFinalize strategic reorientation of I&C (Com, SBS) Strategic reorientation of L&AReach target margins at all GroupsBuild Portfolio for 2x GDP growth
Achieve best-in-class in:
Corporate GovernanceBusiness PracticesSustainabilityCorporate Citizenship
Fit4More: Profit & Growth Program
Performanceand Portfolio
OperationalExcellence
CorporateResponsibility
PeopleExcellence
Execution by April 2007!
Execute Siemens Management System (powered by top+) with focus on:
InnovationCustomer FocusGlobal Com-petitiveness
Achieve high performance cultureEstablish Leadership Excellence ProgramIncrease global talent poolStrengthen expert careers
Solve Mobile DevicesFinalize strategic reorientation of I&C (Com, SBS) Strategic reorientation of L&AReach target margins at all GroupsBuild Portfolio for 2x GDP growth
Achieve best-in-class in:
Corporate GovernanceBusiness PracticesSustainabilityCorporate Citizenship
Fit4More: Profit & Growth Program
Performanceand PortfolioPerformanceand Portfolio
OperationalExcellenceOperationalExcellence
CorporateResponsibility
CorporateResponsibility
PeopleExcellence
PeopleExcellence
Execution by April 2007!
Page 7 March 2007 Investor Roadshow
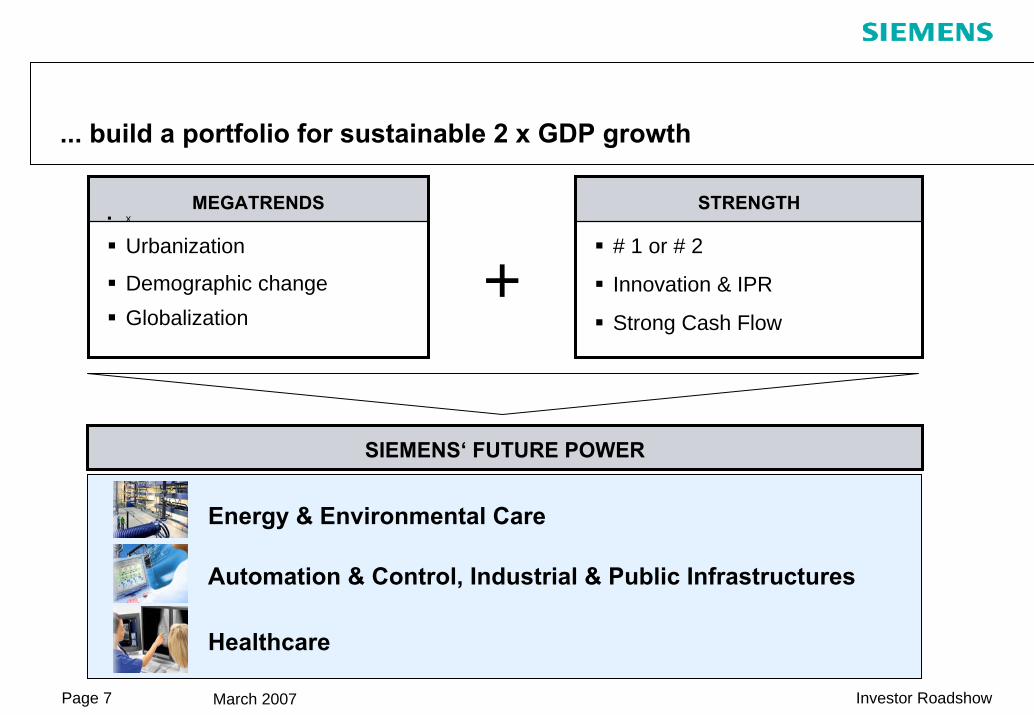
... build a portfolio for sustainable 2 x GDP growth
MEGATRENDSx
Urbanization
Demographic changeGlobalization
STRENGTH
# 1 or # 2
Innovation & IPR
Strong Cash Flow
Healthcare
Energy & Environmental Care
Automation & Control, Industrial & Public Infrastructures
SIEMENS‘ FUTURE POWER
+
Page 8 March 2007 Investor Roadshow
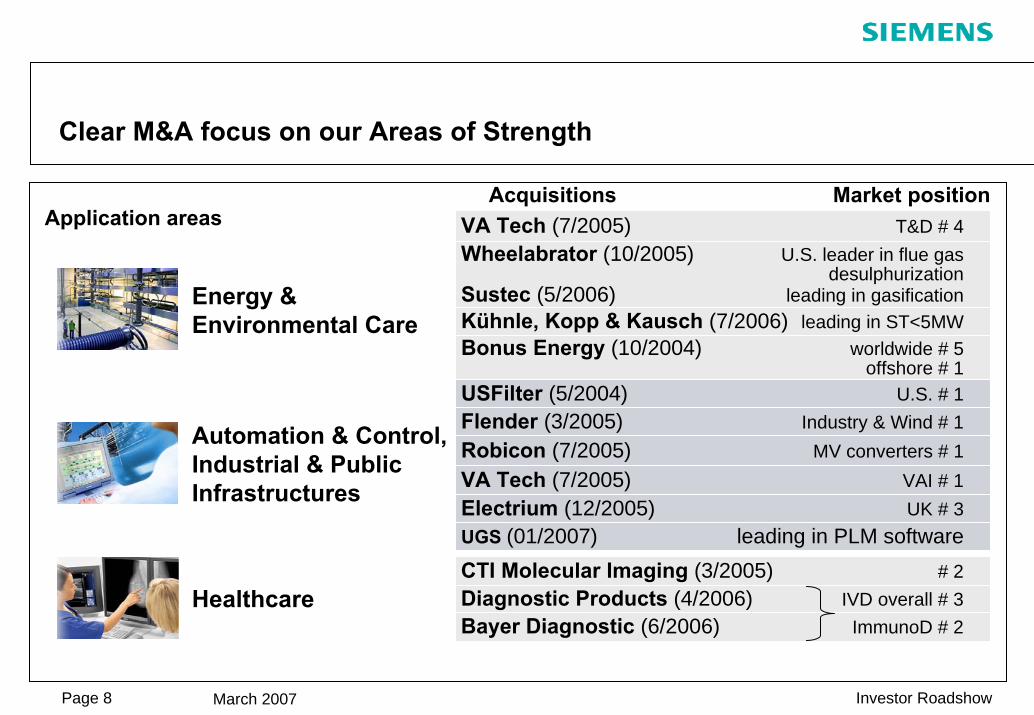
Clear M&A focus on our Areas of Strength
Market position
CTI Molecular Imaging (3/2005) # 2Diagnostic Products (4/2006) IVD overall # 3Bayer Diagnostic (6/2006) ImmunoD # 2
Healthcare
Energy & Environmental Care
Automation & Control, Industrial & Public Infrastructures
AcquisitionsVA Tech (7/2005) T&D # 4Wheelabrator (10/2005) U.S. leader in flue gas
desulphurizationSustec (5/2006) leading in gasification
Electrium (12/2005) UK # 3UGS (01/2007) leading in PLM software
Kühnle, Kopp & Kausch (7/2006) leading in ST<5MWBonus Energy (10/2004) worldwide # 5
offshore # 1USFilter (5/2004) U.S. # 1Flender (3/2005) Industry & Wind # 1Robicon (7/2005) MV converters # 1VA Tech (7/2005) VAI # 1
Application areas

Page 9 March 2007 Investor Roadshow
Key Figures Q1 FY 2007 – Operational Leverage is kicking in
in millions of eurosQ1
FY 20071) Δ
24,582 + 4%
+ 6%
+51%
+18%2)
+0.11
—
19,068
Group profit from Operations(continuing operations) 1,631
Income from continuing operations 714
Net Cash from operating and investingactivities (continuing operations)
(1,160)
0.75
New orders(continuing operations)
Revenue(continuing operations)
EPS from continuing operations (in euros)(basic, attributable to shareholders of Siemens AG)
1) Q1 FY2007 IFRS – new organization2) Includes € 423 million GIS charge. +87% year-on-year change excluding this charge.
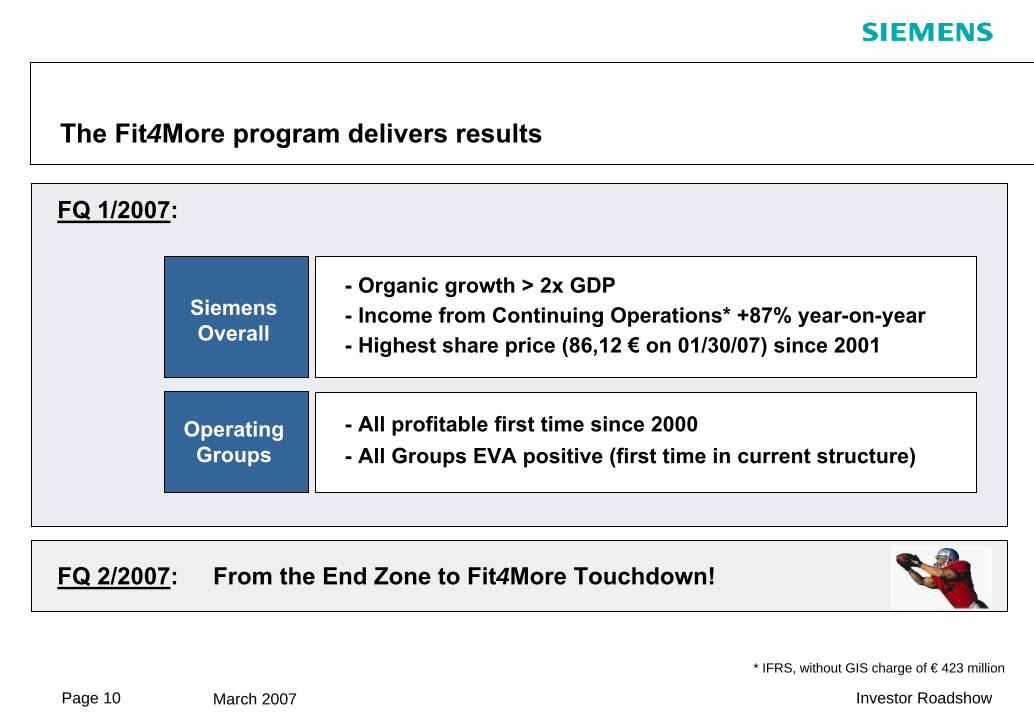
Page 10 March 2007 Investor Roadshow
The Fit4More program delivers results
- Organic growth > 2x GDP- Income from Continuing Operations* +87% year-on-year
- All profitable first time since 2000- All Groups EVA positive (first time in current structure)
- Highest share price (86,12 € on 01/30/07) since 2001
FQ 1/2007:
FQ 2/2007: From the End Zone to Fit4More Touchdown!
* IFRS, without GIS charge of € 423 million
SiemensOverall
OperatingGroups
Page 11 March 2007 Investor Roadshow
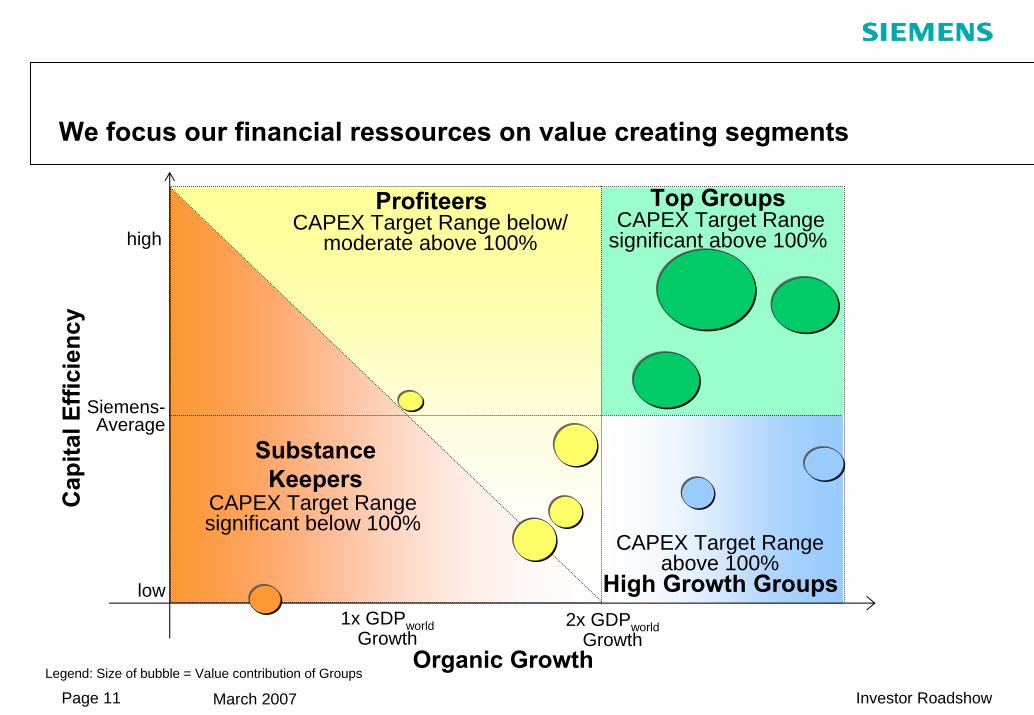
We focus our financial ressources on value creating segments
Legend: Size of bubble = Value contribution of GroupsOrganic Growth
Siemens-Average
2x GDPworldGrowth
high
low
Cap
ital E
ffici
ency
Top GroupsCAPEX Target Range
significant above 100%
High Growth Groups
Substance Keepers
CAPEX Target Range above 100%
1x GDPworldGrowth
CAPEX Target Range significant below 100%
ProfiteersCAPEX Target Range below/
moderate above 100%
Page 12 March 2007 Investor Roadshow
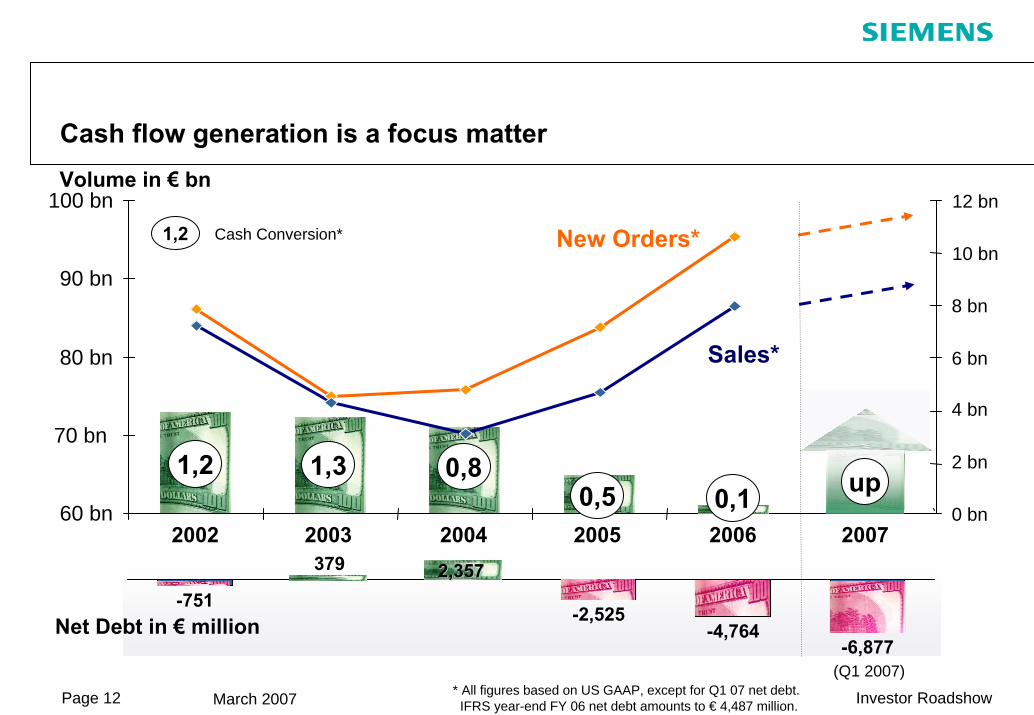
-751
379
-2,525-4,764
-6,877(Q1 2007)
Cash flow generation is a focus matterVolume in € bn
1,2 1,3 0,8
1,2 Cash Conversion*
60 bn
70 bn
80 bn
90 bn
100 bn
2002 2003 2004 2005 2006 20070 bn
2 bn
4 bn
6 bn
8 bn
10 bn
12 bn
0,10,5up
2,3572,357
up
Net Debt in € million
* All figures based on US GAAP, except for Q1 07 net debt.IFRS year-end FY 06 net debt amounts to € 4,487 million.
Sales*
New Orders*
Page 13 March 2007 Investor Roadshow
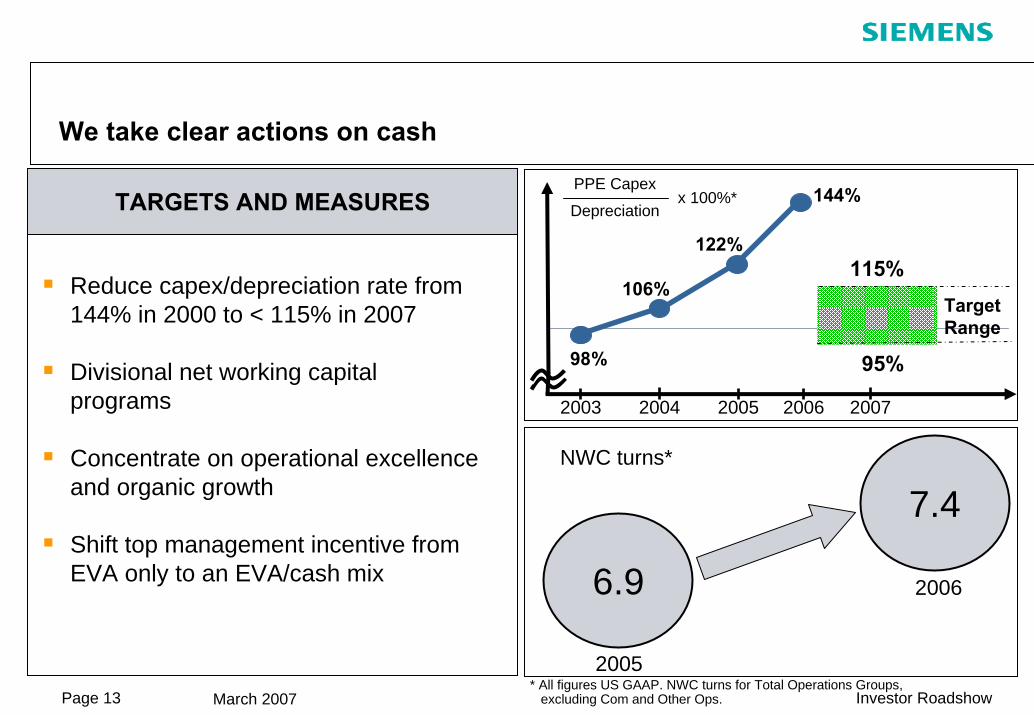
We take clear actions on cash
Reduce capex/depreciation rate from 144% in 2000 to < 115% in 2007
Divisional net working capital programs
Concentrate on operational excellence and organic growth
Shift top management incentive from EVA only to an EVA/cash mix
7.4
6.9
2005
2006
NWC turns*
* All figures US GAAP. NWC turns for Total Operations Groups,excluding Com and Other Ops.
2003 2006
TargetRange
PPE Capex
Depreciation
115%
95%
2004 2005 2007
98%
106%
x 100%*
122%
144%TARGETS AND MEASURES
Page 14 March 2007 Investor Roadshow
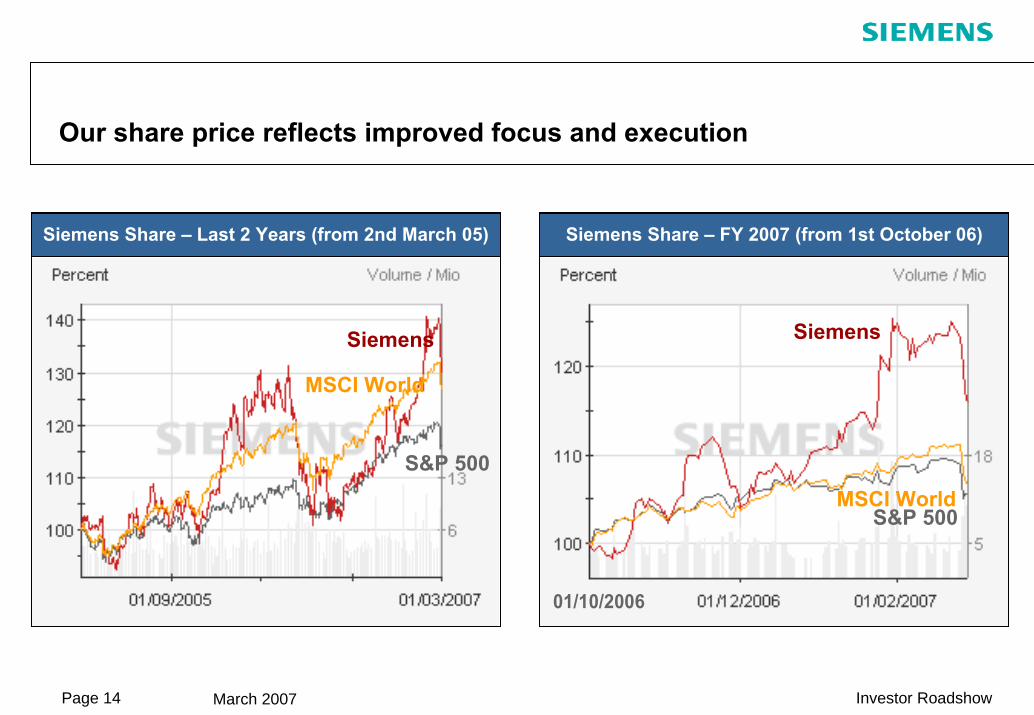
Our share price reflects improved focus and execution
Siemens
MSCI World
Siemens
S&P 500MSCI World
Siemens Share – FY 2007 (from 1st October 06)Siemens Share – Last 2 Years (from 2nd March 05)
S&P 500
01/10/2006
Page 15 March 2007 Investor Roadshow
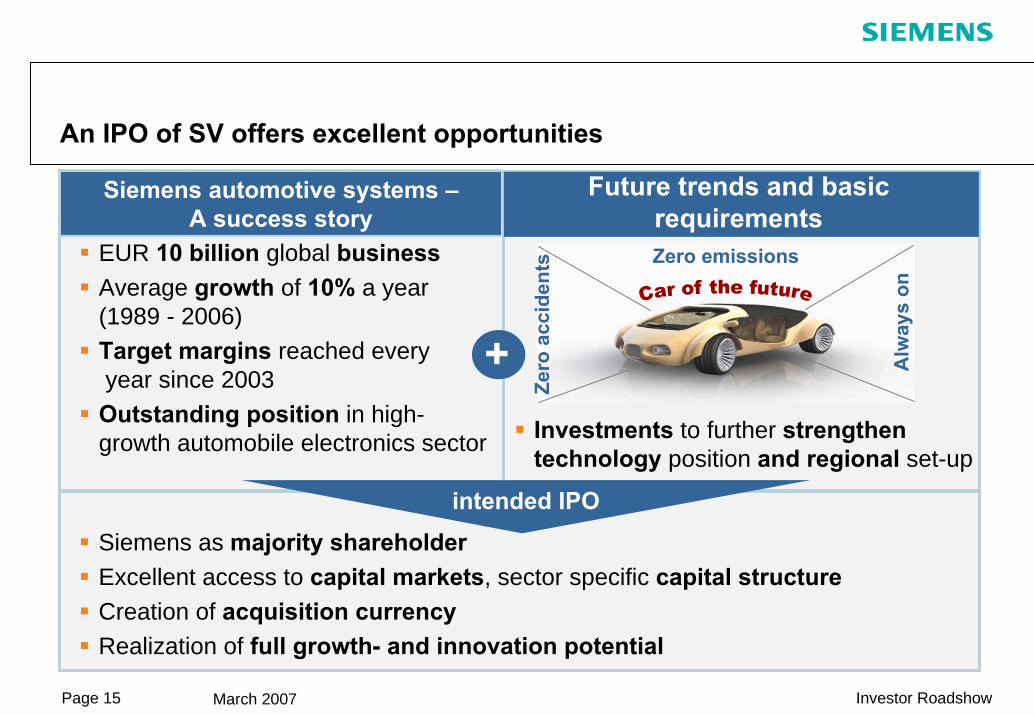
An IPO of SV offers excellent opportunities
Future trends and basic requirements
Siemens automotive systems –A success story
Investments to further strengthen technology position and regional set-up
Siemens as majority shareholderExcellent access to capital markets, sector specific capital structureCreation of acquisition currencyRealization of full growth- and innovation potential
+
intended IPO
Alw
ays
on
Zero emissions
Zero
acc
iden
tsEUR 10 billion global businessAverage growth of 10% a year (1989 - 2006)Target margins reached every year since 2003Outstanding position in high-growth automobile electronics sector
Page 16 March 2007 Investor Roadshow
Outlook for fiscal 2007
1. We will reach our Fit4More goals
Growth of 2x global GDP (w/o effects from deconsolidation)
All Groups expected to reach target margins
2. Expect a New Target System including Capital Efficiency Goal for Siemens
Page 17 March 2007 Investor Roadshow
Appendix

Page 18 March 2007 Investor Roadshow
CAGR 1977–2006: 5.9%
30 years history of continuous dividend payment
20 years of regular dividend increases
0.0
0.4
0.8
1.2
1.6
divi
dend
/ sh
are
(€)
2.0
1977
1978
1979
1980
1981
1982
1983
1984
1985
1986
1987
1988
1989
1990
1991
1992
1993
1994
1995
1996
1997
1998
1999
2000
2001
2002
2003
2004
2005
2006
special dividend€ 0.67 Infineon IPO
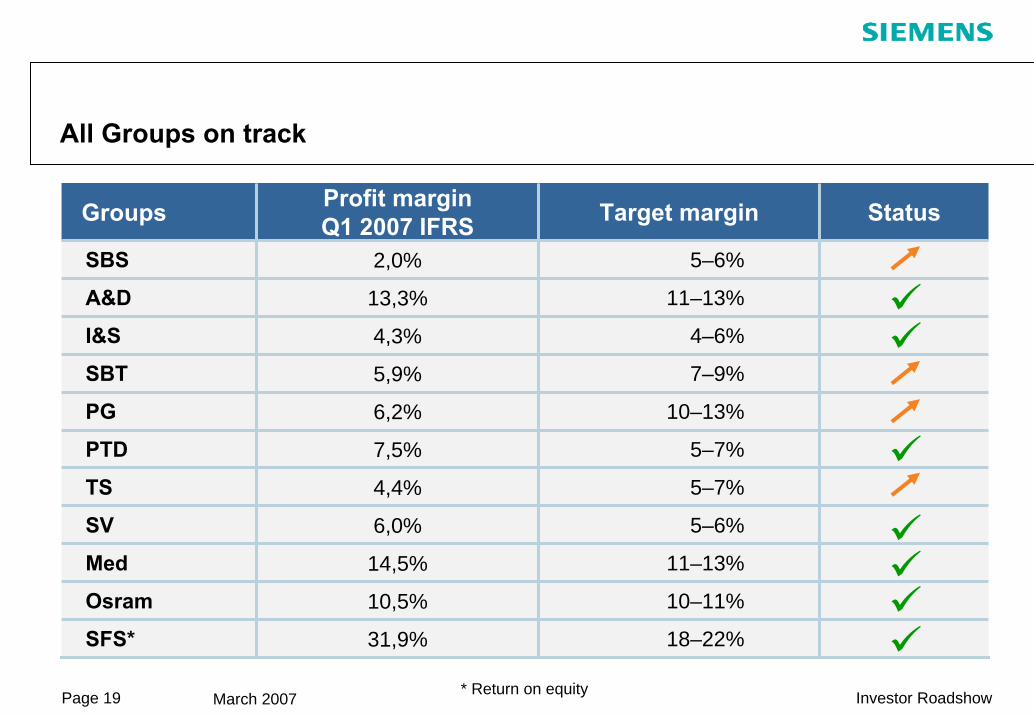
Page 19 March 2007 Investor Roadshow
All Groups on track
Groups Profit marginQ1 2007 IFRS Target margin Status
SBS 2,0%
13,3%
4,3%
5,9%
6,2%
7,5%
4,4%
6,0%
14,5%
10,5%
31,9%
5–6%
A&D 11–13%
I&S 4–6%
SBT 7–9%
PG 10–13%
PTD 5–7%
TS 5–7%
SV 5–6%
Med 11–13%
Osram 10–11%
SFS* 18–22%
* Return on equity
Page 20 March 2007 Investor Roadshow
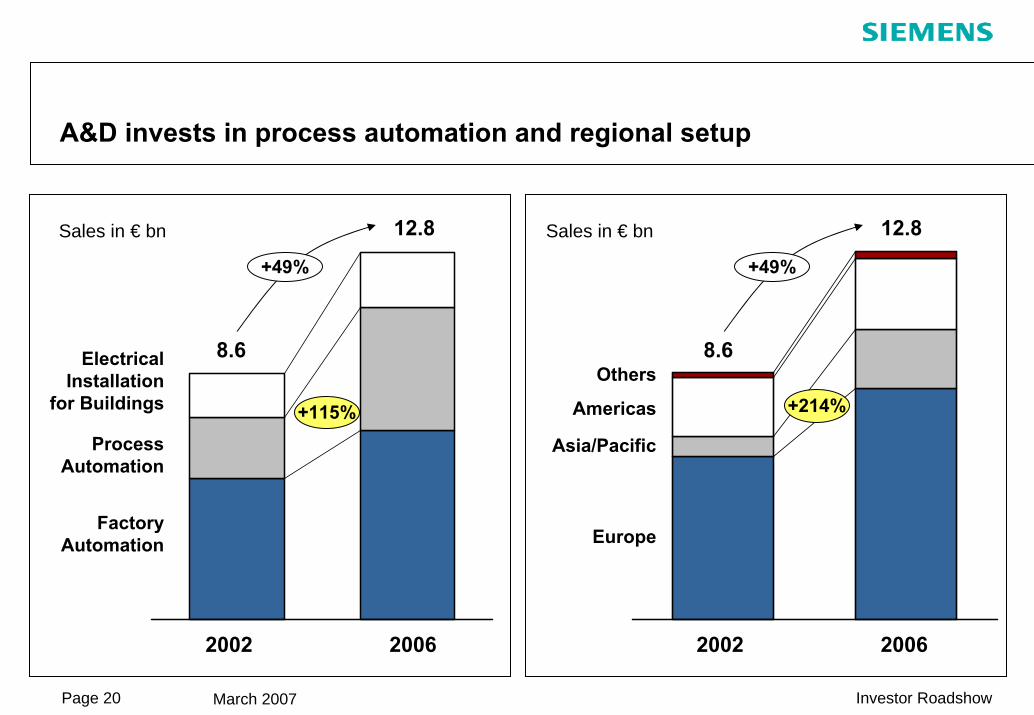
A&D invests in process automation and regional setup
2002 2006
ElectricalInstallation
for Buildings
ProcessAutomation
FactoryAutomation
+115%
Sales in € bn
8.6
12.8
+49%
Asia/Pacific
Americas
Europe
Others+214%
2002 2006
Sales in € bn
8.6
12.8
+49%
Page 21 March 2007 Investor Roadshow
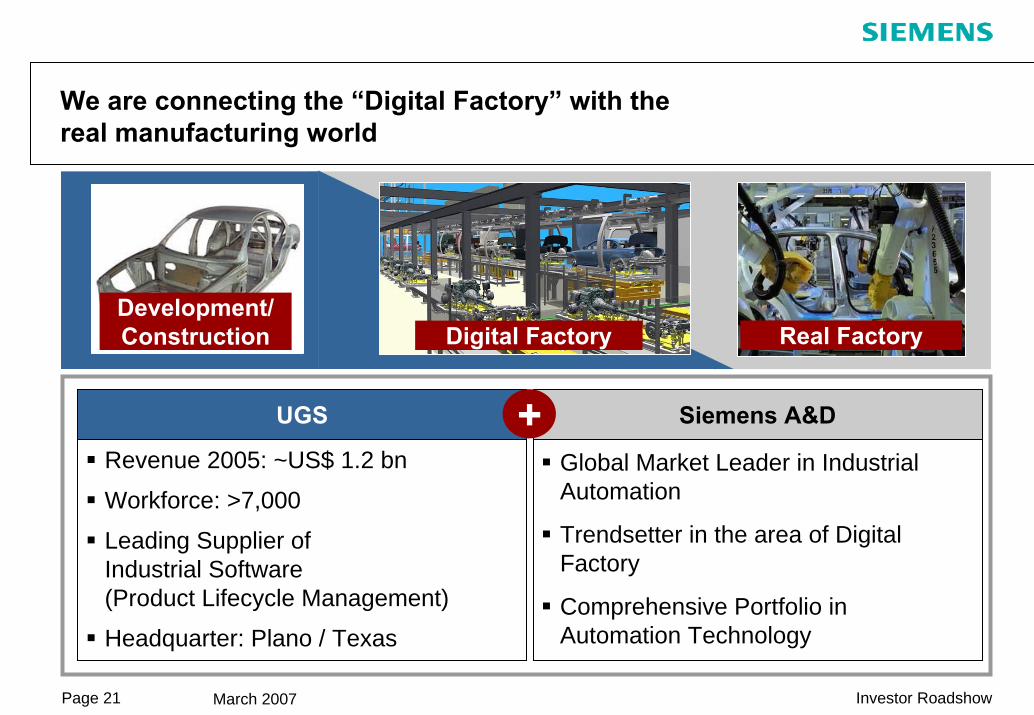
We are connecting the “Digital Factory” with the real manufacturing world
Global Market Leader in Industrial Automation
Trendsetter in the area of Digital Factory
Comprehensive Portfolio in Automation Technology
Siemens A&D
Revenue 2005: ~US$ 1.2 bn
Workforce: >7,000
Leading Supplier ofIndustrial Software (Product Lifecycle Management)
Headquarter: Plano / Texas
UGS +
Development/ Construction Digital Factory Real Factory
Page 22 March 2007 Investor Roadshow
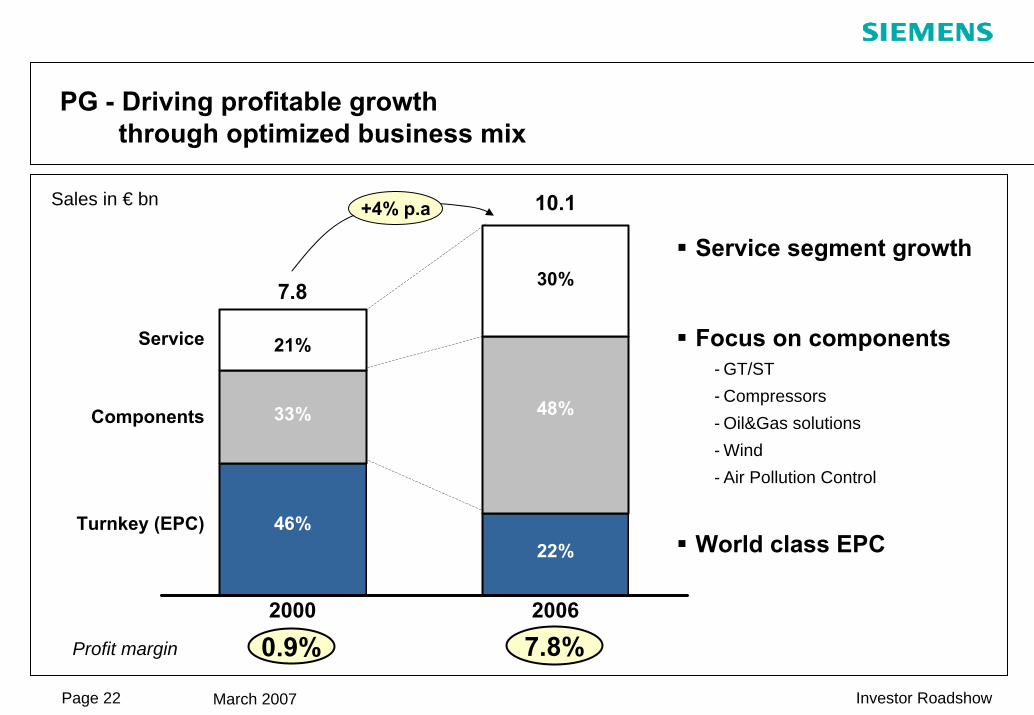
Sales in € bn
21%
33%
46%
7.8
2000
30%
48%
22%
10.1
2006
Service
Components
Turnkey (EPC)
Focus on components- GT/ST- Compressors- Oil&Gas solutions- Wind - Air Pollution Control
PG - Driving profitable growth through optimized business mix
World class EPC
Service segment growth
Profit margin 0.9% 7.8%
+4% p.a

Page 23 March 2007 Investor Roadshow
Clean energy offers multiple growth opportunities
Wind2.3 MW onshore turbine3.6 MW offshore turbine+ 195% orders+ 350% profitEurope's largest wind park€ 350 mn order value
GasificationSustec IGCCCO2-free power plant (option)Fuel flexibilityLower emissionsReduction of investment costIncrease of efficiency
CleanEnergy
Efficiency increase targets43% >50% (lignite)47% >53% (hard coal)58% >60% (CCPP)
SGT5-8000H
Air Pollution ControlWheelabratorAdvanced Burner TechnologyOrders +56%Book to Bill >2
Geothermal Power StationsConversion of heat from low-temperature springsinto electrical energyCO2-emission free base load supplyAdditional Service business opportunities
Page 24 March 2007 Investor Roadshow
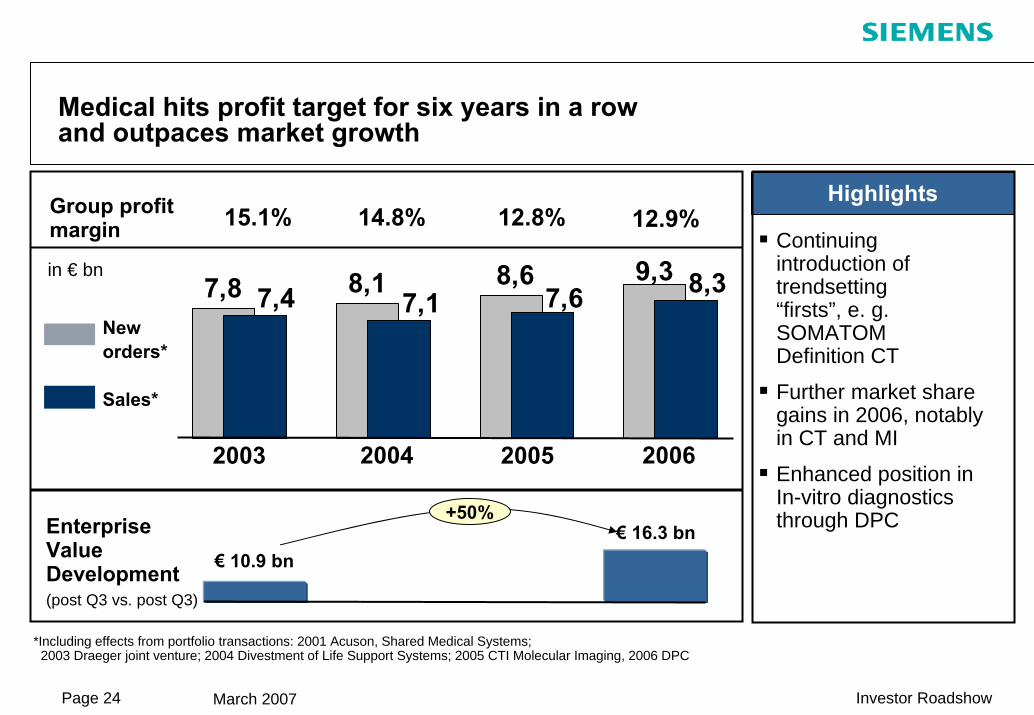
Medical hits profit target for six years in a row and outpaces market growth
Neworders*
Sales*
15.1% 14.8% 12.8%Group profitmargin Continuing
introduction of trendsetting “firsts”, e. g. SOMATOMDefinition CT
Further market share gains in 2006, notablyin CT and MI
Enhanced position in In-vitro diagnostics through DPC
*Including effects from portfolio transactions: 2001 Acuson, Shared Medical Systems; 2003 Draeger joint venture; 2004 Divestment of Life Support Systems; 2005 CTI Molecular Imaging, 2006 DPC
in € bn
12.9%Highlights
EnterpriseValueDevelopment(post Q3 vs. post Q3)
€ 10.9 bn€ 16.3 bn
+50%
9,37,8 8,1 8,67,4 7,1 7,6 8,3
2003 2004 2005 2006
Page 25 March 2007 Investor Roadshow
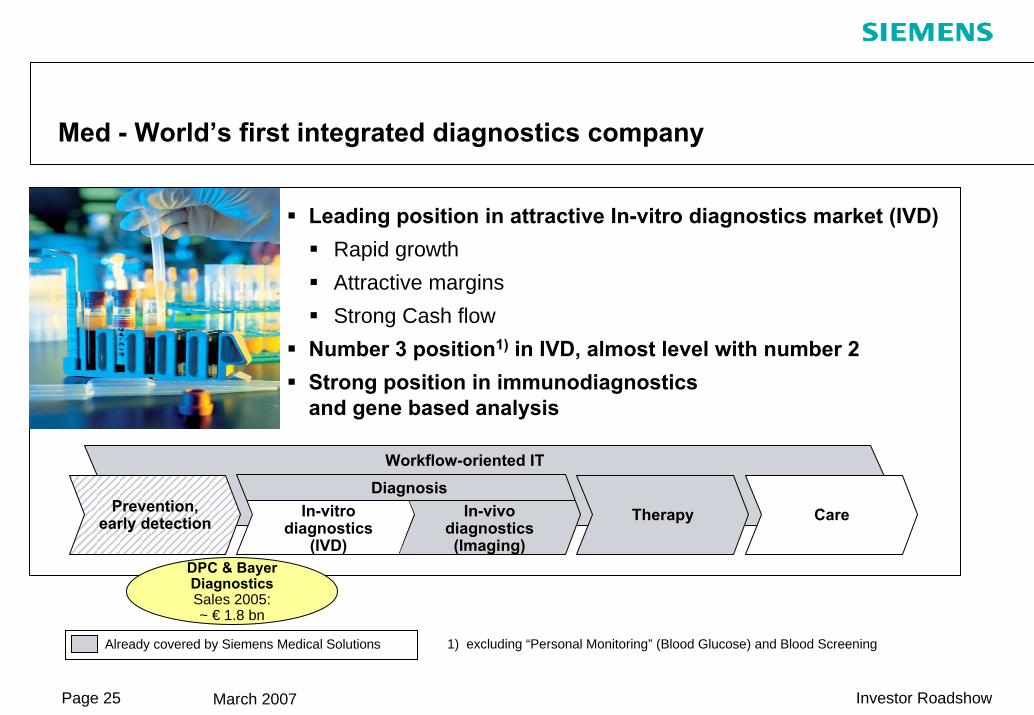
Pflege
Med - World’s first integrated diagnostics company
1) excluding “Personal Monitoring” (Blood Glucose) and Blood ScreeningAlready covered by Siemens Medical Solutions
Leading position in attractive In-vitro diagnostics market (IVD)Rapid growthAttractive marginsStrong Cash flow
Number 3 position1) in IVD, almost level with number 2Strong position in immunodiagnostics and gene based analysis
CareTherapyPrevention,early detection
In-vivo diagnostics (Imaging)
DiagnosisWorkflow-oriented IT
In-vitro diagnostics
(IVD)DPC & Bayer DiagnosticsSales 2005: ~ € 1.8 bn
Page 26 March 2007 Investor Roadshow
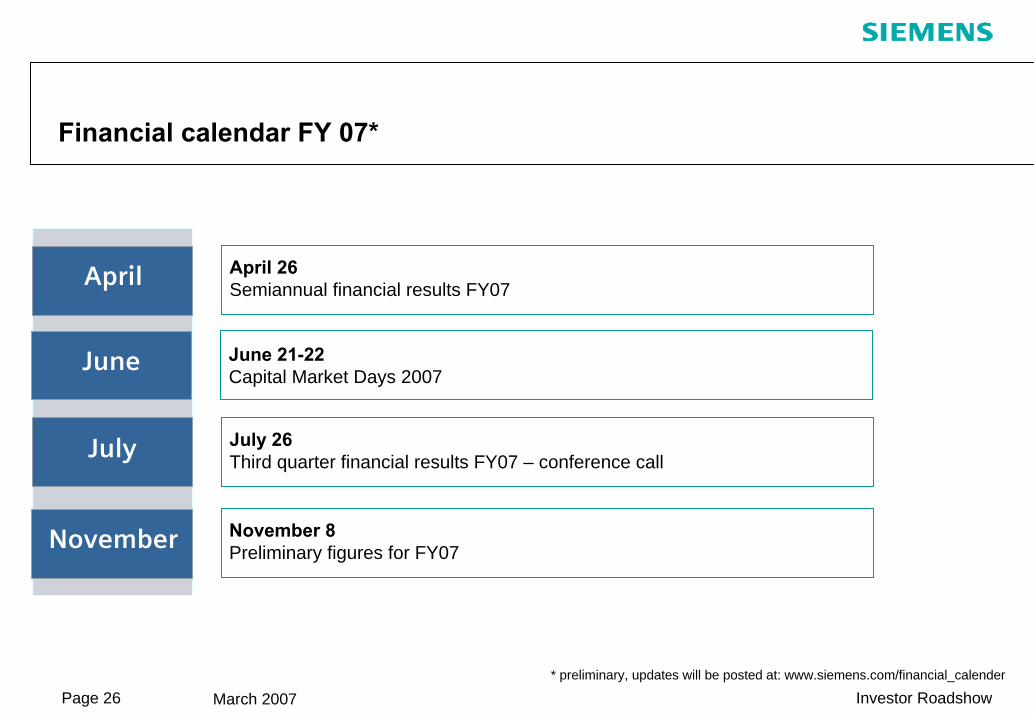
June
April
June 21-22Capital Market Days 2007
April 26Semiannual financial results FY07
Financial calendar FY 07*
July July 26Third quarter financial results FY07 – conference call
November November 8Preliminary figures for FY07
* preliminary, updates will be posted at: www.siemens.com/financial_calender
Page 27 March 2007 Investor Roadshow
Reconciliations and definitions
”Group profit from Operations” is reconciled to ”Income before income taxes” of Operations under ”Reconciliation to financial statements” on the table ”Segment information”. See ”Financial Publications/Quarterly Reports, FY2007Q1, Financial Statements” at our Investor Relations website under www.siemens.com
ROE (Return on equity) margin for SFS was calculated as SFS' income before income taxes divided by the allocated equity for SFS.Allocated equity for SFS as of September 30, 2006 was € 1,131 million.
The allocated equity for SFS is determined and influenced by the respective credit ratings of the rating agencies and by the expected size and quality of its portfolio of leasing and factoring assets and equity investments and is determined annually. This allocation is designed to cover the risks of the underlying business and is in line with common credit risk management banking standards. The actual risk profile of the SFS portfolio is monitored and controlled monthly and is evaluated against the allocated equity.
Siemens ties a portion of its executive incentive compensation to achieving economic value added (EVA) targets. EVA measures theprofitability of a business (using Group profit for the Operating Groups and income before income taxes for the Financing and Real Estate businesses as a base) against the additional cost of capital used to run a business (using Net capital employed for the operations Groups and risk-adjusted equity for the Financing and Real estate businesses as a base). A positive EVA means that a business has earned more than its cost of capital, whereas a negative EVA means that a business has earned less than its cost ofcapital. Depending on the EVA development year-over-year, a business is defined as value-creating or value-destroying. Other organizations that use EVA may define and calculate EVA differently.
Page 28 March 2007 Investor Roadshow
Siemens Investor Relations Team
Webpage: http://www.siemens.com Investor Relations
e-mail: [email protected]
Telephone: +49-89-636-32474
Fax: +49-89-636-32830
Marcus Desimoni +49-89-636-32445
Roland Bischofberger +49-89-636-36165
Frank Heffter +49-89-636-34095
Irina Pchelova +49-89-636-33693
Christof Schwab +49-89-636-32677
Susanne Wölfinger +49-89-636-30639


