42
* *

On the Heterogeneous E�ects of Sanctions on Trade and Welfare:
Evidence from the Sanctions on Iran and a New Database
Gabriel Felbermayr Constantinos Syropoulos
Kiel Institute & Kiel University Drexel University
Erdal Yalcin Yoto V. Yotov∗
Konstanz University Drexel University
of Applied Sciences ifo Institute
May 17, 2020
Abstract
Using a new, comprehensive database, we study the impact of sanctions on international
trade and welfare. Speci�cally, capitalizing on the latest developments in the structural
gravity literature, we quantify the partial and general equilibrium e�ects of sanctions.
Starting with a broad evaluation of the impact of sanctions, we carefully investigate
the case of Iran. We �nd that the e�ects are signi�cant but also widely heterogeneous
across sanctioning countries and dependent on the direction of trade, even within the
European Union. We also perform a counterfactual analysis of removing the sanctions
on Iran, which translates our partial estimates into sizable and heterogeneous (across
both countries and sectors), but also intuitive, general equilibrium e�ects within the
same framework.
JEL Classi�cation Codes: F1, F13, F14, F5, F51, H5, N4.Keywords: Sanctions, E�ectiveness of Sanctions, Structural Gravity.
∗Contact information: Felbermayr�Kiel Institute, Kiel University. E-mail: [email protected];Syropoulos�School of Economics, Drexel University; CESifo. E-mail: [email protected]; Yalcin�Konstanz University of Applied Sciences; CESifo. E-mail: [email protected]; Yotov�Schoolof Economics, Drexel University; Center for International Economics, ifo Institute; CESifo. E-mail:[email protected].

Acknowledgements: We are grateful to Rod Ludema for his insightful discussion of ourpaper during the inaugural Scienti�c Workshop on Sanctions at Drexel University. Wealso appreciate the useful comments and suggestions by Hana Attia, Richard Barnett, Ti-bor Besedes, Albrecht Bohne, Edward Cartwright, Andrea Charron, Anne-Celia Disdier,Jonathan Eaton, Lionel Fontagne, Annika Havlik, Friedrich Heinemann, James Harrigan,Gary Hufbauer, Krisztina Kis-Katos, Udo Kreickemeier, Mario Larch, Tuan Luong, AhmedMahmud, Thierry Mayer, Alejandro Molnar, Inmaculada Martinez-Zarzoso, Anna Miro-manova, Daniel Mirza, Juan Mora-Sanguinetti, Cli� Morgan, Volker Nitsch, Clara Portela,Gerald Schneider, Holger Strulik, Farid Toubal, Alessia Lo Turco, Hylke Vandenbussche,Joschka Wanner, Zheng Wang and seminar participants at De Montfort University, DrexelUniversity, the European Trade Study Group 2018, Katholieke Universiteit Leuven, Leib-niz University Hannover, the Midwest Meetings in International Trade in Vanderbilt, ParisSchool of Economics, the Organisation for Economic Co-operation and Development, Tech-nische Universitat Darmstadt, University of Göttingen, ZEW Mannheim, University of Ho-henheim, and the 2018 Annual Conference of the German Economic Association.

�At the beginning of the 21st century, the same as a century earlier, economic
sanctions remain an important yet controversial foreign policy tool.�
(Hufbauer et al., 2007)
1 Introduction
From the �Age of Pericles� in Athens of ancient Greece, to the times of Napoleon and
Thomas Je�erson in the nineteenth century, and World War I, economic sanctions have
served as a prominent and �purposive tool� of coercive statecraft (Drezner, 1999).1 They
have been imposed unilaterally or coalitionally and, especially in the post-Cold War era,
with increasing frequency.2 Prior to WW II, economics sanctions were inextricably linked
to military endeavors, mostly taking the form of trade sanctions and economic blockades
under the protective umbrella of the sanctioning states' naval forces.3 In more recent times,
though, the arsenal of weaponry in economic sanctions has been enriched to include boycotts,
restrictions on trade in arms, �nancial sanctions, travel bans, and the withholding of military
assistance, among others.4
The growing popularity of economic sanctions among policymakers raises a fundamental
question: Do they work? The conventional wisdom (e.g., Pape (1997)) is that �...Economic
1Notable examples of such sanctions include: the Megarian decree of Athenians in 435 B.C.; the US'ssanctions at the time of Je�erson against France and Great Britain during their engagement in the NapoleonicWars; the sanctions against Italy by the League of Nations in 1935; the Anti-Apartheid Act against SouthAfrica in 1986; the US sanctions against Cuba; the United Nations �nancial and trade sanctions againstIraq prior to the overthrowing of Saddam Hussein in 2003; the recurrent sanctions on North Korea; thecomprehensive and multi-round economic sanctions by EU, the US and other nations against Russia; theimposition of sanctions, under the US leadership, against Iran in 1987, their expansion in 1995 and 2006,and their controversial renewal by the US in 2018; the sanctions against Venezuela under President HugoChavez and, more recently, by the Trump administration against President Nicolás Maduro.
2Remarkably, and as we emphasize later on in connection with the content of the Global Sanctions DataBase (GSDB), the number of recorded sanctions during 1950-2016 is 729. Furthermore, over the last 25years of this period, the number of sanctions more than doubled.
3In some cases, they have served as precursors of armed con�ict. As Findlay and O'Rourke (2009) amplydocument in their impressive discourse of international trade in the second millennium, trade and warfarewere inseparable.
4The increased reliance on instruments nowadays�which could be attributed to the liberal order promul-gated by the GATT/WTO and the dramatic reduction in transaction costs due to technological advances�may have improved the sanctioning states' ability to interfere in the sanctioned states' national a�airs. SeeAhn and Ludema (2018) for a insightful analysis of targeted sanctions on Russia and Besedes et al. (2018)for an noteworthy analysis of �nancial sanctions on German economic activity.
1

Sanctions Do NotWork.� Hufbauer et al. (2007), one of the most comprehensive contributions
to the related empirical literature, report that 34% of the cases they examined could be
viewed as successful. However, after subjecting this �nding into further scrutiny, Pape
(1998) contends that the success rate was only 4%.5 Why is it, then, that policymakers
continue to favor this policy tool?
The evocative title of Morgan and Schwebach (1997), �Fools Su�er Gladly...� may be in
the vicinity of truth. Hufbauer et al. (2007) and Drezner (1999) outline a number of reasons
that could explain the seelingly limited success of sanctions. First, the types of sanctions
used may be �inadequate� for the speci�c objective(s) considered. Second, the imposition
of sanctions may prompt vociferous opposition in the target country by uniting citizens and
domestic interests in �rallies behind the �ag.� Third, powerful allies of the sanctioned country
may intervene (as �black knights�) to counteract the damaging e�ects of sanctions. Fourth,
uneven sharing of the costs of sanctions among the sender's allies and business interests may
impair unity in multilateral relationships thereby �undermining� their e�ectiveness. Last,
but not least, policy leaders may choose to deploy sanctions because they perceive them as
a less damaging substitute for military interventions.
Morgan and Schwebach (1997) propose a theoretical framework and an empirical test
that suggests this: the higher the cost of economic sanctions to the target the higher the
probability that sanctions will succeed. In addition to emphasizing the above costs, careful
theoretical contributions to this problem (e.g., Eaton and Engers (1992; 1999); Drezner
(1999)) also suggest that the lower the cost of sanctions to the sender(s), the more likely
that sanctions will succeed.
Motivated by these insights, our objective/contribution in this paper is threefold. First,
we aim to demonstrate the usefulness of the newly created database, the Global Sanctions
5Also see Pape (1997), Baldwin (1985; 1999), Drezner (1999) and Kaempfer and Lowenberg (2007) forinsightful reviews of various contrasting views in this literature.
2

Data Base (GSDB), in assessments of the impact of economic sanctions.6 Our second ob-
jective is to o�er quantitative measures of the costs of sanctions. Focusing on trade as the
primary channel of economic pain to the target and capitalizing on the latest developments
in the literature on structural gravity, we pursue this objective by assessing the partial and
general equilibrium (GE) costs related to it and the e�ects of these costs on trade, real
GDP, and sectoral value added. To the best of our knowledge, this is the �rst paper to
obtain estimates of the GE welfare e�ects of sanctions and to o�er a continuous measure of
sanctions e�ectiveness. Our third contribution is to show that the impact of sanctions is not
only signi�cant but also widely heterogeneous across the various dimensions covered by the
GSDB. Our methods and the wide heterogeneity in our sanction estimates open promising
opportunities for an analysis of the determinants of the e�ectiveness of sanctions.
We pursue the above objectives with an application to the sanctions on Iran. Our focus
on this country is motivated by three factors. First, it is one of the most perplexing and
widely discussed cases in recent history. Second, the sanctions on Iran are multi-dimensional,
varying in terms of country coverage (e.g., UN vs. US vs. EU sanctions), targets (e.g., on
military goods vs. all goods vs. travel vs �nance vs. individuals), and time (e.g., EU
sanctions were �rst imposed in 2006 and reached a peak in terms of stringency in 2012). We
exploit this multi-dimensionality within the GSDB and identify the heterogeneous e�ects of
these sanctions. Third, because almost all countries in the world have sanctioned Iran, we
are able to contribute to the related literature methodologically (i) by obtaining a large set of
pair-speci�c estimates and studying their heterogeneity across countries, while (ii) avoiding
6The GSDB has the following valuable characteristics: it provides a detailed description of the varioustypes of sanctions observed during 1950-2016 and the policy objectives associated with each type; it containsa record of whether each sanction type is viewed in policy circles as a �success� or a �failure�; it also containsa descriptive analysis of the evolution of sanctions over time and regions in the world as well as a preliminaryanalysis of the trade volumes that may be potentially a�ected by the types of sanctions considered. Animportant dimension of the GSDB, which we capitalize on in this project, is that it distinguishes betweendi�erent types of trade sanctions. The GSDB is freely available and we will be happy to share it withinterested researchers, who can request the database by e-mail at [email protected].
3

the potential problem of extraterritorial e�ects.7 Our discussion of the sanctions on Iran is
contained in Section 2.3.
We implement the empirical analysis in two steps. Taking advantage of the rich dimen-
sionality of the GSDB and following the latest recommendations for gravity estimations, in
the �rst step we obtain a series of partial equilibrium estimates of the impact of sanctions on
international trade. We highlight several �ndings from this analysis. While other types of
sanctions (e.g., travel sanctions) do not a�ect trade �ows directly, we �nd that, on average,
trade sanctions are e�ective in impeding international trade. Our explanation is that the
e�ects of other types of sanctions on trade are indirect and operate through general equilib-
rium forces, which are controlled for and absorbed by the �xed e�ects in our model.8 Our
estimates reveal that complete trade sanctions reduce trade �ows between sanctioned and
sanctioning countries signi�cantly (i.e., by close to 80 percent). In contrast, partial trade
sanctions do not have signi�cant e�ects on overall trade. This �nding suggests that even if
partial sanctions are e�ective in reducing trade in some sectors, their impact is o�set by the
increase in trade in other sectors. We also �nd that the impact of sanctions is heterogeneous
across the trade sanction cases (e.g., the sanction on Iran vs. all other trade sanctions).
To deepen our understanding of the heterogenous e�ects of trade sanctions, we zoom in
on the impact of the sanctions on Iran. First, we obtain a negative, large and signi�cant
average estimate of the impact of the sanctions on Iran. We also �nd that the e�ects of
the sanctions vary across country-pairs within the Iran sanctions (e.g., USA-Iran vs. China-
Iran). Our estimates reveal that the impact of the sanctions varies within pairs depending
on the direction of trade �ows (e.g., Greece-Iran vs. Iran-Greece). Next, using the EU case,
we identify the e�ects of deeper provisions within the Iran sanctions and �nd that deeper
7Anecdotal evidence suggests that some sanctioning countries impose pressure on third nations to punishtheir targets (e.g., longstanding US sanctions against Cuba resulted in a settled case with the French BankSociety Generale, due to the bank's handling of dollar transactions with Cuba violating US sanctions againstCuba). We view this as an important policy question and believe that the methods employed in this papercan be extended to address it e�ectively. However, we leave this interesting agenda for future work.
8For example, some �nancial sanctions aim to prevent �nancial institutions from processing payments orto provide trade �nance regardless of the direction of trade.
4

provisions have been e�ective. However, their impact has also been very heterogeneous across
EU members and dependent upon the direction of trade. Finally, we obtain some estimates
that are not statistically signi�cant (e.g., Turkey-Iran and China-Iran), re�ecting sanctions
waivers, and even some positive estimates (e.g., United Arab Emirates-Iran), re�ecting trade
diversion e�ects.
In the second step of our empirical analysis, we quantify the general equilibrium e�ects
of the Iran sanction on trade, real GDP, and sectoral value added using the same structural
gravity framework that served as the foundation for our estimation analysis. Speci�cally,
the counterfactual experiment employs our partial equilibrium estimates to simulate a hy-
pothetical world without the Iran sanction in place. With respect to trade, we �nd that the
removal of the sanction on Iran would make the country substantially more open to interna-
tional trade. However, despite the large percentage changes in trade with many developed
nations, the new levels of trade between Iran and these countries would still be very low.
Turning to the e�ects on welfare, unsurprisingly, we �nd that the biggest winner of
terminating the sanctions regime would be Iran: its real per capita income is predicted to rise
by about 4.2 percent. The e�ects on other countries are small but intuitively heterogeneous.
For example, we �nd that the next biggest winner from the removal of the Iran sanctions
is Armenia, Iran's neighboring country. The Western initiators of the sanctions against
Iran and UN Security Council members (e.g., USA, France, and Great Britain) are barely
a�ected by the removal of the sanction while Korea, Panama, Ukraine and some oil producing
countries are likely to lose. Finally, and expectedly, the model predicts that a termination
of the sanctions would bene�t Iran's oil and gas sectors most strongly, with the value added
in the gas sector reaching almost a 40 percent increase. Other sectors that would enjoy
sizable gains in terms of value added include leather, textile, and transportation. In contrast,
losses are concentrated in comparative disadvantage sectors (e.g., many agricultural products
including vegetables, sugar and rice).
Our work complements and extends a series of studies that quantify the impact of sanc-
5

tions. For example, several papers have already used the gravity model to obtain partial
equilibrium estimates of the e�ects of sanctions (e.g., Hufbauer and Oegg (2003), Caruso
(2003), Yang et al. (2004), and Afesorgbor (2018)). We o�er three contributions in relation
to these studies. First, we implement the latest developments in the estimation structural
gravity literature. We use the PPML estimator and obtain country-pair and directional
estimates of the impact of trade sanctions in a setting with asymmetric pair �xed e�ects
and importer-time and exporter-time �xed e�ects. Second, we capitalize on the rich dimen-
sionality of the GSDB to obtain novel estimates of the impact of trade sanctions. Third,
we employ the full gravity system to quantify the general equilibrium e�ects of sanctions on
trade, welfare and sectoral value added in the world.
Our study of the Iran sanctions complements several papers that have also examined
these sanctions (including, for example, Haidar (2017), which uses disaggregated customs
data to study export de�ection in Iran and Draca et al. (2017), which studies the incidence
of sanctions on Iranian �rms) and papers that consider other sanction cases (e.g., Crozet
and Hinz (2017) and Miromanova (2019), which focus on Russia). We view these studies,
which use �rm-level analysis, and our top down approach as complementary both in terms
of methods and �ndings. Our country-speci�c partial estimates of the Iran sanction and,
especially, our general equilibrium estimates of the impact of sanctions on Iranian trade, real
GDP, and sectoral value added are novel in relation to these studies.
We view the quantitative exercise as limited in scope and are keenly aware that it alone
cannot fully address the question of the �e�ectiveness� of sanctions.9 Our motivation in
pursuing this task is twofold. First, we believe that any attempts to bridge the gap between
scholarship and policy making are doomed to remain unsatisfactory (or fail) if the costs that
senders impose on targets through trade-related channels and the burden of their actions
to themselves are not appraised. We think the analysis in this paper can rectify, or at
9This is so because the problem we are dealing with is multi-dimensional in nature and has componentparts that are notoriously di�cult to quantify and assess. As noted earlier, these di�culties are at least inpart related to the potentially con�icting objectives of politicians and policymakers as well as the nuancedstrategic policy interactions in the global economy.
6

least mitigate, this problem. Second, while we recognize the importance of earlier e�orts to
quantity these e�ects, we believe that the fact that our methodology has solid theoretical and
general equilibrium foundations positions it well suited to capture both the signi�cance of
the heterogeneous e�ects of the various types of sanctions considered and the distributional
e�ects on the burden of costs among senders.
The rest of the paper is organized as follows. Section 2 o�ers some descriptive motiva-
tional evidence on the relationship between sanctions and international trade based on the
GSDB. Section 3 reviews the structural gravity theory and speci�es our econometric model.
Section 4 presents and discusses our partial equilibrium estimates of the impact of sanctions
as well as the general equilibrium e�ects of the sanctions on Iran. Section 5 concludes.
2 Trade and Sanctions: Descriptive Evidence
2.1 A New Dataset
To quantify the impact of sanctions on international trade, we have put together a new
data base, which we dubbed the Global Sanctions Data Base (GSDB). It covers all publicly
traceable multilateral, plurilateral, as well as purely bilateral sanctions over the period 1950-
2016. In light of our objectives, in this section we provide a brief description of the main and
new dimensions of the GSDB. Then we take a close look at trade sanctions because they play
a leading role in our quantitative analysis. For a comprehensive and full data description
interested researchers and readers are referred to Felbermayr et al. (2020).10
The GSDB includes 729 sanction cases, which are classi�ed on the basis of three main
dimensions: type, objective, and success.11 First, sanctions are classi�ed by type in six
10The GSDB is freely available and we will be happy to share it with interested researchers, who canrequest it by e-mail at [email protected]. When writing to us with requests for the data, please indicateyour name and a�liation.
11In an updated version of the GSDB we are working on, the time of coverage has been extended to theyear 2019 and contains new cases for a total of 1045. The updated dataset will be available in December2020.
7

categories that cover: trade, �nancial activity, arms, military assistance, travel, and other
sanctions. Trade sanctions represent national or international legal actions preventing the
transfer of items, material or goods over a de�ned period. In comparison to existing promi-
nent sanction datasets (such as Hufbauer et al. (2007) and Morgan et al. (2014)) the GSDB
not only identi�es the existence of trade sanctions between two nations but also speci�es the
direction of a�ected trade �ows (exports and/or imports), and the type of trade restriction
(partial or complete sanctions).12 Structurally, the GSDB is closer to Hufbauer et al. (2007)
because classical trade policy interventions, such as tari�s or anti-dumping measures, are not
de�ned as sanctions. In fact all sanctions listed by Hufbauer et al. (2007) are also part of the
GSDB. In addition the GSDB includes information on the political objectives of sanctions
and documents on how far listed sanctions are considered successful in achieving de�ned
objectives.
Fig. 1 depicts the evolution of all identi�ed sanctions between 1950 and 2015. For each
year, panel (a) of Fig. 1 reports the number of newly imposed sanctions and the cases that
were initiated in previous years. Three distinct time intervals can be identi�ed. During the
1950-1990 period, we observe a gradual and steady rise in the use of sanctions. A strong
increase in new sanctions is observed in the early 90s. In the succeeding decade, until 2004,
both the total number of sanctions in force and the newly initiated cases fall. However, a
strong and steady increase of initiated sanctions policies is observed in the following years
until the end of the sample period (which also continues today). Overall, the number of
sanctions has been steadily rising over the last 65 years. We view this as evidence that
the popularity of sanctions as a tool of coercive diplomacy has been on the rise. As a
consequence, one may also suspect that the economic impact of sanctions will have been
12The most widely used database released in 1983 and updated several times over the past years is o�eredby Hufbauer et al. (2007). It focuses on around 200 identi�ed cases of trade and �nancial sanctions. Firstpublished in 2006, Morgan et al. (2014) o�er the Threat and Imposition of Economic Sanctions database(TIES), covering not only imposed sanctions but also threats of sanctions. The TIES database has alsoan economic and �nancial focus. However, it di�ers from Hufbauer et al. (2007) and from the GSDB byde�ning additionally measures of trade defence like anti-dumping as economic sanctions. Sanctions in theTIES database include tari�s, export controls, embargoes, import bans, travel bans, freezing assets, cuttingforeign aid, and blockades. As a result the number of identi�ed sanctions amount to over 1400 cases.
8

Figure 1: Number of Sanctions over Time
(a) New vs. Existing Cases
0
50
100
150
200
1950
1952
1954
1956
1958
1960
1962
1964
1966
1968
1970
1972
1974
1976
1978
1980
1982
1984
1986
1988
1990
1992
1994
1996
1998
2000
2002
2004
2006
2008
2010
2012
2014
Number of all (i.e. pre-existingand new) sanctions in force
Number of pre-existing sanctions
(b) Frequency by Type
0
50
100
150
200
1950
1952
1954
1956
1958
1960
1962
1964
1966
1968
1970
1972
1974
1976
1978
1980
1982
1984
1986
1988
1990
1992
1994
1996
1998
2000
2002
2004
2006
2008
2010
2012
2014
Other Sanctions
Travel Sanctions
Financial Sanctions
Military AssistanceSanctionsArms Sanctions
Trade Sanctions
Panel (a): number of sanctions in force inherited from last year, and number of total (inherited plus new) sanctions in force peryear. Panel (b): number of sanctions by type (trade sanctions, arms sanctions, military assistance sanctions, �nancial sanctions,travel sanctions, and other sanctions), stacked.
increasing as well.
Panel (b) of Fig. 1 presents the evolution of the number of sanctions by type.13 Several
�ndings stand out: First, trade sanctions are the main type of sanctions implemented be-
tween 1950 and the late 70s. During this period, all other types of sanctions played a minor
role. Second, over the years two speci�c policy measures have been applied with increasing
frequency: �nancial and arms sanctions. Travel bans, restrictions on military assistance and
other sanctions have also been imposed at an increasing rate. In contrast, the number of
trade sanctions remained constant over the years, which, in combination with the increasing
number of other sanctions, suggests that the number of trade sanctions is relatively smaller.
This raises the question of whether trade sanctions, which have been treated with particular
care in the GSDB, are still an important and e�ective policy tool.
In the GSDB, trade sanctions are broadly de�ned as limitations of trade �ows. The GSDB
distinguishes between several types of trade sanctions depending on coverage, direction and
participating countries. First, it is possible that only exports to or imports from a speci�c
country are temporarily banned, or that both exports and imports are not permitted during
the sanctions period. Accordingly, depending on the direction of banned trade �ows, the
13The exact number of countries that have been sanctioned with a speci�c type of sanction can be foundin Felbermayr et al. (2020).
9

GSDB distinguishes between sanctions on exports from the sender to the target, sanctions
on imports from the target to the sender, and sanctions that simultaneously apply to both
the exports and the imports between the two sides. Second, trade sanctions may apply
only to speci�c goods (partial trade sanctions) or to exports and/or imports as a whole
(complete trade sanctions). Thus, the GSDB distinguishes between �partial� and �complete�
sanctions within each of the three dimensions, depending on the direction of banned trade
�ows.14 Finally, an important aspect of sanctions is the scope of participating countries
that can vary from one country (a unilateral sanction) to, for example, a sanction imposed
multilaterally by all members of the United Nations.15 To perform the structural empirical
analysis, we capitalize on the variation across each of the three dimensions of trade sanctions
in the GSDB.
Fig. 2 tracks partial and complete trade sanctions over time. Interestingly, in the early
1950s, all countries participating in import sanctions restricted imports to the full extent.
However, in the succeeding years, an increasing number of countries restricted imports only
partly. In 2015, their share stood at around 70% of all countries applying import sanctions.
In contrast, as illustrated in panel (b) of Fig. 2, over the past 65 years, countries have
been less eager to impose restrictions on all exports. Between 1950 and 1990, around 70%
of countries sanctioning exports imposed partial restrictions. In the following period of
20 years, almost half of all export restricting countries applied complete export sanctions,
whereas in recent years two thirds of the countries participating in export sanctions applied
only partial sanctions. These patterns illustrate the importance of identifying the di�ering
extent of trade sanctions as partial vs. complete and export vs. import sanctions. In the
14For a range of cases the GSDB additionally includes detailed trade ban information (e.g., export controlsof small aviation, helicopter, aviation parts and electronics, or export restrictions of high-tech products).The partial character of this type of trade sanctions is very heterogeneous as the product ranges di�ersubstantially.
15A prominent example of a complete unilateral sanction is the full trade sanction policy imposed by theUnited states on Cuba, which was introduced by President John F. Kennedy in February 1962. The UNsanction on Iran based on resolution 1996 is an example for a (partial) sanction policy that is imposed byall UN member states. The di�erent dimensions of trade sanctions in the GSDB are explained in detail inFelbermayr et al. (2020)
10

Figure 2: Partial versus Complete Trade Sanctions
(a) Import Sanctions
0%10%20%30%40%50%60%70%80%90%
100%
1950
1953
1956
1959
1962
1965
1968
1971
1974
1977
1980
1983
1986
1989
1992
1995
1998
2001
2004
2007
2010
2013
a) Partial or Complete Import Sanction
Partial Import Sanctions Complete Import Sanctions
0%10%20%30%40%50%60%70%80%90%
100%
1950
1953
1956
1959
1962
1965
1968
1971
1974
1977
1980
1983
1986
1989
1992
1995
1998
2001
2004
2007
2010
2013
b) Partial or Complete Export Sanction
Partial Export Sanctions Complete Export Sanctions
Share of Countries Imposing a
(b) Export Sanctions
0%10%20%30%40%50%60%70%80%90%
100%
1950
1953
1956
1959
1962
1965
1968
1971
1974
1977
1980
1983
1986
1989
1992
1995
1998
2001
2004
2007
2010
2013
a) Partial or Complete Import Sanction
Partial Import Sanctions Complete Import Sanctions
0%10%20%30%40%50%60%70%80%90%
100%
1950
1953
1956
1959
1962
1965
1968
1971
1974
1977
1980
1983
1986
1989
1992
1995
1998
2001
2004
2007
2010
2013
b) Partial or Complete Export Sanction
Partial Export Sanctions Complete Export Sanctions
Share of Countries Imposing a
Partial and complete import (Panel (a)) and export (Panel (b)) sanctions over time (1950 to 2015).
econometric analysis below we demonstrate that the e�ectiveness of sanctions varies across
these dimensions.
Who imposes sanctions on whom? Fig. 3 o�ers two radial dendrograms by major regions.
Arrows starting in a speci�c region and pointing to a particular region indicate the number
of imposed trade sanctions. Panel (a) of Fig. 3 illustrates the sanction activities between
regions for the year 2015. Countries from North-Western Europe (NW Europe) imposed the
largest number of trade sanctions in Africa (brown arrow). At the same time, however, not
a single state from Africa imposed a trade Ban against a North-Western European state.
Interestingly, some regions are barely sanctioned by other regions while at the same time
others have been confronted with sanctions of almost every listed region. For example,
East and South Asia have been sanctioned by almost all regions, at least in 2015. Panel
(b) of Fig. 3 o�ers a radial dendrogram that illustrates the sanction activities between
regions for the year 1950. For the sake of comparability, we hold the regional classi�cation
of countries constant to that in 2015. The �gure illustrates a much smaller variety and
number of sanctions policies among di�erent regions. The biggest share of arrows indicate
that trade sanctions took place between members of the Eastern and Western blocks at that
time. The GSDB also illustrates that the USA and the EU countries have been the most
active nations in imposing trade sanctions against other states, followed by North-African
11

Figure 3: Bilateral Structure of Sanctions
(a) 2015
(b) 1950
Note: These two radial dendrograms visualize sanctions between di�erent regions in the world for the years 2050 and 2015.Regions are classi�ed according to the UN Geoscheme. For details see the Appendix.
nations and Canada (cf. Felbermayr et al. (2020))
The descriptive analysis of trade sanctions reveals that they are used by many countries
in an intricate network. Overall the GSDB suggests that trade sanctions are relevant. Still,
an important question in the context of measuring the cost and e�ciency of trade sanctions,
which we have not addressed thus far, is related to the extent of international economic
integration of sanctioned countries. If a nation is barely trading with the rest of the world,
the probability that it will succeed in a foreign policy pursuit with trade sanctions is small
because the economic costs on the target(s) are expected to be small. In other words, while
the number of trade sanctions and the composition of the regions and countries involved is
important, what is also important is the potential economic impact of those sanctions, which
in our case is the potential trade volume that could be a�ected by sanctions. Figs. 4 and 5
shed further light on this issue.
12

2.2 The US and the EU: Major Players
Motivated by the fact that the United States and the European Union countries have been
the most active senders, Fig. 4 depicts the exposure share of world trade to U.S. sanctions
(panel (a)), and to EU sanctions (panel (b)). Panel (a) reveals that the US sanctions had
the potential to negatively impact 2.5 percent of global trade in 2015. Interestingly, the
Figure 4: Share of World Trade Exposed to...
(a) ...US Sanctions
0,0%
0,5%
1,0%
1,5%
2,0%
2,5%
3,0%19
92
1993
1994
1995
1996
1997
1998
1999
2000
2001
2002
2003
2004
2005
2006
2007
2008
2009
2010
2011
2012
2013
2014
2015
0.0%
0.5%
1.0%
1.5%
2.0%
2.5%
3.0%
1950
1952
1954
1956
1958
1960
1962
1964
1966
1968
1970
1972
1974
1976
1978
1980
1982
1984
1986
1988
1990
1992
1994
1996
1998
2000
2002
2004
2006
2008
2010
2012
2014
(b) ...EU Sanctions
0%
1%
1%
2%
2%
3%
3%
4%
1992
1993
1994
1995
1996
1997
1998
1999
2000
2001
2002
2003
2004
2005
2006
2007
2008
2009
2010
2011
2012
2013
2014
2015
Note: The diagrams show the share of world exports exposed to US and EU sanctions. Trade data stem from the IMF Directionof Trade Statistics. EU statistics start in 1992 due to German uni�cation.
share of global trade potentially a�ected by EU sanctions turns out to be substantially less
volatile (but similarly sized). Moreover, in recent years EU sanctions have been threatening
an increasingly larger share of global trade than US sanctions. The EU and US are jointly
responsible for a�ecting negatively about two third of global trade with sanctions policies.
The main message from Fig. 4 is that, individually and in combination, the U.S. and EU
sanctions have the potential to a�ect a signi�cant fraction of trade �ows, and therefore
economic activity, in the world.
Fig. 5 complements the analysis of the impact of U.S. and EU sanctions by illustrating
the total potential impact on trade that could be caused by all trade sanctions in the world
during a given year.16 The left panel of Fig. 5 reports the impact on trade volumes in
levels, measured in trillions of current U.S. dollars. Three periods with a stepwise increase in
16In case of unilateral sanctions the graph accounts for imports and exports of sanctioning countries whilefor cases with reciprocal sanctions only both import volumes have been accounted for.
13

Figure 5: Trade Potentially A�ected by All Sanctions
(a) in trn. USD
0.0
0.5
1.0
1.5
2.0
2.5
3.0
1950
1952
1954
1956
1958
1960
1962
1964
1966
1968
1970
1972
1974
1976
1978
1980
1982
1984
1986
1988
1990
1992
1994
1996
1998
2000
2002
2004
2006
2008
2010
2012
2014
0%
1%
2%
3%
4%
5%
6%
7%
8%
1950
1952
1954
1956
1958
1960
1962
1964
1966
1968
1970
1972
1974
1976
1978
1980
1982
1984
1986
1988
1990
1992
1994
1996
1998
2000
2002
2004
2006
2008
2010
2012
2014
(b) in % of world trade
0,0
0,5
1,0
1,5
2,0
2,5
3,0
1950
1952
1954
1956
1958
1960
1962
1964
1966
1968
1970
1972
1974
1976
1978
1980
1982
1984
1986
1988
1990
1992
1994
1996
1998
2000
2002
2004
2006
2008
2010
2012
2014
0%
1%
2%
3%
4%
5%
6%
7%
8%
1950
1952
1954
1956
1958
1960
1962
1964
1966
1968
1970
1972
1974
1976
1978
1980
1982
1984
1986
1988
1990
1992
1994
1996
1998
2000
2002
2004
2006
2008
2010
2012
2014
Note: These diagrams quantify the exposed value and the share of exposed trade in world trade to all observed sanctions foreach year between 1950 and 2015. The presented trade volume is the amount of observed yearly trade between countries thatintroduce a sanctions policy in the same year. Trade data stem from the IMF Direction of Trade Statistics.
potentially a�ected global trade volume can be identi�ed. In the mid 1970s, sanctions started
to have some bite, but the extent of their impact remained very minor. After the fall of the
iron wall in 1989, potentially a�ected trade volumes quickly rose to something like 200 bn.
U.S. dollars. The most dramatic increase occurred after 2002; the trade volume potentially
a�ected by sanctions stood at more than 2 trillion U.S. dollars in recent years. Clearly,
the increasing economic integration over the last decades is one reason for the exponential
pattern depicted in Fig. 5.
In order to gauge the relative importance of sanctions for international trade, Panel (b) of
Fig. 5 translates the levels from panel (a) of the same �gure into percentages. The share of
world trade potentially impacted by sanction policies has risen steadily since 1950, reaching
7 percent of world trade in recent years. In contrast to the development in nominal trade
volume the potentially a�ected trade in relative terms turns out to be less exponential in its
development. A major message of these statistics is that the size of economic damage achiev-
able by sanction policies through the trade channel has reached quite a signi�cant volume.
This validates our focus on measuring the impact of sanctions on international trade as an
important component of the overall e�ectiveness of sanctions. Our empirical analysis below
complements and reinforces the descriptives presented in this section by demonstrating that
14

the EU and US sanctions have been among the most e�ective ones in in�uencing trade �ows
in our application. In addition, we show that the impact of sanctions is very heterogeneous
even across the EU members.
2.3 The Sanctions Against Iran
As discussed in the introduction, we �nd the sanction on Iran especially interesting (i)
because it is one of the most prominent and most discussed cases in recent history, (ii)
because it is multi-dimensional, and (iii) because it has been imposed by almost all countries
in the world, thus allowing us to obtain a large set of pair-speci�c estimates and to study
their heterogeneity across countries. This section o�ers further details on the nature and
evolution of the sanctions on Iran.
Over the past decades the United Nations security council passed several resolutions
that imposed increasingly tighter sanctions on Iran. The triggering event of more recent
UN sanctions against Iran has been the report by the International Atomic Energy Agency
(IAEA) regarding Iran's nuclear activities in particular, the country's Uranium enrichment
activities. The �rst UN resolution imposing economic sanctions on Iran came into force when
the county rejected the security council's request to suspend uranium enrichment activities.
The �rst economic sanctions against Iran started in July 2006 based on the UN security
council resolution 1696 and were extended and continuously tightened in the succeeding
years. Starting with trade sanctions on goods that could be used in Iran's nuclear and
ballistic missile program, sanctions were extended by increasing the number of goods whose
trade was banned, �nancial sanctions and travel bans for individual people. On top of
the UN resolutions listed in Table 1, the USA and the EU additionally imposed their own
sanctions on Iran. In 1979 the US imposed sanctions after Iranian students stormed the
US embassy in Tehran (import sanctions). Moreover, in 1984 the USA imposed further
sanctions on Iran because of the country's support for acts of international terrorism. In
1995 the US formulated an executive order to prohibit bilateral trade between Iran and the
15
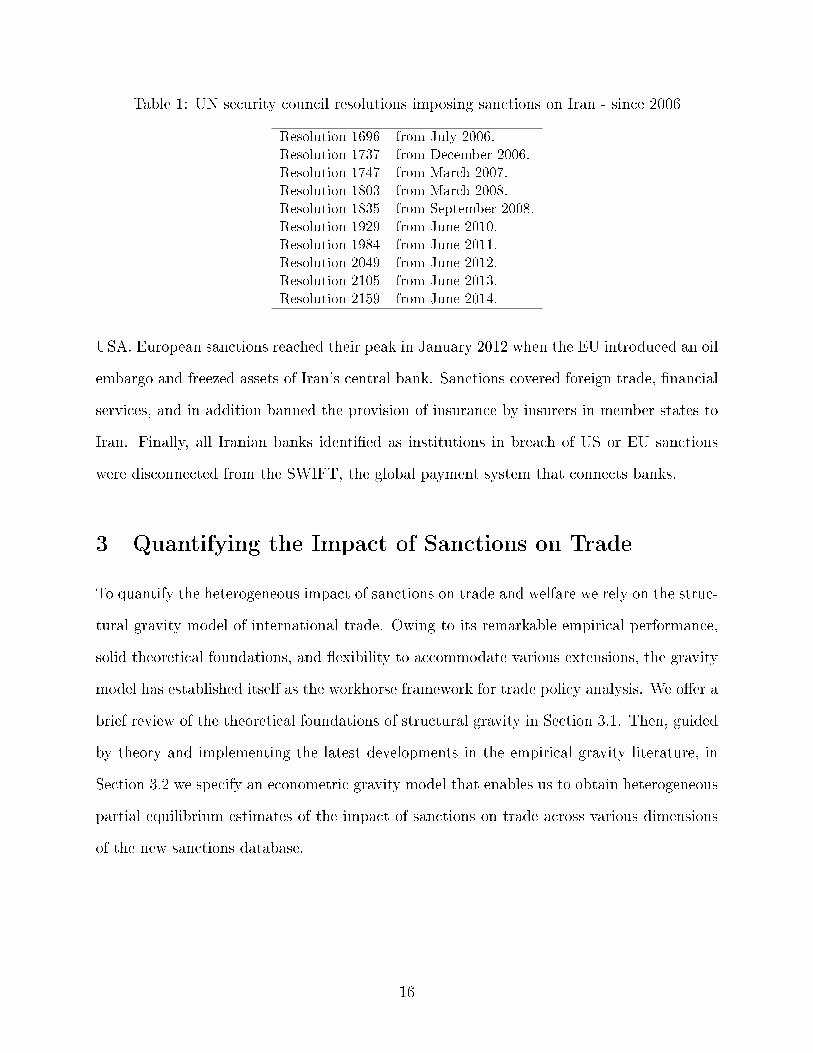
Table 1: UN security council resolutions imposing sanctions on Iran - since 2006
Resolution 1696 from July 2006.
Resolution 1737 from December 2006.
Resolution 1747 from March 2007.
Resolution 1803 from March 2008.
Resolution 1835 from September 2008.
Resolution 1929 from June 2010.
Resolution 1984 from June 2011.
Resolution 2049 from June 2012.
Resolution 2105 from June 2013.
Resolution 2159 from June 2014.
USA. European sanctions reached their peak in January 2012 when the EU introduced an oil
embargo and freezed assets of Iran's central bank. Sanctions covered foreign trade, �nancial
services, and in addition banned the provision of insurance by insurers in member states to
Iran. Finally, all Iranian banks identi�ed as institutions in breach of US or EU sanctions
were disconnected from the SWIFT, the global payment system that connects banks.
3 Quantifying the Impact of Sanctions on Trade
To quantify the heterogeneous impact of sanctions on trade and welfare we rely on the struc-
tural gravity model of international trade. Owing to its remarkable empirical performance,
solid theoretical foundations, and �exibility to accommodate various extensions, the gravity
model has established itself as the workhorse framework for trade policy analysis. We o�er a
brief review of the theoretical foundations of structural gravity in Section 3.1. Then, guided
by theory and implementing the latest developments in the empirical gravity literature, in
Section 3.2 we specify an econometric gravity model that enables us to obtain heterogeneous
partial equilibrium estimates of the impact of sanctions on trade across various dimensions
of the new sanctions database.
16
3.1 The Structural Gravity Model of Trade: A Brief Review
This section presents the Armington-CES version of the gravity model of international
trade,17 which is the foundation for our estimations as well as for the general equilibrium
analysis. Anderson (1979) is the �rst to derive a structural gravity model of trade under
the assumptions that goods are di�erentiated by place of origin (Armington, 1969) and that
consumer preferences are homothetic, identical across countries, and approximated by a
CES utility function. Anderson and van Wincoop (2003) re�ne and popularize the ideas of
Anderson (1979) by delivering the following structural gravity system of international trade:
Xij,t =Yi,tEj,tYt
(tij,t
Pj,tΠi,t
)1−σ
, (1)
Π1−σi,t =
∑j
(tij,tPj,t
)1−σEj,tYt
, (2)
P 1−σj,t =
∑i
(tij,tΠi,t
)1−σYi,tYt, (3)
pj,t =(Yj,t/Yt)
11−σ
γjΠj,t
. (4)
Here, at each point of time t, Xij,t denotes trade �ows from exporter i to destination j; Ej,t
is the total expenditure in importer j; Yi,t is the value of total production in exporter i; Yt
is the value of world output; tij,t denotes bilateral trade frictions between partners i and j;
σ > 1 is the elasticity of substitution among goods from di�erent countries. Equation (1)
17It is now well established that the same gravity system can be obtained from a series of alternative microfoundations (Arkolakis et al. (2012)). In addition to the original demand-side gravity model of Anderson(1979) and Anderson and van Wincoop (2003) that we review in this section, the same gravity system canbe derived on the supply side (i.e., as in Eaton and Kortum (2002)), as a sectoral model on the demandside (as in (Larch and Wanner (2017) and Anderson and Yotov (2016)), and as a sectoral model from thesupply side, following Costinot et al. (2012). Caliendo and Parro (2015) extend the gravity model of Eatonand Kortum (2002) to a sectoral model with intermediates. In Section 4.2, we rely on the Caliendo andParro (2015) version of the gravity model to perform the general equilibrium analysis. Finally, Dekle etal. (2007) and Dekle et al. (2008) derive a structural gravity system in changes, which is very convenientfor computational purposes. We will capitalize on that, in combination with the sectoral gravity modelwith intermediates of Caliendo and Parro (2015), in the counterfactual analysis where we use the system inchanges to obtain general equilibrium e�ects of sanctions. We refer the reader to Anderson (2011), Costinotand Rodríguez-Clare (2014), and Larch and Yotov (2016) for surveys of the theoretical gravity literature.
17

intuitively links bilateral exports to market size (the �rst term on the right-hand side) and
trade frictions (the second term on the right-hand side). The numerator of the trade cost term
includes bilateral trade frictions (tij,t), which we model explicitly below as a function of the
possible impact of sanctions among other variables that have been recognized as signi�cant
determinants of trade �ows in the existing literature. Pj,t and Πi,t de�ned in equations (2)-
(3) are the multilateral resistance terms (MRs, inward and outward, respectively), coined by
Anderson and van Wincoop (2003).
The MRs are consistent aggregates of bilateral trade costs for each country and are
interpreted as buyers' and sellers' incidence of the global system of trade costs respectively
(Anderson and Yotov, 2010). The multilateral resistances are a key vehicle that enables
us to translate the partial equilibrium estimates we obtain of the impact of sanctions on
bilateral trade among sanctioned and sanctioning countries into general equilibrium e�ects
on trade and welfare on all countries in the world. This is so because the MRs represent the
endogenous structural links between the changes in bilateral trade costs and their impact on
consumer prices, nominal income and real income at the country level.18
Finally, equation (4) captures the link between trade and national income (through the
multilateral resistances). Equation (4), where γj is the CES share parameter, is a restatement
of the market-clearing condition (Yi,t =∑
j Xij,t), which unveils an inverse relationship
between the outward multilateral resistance that captures the incidence of trade costs on
the producers in j and the factory-gate price in j. The intuition for this result, with an
application to sanctions, is that when a country is sanctioned, producers in this country will
su�er higher outward MRs, i.e., higher incidence of trade costs, which according to equation
(4), translates into lower factory-gate prices. Similarly, producers in the sanctioning countries
will also su�er increases in their outward MRs that lead to lower factory-gate prices. The
lower factory-gate prices translate into lower nominal income, which de�nes the value of
18For further analysis of the MRs and their importance in the structural gravity system, we refer the readerto Larch and Yotov (2016), who o�er a detailed discussion of the properties of the multilateral resistancesand highlight their practical uses and their relevance in general equilibrium analysis.
18

production in country j and, therefore, via equation (1), a�ects negatively bilateral trade
�ows not only between the sanctioned and sanctioning countries, but also between them and
any other country in the world. In Section 4.2, we will be able to quantify such general
equilibrium e�ects within the structural gravity framework in case of the sanction on Iran.
3.2 Structural Gravity and Sanctions: From Theory to Empirics
Guided by the theoretical foundations of the gravity model from the previous section and
capitalizing on the rich dimensionality of the new database on sanctions, we set an econo-
metric gravity model that corresponds to the structural gravity equation (1), and which will
enable us to obtain partial equilibrium estimates of the e�ects of sanctions on international
trade:19
Xij,t = exp[SANCTij,tα +GRAVij,tβ + µij + πi,t + χj,t] + εij,t. (5)
As noted earlier, Xij,t denotes nominal trade �ows from exporter i to importer j at time t.
Most important for our purposes, SANCTij,t is the vector of sanction variables that take
central stage in our analysis. In order to demonstrate the importance of properly capturing
the heterogeneous impact of sanctions on Iran's trade, in the estimation analysis we start
with a baseline of sanction variables and then gradually decompose them across the key
dimensions of interest to us. We motivate and describe each step of decomposing vector
SANCTij,t in detail in Section 4 below.20
The rest of the variables in equation (5) are standard in the gravity literature. The
vector GRAVij,t includes standard time-invariant gravity covariates such as the logarithm
of bilateral distance and indicator variables for colonial relationships, common language,
19We refer the reader to Baldwin and Taglioni (2006), Head and Mayer (2014), and Piermartini and Yotov(2016) for surveys of the empirical gravity literature.
20To obtain estimates of the partial impact of sanctions on trade, we implement the latest developmentsin the empirical gravity literature. Nonetheless, there are certain aspects of sanctions (e.g., their potentialmultilateral and extraterritorial impact), which require special attention in the interpretation of our results.We discuss these features and their implications for our �ndings when we present our estimates.
19

and common borders. In addition, we control for the presence of regional trade agreements
(RTAs) with a dummy variable (RTAij,t), which takes a value of one if there is an RTA
between countries i and j at time t, and it is equal to zero otherwise. πi,t denotes the
set of time-varying exporting-country dummies, which control for the outward multilateral
resistances of Anderson and van Wincoop (2003) as well as for any other observable and
unobservable exporter-speci�c factors that may in�uence bilateral trade. Similarly, χj,t en-
compasses the set of time-varying destination-country dummy variables that account for
the inward multilateral resistances as well as for any other observable and unobservable
importer-speci�c characteristics that may in�uence international trade.
Finally, µij denotes the set of country-pair �xed e�ects, which serve two main purposes.
First, the pair �xed e�ects are the most �exible and comprehensive measure of time-invariant
bilateral trade costs because they absorb any observable and unobservable time-invariant
bilateral determinants of trade costs. Second, as demonstrated by Baier and Bergstrand
(2007), the pair �xed e�ects absorb most of the linkages between the potentially endogenous
RTAs and the error term εij,t in order to control for potential endogeneity of RTAs. Similarly,
and more important for our analysis, the pair �xed e�ects mitigate endogeneity concerns with
respect to sanctions.21 In the robustness analysis we also add linear bilateral time trends.
Furthermore, to obtain our main results, we follow Baier et al. (2016) and employ directional
bilateral �xed e�ects. The bene�ts are: (i) the directional �xed e�ects allow and control for
the presence of asymmetric trade costs; and (ii) this treatment is consistent with the fact
that many of the sanctions in our database are directional.
We employ panel data to obtain the estimates for all speci�cations of equation (5) that we
present in this section. In addition to improving e�ciency, the panel data allow for the use
21Another factor that mitigates potential endogeneity concerns with respect to sanctions is that, by de�-nition, sanctions are usually imposed in response to actions/inactions that are speci�c to the target country.Therefore, the use of exporter-time and importer-time �xed e�ects in our econometric speci�cation com-pletely controls for any such target-speci�c linkages. The downside of the use of country-time �xed e�ectsis, of course, that they will also absorb any multilateral e�ects of sanctions. Therefore, our estimates of thebilateral impact of sanctions should be interpreted as lower bounds. We will return to this discussion in thenext section when we present our estimates.
20
of country-pair �xed e�ects and enable us to study the impact of deeper sanction provisions
within the same speci�cation. Finally, following the recommendations of Santos-Silva and
Tenreyro (2006), we rely on the Poisson Pseudo Maximum Likelihood (PPML) estimator
to obtain our main results. The bene�ts of using PPML are: (i) this estimator handles
successfully the heteroskedasticity in trade data which would otherwise lead to inconsistent
OLS estimates; and (ii) due to its multiplicative form, the PPML estimator enables us to
take advantage of the information contained in the zero trade �ows. In sensitivity analysis,
we demonstrate that our main �ndings are robust to the use of the standard OLS estimator.
4 On the Heterogeneous E�ects of the Sanctions on Iran
The analysis in this section quanti�es the impact of sanctions on Iran's trade. In Section
4.1, we obtain partial equilibrium estimates, which reveal widely heterogeneous e�ects across
countries. Then, in Section 4.2, we translate the partial estimates into general equilibrium
e�ects on trade, welfare, and sectoral value added within a multi-sector structural gravity
model with input-output linkages. Our GE estimates capture additional wide heterogeneity
in the impact of sanctions across countries and across sectors too.
4.1 Partial Equilibrium Estimates
This section presents the results from a series of speci�cations, which gradually zoom in to
quantify the partial equilibrium (direct) impact of sanctions on Iran's international trade
�ows. Our main results are presented in Table 2.22 As described in the previous section, the
estimates are obtained with the PPML estimator and directional exporter-time, importer-
time, and pair �xed e�ects. Due to the rich structure of �xed e�ects, we can only identify
the impact of time-varying bilateral covariates. Furthermore, due to size constraints, we only
22Three sets of sensitivity experiments, including PPML estimates with standard gravity variables insteadof pair �xed e�ects, OLS estimates with the full set of �xed e�ects, and PPML estimates with bilateral timetrends, which are available upon request, con�rm the robustness of our main �ndings.
21
report the estimates of sanctions and, in some cases, we employ graphical representation of
our �ndings.23
We start with a model, in column (1) of Table 2, which includes four sanction variables de-
signed to identify the impact of: (i) complete trade sanctions (TRADE_SANCT_COMPL);
(ii) partial trade sanctions (TRADE_SANCT_PARTL); (iii) all other (i.e., non-trade)
sanctions (OTHER_SANCT ); and (iv) the sanctions targeted speci�cally at Iran's trade
(SANCT_IRAN). In order to ease interpretation, all sanction variables are constructed so
that they are mutually exclusive. Thus, all estimates in column (1) should be interpreted in
levels rather than as deviations from each other.
Three �ndings stand out from column (1). First, we o�er evidence for the intuitive
argument that complete trade sanctions are more e�ective as compared to partial trade
sanctions. The estimate on TRADE_SANCT_COMPL suggests that, all else equal, trade
�ows between the sanctioning countries and their targets decreased by more than 77 percent
(exp(−1.480) − 1) × 100) when complete sanctions were imposed. This is strong evidence
in support of the e�ectiveness of sanctions in impeding international trade. Second, we do
not o�er evidence that non-trade sanctions (e.g., travel sanctions) have a direct impact on
trade. A possible explanation for the insigni�cant estimates on OTHER_SANCT is that
their e�ects are indirect and captured by the country-time �xed e�ects in the empirical
gravity model, along with other general equilibrium forces.24 Finally, the negative, large,
and statistically signi�cant estimate on SANCT_IRAN implies that, all else equal, the
sanctions decreased Iranian trade with the sanctioning countries by about 55 percent.
In column (2) of Table 2 we separate the indicator variable for the Iran sanctions into
two dummies, one for Iranian exports to the sanctioning countries (SANCT_IRAN_EXP )
23The complete sets of gravity estimates are available upon request.24For example, some countries have used `secondary sanctions' to go after a target's country global trans-
actions. In addition, some �nancial sanctions aim to prevent �nancial institutions from processing paymentsor to provide trade �nance regardless of the direction of trade. Similarly, in some cases insurers cannoto�er freight insurance. Such multilateral e�ects are absorbed by the sanctioning country �xed e�ects andpoint to the need for more careful modeling of the structural impact of non-trade sanctions on internationaltrade. The implication for our estimates is that, by capturing only the impact of bilateral trade sanctionson international trade, they represent a lower bound for the possible impact of sanctions on trade.
22

Table 2: Estimates of the E�ects of Sanctions on Iran
(1) (2) (3) (4)ALL COMPL IRAN EXPIMP
TRADE_SANCT_COMPL -1.480 -1.480 -1.632 -1.632(0.335)∗∗ (0.335)∗∗ (0.351)∗∗ (0.351)∗∗
TRADE_SANCT_PARTL -0.054 -0.054 -0.056 -0.056(0.072) (0.072) (0.072) (0.072)
OTHER_SANCT 0.073 0.073 0.074 0.074(0.045) (0.045) (0.045)+ (0.045)+
SANCT_IRAN -0.808(0.243)∗∗
SANCT_IRAN_EXP -0.895 -0.602 -0.609(0.367)∗ (0.372) (0.368)+
SANCT_IRAN_IMP -0.773 -0.635 -0.638(0.295)∗∗ (0.256)∗ (0.257)∗
SANCT_IRN_USA -4.853 -4.855(0.358)∗∗ (0.353)∗∗
SANCT_USA_IRN -2.258 -2.262(0.198)∗∗ (0.200)∗∗
SANCT_IRN_CAN -3.775 -3.778(0.352)∗∗ (0.347)∗∗
SANCT_CAN_IRN -2.043 -2.045(0.209)∗∗ (0.210)∗∗
SANCT_IRN_AUS -2.008 -2.015(0.355)∗∗ (0.350)∗∗
SANCT_AUS_IRN -2.126 -2.128(0.231)∗∗ (0.233)∗∗
SANCT_IRN_CHE -2.786 -2.804(0.352)∗∗ (0.348)∗∗
SANCT_CHE_IRN -0.958 -0.968(0.208)∗∗ (0.210)∗∗
SANCT_IRN_CHN -0.057 -0.074(0.349) (0.344)
SANCT_CHN_IRN 0.203 0.192(0.223) (0.225)
SANCT_IRN_TUR -0.163 -0.170(0.347) (0.342)
SANCT_TUR_IRN -0.522 -0.532(0.215)∗ (0.217)∗
SANCT_IRN_BRA -4.624 -4.635(0.348)∗∗ (0.343)∗∗
SANCT_BRA_IRN -0.933 -0.933(0.213)∗∗ (0.214)∗∗
SANCT_IRN_ARE -1.437 -1.449(0.354)∗∗ (0.349)∗∗
SANCT_ARE_IRN 0.643 0.632(0.222)∗∗ (0.223)∗∗
SANCT_IRN_RUS -0.830 -0.840(0.358)∗ (0.353)∗
SANCT_RUS_IRN -1.433 -1.438(0.225)∗∗ (0.227)∗∗
SANCT_IRN_IND -0.305 -0.320(0.353) (0.348)
SANCT_IND_IRN -0.502 -0.510(0.207)∗ (0.209)∗
SANCT_IRN_ZAF -1.484 -1.488(0.361)∗∗ (0.356)∗∗
SANCT_ZAF_IRN -1.395 -1.399(0.234)∗∗ (0.237)∗∗
SANCT_IRN_JPN -0.627 -0.629(0.352)+ (0.347)+
SANCT_JPN_IRN -1.724 -1.717(0.202)∗∗ (0.204)∗∗
SANCT_IRN_SGP -1.748 -1.753(0.350)∗∗ (0.345)∗∗
SANCT_SGP_IRN -0.718 -0.717(0.226)∗∗ (0.228)∗∗
SANCT_IRN_EU -1.366 -1.073(0.390)∗∗ (0.382)∗∗
SANCT_EU_IRN -1.386 -0.983(0.211)∗∗ (0.221)∗∗
SANCT_IRN_EU_2011 -1.579(0.264)∗∗
SANCT_EU_IRN_2011 -1.020(0.156)∗∗
N 1268450 1268450 1268450 1268450
Notes: This table reports estimates of the heterogeneous e�ects of trade sanctions onIran. The dependent variable is trade in levels. All estimates are obtained with thePPML estimator and exporter-time, importer-time and directional country-pair �xede�ects. In addition, we control for the presence of RTAs, trade sanctions on exportsand imports, complete trade sanctions, and all other sanctions. Column (1) obtains asingle average estimate of the e�ects of the sanctions on Iran. Column (2) decomposesthe impact of of the Iranian sanctions on the exports vs. imports of Iran. Column (3)further allows for di�erential e�ects across country pairs and in each direction of trade�ows. Finally, column (4) captures the impact of the stricter EU sanctions on Iran
post 2011. Standard errors are clustered by country pair. + p < 0.10, ∗ p < .05, ∗∗
p < .01. See text for further details.
23
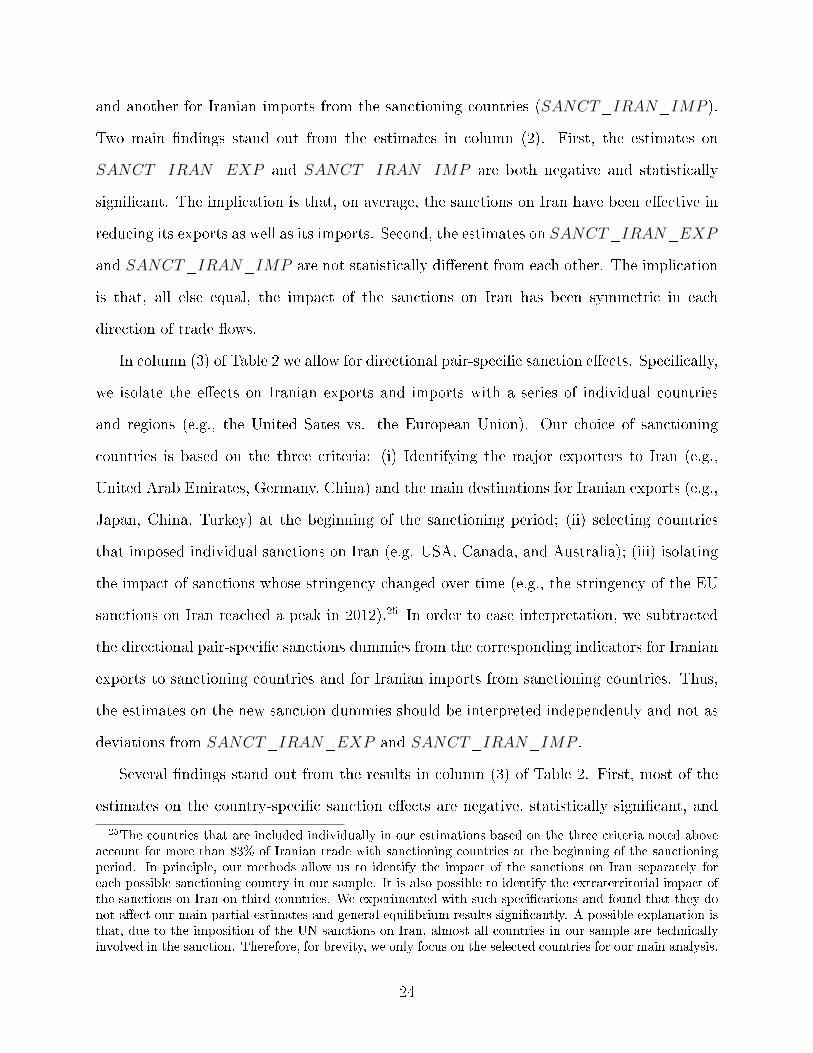
and another for Iranian imports from the sanctioning countries (SANCT_IRAN_IMP ).
Two main �ndings stand out from the estimates in column (2). First, the estimates on
SANCT_IRAN_EXP and SANCT_IRAN_IMP are both negative and statistically
signi�cant. The implication is that, on average, the sanctions on Iran have been e�ective in
reducing its exports as well as its imports. Second, the estimates on SANCT_IRAN_EXP
and SANCT_IRAN_IMP are not statistically di�erent from each other. The implication
is that, all else equal, the impact of the sanctions on Iran has been symmetric in each
direction of trade �ows.
In column (3) of Table 2 we allow for directional pair-speci�c sanction e�ects. Speci�cally,
we isolate the e�ects on Iranian exports and imports with a series of individual countries
and regions (e.g., the United Sates vs. the European Union). Our choice of sanctioning
countries is based on the three criteria: (i) Identifying the major exporters to Iran (e.g.,
United Arab Emirates, Germany, China) and the main destinations for Iranian exports (e.g.,
Japan, China, Turkey) at the beginning of the sanctioning period; (ii) selecting countries
that imposed individual sanctions on Iran (e.g. USA, Canada, and Australia); (iii) isolating
the impact of sanctions whose stringency changed over time (e.g., the stringency of the EU
sanctions on Iran reached a peak in 2012).25 In order to ease interpretation, we subtracted
the directional pair-speci�c sanctions dummies from the corresponding indicators for Iranian
exports to sanctioning countries and for Iranian imports from sanctioning countries. Thus,
the estimates on the new sanction dummies should be interpreted independently and not as
deviations from SANCT_IRAN_EXP and SANCT_IRAN_IMP .
Several �ndings stand out from the results in column (3) of Table 2. First, most of the
estimates on the country-speci�c sanction e�ects are negative, statistically signi�cant, and
25The countries that are included individually in our estimations based on the three criteria noted aboveaccount for more than 83% of Iranian trade with sanctioning countries at the beginning of the sanctioningperiod. In principle, our methods allow us to identify the impact of the sanctions on Iran separately foreach possible sanctioning country in our sample. It is also possible to identify the extraterritorial impact ofthe sanctions on Iran on third countries. We experimented with such speci�cations and found that they donot a�ect our main partial estimates and general equilibrium results signi�cantly. A possible explanation isthat, due to the imposition of the UN sanctions on Iran, almost all countries in our sample are technicallyinvolved in the sanction. Therefore, for brevity, we only focus on the selected countries for our main analysis.
24

large in terms of magnitude. Twenty six of the twenty eight individual sanction estimates are
negative and twenty three of them are statistically signi�cant. Second, the negative e�ects of
the sanctions on Iran are widely heterogeneous across countries. The estimates on the trade
sanctions of US and Canada are among the largest. A possible explanation for this �nding is
that these countries imposed individual sanctions on Iran. Third, we also observe signi�cant
heterogeneity and asymmetries between the impact of the sanctions on exports vs. imports
within country pairs. In most cases, our estimates of the sanction e�ect on Iranian exports
are larger (e.g., for exports to US and to Switzerland), but in some cases the impact of the
sanction on Iranian imports is larger (e.g., for imports from Russia and from Japan).
We also note that some of the estimates in column (3) are insigni�cant and/or positive,
e.g., the results for Iran's trade with China, Turkey, and India. The estimates on the
directional e�ects on the sanctions on trade between China and Iran are not statistically
signi�cant, while only the impact of the sanction on Turkey's and India's exports to Iran is
signi�cant, and marginally so. The explanation for the insigni�cant estimates of the impact
of the sanction on Iran for trade with China and Turkey is that these countries were given
a sanction waiver. The single positive and signi�cant estimate we obtain is on exports from
the United Arab Emirates to Iran, suggesting the presence of `trade creation' e�ects.
The estimates from column (4) of Table 2 allow for additional (presumably stronger)
e�ects of the sanctions on the European Union on Iran. The motivation for this speci-
�cation is that the EU sanctions reached a peak in 2012 with the imposition of a series
of new provisions and additional sanctions on Iran. To capture these e�ects we intro-
duce two new indicator variables for the EU sanctions on Iranian exports to EU post 2011
(SANCT_IRN_EU_2012) and for the EU sanctions on Iranian imports from EU post
2011 (SANCT_EU_IRN_2012). Since the new variables are not subtracted from the
original dummies for the EU sanctions, the estimates on SANCT_IRN_EU_2012 and
SANCT_EU_IRN_2012 should be interpreted as deviations from SANCT_EU_IRN
and SANCT_IRN_EU . Consistent with our expectations, the estimates from column (4)
25
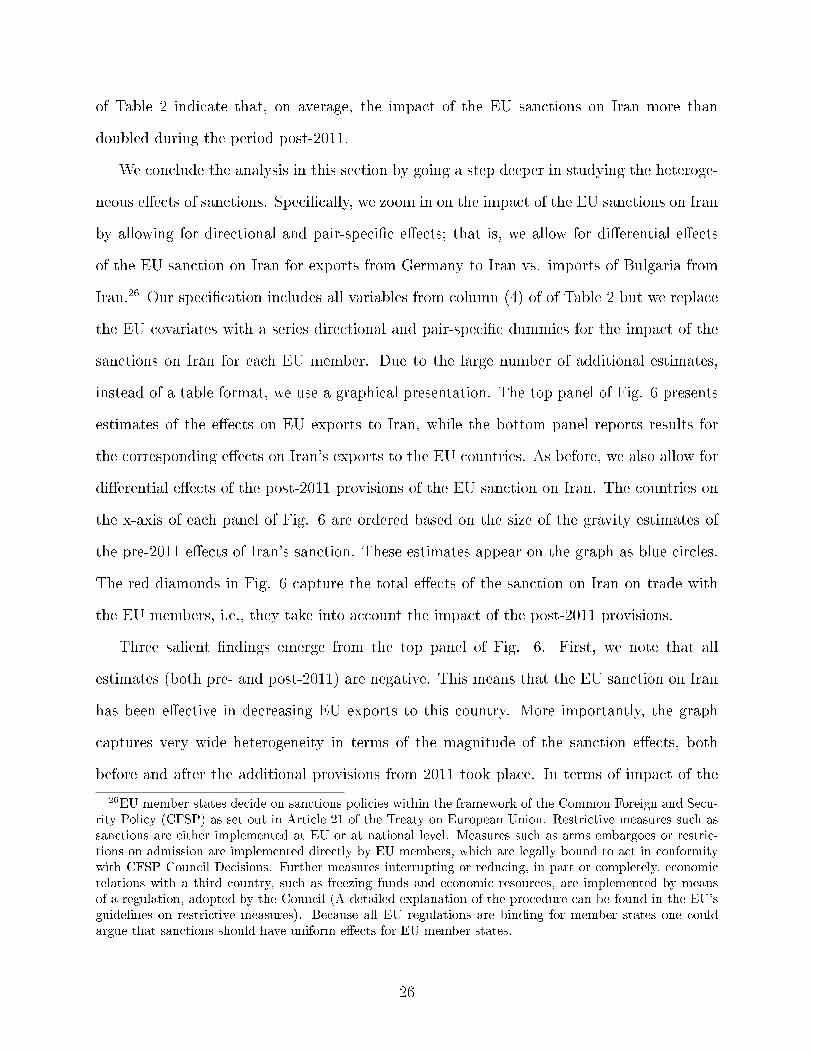
of Table 2 indicate that, on average, the impact of the EU sanctions on Iran more than
doubled during the period post-2011.
We conclude the analysis in this section by going a step deeper in studying the heteroge-
neous e�ects of sanctions. Speci�cally, we zoom in on the impact of the EU sanctions on Iran
by allowing for directional and pair-speci�c e�ects; that is, we allow for di�erential e�ects
of the EU sanction on Iran for exports from Germany to Iran vs. imports of Bulgaria from
Iran.26 Our speci�cation includes all variables from column (4) of of Table 2 but we replace
the EU covariates with a series directional and pair-speci�c dummies for the impact of the
sanctions on Iran for each EU member. Due to the large number of additional estimates,
instead of a table format, we use a graphical presentation. The top panel of Fig. 6 presents
estimates of the e�ects on EU exports to Iran, while the bottom panel reports results for
the corresponding e�ects on Iran's exports to the EU countries. As before, we also allow for
di�erential e�ects of the post-2011 provisions of the EU sanction on Iran. The countries on
the x-axis of each panel of Fig. 6 are ordered based on the size of the gravity estimates of
the pre-2011 e�ects of Iran's sanction. These estimates appear on the graph as blue circles.
The red diamonds in Fig. 6 capture the total e�ects of the sanction on Iran on trade with
the EU members, i.e., they take into account the impact of the post-2011 provisions.
Three salient �ndings emerge from the top panel of Fig. 6. First, we note that all
estimates (both pre- and post-2011) are negative. This means that the EU sanction on Iran
has been e�ective in decreasing EU exports to this country. More importantly, the graph
captures very wide heterogeneity in terms of the magnitude of the sanction e�ects, both
before and after the additional provisions from 2011 took place. In terms of impact of the
26EU member states decide on sanctions policies within the framework of the Common Foreign and Secu-rity Policy (CFSP) as set out in Article 21 of the Treaty on European Union. Restrictive measures such assanctions are either implemented at EU or at national level. Measures such as arms embargoes or restric-tions on admission are implemented directly by EU members, which are legally bound to act in conformitywith CFSP Council Decisions. Further measures interrupting or reducing, in part or completely, economicrelations with a third country, such as freezing funds and economic resources, are implemented by meansof a regulation, adopted by the Council (A detailed explanation of the procedure can be found in the EU'sguidelines on restrictive measures). Because all EU regulations are binding for member states one couldargue that sanctions should have uniform e�ects for EU member states.
26

Figure 6: On the Heterogeneous Impact of the EU sanctions on Iran
Note: These �gures presents estimates of the impact of the sanction on Iran's trade with the countries from the EuropeanUnion. The top panel reports estimates of the e�ects on EU exports to Iran, while the bottom panel includes results for thecorresponding e�ects on Iran's exports to the EU countries. We allow for di�erential e�ects of the post-2011 provisions of theEU sanction on Iran. The countries on the x-axis of each panel are ordered based on the size of the gravity estimates of thepre-2011 e�ects of Iran's sanction on the exports of Iran to each of the EU members. These estimates appear on the graph asblue circles. The red diamonds capture the total e�ects of the sanction on Iran on trade with the EU members.
27

pre-2011 sanctions, we �nd that countries from Eastern and Central Europe (e.g., Hungary,
Poland, Bulgaria) were a�ected the most, while France, Croatia and Cyprus are on the
other side of the spectrum. In terms of additional, post-2011, e�ects, we see small impact
for some countries, especially those that experienced strong pre-2011 e�ects, e.g. Hungary
and Bulgaria, and very large e�ects for other EU members, e.g. UK and Cyprus. The total
e�ects of the sanction on EU exports to Iran are very large and very heterogenous, ranging
between 77.6 percent (for Cyprus) and 98.5 percent (for Great Britain).
The bottom panel of Fig. 6 reports results for the impact of the sanction on Iran's
exports to the EU countries. Our estimates reveal that the sanction has been e�ective in
limiting Iran's exports to the EU. All of the estimates of the total e�ects of the sanction
are negative and statistically signi�cant. In addition, all but one of the estimates of the
pre-2011 e�ects of the sanction are also negative. The exception is Greece, whose estimate
is positive but not statistically signi�cant. Once again, we see wide heterogeneity in the
estimates on Iran's exports to the EU countries, which, in terms of volume e�ects, range
from completely eliminating trade, e.g., a decrease of 99.8 percent in the case of Finland, to a
signi�cantly smaller but still sizable decrease of 57.9 percent in the case of Greece. Finally, a
comparison between the estimates in the two panels of Fig. 6 reveals that, while the impact
of the sanction on Iran's trade in each direction is similar for some countries, e.g., Hungary
and Poland, it is very asymmetric for others, e.g., Greece, where we see a big e�ect on the
country's exports to Iran but no impact on its imports from Iran.
We draw six main conclusions on the basis of our analysis in this section. First, our results
demonstrate that the impact of sanctions is quite heterogeneous across sanctions (e.g., the
sanction on Iran vs. all other trade sanctions). Second, we �nd that the e�ects of sanctions
vary signi�cantly across country-pairs within sanctions (e.g., USA-Iran vs. China-Iran).
Third, our estimates reveal that the impact of sanctions also vary within pairs depending
on the direction of trade �ows (e.g., Greece-Iran vs. Iran-Greece). Fourth, we �nd that
the additional provisions in the EU sanctions on Iran have been very e�ective on average.
28

However, �fth, we also document very heterogeneous e�ects of sanctions even within the
European Union. Finally, we also obtain some estimates that are not statistically signi�cant
(e.g., Turkey-Iran and China-Iran), re�ecting sanctions waivers, and even some positive
estimates (e.g., United Arab Emirates-Iran), re�ecting trade creation e�ects.
4.2 General Equilibrium E�ects on Trade and Welfare
We conclude by quantifying the general equilibrium e�ects of the sanctions on Iran on trade,
real GDP, and sectoral value added. To this end, we rely on the gravity framework of Aichele
and Heiland (2016), who calibrate a multi-sector version of the gravity model presented in
Section 3.1, which, following Caliendo and Parro (2015), also includes intermediate linkages
for 130 countries and 57 sectors using the GTAP data.27 The baseline year for the analysis
is 2014 and the counterfactual experiment employs our pair-and-direction-speci�c estimates
from the previous section to simulate a hypothetical world in the absence of the sanctions on
Iran. Since our empirical estimates relate only to the goods market and do not vary across
sectors, in the counterfactual simulations, we assume a uniform shock on trade costs for all
goods sectors and a uniform trade elasticity of 3.5 (the average value across sectors from
Aichele and Heiland (2016). The sectoral trade cost shocks relate the counterfactual level of
iceberg trade costs τ′i,j to their baseline levels τi,j such that τ̂i,j ≡ τ
′i,j/τi,j.
28
First we describe the e�ects on bilateral trade. The estimates in Table 5 are constructed
as the ratio of counterfactual to baseline expenditure shares π̂i,j ≡ π′i,j/πi,j.
For brevity and clarity of exposition, we focus on four countries: Iran, Germany, USA
and China. For i = j = {IRN}, πIRN,IRN = 63.8 and π′IRN,IRN = 68.1, implying π̂IRN,IRN =
27The model assumes perfect competition. Trade is Ricardian in the sense that countries purchase onlythe cheapest available variety of each good. A key feature of the model is the intersectoral linkages, bothintra- and internationally. Production requires labor and a composite of inputs drawn from other sectors.Wages are equalized across sectors so that sectoral variation results only from reallocation e�ects. While thevalues of imports and exports need not coincide at the country level, the trade balance normalized by GDPis assumed constant. See Aichele and Heiland (2016) and Caliendo and Parro (2015) for additional details.
28For the pairs involving Iran, the average trade cost shock is 0.84; that is, in the counterfactual, tradecosts are 16 percent lower than in the baseline. The median is 0.79, the minimum of 0.24 is for US importsfrom Iran; the maximum of 1.22 is for Iranian imports from the United Arab Emirates.
29

Table 3: Counterfactual Analysis: Trade E�ects (% of Baseline)
Exporter Importer π′ π π′/πIRN CHN 0.16 0.38 0.42IRN DEU 0.19 0.01 26.89IRN USA 0.06 0.00 165.71IRN IRN 63.84 68.05 0.94
DEU CHN 0.21 0.21 1.00DEU IRN 0.71 0.08 8.64DEU USA 0.28 0.28 1.00DEU DEU 50.41 50.51 1.00
USA CHN 1.03 1.03 1.00USA DEU 1.54 1.56 0.99USA IRN 0.81 0.03 28.75USA USA 67.57 67.73 1.00
CHN DEU 1.94 1.94 1.00CHN IRN 3.61 4.79 0.75CHN USA 2.29 2.29 1.00CHN CHN 72.51 72.45 1.00
Notes: This table reports the results of coun-terfactual simulations. π′/π relates counter-factual (no sanctions) to baseline (sanctions)equilibrium.
30

0.94, which means that undoing the sanctions makes the country substantially more open to
international trade. The share of German expenditure that falls on Iranian goods would go
up from 0.01 to 0.19 percent, so that π̂ = 27, whereas the share of US expenditure falling
on Iranian goods would increase from virtually zero to 0.06 percent, an increase by a factor
of 176. These trade changes are dramatic, but the new levels of trade are still very low.
Similarly, Iran's expenditure on German and US products goes up as well, by a factor of
9 and by a factor of 29, respectively. The share of Iran's spending on Chinese goods goes
down from 4.8 to 3.6 percent, re�ecting the reduction in trade diversion due to sanctions.
This loss of trade is even more pronounced for Chinese spending on Iranian goods, where
the expenditure share falls from 0.38 to 0.16 percent. For country pairs not directly a�ected
by sanctions, such as USA-Germany or Germany-China, expenditure shares do not change
signi�cantly.
Next, we turn to the e�ects of undoing sanctions on real income, our welfare measure.
The results are visualized in Fig. 7. The biggest winner of terminating sanctions, not
surprisingly, is Iran. It's real per capita income is predicted to rise by about 4.2 percent.
This might seem small; but the overall gains from trade in this quantitative model are
usually estimated to be rather small; see Costinot and Rodriguez-Clare (2015). So, it may
not be overly surprising that the termination of sanctions does not imply higher gains for
Iran. Also note that services sectors are a�ected only indirectly, as demand for their output
in manufacturing sectors may fall. Moreover, the sanctions have led to considerable trade
diversion, especially to China, so that Iran's overall openness has not been reduced by much
either. The country with the next largest welfare gain from the removal of the sanctions on
Iran is Armenia, a neighboring country to Iran. This is intuitive, since Armenia has di�cult
political and economic relations with its other neighbors such as Azerbaijan and Turkey. So,
it relies overproportionately on trade with Iran, and lower income in Iran worsens Armenia's
terms of trade.
Amongst the 15 countries most positively a�ected form the removal of the Iran sanction,
31

Figure 7: Counterfactual Analysis: Welfare E�ects (% of baseline)
00,51
1,52
2,53
3,54
4,5
IRN
00,050,10,150,20,250,30,350,40,45
ARM
MDA
MLT
LKA
MNG
MWI
KGZ
GEO
KEN ZAF
CYP
KHM
OMN
GRC
Top 15 winners from undoing sanctions
Note: Percent changes in real per capita income resulting from an end of sanctions against Iran. Only countries with largeste�ects are shown: Iran (IRN), Armenia (ARM), Moldova (MDA), Malta (MLT), Sri Lanka (LKA), Mongolia (MNG), Malawi(MWI), Kyrgizstan (KGZ), Georgia (GEO), Kenia (KEN), South Africa (ZAF), Cyprus (CYP), Cambodia (KHM), Oman(OMN), Greece (GRC).
are small nations such as Malta, Cyprus and Greece, which provide shipping services to Iran's
oil industry, and other geographically close countries such as Georgia or the centralasian
countries Mongolia and Kyrgyzstan. Gains for third countries are typically small: they lie
between about 0.4 percent for Armenia and 0.07 percent for Greece. The Western initiators
of the sanctions against Iran and the UN Security Council members, such as the USA,
France, and Great Britain, are barely a�ected; gains from undoing the sanctions lie below
0.03 percent of GDP; the UK is even predicted to lose a tiny amount. In contrast, the
normalization of trade relationships between these countries and Iran hurts those who have
bene�tted from trade diversion. The largest losses are predicted to occur in Korea, Panama
and the Ukraine. Oil producing countries also tend to lose from undoing the sanctions as
the additional supply of Iranian oil drives down the world price of oil.
Finally, we turn to the e�ects on sectoral value added, which appear in Fig. 8. Even
though, by design, the trade cost shocks are uniform across sectors, the sectoral structure of
comparative advantage of Iran and its trading partners implies a rich pattern of changes in
their terms of trade which, in turn, a�ect sectoral value added. Not surprisingly, the model
32

Figure 8: Counterfactual Analysis: Sectoral Value Added E�ects (% of baseline)
-1
-0.75
-0.5
-0.25
0
0.25
0.5
0.75
1
-40
-30
-20
-10
0
10
20
30
40Ga
sPe
trol
eum
, coa
l pro
duct
sGa
s man
ufac
ture
, dis
trib
utio
nLe
athe
r pro
duct
sTr
ansp
ort e
quip
men
t nec
Text
iles
Woo
l, si
lk-w
orm
coc
oons
Crop
s nec
Air t
rans
port
Insu
ranc
eM
etal
s nec
Vege
tabl
es, f
ruit,
nut
sEl
ectr
onic
equ
ipm
ent
Fish
ing
Min
eral
pro
duct
s nec
Tran
spor
t nec
Man
ufac
ture
s nec
Wea
ring
appa
rel
Dwel
lings
Dairy
pro
duct
sRa
w m
ilkCo
nstr
uctio
nPa
ddy
rice
Plan
t-ba
sed
fiber
sPu
bAdm
in/D
efen
ce/H
ealth
/Edu
catio
nTr
ade
Coal
Anim
al p
rodu
cts n
ecFo
od p
rodu
cts n
ecBe
vera
ges a
nd to
bacc
o pr
oduc
tsW
ater
Busi
ness
serv
ices
nec
Whe
atEl
ectr
icity
Com
mun
icat
ion
Fina
ncia
l ser
vice
s nec
Sea
tran
spor
tM
etal
pro
duct
sM
eat p
rodu
cts n
ecFo
rest
ryCh
emic
al, r
ubbe
r, pl
astic
pro
dsCe
real
gra
ins n
ecM
otor
veh
icle
s and
par
tsRe
crea
tion
and
othe
r ser
vice
sM
iner
als n
ecO
il se
eds
Woo
d pr
oduc
tsCa
ttle
, she
ep, g
oats
, hor
ses
Mea
t: ca
ttle
, she
ep, g
oats
, hor
ses
Mac
hine
ry a
nd e
quip
men
t nec
Ferr
ous m
etal
sPa
per p
rodu
cts,
pub
lishi
ngSu
gar c
ane,
suga
r bee
tPr
oces
sed
rice
Suga
rVe
geta
ble
oils
and
fats
IRN CHN DEU
Note: Percent changes in sectoral value added resulting from an end of sanctions against Iran in Iran (IRN), China (CHN), andGermany (DEU).
predicts that an end to the sanctions would bene�t Iran's oil and gas sectors most strongly.
Value added would rise most in this area, reaching almost 40 percent in the gas sector, where
substitution e�ects in the face of sanctions are di�cult due to a rigid system of pipelines.
Sizable gains also occur in Iran's leather, textile, and transportation sectors. In the former
two, the country enjoys a comparative advantage relative to its trade partners; in the latter,
the e�ects are driven by additional demand for transportation services as trade picks up.
Some positive e�ects are predicted in agri-food, in particular in nuts production. Iran is an
important producer of almonds. But those gains lie below 10 percent.
In contrast, losses are concentrated in comparative disadvantage sectors. Again, the
impact on agri-food looms large. Arid Iran is a net importer of vegetables, sugar and
rice, so that ending the sanctions drives up imports even more in these sectors leading to
their shrinkage. For many services sectors, which are not directly a�ected by sanctions as
modeled in our exercise, value added e�ects are very close to zero. The transportation sector
mentioned above is an interesting exception. Sectoral value-added e�ects are smaller by
almost two orders of magnitude in the US, China or Germany. They do not exhibit any
clear sectoral pattern, but they tend to be positive for Germany and negative for China,
33

re�ecting trade creation and trade diversion, respectively.
5 Conclusion
Through their imposition of various restrictions on trade, �nancial transactions and travel,
sanctioning countries aim to induce sanctioned countries to comply with policy requests by
raising the economic costs of noncompliance. According to this logic, the e�ectiveness of
sanctions policies crucially depends on the strength of their adverse e�ects on sanctioned
countries.
This study illustrates that sanctions policies can be e�ective in the sense that they sig-
ni�cantly reduce trade with the target. Importantly, we also show that impact of trade
sanctions turns out to be heterogeneous depending on whether they are complete or par-
tial and also depending on whether they are imposed on the exports or on the imports of
the target country. The speci�c sanctions on Iran we have analyzed, illustrate that their
direct/partial equilibrium e�ects on bilateral trade di�er signi�cantly across countries and
depending on the direction of trade, even within the European Union. We complemented
the partial sanction estimates with general equilibrium analysis, which showed that the im-
pact of the Iran sanction on trade and welfare was widely but intuitively heterogeneous both
across countries and across sectors.
Our analysis illustrates that Germany has su�ered the biggest export losses to Iran since
the introduction of the restrictive Iran sanctions in 2006. In particular, the cooperative ban
on trade in oil resulted in a strong drop in bilateral trade with Iran. At the same time trade
losses for the US turn out to be signi�cantly lower in absolute terms. These di�erences in
economic relations between important powers like EU countries and US have implications for
the policy objectives standing behind the sanctions policies. Given these di�ering economic
interests between various countries, it is no surprise that the assessment of whether the Iran
sanctions have been successful or not, also di�ers. While the EU considers the Iran deal
34

that followed the sanctions as a major success, the US administration has started to increase
pressure on Iran to renegotiate the conditions for removing the sanctions. In light of the
extensive heterogeneity in economic interests, it is not obvious how countries can resolve
their di�erences.
35

References
Afesorgbor, S., �The Impact of Economic Sanctions on International Trade: How DoThreatened Sanctions Compare with Imposed Sanctions?,� European Journal of PoliticalEconomy, 06 2018.
Ahn, P. Daniel and Rodney D. Ludema, �The Sword and the Shield: The Economicsof Targeted Sanctions,� Manuscript, 2018.
Aichele, Rahel and Inga Heiland, �Where is the Value Added? Trade Liberalization andProduction Networks,� CESifo Working Paper No. 6026, 2016.
Anderson, James E., �A Theoretical Foundation for the Gravity Equation,� AmericanEconomic Review, 1979, 69 (1), 106�116.
, �The Gravity Model,� Annual Review of Economics, 2011, 3, 133�160.
and Eric van Wincoop, �Gravity with Gravitas: A Solution to the Border Puzzle,�American Economic Review, 2003, 93 (1), 170�192.
and Yoto V. Yotov, �The Changing Incidence of Geography,� American EconomicReview, 2010, 100 (5), 2157�2186.
and Yoto V. Yotov, �Terms of Trade and Global E�ciency E�ects of Free TradeAgreements, 1990-2002,� Journal of International Economics, 2016, 99, 279�298.
Arkolakis, Costas, Arnaud Costinot, and Andrés Rodríguez-Clare, �New TradeModels, Same Old Gains?,� American Economic Review, 2012, 102 (1), 94�130.
Armington, Paul S., �A Theory of Demand for Products Distinguished by Place of Pro-duction,� IMF Sta� Papers, 1969, 16, 159�176.
Baldwin, D.A., �Economic Statecraft,� Princeton University Press, Princeton, 1985.
, �The Sanctions Debate and the Logic of Choice,� International Security, 1999, 24(3),80�107.
Baldwin, Richard E. and Daria Taglioni, �Gravity for Dummies and Dummies forGravity Equations,� NBER Working Paper No. 12516, 2006.
Besedes, Tibor, Stefan Goldbach, and Volker Nitsch, �Cheap Talk? Financial Sanc-tions and Non-Financial Activity,� Manuscript, 2018.
Caliendo, Lorenzo and Fernando Parro, �Estimates of the Trade and Welfare E�ectsof NAFTA,� Review of Economic Studies, 2015, 82 (1), 1�44.
Caruso, R., �The Impact of International Economic Sanctions on Trade - An empiricalAnalysis,� University Library of Munich, Germany, 2003.
36

Costinot, Arnaud and Andrés Rodríguez-Clare, �Trade Theory with Numbers: Quan-tifying the Consequences of Globalization,� Chapter 4 in the Handbook of InternationalEconomics Vol. 4, eds. Gita Gopinath, Elhanan Helpman, and Kenneth S. Rogo�, ElsevierLtd., Oxford, 2014, pp. 197�261.
, Dave Donaldson, and Ivana Komunjer, �What Goods Do Countries Trade? AQuantitative Exploration of Ricardo's Ideas,� Review of Economic Studies, 2012, 79 (2),581�608.
Crozet, M. and J. Hinz, �Friendly �re - the trade impact of the Russia sanctions andcounter-sanctions,� Kiel Institute for the World Economy (IfW), 2017.
Dekle, Robert, Jonathan Eaton, and Samuel Kortum, �Unbalanced Trade,� AmericanEconomic Review: Papers and Proceedings, 2007, 97 (2), 351�355.
, , and , �Global Rebalancing with Gravity: Measuring the Burden of Adjustment,�IMF Sta� Papers, June 2008, 55 (3), 511�540.
Draca, M., J. Garred, N.Warrinnier, and L. Stickland, �On Target? The Incidenceof Sanctions Across Listed Firms in Iran,� University of Warwick Working Paper, 2017.
Drezner, D.W., �The Sanctions Paradox: Economic Statecraft and International Rela-tions,� Cambridge University Press, 1999.
Eaton, J. and M. Engers, �Sanctions,� Journal of Political Economy, 1992, 100(5), 899�928.
and , �Sanctions: Some Simple Analytics,� American Economic Review, 1999, 89(2),404�414.
Eaton, Jonathan and Samuel Kortum, �Technology, Geography and Trade,� Economet-rica, 2002, 70 (5), 1741�1779.
Felbermayr, G., Aleksandra Kirilakha, C. Syropoulos, E. Yalcin, and Y.V. Yotov,�The Global Sanctions Data Base,� School of Economics Working Paper Series 2020-2,LeBow College of Business, Drexel University., 2020.
Findlay, R. and K.H. O'Rourke, �Power and Plenty: Trade, War, and the World Econ-omy in the Second Millennium,� Princeton University, 2009.
Haidar, J., �Sanctions and Export De�ection: Evidence from Iran,� Economic Policy, 2017,32(90).
Head, Keith and Thierry Mayer, �Gravity Equations: Workhorse, Toolkit, and Cook-book,� Chapter 3 in the Handbook of International Economics Vol. 4, eds. Gita Gopinath,Elhanan Helpman, and Kenneth S. Rogo�, Elsevier Ltd., Oxford, 2014, pp. 131�195.
Hufbauer, G. and B. Oegg, �The Impact of Economic Sanctions on US trade: AndrewRose's Gravity Model,� Peterson Institute for International Economics, 2003.
37

Hufbauer, G. C., J. J. Schott, K. A. Elliott, and B. Oegg, �Economic SanctionsReconsidered,� (3rd edition). Washington, DC: Peterson Institute for International Eco-nomics., 2007.
Kaempfer, W.H. and A.D. Lowenberg, �The Political Economy of Economic Sanctions,�Handbook of Defense Economics, edited by T. Sandler and K. Hartley, 2007, 2.
Larch, Mario and Joschka Wanner, �Carbon Tari�s: An Analysis of the Trade, Welfare,and Emission E�ects,� Journal of International Economics, 2017, 109, 195�213.
and Yoto V. Yotov, �General Equilibrium Trade Policy Analysis with Structural Grav-ity,� WTO Working Paper ERSD-2016-08, 2016.
Miromanova, A., �Quantifying the Trade Reducing E�ect of Embargoes: Firm Level Evi-dence from Russia,� Unpublished Manuscript, 2019.
Morgan, T. Clifton, Navin Bapat, and Yoshiharu Kobayashi, �Threat and impositionof economic sanctions 1945-2005: Updating the TIES dataset,� Con�ict Management andPeace Science, 2014, 31 (5), 541�558.
Morgan, T.C. and V. L. Schwebach, �Fools Su�er Gladly: The Use of Economic Sanc-tions in International Crises,� International Studies Quarterly, 1997, 41, 27�50.
Pape, R.A., �Why Economic Sanctions Do Not Work,� International Security, 1997, 22(2),90�136.
, �Why Economic Sanctions still Do Not Work,� International Security, 1998, 21(1), 66�77.
Piermartini, Roberta and Yoto V. Yotov, �Estimating Trade Policy E�ects with Struc-tural Gravity,� WTO Working Paper ERSD-2016-10, 2016.
Yang, J., H. Askari, J. Forrer, and H. Teegen, �US Economic Sanctions: An EmpiricalStudy,� The International Trade Journal, 2004, 18 (1), 23�62.
38

Appendix
Classi�cation of regions based on UN geoscheme
Africa: Algeria, Angola, Benin, Botswana, Burkina Faso, Burundi, Cabo Verde, Cameroon,Central African Republic, Chad, Comoros, Cote d'Ivoire, DR Congo, Djibouti, Egypt, Er-itrea, Ethiopia, Equatorial Guinea, Gabon, Gambia, Ghana, Guinea, Guinea-Bissau, Kenya,Lesotho, Liberia, Libya, Madagascar, Malawi, Mali, Mauritania, Mauritius, Mayotte, Mo-rocco, Mozambique, Namibia, Niger, Nigeria, Reunion, Republic Congo, Rwanda, Saint He-lena, Ascension and Tristan da Cunha, Sao Tome and Principe, Senegal, Seychelles, SierraLeone, Somalia, South Sudan, South Africa, Sudan, Swaziland, Tanzania, Togo, Tunisia,Uganda, Western Sahara, Zambia, Zimbabwe.
Northern America: Bermuda, Canada, Greenland, Saint Pierre and Miquelon, UnitedStates of America.
Central America: Belize, Costa Rica, Clipperton Island, El Salvador, Guatemala, Hon-duras, Mexico, Nicaragua, Panama, Caribbean Anguilla, Antigua and Bermuda, Aruba,Bahamas ,Barbados, Bonaire, Sint Eustatius and Saba, British Virgin Islands, CaymanIslands, Cuba, Curacao, Dominica, Dominican Republic, Grenada, Guadeloupe, Haiti, Ja-maica, Marinique, Montserrat, Navassa Island, Puerto Rico, Saint-Barthelemy, Saint Kittsand Nevis, Saint Lucia, Saint Martin, Saint Vincent and the Grenadines, Sint Maarten,Trinidad and Tobago, Turks and Caicos Islands, United States Virgin Islands.
Southern America: Argentina, Bolivia, Bouvet Island, Brazil, Chile, Colombia, Ecuador,Falkland Islands, French Guiana, Guayana, Paraguay, Peru, Suriname, Uruguay, Venezuela.
Northwestern Europe: Austria, Belgium, Bulgaria, Czech Republic, Denmark, Germany,Estonia, Faroe Island, Finland, France, Germany (Federal Republic), Guernsey, Hungary,Iceland, Isle of Man, Jersey, Latvia, Lichtenstein, Lithuania, Luxembourg, Monaco, Nether-lands, Norway, Poland, Republic of Ireland, Romania, Slovakia, Sweden, Switzerland, UnitedKingdom.
Southern Europe: Albania, Andorra, Bosnia and Herzegovina, Croatia, Gibraltar, Greece,Italy, Republic of Macedonia, Malta, Montenegro, Portugal, San Marino, Serbia, Kosovo,Slovenia, Spain, Vatican.Eastern Europe: Belarus, Republic of Moldova, Russian Federation, Ukraine.
Western Asia: Armenia, Azerbaijan, Bahrain, Cyprus, Georgia, Iraq, Israel, Jordan,Kuwait, Lebanon, Oman, Qatar, Saudi Arabia, State of Palestine, Syria, Turkey, UnitedArab Emirates, Yemen.
Central Asia: Kazakhstan, Kyrgystan, Tajikistan, Turkmenistan, Uzbekistan.
Southern Asia: Afghanistan, Bangladesh, Bhutan, India, Iran, Maldives, Nepal, Pakistan,
39
Sri Lanka.
Southeastern Asia: Brunei Darussalam, Cambodia, Indonesia, Laos, Malaysia, Myanmar,Philippines, Singapore, Thailand, Timor-Leste, Vietnam.
Eastern Asia: China, Taiwan, Hong Kong, Japan, Macau, Mongolia, DPR Korea, Republicof Korea.
Oceania, Australia: Christmas Island, Cocos (Keeling) Island, New Zealand, NorfolkIsland, Fiji, New Caledonia, Papua New Guinea, Solomon Islands, Vanuatu, Guam, Kiribati,Marshall Islands, Micronesia, Nauru, Northern Mariana Islands, Palau, American Samoa,Cook Islands, French Polynesia, Niue, Pitcairn Islands, Samoa, Tokelau, Tonga, Tuvalu,Wallis and Futuna.
40


