Page 1
1
On the hydrodynamics of liquid-liquid slug flow capillary microreactors
M. N. Kashid1,2,*, D. Fernández Rivas3, D. W. Agar2 and S. Turek1
1Institute for Applied Mathematics, University of Dortmund, Vogelpothsweg 87, 44227, Dortmund,
Germany
2Institute of Reaction Engineering, University of Dortmund, Emil-Figge-Str., 66, 44227, Dortmund,
Germany
3Departamento de Ingeniería Nuclear. Instituto Superior de Tecnología y Ciencias Aplicadas,
InSTEC, Quinta de los Molinos, Ave. Salvador Allende y Luaces, Ciudad de la Habana, Cuba
* [email protected]
Page 2
2
Abstract
Microreactor technology is an important method of process intensification. Liquid-liquid slug flow
capillary microreactor has been used to intensify the mass transfer limited and strongly exothermic
reactions. In this type of reactor, either two liquids flow alternate to each other in a capillary or one
liquid flows as a continuous flow while other flows in the form of enclosed drops (slugs) depending on
the interfacial tension between two liquids and liquid adhesion with the solid walls. The enhanced mass
transfer is due to the internal circulations within the slugs which arise due to shearing action between
the slug axis and the capillary wall or continuous phase. The slug size and the intensity of internal
circulations depend on the type of mixing element and physical properties of the liquids. The proper
understanding of physical behaviour of fluids at the microscale is a challenging issue for the growing
microreactor application demands. This paper highlights the hydrodynamic characteristics of the
liquid-liquid slug flow capillary microreactor. Experimental results on flow regime, slug size and
particle image velocimetry along with corresponding complementary start-of-the-art CFD simulations
are discussed in detail.
Page 3
3
1. Introduction
Microreactor technology offers potential benefits to the processing technology such as minimal
substances consumption, complex chemical waveforms, and significantly reduced analysis or
experiment time (e.g., an important concept recently introduced was μTAS, the Micro Total Analysis
System, for details see Manz, 1990). The absence of inertial and turbulent effects in microfluidic
devices, due to the low ratio between the inertial forces and the viscous forces offers new horizons for
physical, chemical and biological applications. Also the short length scales gives high surface-to-
volume ratios, small diffusion distances and easy temperature profiling where needed, giving the
opportunity to manipulate substances in a better and reliable way which provides every molecule
same processing experience. For large scale production, the microreactors can be bundled together
which reduces the risk associated with scale-up. The physical properties of liquid such as viscosity,
surface tension and wall adhesion of the liquids play a very important role at these small scales.
The liquid-liquid slug flow capillary microreactor concept has been introduced for chemical
engineering applications by Burns and Ramshaw (2001) and has obtained mass transfer data for the
extraction of acetic acid from kerosene slugs in a glass chip-based reactor and explained the
performance of the system in terms of the prevailing slug lengths. Further it has been used for
different applications such as nitration reactions (Burns and Ramshaw, 2002 and Dummann et al.
2003) and kinetic measurement in enzymatic reactions (Song and Ismagilov, 2003), . Dummann et al.
(2003) elucidated and optimized the nitration reaction and achieved significant reduction in by-
product formation using capillary microreactor compared to conventional process. Easy temperature
profiling along the dimensions of the reactor allowed removing heat generated in the reaction and low
hold-up of the reactants guaranteed the safety during the reaction.
The alternate flow can also be applied in modular synthetic chemistry, particularly in combinatorial
chemistry so far as the reactants and products of the single synthesis steps are compatible with liquid-
liquid two phase systems (Koehler et al. 2004). Further reducing the size of the microreactor, this
concept can be used for medical applications where nano-liter amounts of samples are involved. Such
applications have already been published in the literature such as cell-based assays (Pihl, 2005),
models for capillary blood vessels for red cells infected with malaria (Shelby, 2003), drug delivery
Page 4
4
targeted at specific sites in the body for a less invasive chemotherapy, miniature biosamples
preparations on fully automated biochips, for DNA sampling and other genomic applications.
Microreactor technology is a relatively new area and very few mathematical models have been
developed to study hydrodynamics of two phase flow (mostly gas-liquid) in small geometries. In one of
our previous works (Kashid et al. 2005), we have carried out single phase flow simulations to study the
internal circulations while in other study (Kashid et al. 2006), we carried free surface simulations to
understand the mechanism of slug flow generation. In connection with this, there is a need to develop a
numerical model which can give detailed information about the two phase liquid-liquid flow in small
channels and complex flow in the vicinity of the interface which requires powerful modelling
techniques. Mathematical models describing the movement of drops, or in general, multiphase flows
developed so far, are not able to predict or quantify properly all the important particularities of this
complex systems (capillary microreactors). Hence a deeper knowledge of the physical problem,
complex hydrodynamics in the vicinity of the interface between two slugs of liquid-liquid slug flow is
mandatory. Different modelling approaches are available, but it is important to know the suitable
model for the investigation of a particular parameter and therefore there is a need to have a short
review on modelling approaches available to study of drops/slug movement through capillaries and
this is what we present in this article.
In the present work we discuss the hydrodynamics characteristics of the liquid-liquid slug flow capillary
microreactor which were investigated using state-of-the-art experimental and computational techniques.
The main focus of the article is the movement of the interface, internal circulations within the slugs and
velocity patterns in the vicinity of the interface.
2. Slug flow generation and characterization
2.1 Slug flow generation and flow regimes
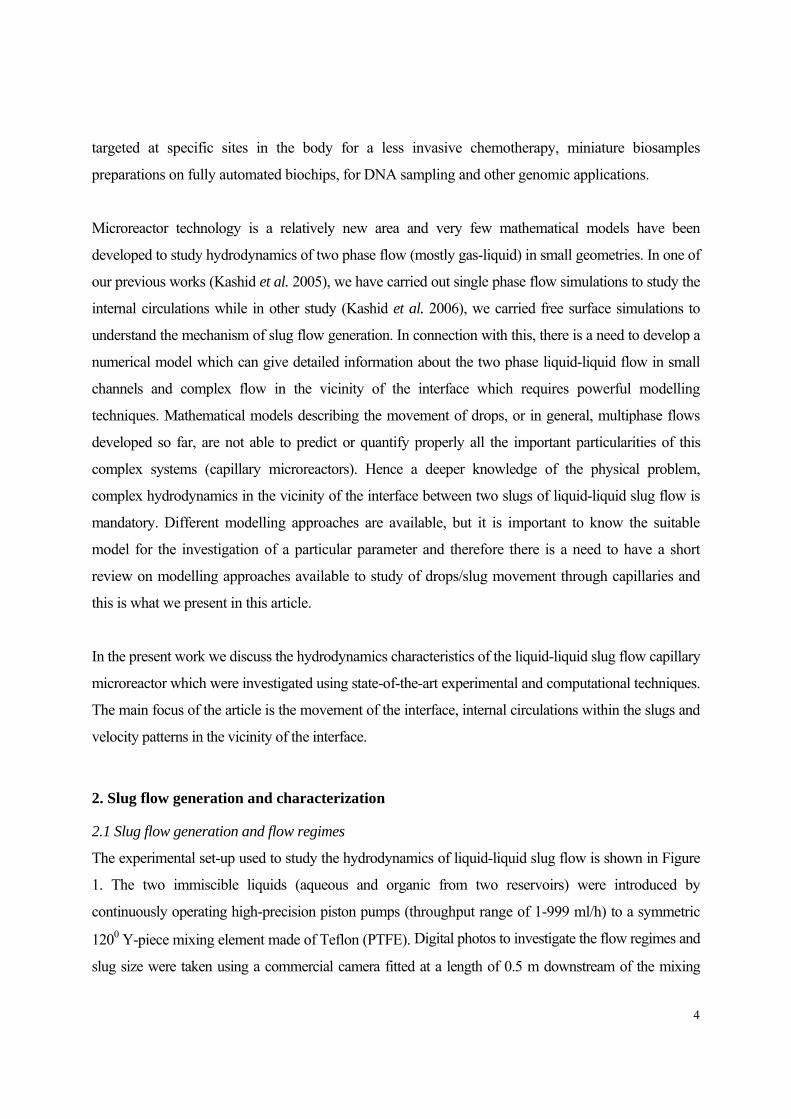
The experimental set-up used to study the hydrodynamics of liquid-liquid slug flow is shown in Figure
1. The two immiscible liquids (aqueous and organic from two reservoirs) were introduced by
continuously operating high-precision piston pumps (throughput range of 1-999 ml/h) to a symmetric
1200 Y-piece mixing element made of Teflon (PTFE). Digital photos to investigate the flow regimes and
slug size were taken using a commercial camera fitted at a length of 0.5 m downstream of the mixing
Page 5
5
element and a light source (2000 Watt). Several combinations of Y-junction and capillary sizes were
tested. In order to distinguish the two phases, the water phase was stained with a blue dye to appear darker
than the colourless cyclohexane. The snapshots show that the water phase forms convex shaped slugs,
while cyclohexane exhibits a concave geometry as would be expected with the hydrophobic PTFE wall
material. The exact form of the slug depends on the inlet flow ratios, physical properties of both liquids
and the capillary and Y-junction dimensions.
Figure 1. Experimental set-up: P1, P2 - Pumps, Y-jn – Y-junction, CM – Capillary
microreactor, L – Light and CC - Camera
The flow patterns in the capillary are depending on several factors such as interfacial tension, wall
adhesion, and angle of contact between two liquid inlets at the Y-junction. When two immiscible liquids
are introduced into the Y-junction, one liquid initially flows downstream through the junction, while the
other penetrates over to the opposite side of the junction, this mutual displacement process generates the
alternating slug flow structure. The flow regimes of two immiscible liquids in a capillary are defined on
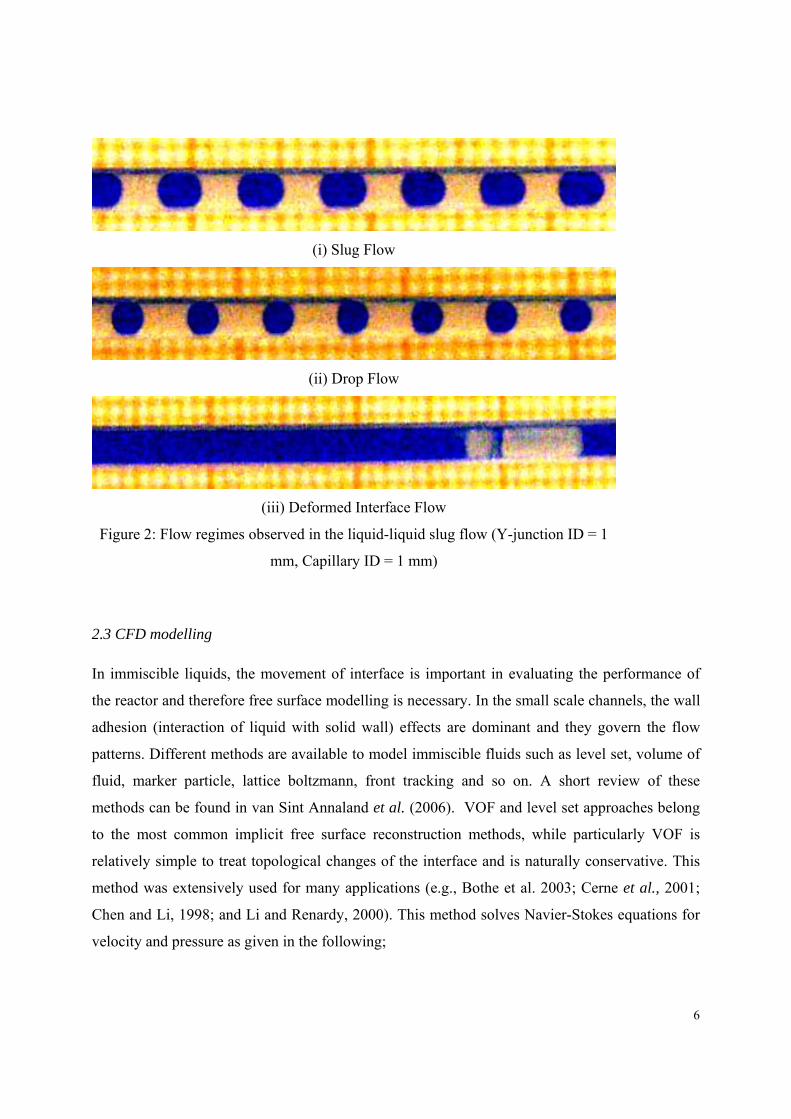
the behaviour of the aqueous phase in the two phase flow. The experimental results show that the water
forms convex shaped slug while cyclohexane exhibits a concave geometry, as would be expected with the
hydrophobic PTFE wall material. One can easily recognise three distinct flow regimes, well-defined slug
flow, drop flow and deformed interface (inverted) flow which is explained in detail in Kashid and Agar
(2007).
P2
P1
Y-jn CM
L
CC
Liquid 1
Liquid 2
Page 6
6
(i) Slug Flow
(ii) Drop Flow
(iii) Deformed Interface Flow
Figure 2: Flow regimes observed in the liquid-liquid slug flow (Y-junction ID = 1
mm, Capillary ID = 1 mm)
2.3 CFD modelling
In immiscible liquids, the movement of interface is important in evaluating the performance of
the reactor and therefore free surface modelling is necessary. In the small scale channels, the wall
adhesion (interaction of liquid with solid wall) effects are dominant and they govern the flow
patterns. Different methods are available to model immiscible fluids such as level set, volume of
fluid, marker particle, lattice boltzmann, front tracking and so on. A short review of these
methods can be found in van Sint Annaland et al. (2006). VOF and level set approaches belong
to the most common implicit free surface reconstruction methods, while particularly VOF is
relatively simple to treat topological changes of the interface and is naturally conservative. This
method was extensively used for many applications (e.g., Bothe et al. 2003; Cerne et al., 2001;
Chen and Li, 1998; and Li and Renardy, 2000). This method solves Navier-Stokes equations for
velocity and pressure as given in the following;
Page 7
7
0
))().(
=⋅∇
+∇+∇⋅∇+−∇=⎟⎠⎞
⎜⎝⎛ ∇+∂∂
u
guupuutu T ρμρ
(1)
Where ρ and μ are the density and viscosity of liquids, respectively. The common interfacial
boundary conditions, continuity of velocity across the interface and jump in the normal stresses,
are given by;
[ ] ( )[ ] nnuupIu T ˆˆ|,0| σκμ =⋅∇+∇+−−= ΓΓ (2)
Where σ is the surface tension, κ is the curvature of the interface and ^n is the normal vector to the
surface interface (for more details see Hysing, 2006). The interface between two fluids is tracked
by using a pure convection equation of the volume fraction of a phase.
0. =∇+∂∂ αα u
t (3)
The other method, the level set method, solves similar types of equations. However, the interface
is tracked by a function which is zero at the interface, positive in phase one and negative in other.
The evolution of this function can be posed as a general transport problem i.e. convection
equation similar to volume fraction in VOF method (Equation 3). In the liquid slug flow the flow
patterns are governed by surface tension and wall adhesion forces and therefore the surface
tension modelling is very crucial. It is usually done by using the continuum surface force (CSF)
model proposed by Brackbill et al. (1992). The addition of surface tension to the calculation
results in a source term in the momentum equation.
In the liquid-liquid slug flow, if the surface tension between the discrete phase and the wall
material is higher than the interfacial tension between two liquids, two liquids flow
alternatively in the small scale geometries, otherwise one of the liquids flows in the form of
Page 8
8
enclosed slug. This only happens in the case of liquid-liquid two phase flows. In alternate flow,
rather than imposing the boundary conditions at the wall itself, the contact angle that the fluid
assumed to make with the wall is used to adjust the surface normal in the cells near the wall.
The contact angle values are taken from experimental measurements and no-slip boundary
conditions (zero velocity on walls) are used. The liquid-liquid-solid contact line moves along the
wall, presenting a kind of singularity (Gunjal, 2005). In this case, the velocity of the faces
adjacent to the wall is kept to zero and other parts (cell centre and other faces) have non-zero
velocity. Such non-zero velocities influence the volume fraction field and therefore also the
position of the interfaces. Thus, such implementation realises the movement of the liquid-liquid-
solid contact line despite specifying no-slip boundary conditions at the solid surface. The
simulated results using this methodology are depicted in Figure 3a. It shows well defined slug
flow for a three phase contact angle of 900.
Further, the 2D simulations were carried out using in-house developed CFD code FEATFLOW.
This code uses an implementation of surface tension effects in interfacial flow combining two
techniques: the continuum surface force (CSF) method and a finite element discretisation
together with the Laplace-Beltrami operator (Hysing, 2006). For the integration of the levelset
function (interface between the slug and fluid around it), there are two different approaches at
hand. On the one hand, a specific number of cells are used for the integration of the levelset
function, which makes possible the simple volume integration, at a low computational cost, but
less accurate. On the other hand, Direct Line Integration technique is used in which the interface
line is reconstructed exactly from where the surface tension forces are integrated, i.e. exactly on
the lines, although it is computationally more expensive. For the time discretisation, a Crank-
Nicholson scheme was used. The results obtained are plotted in Figure 3b. It also shows the well-
defined slug flow. However, the back interface of the slug is deformed due to the lack of wall
adhesion phenomenon which is the part of future work.
Page 9
9
(a) Volume of fluid method (using FLUENT, Kashid et al. 2006)
(b) Levelset method
Figure 3: Simulated snapshot of the well-defined slug flow
Page 10
10
3. Interface behaviour and internal circulations
3.1 Particle image velocimetry
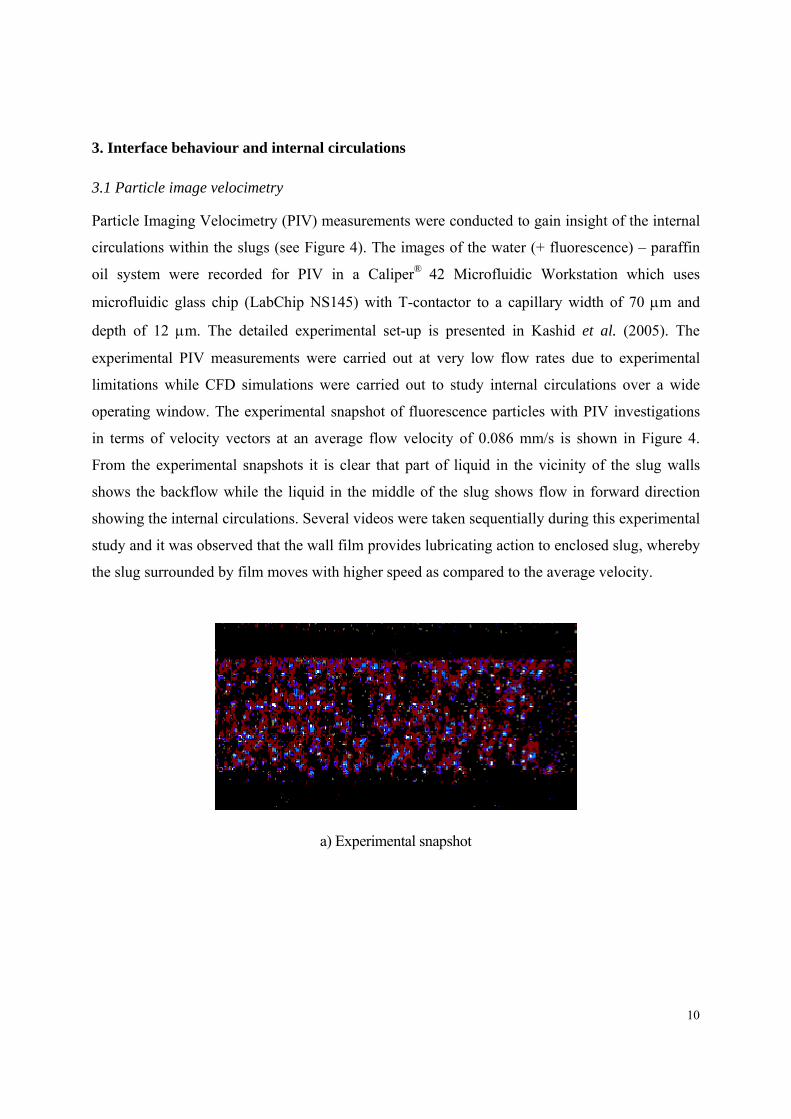
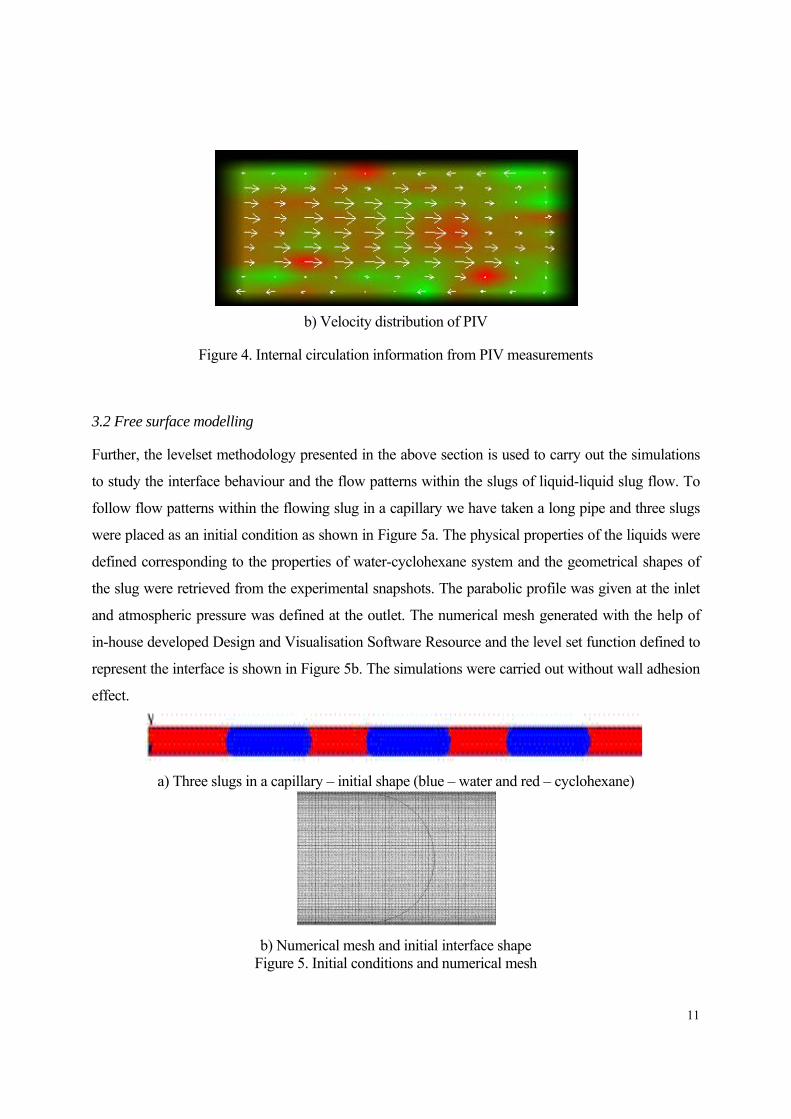
Particle Imaging Velocimetry (PIV) measurements were conducted to gain insight of the internal
circulations within the slugs (see Figure 4). The images of the water (+ fluorescence) – paraffin
oil system were recorded for PIV in a Caliper® 42 Microfluidic Workstation which uses
microfluidic glass chip (LabChip NS145) with T-contactor to a capillary width of 70 μm and
depth of 12 μm. The detailed experimental set-up is presented in Kashid et al. (2005). The
experimental PIV measurements were carried out at very low flow rates due to experimental
limitations while CFD simulations were carried out to study internal circulations over a wide
operating window. The experimental snapshot of fluorescence particles with PIV investigations
in terms of velocity vectors at an average flow velocity of 0.086 mm/s is shown in Figure 4.
From the experimental snapshots it is clear that part of liquid in the vicinity of the slug walls
shows the backflow while the liquid in the middle of the slug shows flow in forward direction
showing the internal circulations. Several videos were taken sequentially during this experimental
study and it was observed that the wall film provides lubricating action to enclosed slug, whereby
the slug surrounded by film moves with higher speed as compared to the average velocity.
a) Experimental snapshot
Page 11
11
b) Velocity distribution of PIV
Figure 4. Internal circulation information from PIV measurements
3.2 Free surface modelling
Further, the levelset methodology presented in the above section is used to carry out the simulations
to study the interface behaviour and the flow patterns within the slugs of liquid-liquid slug flow. To
follow flow patterns within the flowing slug in a capillary we have taken a long pipe and three slugs
were placed as an initial condition as shown in Figure 5a. The physical properties of the liquids were
defined corresponding to the properties of water-cyclohexane system and the geometrical shapes of
the slug were retrieved from the experimental snapshots. The parabolic profile was given at the inlet
and atmospheric pressure was defined at the outlet. The numerical mesh generated with the help of
in-house developed Design and Visualisation Software Resource and the level set function defined to
represent the interface is shown in Figure 5b. The simulations were carried out without wall adhesion
effect.
a) Three slugs in a capillary – initial shape (blue – water and red – cyclohexane)
b) Numerical mesh and initial interface shape
Figure 5. Initial conditions and numerical mesh
Page 12
12
The obtained results are plotted in Figure 6. As can be seen from the Figure, the slug changes its
shape considerably compared to their initial shape. Due to the shearing action between the slug axis
and the continuous phase/wall axis each slug shows intense internal circulations. The closed look at
the internal circulation within a slug shows that there are some stagnant zones present in the slugs. As
can be seen in Figure 6b, there are four stagnation regions that can be identified inside each slug on
the upper and downer part and at the front and back ends. Moving in a reference system with the
slug’s average velocity, the geometry of this configuration provides a symmetry line along the axis of
the capillary. The centreline of the slug flows in the direction of the slug motion and is formed by the
convergent streams of two eddies that separate at the nose and go in opposite directions afterwards,
reuniting at the tail. This internal convective movement is generated by the shear stress deformation
acting on the interface of the slug and the carrier and can be also extrapolated to the internal
movement of the carrier. In Figure 6b, the red colour stands for the maximum velocity values as for
the blue ones mark the stagnation regions (the carrier region is pink shadowed). It was seen that
increasing the average carrier velocity, leads to an increase in the internal circulation inside the slugs.
a) Vector plot representing the internal circulation
b) Velocity vector plot of a single slug
Figure 6. Velocity field results at different time steps
Page 13
13
3.2 Particle tracing
When considering mass transfer and reactions in a microreactor, the transport of the species within
the phases will be determined strongly by the hydrodynamic flow pattern. CFD particle tracing is a
powerful flow field visualisation tool which gives qualitative information about the flow patterns.
For particle tracing study we took one snapshot of the moving slug and considered as stationary.
This is done by subtracting the average velocity at which the slug is moving (from left to right in
this case) to every node x-component value. Using the GMVPT module (developed by
FEATFLOW group, Institute for Applied Mathematics, University of Dortmund), initially a
distribution of particles is placed in the back (left) part of the slug, and as the slug moves to the
right (increasing the time-step), and the behaviour described above is exactly obtained (see Figure
8).
T = 0.08 s T = 0.27 s
T = 0.74 s T = 0.97 s
Figure 8. Particle tracing evolution at different times inside a slug.
Page 14
14
In the above figure it can be seen how the particles follow the centre stream and divides forming
the two eddies referred above. The stagnation zones are clearly spotted after a few time steps.
Comparing the particle tracing numerical solution with the experimental PIV measurements, both
results are qualitatively speaking the same and also coincide with the internal circulation
expected flow pattern.
3.3 Simplified modelling – single phase
In the liquid-liquid slug flow, both liquids exert considerable shear on each other and therefore
the flow patterns are very well defined. The above methodology required more computational
resources and therefore the model can further be simplified assuming the fixed interface position
retrieved from the experimental snapshots. The CFD simulations were carried for each individual
slugs and the recirculation time and position of the stagnant zones was from the obtained data.
Simulations were carried out for two cases: without film and with film. The length of the aqueous
phase domain with and without film was assumed to be the same while the radius was modified
with film thickness for aqueous slug with film. For organic slugs without film, the domain was
considered as a closed geometry whereas with film there was inlet and outlet flow via the wall
film. The front and rear interface of all slugs was assumed to be symmetric at all flow velocities
even with the convective flow in or out of the organic slug via the film. The FEATFLOW was
used for simulations which package solves the following unsteady-state incompressible Navier-
Stokes equation with velocity constraints by projected and coupled approach (Turek, 1999).
0
.
=⋅∇
=∇+Δ−∇+∂∂
u
fpuuutu ν (6)
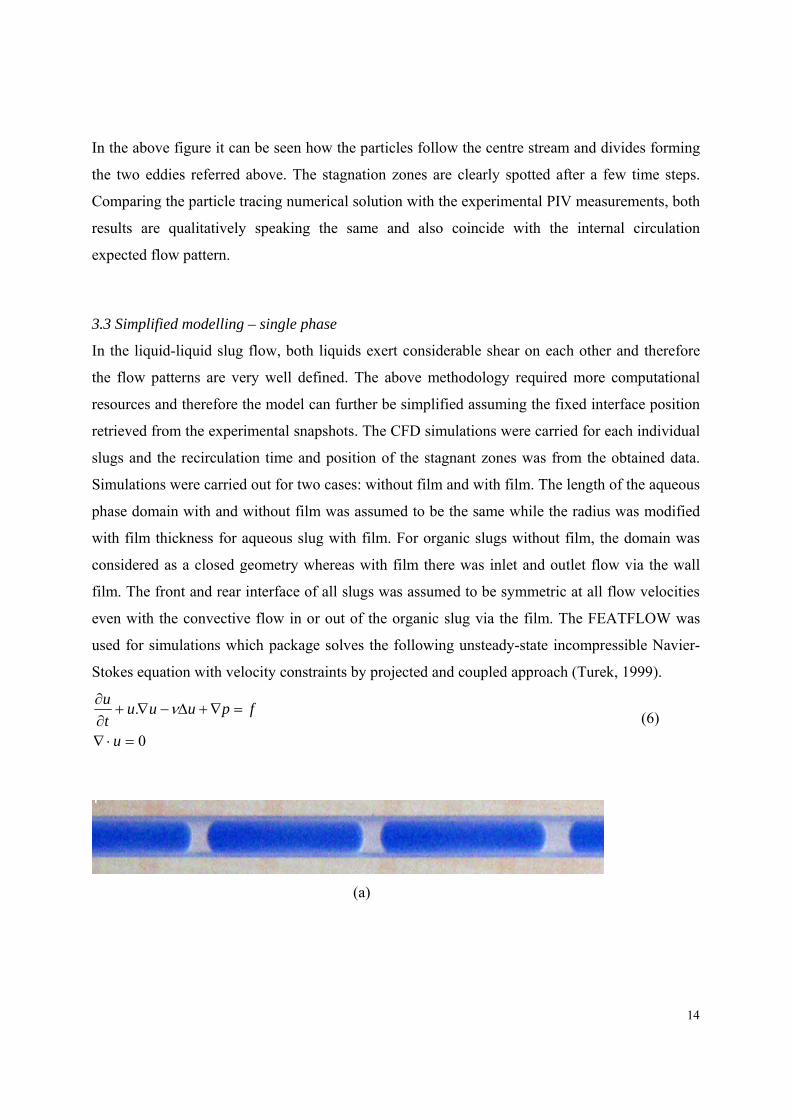
(a)
Page 15
15
(b)
Figure 9: Liquid-liquid slug flow in a capillary microreactor and its schematic
representation
The structured two-dimensional coarse grid was generated and was refined near the wall and
corner of the geometry to improve the resolution. The Dirichlet type boundary conditions were
used for the aqueous slug with and without film. The same boundary conditions were used for the
organic slug without film as well since there was no inflow and outflow. For organic phase
domain with film i.e. with film inlet and outlet flows, Neumann type boundary conditions were
used. A negative x-velocity was given to the capillary wall which moved the capillary wall in
negative direction while the slug remained stationary. The other parameters were defined relative
to the slug velocity according to domain requirement.
Further, the simulations for particle tracing were carried out with the result obtained from CFD
simulations. The meshes with different levels of refinement were generated with the help of the
in-house developed graphical pre-processing tool, TRIGEN2D, a tool for two-dimensional coarse
triangulations and to write the corresponding data in special format onto a hard disc. A
rectangular area of tracers was defined with a constant frequency to simulate a constant stream of
particles at various operating conditions. The obtained results are plotted in Figure 10. As can be
x
r0
Rs
Rs
Stagnant RegionRecirculations Front Interface Back Interface
L
r0
Page 16
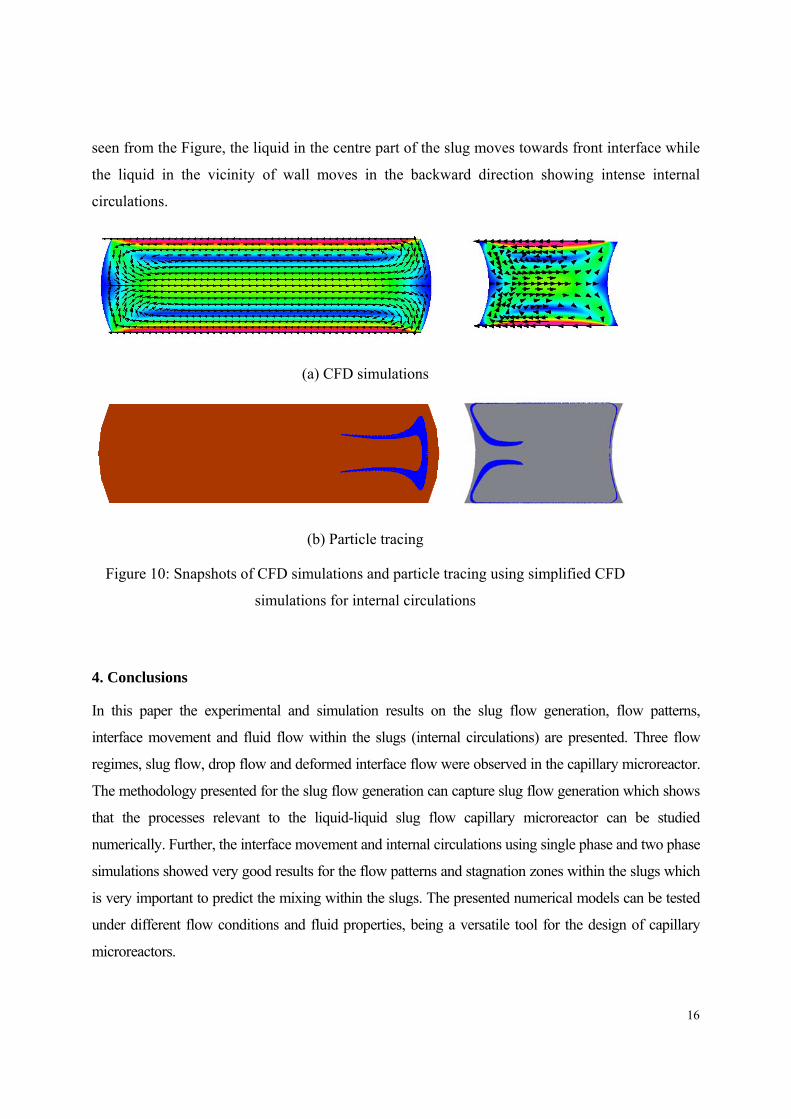
16
seen from the Figure, the liquid in the centre part of the slug moves towards front interface while
the liquid in the vicinity of wall moves in the backward direction showing intense internal
circulations.
(a) CFD simulations
(b) Particle tracing
Figure 10: Snapshots of CFD simulations and particle tracing using simplified CFD
simulations for internal circulations
4. Conclusions
In this paper the experimental and simulation results on the slug flow generation, flow patterns,
interface movement and fluid flow within the slugs (internal circulations) are presented. Three flow
regimes, slug flow, drop flow and deformed interface flow were observed in the capillary microreactor.
The methodology presented for the slug flow generation can capture slug flow generation which shows
that the processes relevant to the liquid-liquid slug flow capillary microreactor can be studied
numerically. Further, the interface movement and internal circulations using single phase and two phase
simulations showed very good results for the flow patterns and stagnation zones within the slugs which
is very important to predict the mixing within the slugs. The presented numerical models can be tested
under different flow conditions and fluid properties, being a versatile tool for the design of capillary
microreactors.
Page 17
17
Acknowledgements
One of the authors, Fernandez Rivas, is thankful to the DAAD (German academic exchange service) for
the financial support and University of Dortmund for kindly inviting him to collaborate in this research
topic.
References
1. Manz, A., Graber, N., Widmer, H. M. Miniaturized total chemical analysis systems: a
novel concept for chemical. sensing", Sensors and Actuators, B1, 244 -248, 1990
2. Burns, J. R. and Ramshaw, C., The intensification of rapid reactions in multiphase
systems using slug flow in capillaries, Lab Chip, 1,10-15, 2001.
3. Burns, J. R. and Ramshaw, C. A microreactor for the nitration of benzene and toluene.
Chemical Engineering Communications, 189:1611–1628, 2002.
4. Song, H. and Ismagilov, R. F., Millisecond kinetics on a microfluidic chip using
nanoliters of reagents. Journal of American Chemical Society, 125:14613–14619, 2003.
5. Dummann, G., Quittmann, U., Groschel, L., Agar, D. W., Woerz, O. and Morgenschweis,
K., The capillary-microreactor: a new reactor concept for the intensification of heat and
mass transfer in liquid-liquid reactions, Catalysis Today, 79-80, 433-439, 2003.
6. Koehler, J. M. Henkel, Th., Grodrian, A., Kirner, Th., Roth, M. Martin, K. and Metze, J.,
Digital reaction technology by micro segmented flow components, concepts and
applications. Chemical Engineering Journal, 101:201–216, 2004.
7. Pihl, J., Sinclair, J., Karlsson, M. and Orwar, O., Microfluidics for cell-based assays,
Materials Today, 8 (12), 46-51, 2005
8. Shelby, J. P., White, J. Ganesan, K., Rathod, P. K. and Chiu, D. T. A microfluidic model
for single-cell capillary obstruction by Plasmodium falciparum-infected erythrocytes,
Proceedings of National Academy of Science, USA, 100(25): 14618–14622, 2003.
9. Kashid, M. N.; Garlach, I.; Franzke, J.; Acker, J. F.; Platte, F.; Agar, D. W. and Turek, S.
(2005), Internal circulation within the liquid slugs of liquid-liquid slug flow capillary
microreactor, Industrial and Engineering Chemistry Research, 44 (2005), 5003-5010.
10. Kashid, M. N., Platte, F., Agar, D. W. and Turek, S., Computational modelling of slug
flow in a capillary microreactor, Journal of Computational and Applied Mathematics, in
press, 2006
Page 18
18
11. Kashid, M. N. and Agar, D. W. Hydrodynamics of liquid–liquid slug flow capillary
microreactor: Flow regimes, slug size and pressure drop, Chemical Engineering
Journal, in press, 2007
12. van Sint Annaland, M., Dijkhuizen, W., Deen, N. G. and Kuipers, J. A. M., Numical
simulation of behaviour of gas bubbles using a 3D front tracking method, AIChE Journal,
52(1), 99-110, 2006.
13. Bothe, D., Koebe, M., Wielage, K., Warnecke, H-J., VOF simulations of mass transfer
from single bubbles and bubble chains rising in the aqueous solutions, in: Proceedings of
FEDSM03: Fourth ASME-JSME Joint Fluids Engineering Conference, Honolulu,
Hawaii, USA, July 6–11, 2003.
14. Cerne, G. Petelin, S. and Tiselj, I., Coupling of the interface tracking and the two-fluid
models for the simulations of incompressible two phase-flow, Journal of Computational
Physics, 171, 776–804, 2001.
15. Chen, L. and Li, Y., A numerical method for two-phase flows with an interface,
Environmental Modelling and Software, 13, 247–255, 1998.
16. Li, J. and Renardy, Y., Numerical study of flows of two immiscible liquids at low
Reynolds number, Society for Industrial and Applied Mathematics, 42 (3), 417–439,
2000.
17. Hysing, S., A new implicit surface tension implementation for interfacial flows,
International Journal of Numerical Methods in Fluids, 51(6):659–672, 2006.
18. Brackbill, J. U., Kothe, D. B. and Zemach, C., A continuum method for modelling surface
tension. Journal of Computational Physics, 100(2):335, 1992.
19. Gunjal, P. R., Flow modeling and mixing in packed bed reactor. PhD Thesis, IIT
Mumbai, India, 2005.
20. Turek, S. Efficient Solvers for Incompressible Flow Problems: An Algorithmic and
Computational Approach, Springer-Verlag, Heidelberg, 1999.