On the Importance of Golden Parachutes ELIEZER M. FICH, ANH L. TRAN, and RALPH A. WALKLING* July 22, 2010 ABSTRACT While existing research addresses the presence of golden parachutes, it overlooks their relative importance to target CEOs. This importance is critical: it correlates with the moral hazard problem facing the executive most crucial to a merger’s outcome. Parachutes that are either too trivial or too important relative to other takeover-induced wealth changes could produce ‘unyielding resistance’ or ‘a rush to sale’ despite the acquisition price offered. Neither attitude is likely to benefit target shareholders. We examine 851 acquisition bids from 1999-2007 and find more important parachutes benefit target shareholders through higher merger completion probabilities. However, other results indicate that as parachute importance increases target shareholders receive lower acquisition premia. JEL classification: D82; G34; J33 Keywords: Golden Parachutes; Acquisitions; Moral Hazard * Fich and Walkling are at the LeBow College of Business, Drexel University, 3141 Chestnut Street, Philadelphia, PA 19104, USA. Tran is at the Cass Business School, City University London, 106 Bunhill Row, London EC1Y 8TZ, United Kingdom. For their helpful comments, we thank Alberto Banal, Leonce Bargeron, Jie Cai, Diane Denis, Naveen Daniel, Harold Mulherin, Lalitha Naveen, Micah Officer, Matthew Rhodes-Kropf, Javier Suarez, David Yermack, seminar attendees at the Cass Business School, Drexel University, Erasmus University, Fordham University, IESEG School of Management, Vlerick Leuven Gent Management School, session participants at the XVII Finance Forum held at IESE and the 2009 USC Law School Conference on Empirical Legal Studies. All errors are our responsibility. Contact information: 215-895-2304, [email protected] (E.M. Fich); [email protected] (A.L. Tran); 215-895- 4920, [email protected] (R.A. Walkling).
Transcript
On the Importance of Golden Parachutes
ELIEZER M. FICH, ANH L. TRAN, and RALPH A. WALKLING*
July 22, 2010
ABSTRACT While existing research addresses the presence of golden parachutes, it overlooks their relative importance to target CEOs. This importance is critical: it correlates with the moral hazard problem facing the executive most crucial to a merger’s outcome. Parachutes that are either too trivial or too important relative to other takeover-induced wealth changes could produce ‘unyielding resistance’ or ‘a rush to sale’ despite the acquisition price offered. Neither attitude is likely to benefit target shareholders. We examine 851 acquisition bids from 1999-2007 and find more important parachutes benefit target shareholders through higher merger completion probabilities. However, other results indicate that as parachute importance increases target shareholders receive lower acquisition premia. JEL classification: D82; G34; J33 Keywords: Golden Parachutes; Acquisitions; Moral Hazard
* Fich and Walkling are at the LeBow College of Business, Drexel University, 3141 Chestnut Street, Philadelphia, PA 19104, USA. Tran is at the Cass Business School, City University London, 106 Bunhill Row, London EC1Y 8TZ, United Kingdom. For their helpful comments, we thank Alberto Banal, Leonce Bargeron, Jie Cai, Diane Denis, Naveen Daniel, Harold Mulherin, Lalitha Naveen, Micah Officer, Matthew Rhodes-Kropf, Javier Suarez, David Yermack, seminar attendees at the Cass Business School, Drexel University, Erasmus University, Fordham University, IESEG School of Management, Vlerick Leuven Gent Management School, session participants at the XVII Finance Forum held at IESE and the 2009 USC Law School Conference on Empirical Legal Studies. All errors are our responsibility. Contact information: 215-895-2304, [email protected] (E.M. Fich); [email protected] (A.L. Tran); 215-895-4920, [email protected] (R.A. Walkling).
1
“Companies receiving federal aid are going to have to disclose publicly all the perks and luxuries bestowed upon senior executives, and provide an explanation to the taxpayers and to shareholders as to why these expenses are justified. And we're putting a stop to these kinds of massive severance packages we've all read about with disgust; we're taking the air out of golden parachutes.”
President Barack Obama February 4, 20091
Golden parachutes are more controversial today than when they first appeared over twenty years
ago. Advocates argue that parachutes are a necessary part of a competitive pay package required
to attract and retain talented executives. It is also argued that parachutes are beneficial to
shareholders since they induce senior managers to “do the right thing” in the event of an
acquisition attempt. Opponents object to parachutes because they are linked to a change in
control of a company, not to its continuing performance. Detractors portray parachutes as
guaranteeing managers “pay-for-failure,” regardless of shareholder returns. Headlines from the
popular press regularly criticize golden parachutes and express widespread concern about
managerial excess and the lack of pay-for-performance related to parachute payments.
Government actions with regard to parachutes mirror the controversy. Recent regulation has
paved the way for boards of target firms to either award or augment parachutes at the onset of a
merger.2 In contrast, companies receiving assistance from the Troubled Assets Relief Program
(TARP) are prohibited from making parachute payments to their senior executives.3 Collectively,
all of these items suggest that the controversy surrounding golden parachutes is alive and well.
We study a sample of 851 acquisition offers during 1999-2007 to investigate whether golden
parachutes benefit the executives receiving them, the shareholders in the firms that grant them, or 1 The full speech by president Obama can be viewed at: http://www.whitehouse.gov/blog_post/new_rules/ 2 On October 18, 2006, the Securities and Exchange Commission (SEC) adopted amendments to Rule 14d-10(a)(2) of the 1934 Securities Act to provide a safe harbor enabling the compensation committee of a target's board of directors to provide severance, parachutes or other benefits for its executives during a tender offer negotiation. 3 See: http://www.treas.gov/press/releases/hp1207.htm
2
both. From an academic perspective, these issues are similar to those addressed in the early
literature: incentive alignment and managerial interest.4 Although these hypotheses are well
known, our implementation differs from prior work in several important respects. While the
previous literature addresses the existence of parachutes, it does not consider their relative
importance to the CEO. Target CEOs considering personal gains and losses from acquisitions
will do so cognizant of the combined effects of all associated wealth changes. These include all
components of their merger pay package and the potential of lost wages should the acquisition
occur. As a result, when a firm becomes a takeover target, a moral hazard problem exists: the
target CEOs have direct influence over actions that provide personal benefit at the possible
expense of their shareholders. Because of this moral hazard, it is the relative importance of
parachutes to target CEOs, not their mere presence, that must be recognized. Consequently, we
re-examine existing hypotheses with two different measures of parachute importance relative to
the target CEO’s personal wealth. Our first measure scales the parachute payment by the value of
the merger pay package awarded to the target CEO. Our second measure scales the parachute
payment by the expected wage losses this executive would incur if the firm is acquired. We
believe that recognizing this relative importance is critical for understanding the incentives of
parachutes. Rational CEOs do not consider the wealth effects of golden parachutes in isolation
when contemplating the personal effects of an acquisition. They consider the combined effects of
all components of their pay package. An improper balance in an executive’s pay package could
generate either a ‘rush to sale’ or ‘unyielding resistance’ in the face of an acquisition attempt,
regardless of the price offered. Either behavior is likely to harm target shareholders.
4 Incentive alignment and managerial interest are hypotheses often studied in settings prone to agency problems; see, for example, Jensen and Meckling (1976).
3
We examine inferences drawn from the controversy surrounding parachutes. It is argued that
parachutes prevent executives from derailing a merger; this has implications for deal
completion. It is also argued that parachutes can strengthen the CEO’s ability to bargain for the
firm; this has implications for the premia offered in acquisitions. We expand upon previous work
by exploring these topics in the context of the relative importance of the parachute, not just its
existence.
We first study whether the relative importance of parachutes to target CEOs influences the
likelihood that a merger is completed. These tests reveal that as the relative importance of the
parachute increases, deals are more likely to be completed. This result suggests that the
willingness to sell a target increases with the relative importance of golden parachutes. On the
surface, these findings appear to support the incentive alignment hypothesis. However, because
measurable wealth effects are absent from our deal completion tests, the managerial interest
alternative cannot be dismissed. Consequently, we examine the effect of our proxies of parachute
importance on the premia paid to target shareholders.
We find that golden parachutes affect the wealth of target CEOs and target shareholders in a
non-trivial manner. On average, parachute payments account for approximately 30.5% of the
total merger pay package target CEOs receive. These executives cash in about $4.9 million from
parachutes when their firms are sold. Conversely, we find that a 10% increase in parachute
importance relative to the merger pay package is associated with a drop in premia of about 4.97
percentage points. This shortfall implies a reduction of $249 million in deal value for the average
deal in our sample. Consequently, our findings indicate that when CEOs are given stronger
4
incentives to sell their firms, vis-à-vis a larger parachute, they appear to do so even at the
detriment of their shareholders. This result supports the managerial interest hypothesis.
We identify a number of issues that could raise concerns related to endogeneity or to other
econometric biases. First, parachutes are endogenously chosen which introduces the potential of
self-selection bias. Second, since firms do not randomly become takeover targets, our analyses
might be vulnerable to sample selection bias. Third, because industry and/or time trends could
affect the incidence of mergers and the way executive compensation is structured, our tests might
be prone to omitted variables bias. Fourth, since a parachute is a common provision in many
executive compensation contracts, it is possible that its effect is anticipated and impounded in a
target’s price. Because of this issue, our analysis could be susceptible to anticipation bias. Fifth,
awareness of the premium they could command in an acquisition might dictate how targets
structure the merger-related exit pay their CEOs get. Under this scenario, the direction of
causality would be reversed.
To address the issues described above, we employ different empirical specifications and
econometric methods. Our multivariate tests control for potential endogeneity biases arising from
self-selection by using the Heckman (1979) approach. We also use the same approach to address
sample selection issues by controlling for the probability that a firm becomes a takeover target.
Also, to account for the potential of anticipation bias, we employ the multistage method in
Comment and Schwert (1995). Using their approach, we divide the parachute into predictable
and surprise components. To control for the possibility of omitted variables bias, our multivariate
5
analyses consist of year- and industry-fixed-effects regressions.5 In addition, to address concerns
related to reverse causality, we estimate several two-stage instrumental variable systems. The
inverse association between parachute importance and takeover premia we document continues
to obtain under the different empirical specifications and econometric techniques we employ.
Bargeron, Schlingemann, Stulz, and Zutter (2009) note that CEOs have a potential conflict of
interest once their firms become an acquisition target since these executives can bargain for
personal benefits rather than for a higher premium for the target shareholders. In a closely related
study, Hartzell, Ofek, and Yermack (2004) provide evidence related to this conflict. They find
that targets earn lower takeover premia when their CEOs get additional payments during merger
negotiations. Target boards provide the additional payments by authorizing a special merger
bonus or by amending a parachute provision in order to increase its value. In contrast, unlike
Hartzell, Ofek, and Yermack (2004), the parachutes we study are those in place in the CEOs’
compensation contract prior to their firms becoming a takeover target.
This paper adds to our understanding of the wealth effects and incentives of merger-related
exit compensation to target CEOs. Our results indicate that as the importance of the golden
parachute to target CEOs increases target shareholders earn lower premia. Therefore, these
findings suggest that the level of importance of parachutes to target CEOs may induce these
executives to compromise the interests of the target shareholders during acquisitions. Given the
moral hazard problem that arises during takeovers, this result has direct implications for the way
top-management compensation contracts are structured.
5 Hausman and Taylor (1981) argue that the fixed-effects specification provides a common, unbiased method to control for omitted variables in a panel data set.
6
The paper proceeds as follows. Section I provides a background on parachutes and develops
our hypotheses. Section II describes our data. Section III contains our empirical analyses. Section
IV addresses a number of robustness issues. Section V presents our conclusions.
I. Background on Golden Parachutes and Hypotheses Development
A. Golden Parachutes: Nonacademic Evidence
In recent years, golden parachutes have prompted significant public attention and caused
some investors concern. Such concern is understandable since, under parachute agreements,
executives are assured pay benefits well into the millions without requiring successful
performance in order to collect these awards. A 2007 study of 137 large U.S. corporations by
Equilar Inc. finds that 82% of these firms have parachute provisions in place for their CEOs.
That study notes that such provisions are a key part of their median sample severance package
which is worth $29 million. Recently, the business press documents some high-profile cases in
which executives such as Carly Fiorina of Hewlett-Packard, Robert Nardelli of Home-Depot,
Stan O’Neal of Merrill Lynch, and Charles Prince of Citigroup reportedly cashed in hefty
parachutes while the companies under their stewardship lost millions of dollars and thousands of
workers were laid off.6
In response to such incidences, law makers have asked regulators to reduce these payments
to avoid “rich severance packages for failed executives.” As a result, under the new rules, U.S.
banks and car manufacturers receiving funds from TARP can only give their top executives
6 See, for example, “Theory and practice: companies cut holes in CEOs' golden parachutes; New disclosure rules prompt more criticism of guaranteed payouts,” Wall Street Journal, New York, September 15, 2008; and “When madmen reign,” New York Times, New York, September 29, 2008.
7
parachute payments up to one time the executives’ previous cash compensation.7 This provision
lowers the parachute multiple of three which is customary in these industries8.
At the time of this writing, Congress is considering requiring shareholder votes on golden
parachutes as part of the current financial reforms.9 While this law will encumbrance financial
companies, it is possible that such requirements will prompt non-financial firms to overhaul their
own parachute provisions. Indeed, some prominent firms (such as Colgate-Palmolive, 3M, and
Chevron) have already imposed limits on parachute payments for their executives. Nonetheless,
other companies (such as Nabors Industries and Textron) oppose such limits arguing that
parachutes help keep their compensation at competitive levels.10
B. Golden Parachutes in Acquisitions: Academic Evidence
A golden parachute is a clause in an executive's employment contract specifying benefits that
s/he will receive in the event that the company is acquired and/or the executive's employment is
terminated.11 These benefits are often based on the regular cash and bonus paid to the executives.
Previous research studies the reasons why firms adopt these plans. Knoeber (1986) and
Berkovitch and Khanna (1991) view golden parachutes as implicit deferred compensation,
already earned but not yet received, that promotes managerial human capital investment in the
firm. Jensen (1988) states that severance packages are used to compensate managers for the loss
7 See, for example, “US bank chiefs face $500,000 limit,” Financial Times, London, February 5, 2009. 8 As we later note, the actual distribution of the multiple used, exhibits a wide range of values, with over half of the sample having multiples larger than 2.99. 9 See, “US Senators Agree To Shareholder Vote On Golden Parachutes.” Dow Jones Newswire, June 22, 2010. http://www.automatedtrader.net/real-time-dow-jones/744/-us-senators-agree-to-shareholder-vote-on-golden-parachutes. 10 See “Proxy firm targets practice of paying executives' tax bills,” Wall Street Journal, November 24, 2008. 11 Employment might cease under a change in control. Instances may include an acquisition of the firm in which the company is not the continuing corporation, or a sale, lease, exchange or transfer of all the assets of the company.
8
of their jobs in the event of an employment termination. He argues that if correctly implemented,
golden parachutes can help reduce the conflict of interest between shareholders and managers.
B.1. Do Parachutes Induce/Deter Takeovers?
Dann and DeAngelo (1983, 1988) suggest that golden parachutes might be a symptom of
managerial entrenchment. Another view is that firms adopt golden parachutes as an anti-takeover
protection mechanism. In fact, the presence of a parachute is one of the 24 anti-takeover
provisions tracked by the RiskMetrics and indexed by Gompers, Ishii, and Metrick (2003). While
such provisions may increase a firm’s ability to defeat a takeover offer (Malatesta and Walkling,
1988), they could also enhance a target’s bargaining position with the bidder (Comment and
Schwert, 1995).
Lambert and Larcker (1985) argue that the market perceives the adoption of golden
parachute provisions as a signal of possible takeover attempts. Nonetheless, the empirical
evidence related to the parachutes’ effect on takeover probability is mixed. Machlin, Choe, and
Miles (1993) show that the adoption of a golden parachute provision is associated with a greater
likelihood of a successful takeover. In contrast, Cotter and Zenner (1994) find that potential
wealth increase from managers’ equity ownership, rather than golden parachute payouts, affects
the probability of an acquisition.
B.2. Golden Parachutes and Target Shareholder Wealth
Harris (1990) models the role of golden parachutes during mergers. She theorizes that by
awarding the target manager a parachute of the optimal size, target shareholders can maximize
their takeover gains. Harris argues that without such proper incentives, target managers may
reject bids that increase shareholder value due to their potential losses in compensation and other
9
executive benefits. The existing empirical evidence supports Harris’s predictions. Walkling and
Long (1984) show that managers’ resistance to takeover bids is related to the effect of the
acquisition on their personal wealth. Golden parachutes are designed to reduce such resistance.
Related to this, Lambert and Larcker (1985) find positive investor reactions upon the
announcement of parachute adoptions during 1975-1982. They view this finding as evidence
consistent with the incentive alignment hypothesis of golden parachutes.
B.3. Golden Parachutes and Target CEO Wealth
Almazan and Suarez (2003) theorize that depending on the quality of board monitoring,
severance pay may benefit managers and shareholders. However, if the size of parachutes is not
optimal (Harris, 1990) and board monitoring is weak, the target CEOs receiving parachutes may
deviate from maximizing the wealth of their shareholders when their firms are sold. Under this
view, commonly referred to as the managerial interest hypothesis, golden parachutes provide a
vehicle for self-serving managers to increase their own wealth.
Previous research documents that target managers may engage in self-dealing at the expense
of the target shareholders. Lefanowicz, Robinson, and Smith (2000) analyze 306 completed
acquisitions during 1980-1995 and find that golden parachutes moderate the tendency of target
managers expecting large wage losses from a merger to negotiate better offers for their firms.
Hartzell, Ofek, and Yermack (2004) study 311 completed acquisitions during 1995-1997. They
show that target CEOs may accept lower takeover premia when they receive large cash payments
in the form of special bonuses or increased golden parachutes during merger negotiations. As we
note earlier, the golden parachutes we study are those in place prior to the start of merger
negotiations.
10
B.4. Parachutes Proxies in the Extant Literature
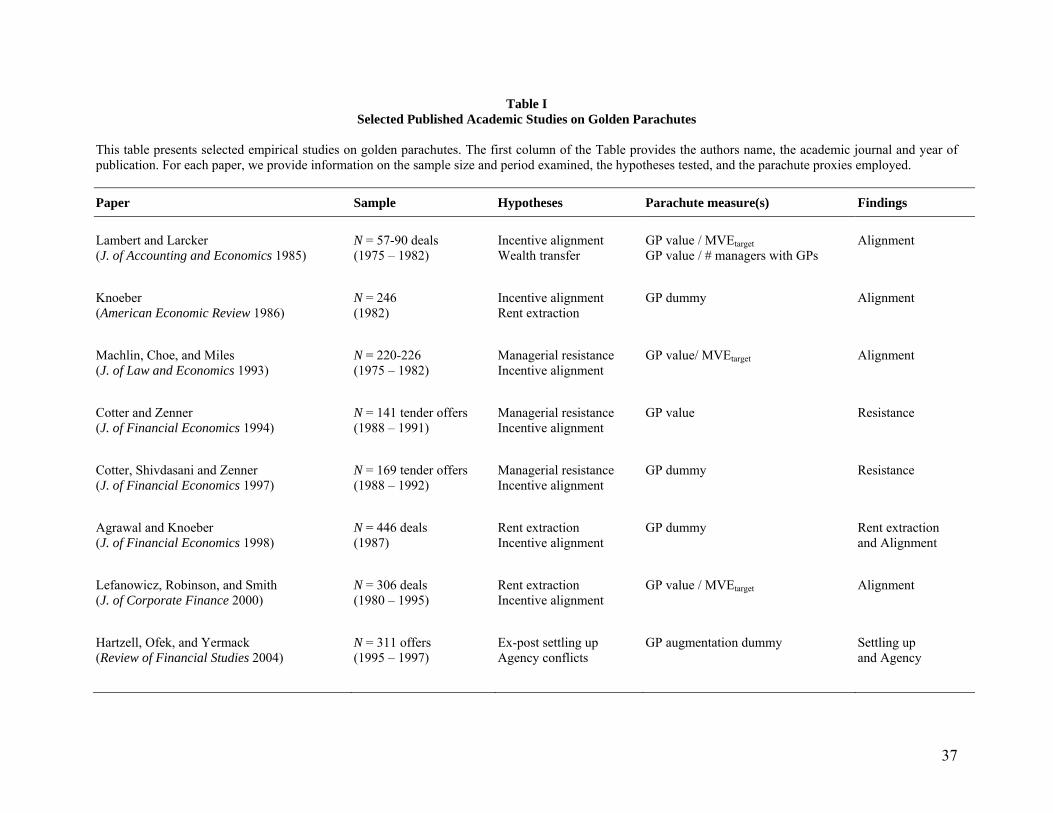
For reference, Table I presents information on selected published studies of golden
parachutes. The table reports the empirical proxies used to identify or value the parachute as well
as the hypotheses tested by each paper. A central tenet of our paper is that the moral hazard faced
by target CEOs is more likely to be influenced by the relative, not absolute, importance of
parachutes to the executive. Some empirical papers do use relative measures of golden
parachutes but not relative to an executive’s personal wealth changes. Cotter and Zenner (1994)
find that the size of golden parachute payments relative to the targets’ market capitalization is
unrelated to the acquisition premia. In contrast, Machlin, Choe, and Miles (1993) find the
opposite result. Lambert and Larcker (1985) argue that the parachute size relative to the target
size captures the increased acquisition costs to target shareholders arising from the parachute
payments. We argue that standardizing parachute size by changes in CEO wealth captures the
tradeoffs to the target CEOs making acquisition decisions. This issue is important because
parachutes are purportedly aimed at aligning the incentives of managers and shareholders.
C. Hypotheses
As the review in the preceding sections shows, the existing literature studies theories of
incentive alignment and managerial interest to explain golden parachutes. We believe that a key
element to help disentangle these alternatives relates to the tradeoffs managers face as inherent in
Harris’s (1990) discussion of the optimal size of the parachute. Nevertheless, we do not attempt
to model the characteristics or amount of the optimal pay package, or measure ‘deviations from
optimality.’ Absent a rigorous theoretical model, the optimal size of a parachute is unobservable.
However, the (unconditional) incentives of an executive to sell a firm increase linearly with the
11
size of the parachute. Despite this relation, as the literature summary in Table I shows, published
studies do not capture the effect of parachutes relative to the wealth of top managers. Our study
fills this gap in the literature.
Parachutes increase the wealth of a CEO of an acquired firm, but other elements of CEO
utility (i.e., loss of control, loss of future compensation) are still negatively impacted when the
deal is completed. Because of this imbalance, it is the relative importance of the parachute that
should be important. Put differently, relative to their total merger pay package and/or their
expected personal wealth losses, the same size parachute creates different incentives for different
executives. Therefore, in this paper we re-examine the incentive alignment and managerial
interest hypotheses of parachutes in the context of acquisitions with variables that measure the
relative impact of the parachute on managerial wealth. As described later, we scale the parachute
payment by the value of the merger pay package to the target CEO and by the expected wage
losses the executive will incur once the firm is sold, respectively. We believe that our empirical
strategy is important in recognizing the balance of incentives intrinsic in the design of
parachutes.
II. Data and Sample Characteristics
A. Sample Information
We begin with a base sample of 4,381 mergers and acquisitions announced during 1999-2007
and tracked in the Securities Data Company’s (SDC) Merger and Acquisition database. We
require the target to be a publicly traded U.S. company and exclude spinoffs, recapitalizations,
exchange offers, repurchases, self-tenders, privatizations, acquisitions of remaining interest,
12
partial interests or assets, and transactions with deal value less than $1 million. From this group,
we keep 3,521 deals in which target firms have stock return and accounting data available from
the Center for Research in Securities Prices (CRSP) and Compustat, respectively. We lose 278
deals because premium data are missing from SDC and from other sources such as CRSP,
LexisNexis, or Factiva. After filtering out deals in which governance data for target firms are not
available from RiskMetrics, our final sample consists of 851 offers. In unreported tests, we find
that the characteristics of our final sample with regard to deal completion, cash deals, tender
offers, friendly deals and same industry deals is comparable to those of SDC.
B. Target and Deal Characteristics
We report the offer characteristics for our sample in Panel A of Table II. Among the 851
transactions, about 18% are tender offers and 7% are hostile takeovers. These statistics compare
favorably to those in Officer (2003). His sample of acquisitions during 1988-2000 consists of
about 20% tender offers and 8% hostile deals. Similar to Moeller, Schlingemann and Stulz
(2005), almost 55% of the transactions in our sample are paid in cash. We find that almost 34%
of the transactions are conducted using auctions and in over 39% of all deals the target firm
initiates the sale. Aktas, de Bodt, and Roll (2010) find that in about 42% of the cases they study
target firms initiate the merger. Deals in our sample have a completion rate close to 88%, which
is similar to that in Song and Walkling (2007). They report a completion rate of 86% in their
merger sample during 1985-2001. Following Boone and Mulherin (2007), we read the S-4,
DEFM14A, SC-TO, and DEF14A proxies filed with the Securities and Exchange Commission
(SEC) by the target and/or acquiring firms. From these proxies we obtain information on the sale
procedure, the party that initiates deal negotiations, and the time merger negotiations begin.
13
Panel B of Table II contains key financial characteristics for the target firms in our sample.
For these companies, the average (median) market value of equity is $3.302 billion ($0.991
billion) and leverage accounts for 26% (25%) of total assets. These statistics are comparable to
those of Boone and Mulherin (2007) who report a mean market capitalization of $2.7 billion and
Bates and Lemmon (2003) who report an average leverage of 23.3%. In addition, targets in our
sample have a median market-to-book equity ratio of 1.42, which is close to the ratio of 1.69
reported by Officer (2003). Grinstein and Hribar (2004) report a mean deal value of $4.7 billion
for transactions which is similar to the $4.76 billion mean value in our sample.
C. Target CEO Characteristics
In Panel C of Table II, we report the target CEO’s characteristics. On average, 57% of all
CEOs also chair their boards and almost 13% are firm founders. The average (median) CEO is
54 (55) years old, owns 4.6% (1.8%) of the firm’s common equity, and has been the chief
executive for about 7 (5) years. These characteristics are in line with those in Hartzell, Ofek, and
Yermack (2004) who report the following CEO statistics: median tenure of 5 years, mean age of
54, and average equity ownership of 3.6%.
We collect compensation data from proxy statements filed by each target with the SEC. In
some instances, we supplement these data with information in the Execucomp database. Key
compensation characteristics for target CEOs in our sample appear in Panel D of Table II.
Bebchuk and Grinstein (2005) report an average of $5.01 million in total CEO
compensation.12 During the last year in office prior to the deal, the average CEO in our sample
earns $5.4 million in annual total compensation, 33% of which comes from stock-option pay. As
12 They report an average total compensation of $9.41 million for CEOs of S&P500 firms, $3.94 million for CEOs of MidCap400 firms, and $2.05 million for CEOs of SmallCap600 firms during 1993-2003.
14
we note earlier, CEOs that sell their firms forfeit the compensation they would earn if they were
to remain in office. To calculate the expected lost pay for the target CEOs we use information on
their compensation, their restricted stock, and their option holdings as reported in proxy
statements before the merger announcement. We make a number of assumptions to estimate the
expected lost compensation. First, following Hartzell, Ofek, and Yermack (2004), we assume
that all CEOs retire by age 65 and that CEOs who are at least 65 years old expect to stay in office
one more year before retiring. Second, following Yermack (2004), we assume that the
probability of departure increases by 4% each year due to acquisitions, delistings, or other
turnover reasons. Third, we assume that salary and bonus would increase by 2% from that
received during the year prior to acquisition when firm performance is above the Fama and
French (1997) median industry ROA. This assumption follows Bebchuk and Grinstein (2005),
who report a 40% increase in salary and bonus for the period 1993-2003. Fourth, we assume that
the probability of departure increases by an additional 2% the company performs below the
industry median. Finally, we use a real rate of 3% to discount cash flows. Fich and Shivdasani
(2007) estimate that the present value of lost income for CEOs expected to remain in office for
another seven years is $45.5 million. We estimate that, on average, the present value of the
expected lost compensation for target CEOs in our sample is close to $40 million. Given our
estimates, it appears that employment termination due to an acquisition triggers non-trivial
wealth losses for target CEOs.
D. Merger-Related Pay for Target CEOs
Many boards of directors provide parachutes to their CEOs. We obtain information on these
payments from the last proxy filed by the targets prior to the merger announcement, the S-4
15
proxy filed by the acquirers, and/or the DEFM14A proxy filed by the targets following the
merger announcement. Among the 851 targets, 735 (or about 86%) have a golden parachute in
place for their CEOs before merger negotiations begin.13 From the target CEO’s employment
agreement, we are able to estimate the size of the parachute. Specifically, when a parachute is
provided, the employment agreement often stipulates that the parachute payment is based on a
multiple of the executive’s regular cash compensation. Panel D of Table II shows that the mean
(median) parachute payment is $4.873 million ($2.553 million).
Section 280G of the Internal Revenue Code (IRC) states that: "if the present value of a
change-in-control payment (parachute) exceeds the safe harbor (three times the average taxable
compensation over the five most recent calendar years preceding the change-in-control, less $1),
the company loses tax deductions for these excess amounts. Additionally, the executive is
required to pay a 20% excise tax on the excess payment." Given this tax rule, it would be
reasonable to assume that most firms would set the multiple used to value a parachute to three.
However, in our sample this multiple exhibit considerable variability. According to the
information related to the multiple in Panel D of Table II, half of our target firms use a multiple
higher than 2.99. In fact, in our sample, the highest parachute valuation multiple equals 5.25.
Following Hartzell, Ofek, and Yermack (2004), we estimate the target CEO’s total merger
pay package by adding all the payments the executive receives when the deal is completed.
Specifically, this package includes common equity and stock option appreciation, the golden
parachute, and, in some instances, a special merger bonus. Equity based appreciation accounts
for more than two thirds of the package and parachutes comprise almost one third of the merger
13 We follow the procedure in Boone and Mulherin (2007) to identify the start of merger negotiations.
16
pay package for the average target CEO in our sample. The average merger pay package drawn
by target CEOs in our sample is worth almost $36 million.
E. Measures of Parachute Importance
The stated goal of golden parachutes is incentive alignment. But parachutes are only one part
of a CEO’s pay package and to truly measure alignment we must consider the relative incentives
of the entire package. Some elements of the pay package (equity, options and probably merger
related bonuses) increase directly with the size of the premia offered to the targets. Other
elements are likely to decrease with the completion of a deal and are invariant to the size of
negotiated premia (e.g. the loss of future salary). Golden parachutes are triggered by a change in
control and are also unrelated to the size of the negotiated premia. Obviously, a trivial parachute
relative to a large loss in future compensation is unlikely to motivate an executive to consent to a
takeover of his firm. Conversely, an overly generous parachute relative to other elements of the
pay package could induce a rush to sale without adequate concern for the premia offered.
Consequently, in order to truly gauge incentive alignment, it is necessary to consider parachutes
relative to the different components of the entire pay package.
Parachute payments mitigate any wealth losses target CEOs incur when their firms are sold.
These losses arise because, in most cases, targets CEOs lose their jobs as their firms cease to
exist as a standalone entity. As a result, parachutes might be particularly important for CEOs
expected to remain in office if their firms are not sold. Income losses are likely to be more acute
for these executives. This phenomenon provides an additional rationale for examining the
importance of golden parachutes relative to the expected value of lost income for target CEOs if
their companies are acquired.
17
The above discussion suggests that parachutes might play an important role in the welfare of
target CEOs when their firms are sold. In this paper, we propose two measures of their relative
importance. The first is the proportion of the parachute value in the total merger pay package.
Our second measure is the value of the golden parachute divided by the compensation target
CEOs expect to forego when their firms are acquired.
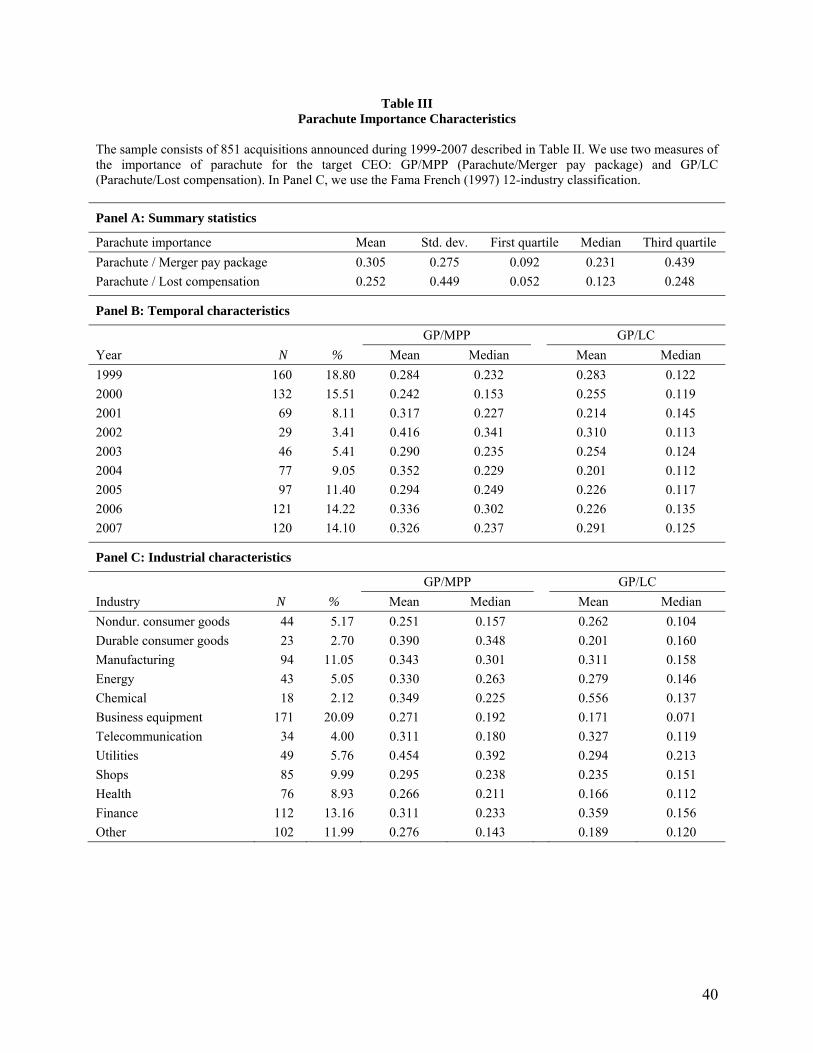
Table III, Panel A shows summary statistics for our two measures of parachute importance.
The average (median) golden parachute covers 30.5% (23.1%) of the total merger package to
target CEOs when the deal is completed. The average (median) golden parachute represents
25.2% (12.3%) of the expected lost compensation to target CEOs. In Panel B and Panel C of
Table III, we show the variation of parachute importance together with the distribution of our
sample over time and across industries, respectively. The two measures of parachute importance
are generally stable over time, albeit slightly larger in 2002. The annual number of mergers is
higher at the beginning and the end of our sample period, which coincides with periods of
economic expansion when the stock market valuation is higher. Shleifer and Vishny (2003) and
Rhodes-Kropf and Viswanathan (2004) show that stock market health drives merger activity.
The temporal distribution of our sample appears in line with the merger activity reported in these
studies. We do not find any significant variation in the parachute importance across industries,
except that parachutes seem to be particularly important in the utilities industry. The industrial
distribution of our sample is also similar to that in other research in merger and acquisitions and
to the actual distribution in the base sample from SDC. For example, Officer (2003) reports that
2.03% of his sample are firms in durable consumer goods, 17.40% in business equipment, 7.81%
in shops, and 4.62% in chemicals. The percentage of targets in our sample that belong to those
18
same industries is quite similar: 2.70%, 20.09%, 9.99%, and 2.12%, respectively. In addition, the
base acquisition sample from SDC has 22.59% of targets in business equipment, 3.84% in
telecommunications, and 8.86% in the healthcare industry. Analogously, the incidence in our
final sample is 20.09%, 4.00%, and 8.93% for those same industries, respectively.
III. Empirical Analyses
A. Determinants of Parachute Importance
In Table IV, we run a set of four Tobit models to study the importance of golden parachutes
for target CEOs in our sample.14 In the first two columns of the table, we use the size of the
golden parachute relative to the entire merger pay package as the dependent variable. In the last
two columns, we use the ratio of the golden parachute’s size to the present value of lost
compensation to the CEO as the dependent variable. The regressions control for various target,
CEO, and governance characteristics which could affect the relative importance of golden
parachutes; these are defined in the legend accompanying Table IV. All models include year and
industry-fixed effects.
Our results indicate the materiality of parachutes relative to all merger-based-pay decreases:
(a) in larger firms where, as previous research shows,15 CEOs often get paid more; (b) in
companies with high growth opportunities where equity-based pay might be more valuable; and
(c) in organizations in which the CEO is the founder. The results in model (1) of Table IV imply
that the importance of parachutes increases by 2 percentage points when the CEO is also the
chairman. This result appears consistent with the conjecture that more powerful CEOs receive
14 We run Tobit models because our measures of the relative importance of parachutes are left-hand censored. 15 See, for example, Baker (1939), Murphy (1998), and Frydman and Saks (2007).
19
larger parachutes. Other estimates imply that parachute importance increases by about 3
percentage points with a one standard deviation increase in the Gompers, Ishii, and Metrick
(2003) G index: firms with greater takeover defenses are more likely to have greater parachutes
as part of the merger-related pay.
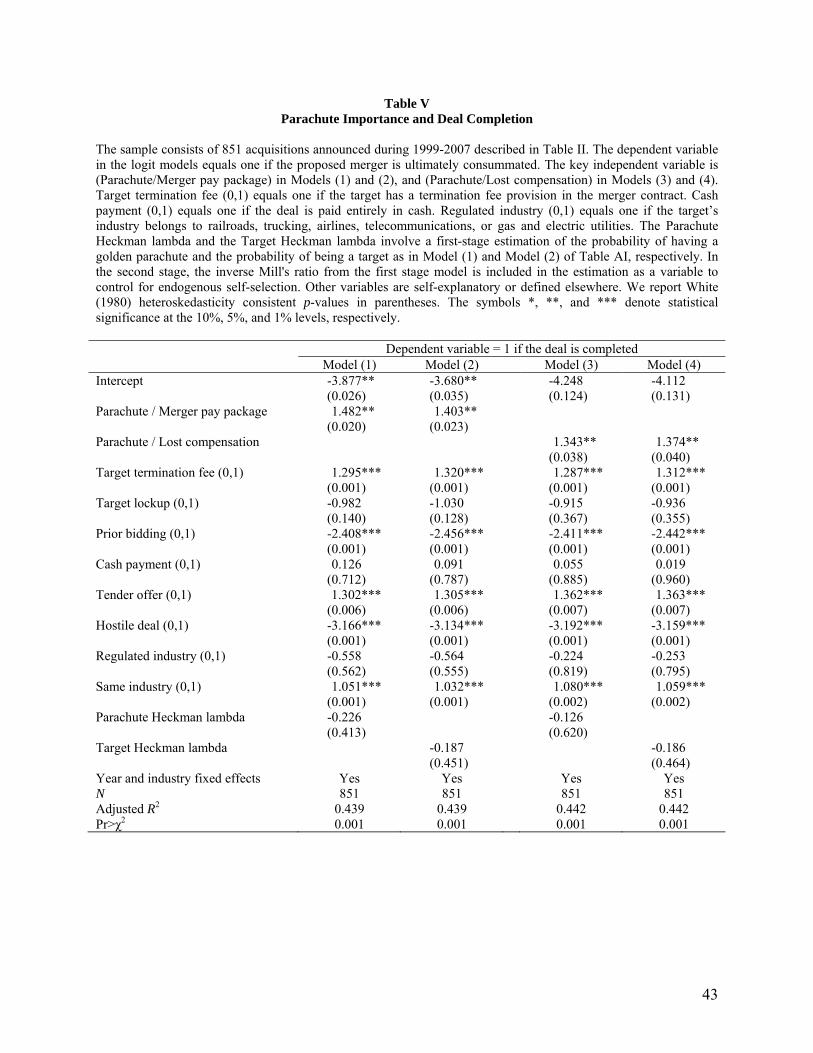
B. Parachute Importance and Merger Completion
In Table V, we examine the relation between parachute importance and deal completion. One
presumes that completed deals are beneficial to target shareholders since premia are generally
paid and in the case of mergers and tender offers the target shareholders have the option of not
approving the deal. Nevertheless, an improperly designed parachute could cause an executive to
either push for or against deal completion regardless of the premia offered to target shareholders.
In Table V, we report the estimation of four variants of a fixed-effects logit model in which the
dependent variable equals “1” for completed deals and “0” for withdrawn deals. Officer (2003),
Bates and Lemmon (2003) and Walkling (1985) estimate similar models. Therefore, the control
variables in our regressions are similar to theirs. The exceptions, of course, are our proxies of
parachute importance. Because golden parachutes are endogenously determined, in models (1)
and (3) of Table V we control for endogenous self-selection by using the Heckman (1979)
inverse Mill’s ratio (λ1). Moreover, since firms do not randomly become takeover targets, in
models (2) and (4), we control for sample selection by using a different inverse Mill’s ratio (λ2)
based on a regression of the probability of becoming an acquisition target.16
16 The Parachute Heckman self-selection and the Target Heckman self-selection involves a first-stage estimation of the probability of having a golden parachute and the probability of being a target, respectively We report these first-stage models, both of which are estimated in a sample of 14,157 firm-years, in Table AI of the Appendix. In the second stage, the inverse Mill's ratio from the first stage model is included in the estimation as a variable to control for endogenous self-selection.
20
Consistent with the literature, we find that deals are about 9.11 percentage points more likely
to materialize if there is a target termination fee. This marginal effect is comparable to that of 11
percentage points in Officer (2003). Tender offers are 4.5 percentage points more likely to go
through, as are mergers in which the parties to the deal are in the same industry. Deals are less
likely to be completed if there is prior bidding or if the deal is hostile. These results are similar to
those in Bates and Lemmon (2003).
Of primary interest is the result that deal completion increases with the importance of the
parachute. The marginal effects implied by the estimates in Table V indicate that a one standard
deviation increase in parachute importance raises the probability of deal completion by over 6
percentage points. This finding could be consistent with the incentive alignment hypothesis in
that executives are less likely to oppose or derail a deal if they have more to gain personally from
its completion. Nevertheless, deal completion is necessary for the target CEO to cash in the
parachute and the parachute payment is not based on the acquisition price the target receives.
Because of these issues, the positive relation of the parachute to deal completion could also be
consistent with the managerial interest hypothesis.
C. Parachute Importance and Acquisition Premia
We use the four-week premium reported by SDC,17 as the dependent variable in a set of ten
regressions similar to those in Walkling and Edmister (1985) and in Bargeron, Schlingemann,
Stulz, and Zutter (2008). These premium regressions are reported in Table VI. The independent
variables of interest are five different proxies based on the golden parachute payment to the
target CEO. These variables are: in model (1), the value of the parachute divided by the merger
17 Following Officer (2003) we restrict this premium measure to 2 (or 200%) to avoid extreme outliers.
21
pay package; in model (2), the value of the parachute divided by the present value of the
expected lost compensation to the target CEO; in model (3), a dummy variable set to “1” if the
CEO’s compensation contract includes a parachute provision; in model (4), the natural logarithm
of the payments we identify as golden parachute compensation; and in model (5), the multiple
used to calculate the value of the parachute. Although the first two proxies are designed to
measure the impact of the parachute on the target CEO’s wealth, all of these proxies measure the
importance of the parachute. For each proxy, we estimate the premium regression model twice:
once controlling for self-selection and then controlling for sample selection. All other
independent variables are defined in the legend accompanying Table VI.
The coefficients in model (1) of Table VI document an inverse association between
parachute importance and premia. According to the estimates in model (1), a 10 percentage point
increase in parachute importance is associated with a decline in premia of 4.97 percentage points.
This decline is economically meaningful: for the average target in our sample the lower premia
imply a shortfall of about $249 million in terms of deal value. Consequently, our findings
document severe wealth effects for shareholders in these targets.
Are the results in model (1) of Table VI driven by the fact that the offer price is used to value
the equity components of the merger pay package? To address this issue and purge the offer
price from the merger pay package, we record each target’s stock price six weeks prior to the
start of merger negotiations. We use this price and the Black-Scholes methodology to value all
the stock options held by the target CEO. Similarly, we use this price to value all stock and
restricted stock owned by the target CEO. With these new values, we re-estimate the dollar
amount the merger pay package is worth six weeks prior to the start of merger negotiations.
22
Finally, we standardize the parachute by this alternative estimate of the merger pay package.
This ratio becomes the key dependent variable in two untabulated regressions similar to those in
model (1) of Table VI. The results from these tests generate inferences similar to those tabulated:
higher parachute importance is associated with lower premia.
The estimates in model (2) of Table VI indicate that a one standard deviation increase in
parachute importance is associated with a decrease in premia of 2.38 percentage points. Such
drop in premia translates to a decline of $116 million in terms of deal value. Therefore, the result
related to lost compensation also indicates that as the relative importance of the parachute
increases, acquisition premia to the target decrease. We note that because the offer price is not
used to value the expected lost pay to the CEO, these results are immune to concerns about the
offer price driving our findings. Harris (1990) theorizes that a golden parachute that is too
generous can lead target managers to accept takeover bids that may not increase their
shareholders’ wealth. The evidence we present appears to conform to her theories.
The coefficients related to the other parachute proxies in models (3), (4), and (5) are also
negative and significant. The estimates in model (3) indicate that when the parachute has zero
importance to the target CEO takeover premia increase by 6.2 percentage points. The estimates
in model (4) imply a drop in premia of 4.84 percentage points for a $1 million dollar increase in
the value of the parachute. According to model (5), targets experience a 1.7 percentage point
decline in premia for a one unit increase in the parachute multiple. Consequently, the estimates
related to the proxies in models (3), (4), and (5) also document an inverse association between
parachute importance and takeover premia. However, the interpretation that arises from these
proxies is not as economically informative as that arising from the proxies in models (1) and (2).
23
This occurs because controlling for the presence or value of a parachute does not capture the way
these payments incentivize target CEOs. Moreover, it is possible that parachutes of the same
value (or those calculated with the same multiple) deliver very different incentives. Therefore, by
standardizing the value of the parachute by measures related to the target CEO’s wealth we are
able to more accurately assess the economic effects of parachutes during acquisitions.
The estimates of the other independent variables in Table VI are consistent with the existing
literature. For instance, we also find that acquisition premia increase with recent excess returns,
liquidity, and in deals structured as cash offers and/or tender offers. Bid premia also increase
with rumors, prior bidding, and the existence of a target termination fee. Bid premia decrease
with the size of the target firm, CEOs near retirement age, and acquisitions by private acquirers.
D. Simultaneous Regressions of Parachute Importance and Bid Premia
An important test of the incentive alignment vs. managerial interest hypotheses is the relation
of the parachute to premia paid in the acquisition. The analyses in Table VI document an inverse
association between parachute importance and takeover premia. This result of appears opposite
to the incentive alignment hypothesis of golden parachutes. However, firms expecting a low
premium if they become takeover targets might provide a more generous (and important)
parachute to their CEOs. Under this possibility, the direction of causality would be reversed and
the results in Table VI are not necessarily inconsistent with the incentive alignment hypothesis.
To address whether the endogenous choice between parachute importance and deal premia
affects the results presented in Table VI, we estimate systems of simultaneous equations
following the methodology outlined in Maddala (1983). In each system, bid premia and the
parachute proxy are provided as the two endogenous variables. The parachute variable and bid
24
premia instruments are estimated from first-stage regressions using all of the control variables in
the two equations. The second-stage tests consist of an OLS regression of bid premia on the
parachute instrument and another regression where the dependent variable is the parachute proxy
and the key independent variable is an instrument for the bid premia. The standard errors in these
regressions are adjusted for the fact that the instrumental variables for the parachute and bid
premia are estimated.
To identify the simultaneous system, we must exclude one exogenous variable from each of
the two second-stage regression equations. For the parachute equation, we must satisfy the
relevancy condition with a variable that is correlated with the parachute after controlling for all
other exogenous variables. The same variable will satisfy the exclusion restriction if it is
uncorrelated with the error term of the second-stage premium regression. For this variable we
use the CEO founder (0,1) dummy. Table IV indicates that this variable is significantly related to
our parachute proxies. Prior research by Moeller (2005) and the estimates in Table VI indicate
that the founder (0,1) dummy is unrelated to premia. For the premium equation, the variable that
we use is the target’s excess stock returns during the year prior to the acquisition. This variable
appears to satisfy the relevancy condition and the exclusion restriction. A recent study by Aktas,
deBolt, and Roll (2010), as well as results in Table VI, shows that a target’s prior excess return is
related to the bid premium. Evidence in Table IV and Table AI indicates that the excess return
variable is not related to parachute importance.
Table VII presents our simultaneous equations analyses. In Panel A of Table VII we use the
importance of the parachute relative to the lost compensation as our proxy for the parachute. In
that panel, we report the two first-stage regressions as well as the two second-stage regressions.
25
After accounting for endogeneity, the parachute instrument in the second-stage premium
regression is negative and statistically significant. In contrast, the premium instrument in the
second-stage parachute regression is not significantly different from zero. This last result
indicates that bid premia are unrelated to the importance of the parachute and provides no
evidence of causation running in the reverse direction.
In Panel B of Table VII we use the other four parachute proxies described earlier. For each of
these proxies, we also estimate a simultaneous system consisting of two first-stage and two
second-stage regressions. However, to conserve space, we only report the two second-stage
regressions for each system. The tests in Panel B of Table VII also document an inverse and
statistically significant association between the golden parachute instrument and bid premia. The
same tests also reveal no association between the premium instrument and the golden parachute
variables. Collectively, the findings of our simultaneous equations analyses also support the
managerial interest hypothesis of parachutes.
E. Anticipation Effects of Golden Parachutes on Bid Premia
It is no surprise to the market that many firms offer parachutes to their CEOs. Therefore, the
anticipated effect of a parachute would be incorporated in stock prices and takeover premia. To
recognize this, we follow the methodology of Comment and Schwert (1995) and replace the (0,1)
indictor for the presence of a parachute with variables related to the anticipated and surprise
components of the parachute. These components are estimates from the parachute prediction
regression reported as model (1) of Table AI. We estimate this prediction regression in a sample
of 14,157 firm-years with data available from CRSP, Compustat, and RiskMetrics during 1999-
2007. The predictable component is an estimate of the probability that the target CEO’s
26
compensation contract includes a parachute provision. The surprise component is computed as
the parachute indicator minus the estimated probability that the target CEO has a golden
parachute.
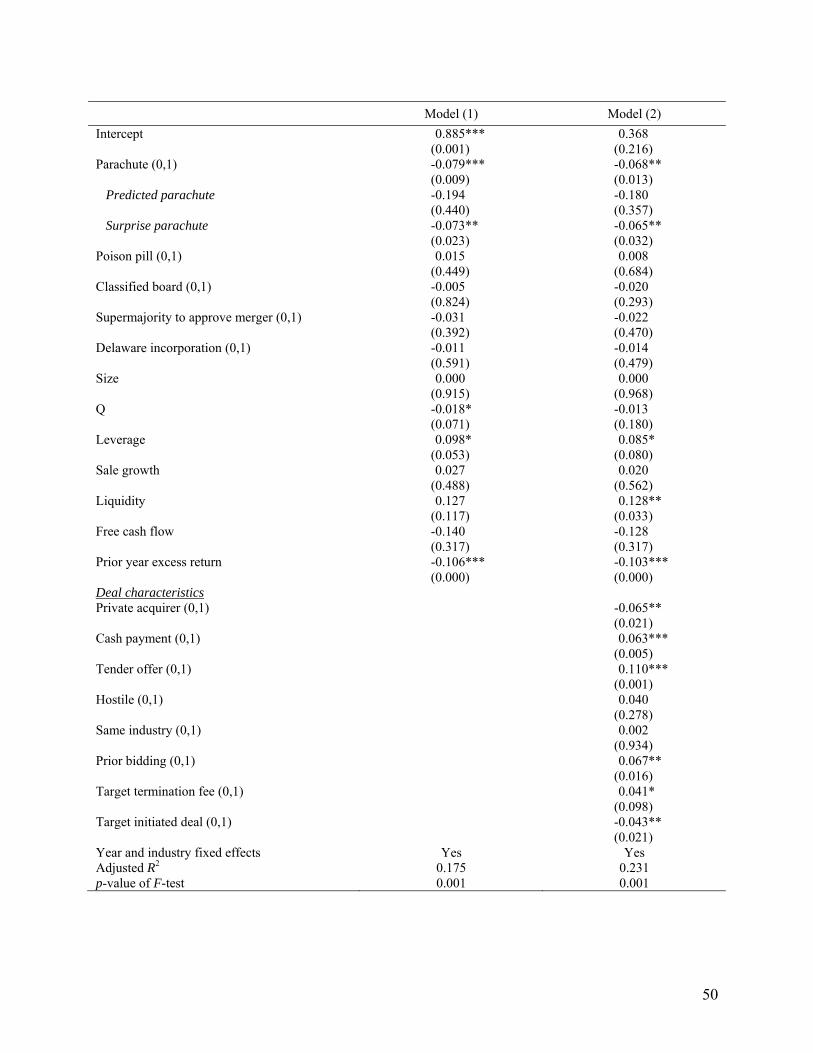
Table VIII presents two regressions of the takeover premium in which the parachute
components are the independent variables of interest. For reference and in the spirit of Comment
and Schwert (1995), in both tests we include the estimate for the golden parachute dummy from
separate similarly structured premium regressions that do not include the golden parachute
components.
The coefficient on the surprise parachute variable in Table VIII is negative and significant,
indicating that the unanticipated effect of a parachute is associated with lower bid premia. In
contrast, the predictable parachute component does not attain statistical significance in the
regressions in Table VIII. Therefore, the most we can conclude is that the known existence of
golden parachutes is already impounded in a target’s value. Nonetheless, this conclusion is
important because it validates the view that it is not the mere presence of a parachute, but its
relative importance to the target CEO, that matters. Put differently, whereas markets know that
target CEOs have parachutes before a merger, it is impossible for markets to anticipate the
relative importance of a parachute absent foreknowledge of the terms of the deal. Consequently,
it is plausible that the unanticipated negative effect captured by the surprise parachute variable in
Table VIII reflects the amount by which parachutes wind up insulating target CEOs from
personal losses. Under this view, the surprise parachute variable identifies the degree to which
the target CEO is susceptible to moral hazard.
27
IV. Additional Tests
A. Takeover Premia Alternatives
The estimates presented in Tables VI, VII and VIII are based on the four-week premium
reported by SDC. We re-estimate all premia using the combined premium method in Officer
(2003). Following his approach, we first estimate a premium based on “component” data using
the aggregate value of cash, stock, and other securities offered by the bidder to target
shareholders as reported by SDC. We then estimate premia based on “initial price” and “final
price” data based on the initial offer and final offer price, respectively. These prices are also
reported by SDC. All three premium measures are deflated by the target’s market value 42
trading days prior to the bid announcement. The “combined” premium is based on the
“component” measure if it is greater than 0 and less than 2; otherwise the premium relies on the
“initial price” measure (or on the “final price” measure if initial price data are missing).
Using the combined premium, the multivariate results in Table VI are as follows. In model
(1A), the coefficient on the importance of the parachute relative to the merger pay package
(GP/MPP) is -0.549 (p-value <0.001).18 The marginal effect associated with this estimate implies
that a 10 percentage point increase in parachute importance causes target firms to earn a
premium 5.49 percentage points lower. This shortfall triggers a decline of $276.39 million in
deal value for the average sample target. This result is similar to those tabulated.
We also replace the four-week premium with the cumulative abnormal return (CAR) accruing
to sample targets running from 20 days before the deal announcement (AD-20) until the day after
18 With regards to Table VI, model (2A), the coefficient on Parachute / Lost compensation is -0.069 (p-value = 0.056). This estimate implies that a one standard deviation increase in parachute importance causes target firms to earn a premium that is 3.10 percentage points lower.
28
(AD+1). Using the CAR (AD-20, AD+1) as the premium proxy, the results in Table VI generate
inferences similar to those reported. For example, in model (1A) of the table, the coefficient on
GP/MPP changes to -0.274 (p-value <0.001). This estimate implies that a 10 percentage point
increase in parachute importance is associated with a decrease in deal value of $134.04 million.
B. Tax Regulations and the Sarbanes-Oxley Act
On February 19, 2002, the Internal Revenue Service proposed new regulations to Section
280G of the Internal Revenue Code (IRC).19 The new regulations provide amendments and
clarifications to the regulations issued on May 5, 1989, and apply to golden parachutes payments
occurring on or after January 1, 2004. The amendments clarify that the safe harbor related to
change-in-control payments is three times the average taxable compensation over the five most
recent calendar years prior to the change-in-control. The amendments also states that a company
that exceeds the safe harbor will lose tax deductions for the excess amounts and that the
executive would be liable for a 20% excise tax on the excess payment.
A 2008 study by RiskMetrics finds that the new tax regulations have done little to reduce
golden parachute payments.20 In particular, the study reports that two-thirds of the companies in
the S&P 500 index disclose that they would provide excise tax gross-ups to one or more top
executives. The excise tax gross-ups essentially free the executive from personally paying the
excise tax on excess parachute payments. The RiskMetrics study shows that excise tax gross-ups
are a costly benefit, since it generally takes at least $2.50 and as much as $4 to cover each $1 of
excise tax that must be “grossed-up.” In addition, other companies that do not provide the gross-
19 See: REG-209114-90 at http://www.irs.gov/pub/irs-regs/20911490.pdf 20 See: “Gilding Golden Parachutes: the Impact of Excise Tax Gross-Ups” by Kosmas Papadopoulos at http://www.riskmetrics.com/docs/2008ExciseTax
29
up benefit may increase parachute payments in order to mitigate the excise tax to their
executives. For our purposes, it is possible that the new Section 280G rules may have affected
the size of golden parachutes, and, in turn, the relative importance of these payments.
To investigate the potential effect of the new tax rules on parachutes, we revisit the
regressions reported in Table IV related to the relative importance of parachutes. In model (1) of
the table, we include a dummy variable for deals initiated after February 19, 2002. The estimate
for this variable (0.048, p-value = 0.026) indicates that parachute importance relative to the
merger pay package increases by about 4.8 percentage points. While this result is consistent with
the idea that some firms increase parachutes in response to the new proposed tax rules,
alternative explanations are possible. For instance, as a result of the new rules contained in the
Sarbanes-Oxley Act of 2002, many firms curbed the equity-based pay given to top managers
while increasing their base salary (Chhaochharia and Grinstein, 2009). This pay redistribution
could partially account for the increase in importance of golden parachutes we uncover after
2002.
C. Changes of Parachute Importance during Merger Negotiations
The vast majority of parachutes we examine are in place in the CEOs’ compensation contract
before their firms become takeover targets. We note that 116 out of 851 target CEOs in our
sample (about 14%) do not have a parachute prior to the start of merger negotiations. However,
23 of the 116 firms that do not offer a parachute put one in place once merger talks begin. In
addition, 30 of the 735 firms that do have parachutes for their CEOs raise their value during
merger negotiations. Removing these 53 observations from our sample does not alter our results.
In addition, we run a premium regression similar to those in Table VI in which the key
30
independent variable is a dummy that is “1” if targets either augment the size of an existing
parachute or put one in place (the 53 cases described above). The estimate for this variable is
negative but not statistically significant. This result is similar to that in Hartzell, Ofek, and
Yermack (2004).
Even if parachutes are not revised, their relative importance could fluctuate when other parts
of the merger pay package change during deal negotiations. For example, an unexpected
alteration of the equity ownership and/or the option grants held by the target CEO could change
the relative importance of the parachute. To consider this issue, we create a (0,1) variable that is
set to “1” if, during merger negotiations, the target CEO’s receives stock, restricted stock, or
stock option grants. We re-estimate the premium regressions in Table VI with this indicator as an
additional control variable. The results related to our golden parachute proxies are robust to the
inclusion of this variable to the tests. For instance, with the new control variable in the
regression, the estimate on the GP/MPP variable changes from -0.497 (p-value < 0.001) to -0.489
(p-value < 0.001).
D. Target CEOs near Retirement
Earlier, we argue that parachutes might be rather important for CEOs expected to remain in
office for several years. This argument is based on the idea that these executives will lose the pay
and benefits of being CEO when their firms are sold. As a result, parachutes make them partially
whole for such loss. A plausible inference related to this argument is that the relative importance
of parachutes decreases as the CEO approaches retirement. To the tests reported in Table IV we
add an independent variable, labeled “years to retirement,” that subtracts the target CEO’s age
from 65. This variable, which uses the retirement age threshold in Hartzell, Ofek, and Yermack
31
(2004), is set to “0” for negative values (instances in which the CEO is still in office past the
retirement age). The estimate on the years to retirement variable (-0.0196, p-value<0.001)
indicates that every year the target CEO approaches retirement raises the importance of the
parachute relative to the expected lost compensation by about 1.96 percentage points. This result
is consistent with the fact as CEOs approach retirement their expected lost compensation
decreases.
V. Conclusions
In recent years, the controversy surrounding golden parachutes has intensified. Opponents of
parachutes claim that it is unfair to provide managers with a financial safety net regardless of the
fortunes of shareholders. Advocates of parachutes view them as an indispensable part of a
competitive compensation package required to attract and retain highly qualified human capital.
From an academic perspective, this controversy can be summarized with the following research
question: Do parachutes align the incentives of the managers receiving them and the
shareholders in the firms that grant them? We frame this question in the context of well-known
hypotheses in corporate finance: incentive alignment and managerial interest. We examine these
hypotheses in a sample of 851 acquisitions during 1999-2007.
The hypotheses we study continue to receive considerable attention because they are well
suited in situations susceptible to agency problems. In our case, the problem is a form of moral
hazard. If a parachute insulates target CEOs from a severe personal wealth loss related to a
takeover of their firm, they may behave differently than if they were fully exposed to the loss.
32
Such behavior may be detrimental for shareholders if it generates either a ‘rush to sale’ or
‘unyielding resistance’ regardless of the acquisition price offered.
We propose two different proxies to assess the degree by which golden parachutes protect
target CEOs from acquisition-related personal losses. The first proxy scales the size of the
parachute by the total merger-related pay target CEOs receive; the second scales it by the
expected lost compensation target CEOs incur when their firms are sold. These proxies are
unlike those in the extant literature that either track the presence of a parachute or appraise the
increased acquisition costs related to the parachute. Because our proxies measure the relative
importance of the parachute to the target CEO, they provide a new, unique, and economically
informative prism to examine our hypotheses.
We show that the motivation to sell a target and complete a deal increases with the relative
importance of parachutes. On the surface, this finding appears consistent with the incentive
alignment hypothesis. However, because parachute payments are contingent on deal completion
it is possible that target CEOs sacrifice premia for personal gain. Consequently, we test our
hypotheses by examining the relation between parachute importance and shareholder wealth.
The empirical analyses related to the benefits of parachutes to target CEOs and target
shareholders indicate that these payments have a material and diverging effect on the wealth of
these parties. Based on our analyses of premia paid for targets in our sample, we estimate that
parachutes cost target firms several percentage points in potential acquisition premium. For the
average target CEO in our sample, parachutes represent 30.5% or $4.9 million of the pay
package the executive receives when the target is sold. In contrast, a 10% increase in parachute
importance relative to the merger pay package is associated with a deficit in premia of about 4.97
33
percentage points. This shortfall implies a reduction of $249 million in deal value for the average
acquisition in our sample. Therefore, the financial costs to target shareholders in firms offering
overly important parachutes considerably surpass the benefits received by their CEOs. These
results, which obtain under different empirical specifications, tests for endogeneity, and controls
for other econometric biases, support the managerial interest hypothesis.
Our findings contribute to the ongoing debate over the effectiveness of executive
compensation in general and over the effectiveness of golden parachutes in particular. We show
that relatively more important parachutes benefit target shareholders by increasing the likelihood
that a merger is completed. However, our results also suggest that inappropriately designed
parachutes create a conflict of interest between target CEOs and target shareholders at the onset
of a merger. In our study, this conflict manifests as moral hazard. Indeed, our analyses indicate
that as target CEOs become more insulated from personal losses due to relatively larger
parachutes, target shareholders obtain less favorable acquisition terms.
34
References Agrawal, A., and Knoeber, C., 1998, Managerial compensation and the threat of takeover, Journal of Financial Economics 47, 219-339. Aktas, N., de Bodt, E., and Roll, R., 2010, Negotiations under the threat of an auction, Journal of Financial Economics, forthcoming. Almazan, A., and Suarez, J., 2003, Entrenchment and severance pay in optimal governance structures, Journal of Finance 58, 519-547. Baker, J., 1939, Executive compensation payments by large and small industrial companies, Quarterly Journal of Economics 53, 404-434. Bargeron, L., Schlingemann, F., Stulz, R., and Zutter, C., 2008, Why do private acquirers pay so little compared to public acquirers? Journal of Financial Economics 89, 375-390. Bargeron, L., Schlingemann, F., Stulz, R., and Zutter, C., 2009, Do target CEOs sell out their shareholders to keep their job in a merger? Working paper, The Ohio State University. Bates, T.W., and Lemmon, M.L., 2003, Breaking up is hard to do? An analysis of termination fee provisions and merger outcomes, Journal of Financial Economics 69, 469-504. Bebchuk, L.A., and Grinstein, Y., 2005, The growth of executive pay, Oxford Review of Economic Policy 21, 283-303. Berkovitch, E., and Khanna, N., 1991, A theory of acquisition markets: mergers versus tender offers, and golden parachutes, Review of Financial Studies 4, 149-174. Boone, A., and Mulherin, J.H., 2007, How are firms sold? Journal of Finance 62, 847-875. Chhaochharia, V., and Grinstein, Y., 2009, CEO compensation and board oversight, Journal of Finance, forthcoming. Comment, R., and Schwert, G.W., 1995, Poison or placebo? Evidence on the deterrence and wealth effect of modern antitakeover measures, Journal of Financial Economics 39, 3-43. Cotter, J.F., Shivdasani, A., and Zenner, M., 1997, Do independent directors enhance target shareholder wealth during tender offers? Journal of Financial Economics 43, 195-218. Cotter, J.F., and Zenner, M., 1994, How managerial wealth affects the tender offer process, Journal of Financial Economics 35, 63-97. Dann, L.Y., and DeAngelo, H., 1983, Standstill agreements, privately negotiated stock repurchases and the market for corporate control, Journal of Financial Economics, 11, 275-300. Dann, L.Y., and DeAngelo, H., 1988, Corporate financial policy and corporate control: A study of defensive adjustments in asset and ownership structure, Journal of Financial Economics, 20, 87-127.
35
Fama, E., and French, K., 1997, Industry costs of equity, Journal of Financial Economics 43, 153-193. Fich, E.M., and Shivdasani, A., 2007, Financial fraud, director reputation, and shareholder wealth, Journal of Financial Economics 86, 306-336. Frydman, C., and Saks, R.E., 2007, Executive compensation: a new view from long-term perspective, SSRN Working Paper, AFA 2008. Gompers, P., Ishii, J., and Metrick, A., 2003, Corporate governance and equity prices, Quarterly Journal of Economics 118, 107-155. Grinstein, Y., and Hribar, P., 2004, CEO compensation and incentives: evidence from M&A bonuses, Journal of Financial Economics 73, 119-143. Hall, B., and Liebman, J., 1998, Are CEOs really paid like bureaucrats? Quarterly Journal of Economics 113, 653-691. Harris, E., 1990, Antitakeover measures, golden parachutes, and target firm shareholder welfare, RAND Journal of Economics 21, 614-625. Hartzell, J.C., Ofek, E., and Yermack, D., 2004, What’s in it for me? CEOs whose firms are acquired, Review of Financial Studies 17, 37-61. Hausman, J.A., and Taylor, W.E., 1981, Panel data and unobservable individual effects, Econometrica 49, 1377-1398. Heckman, J., 1979, Sample selection bias as a specification error, Econometrica 47, 153-161. Jensen, M.C., and Meckling, W.H., 1976, Theory of the firm: managerial behavior, agency costs, and ownership structure, Journal of Financial Economics 3, 305-360. Jensen, M.C., 1988, Takeovers: their causes and consequences, Journal of Economic Perspectives 2, 21-48. Knoeber, C., 1986, Golden parachutes, shark repellents, and hostile takeovers, American Economic Review 76, 155-167. Lambert, R.A., and Larcker, D.F., 1985, Golden parachutes, executive decision-making, and shareholder wealth, Journal of Accounting and Economics 7, 179-203. Lefanowicz, C.E., Robinson, J.R., and Smith, R., 2000, Golden parachutes and managerial incentives in corporate acquisitions: evidence from the 1980s and 1990s, Journal of Corporate Finance 6, 215-239. Machlin, J., Choe, H., and Miles, J.A., 1993, The effects of golden parachutes on takeover activity, Journal of Law and Economics 36, 861-876. Maddala, G.S., 1983, Limited Dependent and Qualitative Variables in Econometrics (Cambridge University Press, Cambridge, MA).
36
Malatesta, P.H., and Walkling, R.A., 1988, Poison pill securities: stockholder wealth, profitability, and ownership structure, Journal of Financial Economics 20, 347-376. Malmendier, U., and Tate, G., 2005, CEO overconfidence and corporate investment, Journal of Finance 60, 2661-2700. Moeller, S., Schlingemann, F., and Stulz, R., 2005, Wealth destruction on a massive scale? A study of acquiring-firm returns in the recent merger wave, Journal of Finance 60, 757-782. Moeller, T., 2005, Let’s make a deal! How shareholder control impacts merger payoffs, Journal of Financial Economics 76, 167-190. Murphy, K.J., 1998, Executive compensation, Handbook of Labor Economics, Ashenfelter, O. and Card, D. (Editors), Vol. 3, North Holland. Officer, M.S., 2003, Termination fees in mergers and acquisitions, Journal of Financial Economics 69, 431-467. Rhodes-Kropf, M., and Viswanathan, S., 2003, Market valuation and merger waves, Journal of Finance 59, 2685-2718. Shleifer, A., and Vishny, R.W., 2003, Stock market driven acquisitions, Journal of Financial Economics 70, 295-489. Song, M.H., and Walkling, R.A., 2007, Anticipation, acquisitions, and bidder returns, Working paper, Drexel University. Walkling, R.A., 1985, Predicting tender offer success: a logistic analysis, Journal of Financial and Quantitative Analysis 20, 461-478. Walkling, R.A., and Edmister, R.O., 1985, Determinants of tender offer premiums, Financial Analysts Journal 41, 27-37. Walkling, R.A., and Long, M., 1984, Agency theory, managerial welfare, and takeover bid resistance, RAND Journal of Economics 15, 54-68. White, H., 1980, A heteroskedasticity-consistent matrix and direct test for heteroskedasticity, Econometrica 48, 817-838. Yermack, D., 2004, Remuneration, retention, and reputation incentives for outside directors, Journal of Finance 59, 2281-2308.
37
Table I Selected Published Academic Studies on Golden Parachutes
This table presents selected empirical studies on golden parachutes. The first column of the Table provides the authors name, the academic journal and year of publication. For each paper, we provide information on the sample size and period examined, the hypotheses tested, and the parachute proxies employed.
Paper Sample Hypotheses Parachute measure(s) Findings
Lambert and Larcker (J. of Accounting and Economics 1985)
N = 57-90 deals (1975 – 1982)
Incentive alignment Wealth transfer
GP value / MVEtarget
GP value / # managers with GPs Alignment
Knoeber (American Economic Review 1986)
N = 246 (1982)
Incentive alignment Rent extraction
GP dummy
Alignment
Machlin, Choe, and Miles (J. of Law and Economics 1993)
N = 220-226 (1975 – 1982)
Managerial resistance Incentive alignment
GP value/ MVEtarget
Alignment
Cotter and Zenner (J. of Financial Economics 1994)
N = 141 tender offers (1988 – 1991)
Managerial resistance Incentive alignment
GP value
Resistance
Cotter, Shivdasani and Zenner (J. of Financial Economics 1997)
N = 169 tender offers (1988 – 1992)
Managerial resistance Incentive alignment
GP dummy
Resistance
Agrawal and Knoeber (J. of Financial Economics 1998)
N = 446 deals (1987)
Rent extraction Incentive alignment
GP dummy
Rent extraction and Alignment
Lefanowicz, Robinson, and Smith (J. of Corporate Finance 2000)
N = 306 deals (1980 – 1995)
Rent extraction Incentive alignment
GP value / MVEtarget Alignment
Hartzell, Ofek, and Yermack (Review of Financial Studies 2004)
N = 311 offers (1995 – 1997)
Ex-post settling up Agency conflicts
GP augmentation dummy
Settling up and Agency
38
Table II Sample Description
This table describes our sample which consists of 851 mergers and acquisitions announced during 1999-2007 and tracked in the Securities Data Company’s (SDC) merger and acquisition database in which the target is a publicly traded U.S. company and the deal value is at least $1 million. For selecting the sample, we require that target firms have stock return, accounting, and governance data available from the Center for Research in Security Prices (CRSP), Compustat, and RiskMetrics (formerly the Investor Responsibility Research Center) database, respectively. In Panel A, deal status, mode of acquisition, method of payment, and deal attitude are obtained from SDC. As in Officer (2003), we classify a deal as a hostile takeover if the bid is recorded by SDC as ‘‘hostile’’ or ‘‘unsolicited’’. Information on sale procedure and initiator is obtained from reading the merger background filed with the SEC. As in Boone and Mulherin (2007), auction refers to cases in which the selling firm contacts multiple potential buyers while negotiation focuses on a single buyer. Initiator is the party that first contacts the other party in the sale process. A deal is in the same industry if both the target and the acquirer belong to the same Fama and French (1997) 48-industry classification. In Panel B, all financial variables are measured at the end of the fiscal year before the merger announcement date. Market-to-book is market value of equity divided by book value of equity. Leverage equals the book value of debts divided by market value of assets. Deal value is obtained from SDC. In Panel C, ownership is the percentage of stock and options owned by the CEO. Market value of ownership is measured as of 20 trading days before the announcement date. In Panel D, compensation data are as of the end of the fiscal year before the announcement date. Merger pay package includes payments from the parachute, common equity, the merger bonus, and stock options. Estimated lost compensation is the estimated present value of the CEO’s lost compensation when his/her firm is sold. We obtain information on the golden parachute payment from the last proxy filed by the targets prior to the merger announcement, the S-4 proxy filed by the acquirers, and/or the DEFM14A proxy filed by the targets following the merger announcement.
39
Panel A: Deal characteristics
Mean Median
Completion (0,1) 0.878
Tender offer (0,1) 0.182
Stock payment (0,1) 0.162
Cash payment (0,1) 0.549
Hostile takeover (0,1) 0.069
Auction (0,1) 0.337
Target initiated (0,1) 0.393
Same industry (0,1) 0.561
Deal value ($ billion) 4.758 1.544
Panel B: Target characteristics
Mean Median
Market value ($ billion) 3.302 0.991
Market-to-book 1.734 1.422
Leverage 0.260 0.248
ROA 0.084 0.074
Age (years) 48.710 33.833
Deal value ($ billion) 4.758 1.544
Panel C: Target CEO characteristics
Mean Median
Chairman (0,1) 0.570
Founder (0,1) 0.128
Compensation committee member (0,1) 0.013
Age (years) 54.390 55.000
Tenure (years) 7.165 4.786
Ownership (%) 4.632 1.836
Market value of ownership ($ million) 96.079 22.728
Panel D: Target CEO compensation and golden parachute characteristics
Mean First quartile Median Third quartile
Salary and bonus ($ million) 1.662 0.636 0.940 1.525
Total compensation ($ million) 5.366 1.170 2.615 5.022
Parachute (0,1) 0.864
Parachute multiple 2.225 2.000 2.999 3.000
Parachute value ($ million) 4.873 1.482 2.553 4.573
Lost compensation ($ million) 39.896 7.501 16.387 36.524
40
Table III Parachute Importance Characteristics
The sample consists of 851 acquisitions announced during 1999-2007 described in Table II. We use two measures of the importance of parachute for the target CEO: GP/MPP (Parachute/Merger pay package) and GP/LC (Parachute/Lost compensation). In Panel C, we use the Fama French (1997) 12-industry classification.
Panel A: Summary statistics
Parachute importance Mean Std. dev. First quartile Median Third quartile
Business equipment 171 20.09 0.271 0.192 0.171 0.071
Telecommunication 34 4.00 0.311 0.180 0.327 0.119
Utilities 49 5.76 0.454 0.392 0.294 0.213
Shops 85 9.99 0.295 0.238 0.235 0.151
Health 76 8.93 0.266 0.211 0.166 0.112
Finance 112 13.16 0.311 0.233 0.359 0.156
Other 102 11.99 0.276 0.143 0.189 0.120
41
Table IV Determinants of Parachute Importance
The sample consists of 851 acquisitions announced during 1999-2007 described in Table II. The dependent variable is (Parachute/Merger pay package) in Tobit models (1) and (2), and (Parachute/Lost compensation) in Tobit models (3) and (4). All financial variables are measured at the end of the fiscal year before the merger announcement date. Q is defined as the book value of assets minus the book value of equity plus the market value of equity, divided by the book value of assets. Free cash flow is operating income before depreciation minus interest expenses, income taxes, and capital expenditures, scaled by book value of total assets. Firm age is the number of years from incorporation until the merger announcement date. G index is constructed by adding 24 antitakeover provisions tracked by RiskMetrics as in Gompers, Ishii, and Metrick (2003). Tenure is the number of years the CEO has been in the chief executive position until the merger announcement date. Insider ownership and institutional ownership are the percentage of common stock owned by each group, respectively. Percent of independent directors is the fraction of independent directors on board. All ownership variables are measured as a % of common equity. Other variables are self-explanatory or defined elsewhere. We report White (1980) heteroskedasticity consistent p-values in parentheses. The symbols *, **, and *** denote statistical significance at the 10%, 5%, and 1% levels, respectively.
The sample consists of 851 acquisitions announced during 1999-2007 described in Table II. The dependent variable in the logit models equals one if the proposed merger is ultimately consummated. The key independent variable is (Parachute/Merger pay package) in Models (1) and (2), and (Parachute/Lost compensation) in Models (3) and (4). Target termination fee (0,1) equals one if the target has a termination fee provision in the merger contract. Cash payment (0,1) equals one if the deal is paid entirely in cash. Regulated industry (0,1) equals one if the target’s industry belongs to railroads, trucking, airlines, telecommunications, or gas and electric utilities. The Parachute Heckman lambda and the Target Heckman lambda involve a first-stage estimation of the probability of having a golden parachute and the probability of being a target as in Model (1) and Model (2) of Table AI, respectively. In the second stage, the inverse Mill's ratio from the first stage model is included in the estimation as a variable to control for endogenous self-selection. Other variables are self-explanatory or defined elsewhere. We report White (1980) heteroskedasticity consistent p-values in parentheses. The symbols *, **, and *** denote statistical significance at the 10%, 5%, and 1% levels, respectively. Dependent variable = 1 if the deal is completed Model (1) Model (2) Model (3) Model (4) Intercept -3.877** -3.680** -4.248 -4.112 (0.026) (0.035) (0.124) (0.131) Parachute / Merger pay package 1.482** 1.403** (0.020) (0.023) Parachute / Lost compensation 1.343** 1.374** (0.038) (0.040) Target termination fee (0,1) 1.295*** 1.320*** 1.287*** 1.312*** (0.001) (0.001) (0.001) (0.001) Target lockup (0,1) -0.982 -1.030 -0.915 -0.936 (0.140) (0.128) (0.367) (0.355) Prior bidding (0,1) -2.408*** -2.456*** -2.411*** -2.442*** (0.001) (0.001) (0.001) (0.001) Cash payment (0,1) 0.126 0.091 0.055 0.019 (0.712) (0.787) (0.885) (0.960) Tender offer (0,1) 1.302*** 1.305*** 1.362*** 1.363*** (0.006) (0.006) (0.007) (0.007) Hostile deal (0,1) -3.166*** -3.134*** -3.192*** -3.159*** (0.001) (0.001) (0.001) (0.001) Regulated industry (0,1) -0.558 -0.564 -0.224 -0.253 (0.562) (0.555) (0.819) (0.795) Same industry (0,1) 1.051*** 1.032*** 1.080*** 1.059*** (0.001) (0.001) (0.002) (0.002) Parachute Heckman lambda -0.226 -0.126 (0.413) (0.620) Target Heckman lambda -0.187 -0.186 (0.451) (0.464) Year and industry fixed effects Yes Yes Yes Yes N 851 851 851 851 Adjusted R2 0.439 0.439 0.442 0.442 Pr>χ2 0.001 0.001 0.001 0.001
44
Table VI Golden Parachutes and Acquisition Premia
The sample consists of 851 acquisitions announced during 1999-2007 described in Table II. The dependent variable in the OLS models is the acquisition premium as reported by SDC, which is calculated as the offer price divided by the target’s stock price four weeks before the merger announcement date. The key independent variable in Model (1) is the importance of the parachute relative to the merger pay package. Model (2) uses the parachute importance relative to the expected lost compensation to the target CEO as the main independent variable. Model (3) uses the parachute (0,1) as the key independent variable. The independent variable of interest in model (4) is the natural log of the parachute payment to the target CEO. The main independent variable in model (5) is the parachute multiple. Prior year excess return is the cumulative abnormal return during the one year window ending 20 trading days prior to the merger public announcement, calculated from the market model using the CRSP value-weighted return as the benchmark with an estimation period of one year prior to the beginning of the above window. A CEO is near retirement age when s/he is at least 62 years old at the time of the acquisition. Overconfident CEO (0,1) is defined as Malmendier and Tate’s (2005) long-holder measure and follows Hall and Liebman’s (1998) option classification procedure. It equals one if the target firm’s CEO owns options at the beginning of the last year of the options’ life that are at least 40% in the money. CEO employment (0,1) equals one if the target CEO already holds or obtains either a directorship position or an executive appointment such as CEO of the acquirer or a subsidiary, chief financial officer, chief operating officer, chairman, vice-chairman, president, or vice-president in the combined firm after deal completion. In case of withdrawn deals, it equals one if the CEO does not leave the target firm within a year after the withdrawal date. Rumor (0,1) equals one if the deal is rumored as reported in SDC. Litigation (0,1) equals one if the deal has associated litigation reported in SDC. Time to completion measures the number of days to close the transaction from the time it is announced. One year change in IP index is the difference in the industrial production index over one year period before the merger. Other variables are self-explanatory or defined elsewhere. All regressions include year and industry fixed effects. The symbols *, **, and *** denote statistical significance at the 10%, 5%, and 1% levels, respectively.
This table reports simultaneous equations regressions in which we treat golden parachute and acquisition premium as endogenous variables. We analyze 851 acquisitions announced during 1999-2007 described in Table II. We report simultaneous equations results using the relative importance of parachute to the lost compensation in Panel A and those using the relative importance of parachute to the merger pay package, the parachute dummy, the parachute value, and the parachute multiple in Panel B. The instruments in the second stage regressions equal the fitted value from the first stage regression. We use probit regressions when the dependent variable is the parachute dummy and OLS regressions otherwise. Other variables are self-explanatory or defined elsewhere. The symbols *, **, and *** denote statistical significance at the 10%, 5%, and 1% levels, respectively.
Panel A: Simultaneous equations using GP/LC
Model (1A) Model (1B) 1st stage 2nd stage 1st stage 2nd stage
Panel B: Simultaneous equations using other parachute proxies
GP proxy = GP/MPP GP proxy = GP (0,1) GP proxy = ln (GP value) GP proxy = GP multiple Model (2A) Model (2B) Model (3A) Model (3B) Model (4A) Model (4B) Model (5A) Model (5B) 2nd stage 2nd stage 2nd stage 2nd stage 2nd stage 2nd stage 2nd stage 2nd stage
Table VIII Predicted and Surprise Parachute Analysis
This table presents OLS regressions of acquisition premia using the 851 deals described in Table II. The dependent variable is the acquisition premium as reported by SDC. Following Comment and Schwert (1995), all financial characteristics are averaged over three fiscal years. Predicted parachute is the fitted parachute and surprise parachute is the error term from Model (1) of Table AI. These two variables enter Models (1) and (2) in this table separately from the Parachute (0,1). Other variables are self-explanatory or defined elsewhere. The p-values in parentheses are White (1980) heteroskedasticity consistent and adjusted for clustering by firms. The symbols *, **, and *** denote statistical significance at the 10%, 5%, and 1% levels, respectively.
This table presents regressions of the first stage Heckman (1979) selectivity correction. Model (1) estimates the probability of having golden parachute in a particular year using 14,157 firm-years with data available from CRSP, Compustat, and RiskMetrics during 1999-2007. All firm financial characteristics are averaged over three fiscal years. Model (2) estimates the probability of being targeted in a takeover during the sample time period. The p-values in parentheses are White (1980) heteroskedasticity consistent and adjusted for clustering by firms. The symbols *, **, and *** denote statistical significance at the 10%, 5%, and 1% levels, respectively.