Journal of Financial Economics 82 (2006) 35–61 On the marketing of IPOs $ Douglas O. Cook a , Robert Kieschnick b, , Robert A. Van Ness c a University of Alabama, Culverhouse College of Business, Tuscalossa AL 35487, USA b University of Texas at Dallas, School of Management, 2601 N. Floyd Road, SM 31, Richardson, TX 74080, USA c University of Mississippi, Department of Finance, 233 Holman Hall, University, MS, 38677, USA Received 20 November 2003; received in revised form 28 July 2005; accepted 30 August 2005 Available online 22 March 2006 Abstract Derrien [2005. Journal of Finance 60, 487–521] and Ljungqvist et al. [2006. Journal of Business] build upon the work of Miller [1977. Journal of Finance 32, 1151–1168] and claim that issuers and the regular customers of investment bankers benefit from the presence of sentiment investors (noise traders) in the market for an initial public offering (IPO). Thus we argue that investment bankers have an incentive to promote an IPO to induce sentiment investors into the market for it. Consistent with this motivation and these models, we expect that the promotional efforts of investment bankers should influence the compensation of investment bankers, the valuation of an IPO, its initial returns and trading, the wealth gains of insider shareholders, and the likelihood that an issuer switches investment bankers for a subsequent seasoned equity offering. Examining data for a sample of IPOs from 1993 through 2000, we find evidence consistent with these predictions and so with the proposition that an investment banker’s ability to market an IPO to sentiment investors is important. r 2006 Elsevier B.V. All rights reserved. JEL classifications: G24; G32 Keywords: Initial public offering; Marketing; Underpricing; Investment banking ARTICLE IN PRESS www.elsevier.com/locate/jfec 0304-405X/$ - see front matter r 2006 Elsevier B.V. All rights reserved. doi:10.1016/j.jfineco.2005.08.005 $ We thank an anonymous referee for the effort expended to improve our paper; Thompson Financial for permission to use the Institutional Brokers’ Estimate System data; Jay Ritter for making investment banker ranking data publicly available; Ender Rebis and Mairaj Ahmed for their help in collecting data for this paper; Anup Agrawal, Laurie Krigman, and Chris Yung for their helpful comments; and seminar participants at the University of Alabama and the University of Missouri. Corresponding author. Tel.: 972 883 6273. E-mail address: [email protected] (R. Kieschnick).
Transcript
ARTICLE IN PRESS
Journal of Financial Economics 82 (2006) 35–61
0304-405X/$
doi:10.1016/j
$We than
permission t
ranking data
Anup Agraw
University of�CorrespoE-mail ad
www.elsevier.com/locate/jfec
On the marketing of IPOs$
Douglas O. Cooka, Robert Kieschnickb,�, Robert A. Van Nessc
aUniversity of Alabama, Culverhouse College of Business, Tuscalossa AL 35487, USAbUniversity of Texas at Dallas, School of Management, 2601 N. Floyd Road, SM 31, Richardson, TX 74080, USA
cUniversity of Mississippi, Department of Finance, 233 Holman Hall, University, MS, 38677, USA
Received 20 November 2003; received in revised form 28 July 2005; accepted 30 August 2005
Available online 22 March 2006
Abstract
Derrien [2005. Journal of Finance 60, 487–521] and Ljungqvist et al. [2006. Journal of Business]
build upon the work of Miller [1977. Journal of Finance 32, 1151–1168] and claim that issuers and
the regular customers of investment bankers benefit from the presence of sentiment investors (noise
traders) in the market for an initial public offering (IPO). Thus we argue that investment bankers
have an incentive to promote an IPO to induce sentiment investors into the market for it. Consistent
with this motivation and these models, we expect that the promotional efforts of investment bankers
should influence the compensation of investment bankers, the valuation of an IPO, its initial returns
and trading, the wealth gains of insider shareholders, and the likelihood that an issuer switches
investment bankers for a subsequent seasoned equity offering. Examining data for a sample of IPOs
from 1993 through 2000, we find evidence consistent with these predictions and so with the
proposition that an investment banker’s ability to market an IPO to sentiment investors is important.
r 2006 Elsevier B.V. All rights reserved.
JEL classifications: G24; G32
Keywords: Initial public offering; Marketing; Underpricing; Investment banking
- see front matter r 2006 Elsevier B.V. All rights reserved.
.jfineco.2005.08.005
k an anonymous referee for the effort expended to improve our paper; Thompson Financial for
o use the Institutional Brokers’ Estimate System data; Jay Ritter for making investment banker
publicly available; Ender Rebis and Mairaj Ahmed for their help in collecting data for this paper;
al, Laurie Krigman, and Chris Yung for their helpful comments; and seminar participants at the
ARTICLE IN PRESSD.O. Cook et al. / Journal of Financial Economics 82 (2006) 35–6136
1. Introduction
The role of marketing, and particularly promotion, in the pricing and trading ofsecurities is limited in most asset pricing models. This partially stems from the frequenttreatment of investors as possessing the same information and identical likelihoodfunctions, which results in homogeneous expectations about a security’s returns. When oneor another of these presumptions is dropped (e.g., Harris and Raviv, 1993) and short-selling is allowed (e.g., Lintner, 1969), security market prices reflect an averaging ofheterogeneous investor expectations, producing an unbiased estimate of a security’s value.When both of these conditions fail to hold, security prices reflect the valuations of moreoptimistic investors and thereby represent biased estimates of security values.Miller (1977) suggests that heterogeneous investor expectations are a characteristic of
initial public offerings (IPOs) of common stock because of their high degree of valueuncertainty. Given that IPOs face potentially severe short sale constraints in early trading,Miller claims that the early aftermarket prices of IPOs, facing widely divergent investorvaluations, can be biased upward. He contends that this accounts for the substantial run-up in price of some IPOs.In contrast to Miller, much of the research on IPO underpricing presumes that the
observed early aftermarket prices are unbiased estimates of share value (e.g., Rock, 1986;Tinic, 1988). However, the presumption that early aftermarket prices are unbiasedestimates of share values is inconsistent with recent findings. For example, Mitchell et al.(2002) and Lamont and Thaler (2001) find some equity carve-out IPOs trade for more thantheir parent company, thus violating the value additivity principle. Further, and moreimportant for Miller’s claims, Ofek and Richardson (2003) demonstrate a relation betweenthe tightness of short-sale constraints and initial returns for a sample of Internet IPOs. Inadditionally, Ofek and Richardson show that relaxation of short sale constraints throughthe expiration of lock-ups has dramatic effects on the aftermarket pricing of these stocks,which should not occur if aftermarket prices are unbiased estimates of their true value.While this evidence is consistent with the long-run underperformance of IPOs (e.g., Ritter,1991; Houge et al., 2001), Ofek and Richardson’s results suggest that the adjustmentprocess could be much shorter than considered in such studies.Building upon Miller’s work, Derrien (2005) and Ljungqvist et al. (2006) argue that
issuers and regular (institutional) customers of investment bankers benefit from thepresence of sentiment investors or noise traders in the market for an IPO. If correct, thenan investment banker’s efforts to promote an IPO, particularly to retail investors, shouldbenefit both the issuer and the investment banker’s regular customers. Consequently, aninvestment banker’s ability to promote an issue to retail investors should influence theissuer’s decision to use the same investment banker in subsequent equity offerings. Soinvestment bankers have an incentive to create demand for an IPO by promoting it.Our results are consistent with the notion of investment bankers using promotion to
induce retail investors into the market for an IPO with results benefiting the issuing firm,the investment banker, and its regular investors. Specifically, we find that investmentbankers’ compensation is positively correlated with their promotional efforts; offer pricerevisions are positively correlated with promotional efforts; offer price valuations tend toexceed that of comparable firms when pre-offer publicity is greater; the average size ofinitial trades is negatively correlated with pre-offer publicity; initial returns are positivelycorrelated with pre-offer publicity; insider wealth gains tend to exceed their dilution losses
ARTICLE IN PRESSD.O. Cook et al. / Journal of Financial Economics 82 (2006) 35–61 37
when more pre-offer publicity is associated with their IPO; and issuers remain with leadinvestment bankers when the bankers are effective at generating pre-offer publicity, butwhen they are not; issuers tend to switch to lead investment bankers that can generatemore pre-offer publicity for their subsequent seasoned equity offerings. Altogether, thisevidence is consistent with an investment banker’s promotional activity attractingsentiment investors to an IPO to the benefit of the issuer, the investment banker, andthe investment banker’s regular customers.
The paper is organized as follows. Section 2 explains the role of promotion in IPOmarkets and its implications within the context of the models of Derrien and Ljungqvistet al. Section 3 describes the sample, sources of data, and variable definitions. Section 4reports the findings, and Section 5 summarizes the results.
2. The effects of marketing on IPOs
According to Kuhn (1990, p. 269), an investment banker’s marketing campaign for anIPO is critical.
This campaign, as much as anything that precedes or follows it, will determine thesuccess or failure of the IPO. The key is to stimulate investor demand for the stock sothat, as in basic economics, the demand will exceed the supply.
Similarly, the investment newsletter the Fleet Street Letter (November 2003, vol. 66, no.11, p. 1) stated:
Before a company gets to market through an IPO, it spends a fortune on hype,paperwork, and publicity to create demand. The buzz is stirred up before the shares arereleased. So you never get in cheap. And the ones that are cheap are usually not worthholding five minutes.
To understand these statements one must recognize the relation among the marketing ofan IPO, its offer price valuation, its initial return, and how different parties benefit fromthese relationships.
The models of Derrien (2005) and Ljungqvist et al. (2006) are relevant to understandingthe relation of promotion to IPO issuance. Ljungqvist et al. assume that there are twotypes of investors [sentiment investors and regular (institutional) investors] but recognizethat the issuer is prohibited from price discrimination and, therefore, legally bound to set auniform offer price. The investment banker adjusts the offer size so that the valuation of anIPO in aftermarket trading only partly reflects the valuation of the sentiment investor. Thispermits the investment banker to set the offer price above its true value while providing anopportunity for regular investors to profit by flipping their shares to sentiment investors inearly aftermarket trading. The net result is that both the issuer and the investment banker’sregular customers benefit from the presence of sentiment investors.
Derrien also assumes that there are two types of investors, institutional investors andindividual investors (noise traders, which are equivalent to Ljungqvist et al. sentimentinvestors). However, Derrien focuses on the cost of stabilizing an IPO in aftermarkettrading instead of on an investment banker’s offer price recommendation. A key parameterin his model is the bullishness of noise traders or individual investors, which he assumes is
ARTICLE IN PRESSD.O. Cook et al. / Journal of Financial Economics 82 (2006) 35–6138
determined by current market conditions. Given Derrien’s specification of the investmentbanker’s objective, he provides an explanation for the partial adjustment of the offer priceto public information observed in Bradley and Jordan (2002) and Lowry and Schwert(2004). Like Ljungqvist et al., Derrien predicts that the investment banker sets the offerprice to allow the issuer to benefit from a higher valuation than appropriate, giveninstitutional investor valuations. Institutional investors thus benefit from selling theirallocations to sentiment investors (i.e., noise traders), who have higher valuations.Derrien and Ljungqvist et al. demonstrate that issuers and investment bankers’ regular
customers benefit from the presence of sentiment investors (noise traders). In both modelsit is the sentiment investors (noise traders) that overpay. Evidence consistent with either ofthese models is provided in Derrien using French IPO data; Dorn (2003) using GermanIPO data; Cornelli et al. (2006) using European gray market data; and Purnanandam andSwaminathan (2004) using U.S. data. Interestingly, Purnanandam and Swaminathanconclude their study by noting that investment bankers often aggressively market IPOsand that such marketing efforts warrant further study.While the models of Derrien and Ljungqvist et al. suggest that the issuer and regular
customers of an investment banker benefit from the presence of sentiment investors,neither model considers that an investment banker might promote an issue in such a wayas to induce sentiment investors into the market for an IPO. Such a possibility, however, isconsistent with the premise that investment bankers act as marketing agents for issuers.Supporting this premise, Degeorge et al. (2004) find in the French IPO market that book-built issues attract more press than auctions, but only after the book-building route isselected. They also find that analysts affiliated with the lead underwriter issue morefrequent and favorable recommendations than they would under an auction process. Thesefavorable recommendations occur even following poor stock performance.We argue that the process of promoting new security issues is an important feature of
security issuance. In fact, it is prior investment banker promotional behavior that triggeredthe Blue Sky laws and the Securities Act of 1933. The basic purpose of these laws is not toprohibit the promotion of securities, but ‘‘to assure the availability of adequate reliableinformation about securities which are offered to the public’’ (Ratner, 1998, p. 33). Thislegal regime created three phases to securities registration: the pre-filing period, the waitingperiod, and the post-effective period [see Soderquist and Gabaldon, 1998; Johnson, 1991,for further discussion of these periods and the associated rules]. While different rules applyto each of the periods, none of the rules prevents the firm or its investment banker fromgenerating publicity about the firm, though the content of this publicity is restricteddifferently across the three periods.1 Although the form and content of publicity arerestricted, investment bankers can promote awareness of a firm by communicating withpotential investors, including retail investors, during the waiting period.Barber and Odean (2002) reveal one method that might be used by investment bankers
to promote an issue to attract retail investors and enhance their bullishness on an IPO.Using brokerage records, Barber and Odean find that retail investors are more likely topurchase attention-grabbing stocks. Similarly, Tetlock (2006) analyzes the affect of theWall Street Journal (2003) ‘‘Abreast of the Market’’ column and finds that either the mediareport investor sentiment before the sentiment is fully incorporated into market prices orthe media directly influence investors’ attitudes toward securities. In addition, Frieder and
1The Securities Act Release No. 5, 180 (August 16, 1971) discusses the publicity that is allowed.
ARTICLE IN PRESSD.O. Cook et al. / Journal of Financial Economics 82 (2006) 35–61 39
Subrahmanyam (2005) determine that individual investors are more likely to hold stock inhighly visible companies. These results suggest that an investment banker’s efforts topromote an IPO through increased media coverage increase retail interest in that stock.This is consistent with the ‘‘2004 Capital Markets Handbook’’ (Securities IndustryAssociation, 2004) which describes how investment bankers who are intent on attractingretail investors might use pre-offer publicity to promote retail investor awareness andinterest in an issue.
While we focus on the role of publicity in our analyses, we are aware that the methods ofmarketing IPOs to retail investors are changing as a result of the development of theInternet. For example, road show information is increasingly being made available to retailinvestors via the web. In addition, in 1997, the Securities and Exchange Commission (SEC)issued a no-action letter in conjunction with a joint venture of NBC (NationalBroadcasting Company) and Microsoft to transmit videos of road shows to subscribers.Pursuing the same strategy, Charles Schwab and Company Inc. received SEC approval in1999 to make road show meetings available in a password-protected Internet environment.Further, investment bankers increasingly supplement road shows with presentations on theInternet through Yahoo, NetRoadshow Inc., and Bloomberg Financial Marketing Service.
Irrespective of how the investment banker communicates with potential investors, webelieve that marketing an issue to retail investors serves the interests of the issuer, theinvestment banker’s regular customers, and therefore, the investment banker. Conse-quently, based in part on our interpretation of what drives some of the parameters inDerrien’s model or Ljungqvist et al., model, we test the following four predictions. First,pre-issue publicity attracts retail (noise) investors to an IPO. Second, attracting retailinvestors through publicity is good for issuers. Third, attracting retail investors throughpublicity is good for an investment bank’s regular IPO investors. Fourth, attracting retailinvestors through publicity is good for investment banks.
Although we do not focus on analyst coverage as part of the marketing effort, it is clearfrom Dunbar (2000), Krigman et al. (2001) and Degeorge et al. (2004) that such coverage isimportant to issuers.2 For example, Krigman et al. find that issuers generally switchunderwriters to obtain additional sell-side analyst coverage, which suggests that firms viewthis as important to increasing investor awareness of their firms.
3. Description of our sample and data
To examine the role of promotion on IPO issuance, we begin by identifying all IPOswith offer dates between January 1, 1993 and December 31, 2000 from the Securities DataCompany’s (SDC) New Issues database. The beginning sample year is 1993 because theTrade and Quote (TAQ) data, required for some of our variables, were first available in1993. We end our sample period at December 31, 2000, the end of the Internet IPO period.From the original list of U.S. IPOs, we filter out unit IPOs (IPOs with warrants), IPOs offoreign firms, IPOs with an offer price of less than $5, IPOs of financial service entities[e.g., financial service firms with a two digit standard industrial classification (SIC) code
2The Securities Industry Association’s ‘‘2004 Capital Markets Handbook’’ (Securities Industry Association,
2004, p. 96) points out that ‘‘the historical practice of bringing the research analyst ‘over the wall’ ended with SEC
Release No. 34-45908 (May 10, 2002). However, as the Wall Street Journal (2003) points out, it is still standard
practice in Europe to use analysts to help market IPOs.
ARTICLE IN PRESS
Table 1
Industrial distribution of sample
Industry definitions follow Department of Commerce delineations, which Clarke (1989) suggests are
economically meaningful. The chi-square statistic for the table equals 293.68 and is significant at the 1%
marginal significance level.
Industry 1993 1994 1995 1996 1997 1998 1999 2000 Total
D.O. Cook et al. / Journal of Financial Economics 82 (2006) 35–6140
between 60 and 69], IPOs of limited partnership interests, and IPOs that are not firm-commitment offerings. The resulting sample contains 3,123 firm-commitment IPOs.Table 1 indicates the incidence of sample IPOs by year and industry grouping. We find
that the sample of IPOs is not distributed equally across industry. Therefore we includedummy variables for industry groupings in subsequent analyses, in which accounting forindustry effects might be important. We partition our sample into two periods, 1993–1997and 1998–2000, to determine whether the Internet period influences our conclusions. Whiledifferences exist in the sample values for our different variables over these two periods, ourconclusions are the same across the subperiods. Consequently, we restrict our reporting tothe full sample results.For each of these IPOs, we collect data from a variety of sources. We extract the original
high and low filing prices, the offer date, the offer price, shares offered, amount offered,total investment banker compensation, and total selling concession from SDC. We extractthe first trading day closing price and shares outstanding after the offering from the Centerfor Research in Security Prices (CRSP).3 We obtain net sales, total assets, and the numberof employees for the fiscal year prior to an IPO’s offer date from Standard and Poor’sCompustat database. We collect data on a number of aspects of trading during the firsttrading day from TAQ. We obtain news data from the LexisNexis database.One variable of interest in our study is the initial return of an IPO, measured as the
difference between the first trade day closing price and the offer price relative to the offerprice. Table 2 illustrates that the mean initial return of our sample IPOs substantially
3When the first day closing price is not available on CRSP, we obtain this information from SDC’s New Issue
database. However, no inference drawn in this study changes if we examine only observations for which CRSP
data are available.
ARTICLE IN PRESS
Table 2
Descriptive sample statistics
Initial return represents the first day return of an IPO. Amount sold represent the dollar value of the amount of
stock sold in the offering. Float represents the ratio of the number of shares issued in the offering to the number of
shares issued and outstanding after the offering. Sales are the IPO’s firm net sales for the fiscal year prior to its
offering date. SDmid is the standard deviation of the midpoints of the bid-ask spreads during the first trading day.
Average trade size is the average size of a trade on the first day of trading. Revision is the difference between the
offer price and midpoint of the initial filing price relative to the mid-point of the initial filing range. P/SIPO – P/
Sindustry equals the price-to-sales ratio of the IPO using its prior year sales less the median of the price-to-sales
ratios of its industry. Nasdaq return represents the Nasdaq return over the 15 days prior to the offer date for an
IPO’s industry. HPR is an IPO’s holding period stock return from offering to the minimum of three years or
delisting date. Total compensation represents the total amount paid to investment bankers. Selling concession
represents the total amount paid to investment bankers for selling the issue. Headlines represent the number of
headlines with the company name. Full text is the number of news stories with the company name in the text.
Ranking equals an investment banker ranking from Loughran and Ritter (2003) but converted to integer rankings.
Variables Mean Median Standard deviation Number of IPOs
Initial return (percent) 28.95 11.11 55.36 3,026
Amount sold ($ millions) 88.298 42 294.689 3,123
Float 0.454 0.295 0.597 3,114
Sales ($ million) 225.521 42.02 1155.33 2,273
Sdmid 0.742 0.3242 1.262 2,073
Average trade size 3050.52 2247.37 3147.25 2,076
Revision 0.036 0 0.256 3,076
P/SIPO – P/Sindustry 62.199 �1.338 7.876 2,456
HPR (percent) 19.22 �42.31 2.337 3,104
Nasdaq Return (percent) 1.12 1.44 5.10 3,125
Total compensation 4,661,684 2,817,500 9,260,623 3,070
D.O. Cook et al. / Journal of Financial Economics 82 (2006) 35–61 41
exceeds the sample median initial return, which is consistent with the effects of pricestabilization discussed in Aggarwal (2000).
Because prior research (e.g., Dunbar, 1996)) shows that investment banker compensa-tion is related to the amount sold in the offering, a second variable of interest is the amountsold in the offering, which we measure at the offer price. Table 2 illustrates that substantialvariation was evident in the amount sold during our sample period.
Related to the amount sold is the float of an IPO. Specifically, we define the float of anissue as the number of shares offered in the IPO relative to the number of shares issued andoutstanding after the offering. The securities law literature refers to this as public float.Float is of interest as the ability to short a stock is related to the availability of tradedstock. For example, Ofek and Richardson (2003) find that an increase in the number oftraded shares at the expiration of lock-ups is negatively correlated with a stock’s price andmeasures for the tightness of short-sale constraints. Thus the larger the float, the easier it isto short the stock and the less binding the short-sale constraint is. Once again, Table 2suggests that a rather substantial difference is found between the mean and median of thisvariable’s sample distribution, which indicates its skewness.
Since Ritter (1984), researchers have used a firm’s pre-IPO net sales as a proxy for its sizeand, therefore, for the asymmetric information risk associated with its IPO. We explore
ARTICLE IN PRESSD.O. Cook et al. / Journal of Financial Economics 82 (2006) 35–6142
other alternatives (e.g., total assets, number of employees, firm age) but derive similarresults and, therefore, only focus on sales. Specifically, we use Compustat data todetermine the net sales of a firm that is going public for the fiscal year ending no later thanits offer date. The statistics reported in Table 2 suggest a substantial variation in firm sizeswithin our sample. Given that a firm’s net sales is a non-negative random variable, we useits logarithmic transformation as our firm size measure in subsequent regression analyses.Miller (1977) emphasizes value uncertainty as the key determinant of divergent investor
valuation of an IPO. Consequently, we measure value uncertainty by the initialaftermarket price volatility. Specifically, to avoid the effects of bid-ask bounce, wecompute the standard deviation of the midpoint between bid and ask quotes during thefirst trading day (SDmid). SDmid should be positively correlated with the divergentinvestor valuations of an IPO during its first trading day. Table 2 shows substantial valueuncertainty and divergent investor valuations associated with IPOs during our sampleperiod.Derrien and Ljungqvist et al. suggest that sentiment investors (bullish noise traders)
should influence the initial trading in a stock. This characterization is consistent with theBarber and Odean (2002) findings that retail investors tend to be attention-driven andtrade in response to news stories; thus providing additional justification for ourpromotional measures. To capture retail trading activity, we construct two variablesfrom the TAQ data. The first variable, small trading, represents the proportion of tradesthat are less than one thousand shares. The second variable, average trade size, is theaverage trade size during the IPO’s first trading day.4 However, since we derive the sameconclusions using either measure, we focus only on the average trade size measure insubsequent analyses.Offer price revision is also of interest in this study. Benveniste and Spindt (1989)
interpret offer price revision as capturing demand information garnered from an IPO’sroad show. Bradley and Jordan (2002) and Lowry and Schwert (2004) show, however, thatthese revisions do not fully impound publicly available information. Derrien addresses thisand claims that offer price revisions should not fully impound market movements ifinvestment bankers are to reduce their potential stabilization costs. Following Hanley(1993), we define the offer price revision, revision, as the difference between the offer priceand the midpoint of the initial filing range relative to the midpoint of the initial filingrange. The sample statistics in Table 2 not only indicate substantial variation in thisvariable, but also revisions downward as well as upward occurring.From Kim and Ritter (1999), we create a measure of an IPO’s offer price valuation by
computing the price-to-sales ratio for each sample IPO with available data using pre-offersales (from Compustat), the number of shares outstanding after the offer (from CRSP) andoffer price (from SDC). We compute the price-to-sales ratio for each firm within an IPO’sindustry for the fiscal year corresponding to the IPO’s offer year and use the median ofthese values as a measure of the typical valuation of firms within the IPO firm’s industry.Using these two ratios, we create a dummy variable that takes on the value one if the IPO’soffer price valuation exceeds its industry’s typical valuation and zero otherwise. Table 2shows that, while the valuation of the average IPO exceeds the valuation of firms in itsindustry, the median IPO valuation is below the valuation of firms within its industry.
4Our interpretation of average trade size as a proxy for retail trading is consistent with the evidence in Barber
et al. (2005).
ARTICLE IN PRESSD.O. Cook et al. / Journal of Financial Economics 82 (2006) 35–61 43
As a measure of post-IPO performance, we compute HPR, the holding period return,for all sample IPOs with CRSP data from offering until the minimum of delisting date orthree years. Although the appropriate methodology for computing long-run returns is asubstantial issue, HPR is adequate for our purposes and consistent with the definition usedby Derrien (2005).
As a control in a number of analyses, we also compute Nasdaq return, which equals theNasdaq return over the 15 days prior to the offer date for an IPO. This variable mirrors themarket return measure used by Bradley and Jordan (2002) and is used to control formarket movement prior to an IPO’s offer date. The sample statistics reported in Table 2for this variable indicate that its distribution is fairly symmetric.
In our analyses, we also use a number of variables associated with investment bankersand the marketing of IPOs. From SDC data, we focus on two measures of compensation.Total compensation captures the total dollar compensation paid to investment bankers.Selling concession captures the total dollar compensation paid to investment bankers forselling the issue. The basic statistics reported in Table 2 reveal a substantial variation inboth of these payments.
In addition, we use data on investment banker ranking (ranking) developed byLoughran and Ritter (2004), which is a corrected and extended version of the Carter et al.(1998) rankings.5 Although Loughran and Ritter use a scale that adds 0.1 to the Carteret al. rankings, we convert their rankings back to integer values. Table 2 shows thataverage rankings are high during both of our sample periods, which is consistent withhigher ranked investment bankers underwriting more offerings than lower rankedinvestment bankers.
Finally, we analyze pre-offer date marketing efforts by focusing on one of themeasurable effects of marketing: pre-offer publicity. We employ two measures for the pre-offer date publicity associated with an IPO: (1) the number of news articles that mentionthe firm’s name in the headline (headlines) and, (2) the number of articles that mention thefirm’s name in the text (full text). The Securities Industries Association’s ‘‘2004 CapitalMarkets Handbook’’ suggests that the marketing strategy for an IPO is mapped out at theall hands meeting, as all the members of the IPO team plan a timetable for going publicand assign certain duties to each member. From IPO filings, we discern that six months is areasonable estimate of the time from the all hands meeting to the time when the issuebegins trading. To create these counts, we conduct searches of LexisNexis for each samplefirm beginning six months prior to its offer date. Specifically, for the headlines measure, weuse the LexisNexis headlines and lead paragraph search criteria, while for the full textmeasure we use the full text search criteria. This search results in more than 79,500 newsarticles.
Effective promotional efforts should result in more publicity (i.e., more news storieswritten about the firm) for an IPO. Kuhn (1990, p. 270) points out that the publicity effortis an important part of the promotional campaign:
Outside public relations counsel is also engaged by some issuers to advise and assist inmany aspects of the IPO campaign, including drafting of press releases, press contacts,roadshows, and other public, professional and media events.
5We acknowledge the generosity of Jay Ritter for providing these data on his website. See Appendix 3 of
Loughran and Ritter (2003) for a description of their ranking methodology.
ARTICLE IN PRESSD.O. Cook et al. / Journal of Financial Economics 82 (2006) 35–6144
These proxies perhaps do not capture the full range of options available toan investment banker to promote public awareness of a firm, (e.g., oral comm-
unication with potential investors or Internet presentations to potential investors).Nevertheless, we feel that our metrics are likely to be highly correlated withbroader measures. Further, and just as important, our measures are consistent with thefocus on the role of noise traders or sentiment investors in Derrien’s and Ljungqvist et al.models.To get a bird’s eye view of our data, we read in detail a random sample of 5,452 news
articles based on 225 IPOs. We find that over 99% of these articles were non-negative,primarily descriptive stories, and that greater than 98% of the stories were publishedin national news outlets. These figures are consistent with the description in the‘‘2004 Capital Markets Handbook’’ on how investment bankers can use publicity toattract retail investors. In addition, we find that greater than 93% of the stories occurredbetween the filing date and the offer date. Nevertheless, in our analysis of offer pricerevisions, we also use an alternative headline measure, computed from only the filing dateto the offer date.
4. Analysis
To test our four predictions, we examine a number of relationships. To test whether pre-issue publicity attracts retail investors, we focus on whether retail trading in an IPO issignificantly correlated with pre-offer publicity (Section 4.4). To test whether attractingretail investors is good for an investment banker’s regular IPO investors, we considerwhether the initial returns of IPOs are positively related to both the pre-offer publicity andrecent market movements (Section 4.5). To test whether attracting retail investors is goodfor issuers, we examine whether offer price revisions (Section 4.2), offer price valuations(Section 4.3), and insider wealth gains (Section 4.6) are positively and significantlycorrelated with pre-offer publicity. And finally, to test whether attracting retail investors isgood for investment bankers, we explore whether investment banker compensation(Section 4.1) and the propensity of an issuer to use an investment banker for a subsequentequity offering (Section 4.7) is correlated with its pre-IPO publicity. We organize theseanalyses in order of the natural progression of events: from contracting with an investmentbanker for an IPO to deciding whether to use the investment banker again for a subsequentequity offering. We proceed in this manner because the analyses are sequentiallydependent.
4.1. Analysis of investment banker compensation
Issuers compensate investment bankers by the gross spread, which can be partitionedinto components; e.g., the selling concession that ostensibly represents the portion of totalcompensation paid for selling the issue. For any given IPO, investment bankers providemarketing, pricing, and distribution services and potentially stabilize the issue inaftermarket trading. If issuers value an investment banker’s marketing efforts then issuersshould compensate the bank for this service. Therefore, our first prediction is thatinvestment bankers are compensated for their promotional efforts.To examine this question, we consider the effect of pre-issue publicity, offer size, and
stabilization efforts on the total compensation and selling compensation paid to
ARTICLE IN PRESSD.O. Cook et al. / Journal of Financial Economics 82 (2006) 35–61 45
investment bankers.6 However, in this analysis we differ from prior studies (e.g., Altinkilicand Hansen, 2000; and Hansen, 2001) in that we treat as our dependent variables the totaldollar compensation and the total dollar selling compensation, not scaled versions (e.g.,total dollar compensation divided by total amount sold). We do this for two reasons. First,it is not clear, when regressing the ratio of total compensation to total amount sold on thetotal amount sold, whether the relationship is driven by the correlation between totalcompensation and the total amount sold or the correlation between the total amount soldwith itself. Second, if there are economies and diseconomies of scale in underwriting(Altinkilic and Hansen, 2000), then there should be a nonlinear relationship between totalcompensation and the total amount sold, which is distorted if we use their ratio as ourdependent variable.
With these considerations in mind, we regress the logarithm of total investment bankercompensation and the logarithm of total selling compensation on four variables. The firstvariable is the logarithm of the amount sold, which captures the distributional efforts ofinvestment bankers. The second variable is the square of the logarithm of the amount sold.If there are economies of scale in IPO underwriting, then this variable should have asignificantly negative coefficient. The third variable is the logarithm of the number of pre-issue headlines associated with an IPO. If investment bankers are paid for marketing anissue, then one would expect a significantly positive coefficient on this variable. Finally, weinclude a dummy variable for whether an issue was likely stabilized or not in aftermarkettrading. To create this variable, we used the methodology in Asquith et al. (1998) to fit amixture distribution to our sample IPO initial returns. Based upon a Bayesian algorithm,we assign the value one to a stabilization dummy variable if the issue was likely to havebeen stabilized in aftermarket trading.
We report the results from the above implied regressions in Table 3. The reported resultsdemonstrate that these regressions explain much of the variation in either total investmentbanker compensation or total selling compensation. In fact, the high R2 values could giverise to concerns that they result from extreme outliers or clusters in the data. However, wederive similar results using least absolute deviation regressions, trimmed sampleregressions, regressions using only one year of data, and regressions using variablesexpressed in deviations from their means. Consequently, we are confident that our resultsare legitimate and validate our re-specification of these compensation regressions. Further,our results have several important implications.
First, consistent our conjecture, we find that both total investment banker compensationand total selling compensation are significantly and positively correlated with pre-issuepublicity. These results suggest that issuers pay investment bankers for their marketing, orpromotional, efforts.
Second, the significant negative sign on the square of the logarithm of the total amountsold is consistent with significant economies of scale in IPO issuance. Comparing this resultwith the evidence reported in Altinkthc and Hansen (2000) suggests that IPO underwritingis subject to more significant economies of scale than seasoned equity underwriting.
And finally, the significant negative sign on the coefficient of the stabilization dummy forthe total compensation regression and the insignificance of this coefficient for the selling
6We do not include initial returns (pricing measure) in this list as we subsequently show that it is significantly
and positively correlated with marketing efforts. Initial return also obtains a significantly positive sign when
substituted for pre-issue publicity, but the regressions are less explanatory than the ones that we report.
ARTICLE IN PRESS
Table 3
Analysis of compensation paid to investment bankers
Ln(total compensation) equals the logarithm of the total compensation paid to investment bankers. Ln(selling
concession) is the logarithm of the total compensation paid to investment bankers for selling the issue. Ln(amount
sold) represents the dollar value of the amount sold in the offering. Ln(Headlines) equals the natural logarithm of
the number of headlines with the company name plus one over the period beginning six months prior to the offer
date to the offer date. Price stabilization is a dummy variable that takes on the value one if the issue is identified as
likely stabilized in aftermarket trading. We estimate standard errors in each regression using Huber-White
estimators and report p-values associated with the null hypothesis that the coefficient equals zero within
D.O. Cook et al. / Journal of Financial Economics 82 (2006) 35–6146
compensation regression is most interesting for it is consistent with the notion thatinvestment bankers compete for business. Ellis et al. (2000) provide evidence that leadinvestment bankers make profits on their stabilization efforts in IPOs. If true, then in acompetitive market, bankers should be willing to exchange compensation for stabilizationprofits. Our evidence is consistent with such behavior. The fact that the coefficient on thisvariable is insignificant for the selling concession reinforces this conclusion because thecompensation for providing stabilization should accrue only to the lead investmentbanker(s). Consequently we interpret this evidence as consistent with the notion thatinvestment bankers compete with one another to manage IPO offerings.
4.2. Analysis of offer price revisions
One of the most significant ways that an issuer can benefit from investment bankerpromotion efforts is if these efforts produce a higher offer price. According to Benvenisteand Spindt (1989), offer price revisions should impound public and private information oninvestor demand gathered during the book-building process. Consistent with thisinterpretation, Cornelli and Goldreich (2001) report evidence that investment bankerallocations are correlated with the informativeness of investors’ bids. Because we believethat pre-offer publicity influences retail or noise traders, we should find that offer pricerevisions are positively correlated with our pre-offer publicity measure after controlling formarket movements and other factors if investment bankers incorporate this information inoffer price revisions. Such revisions would represent an important benefit to issuers.
ARTICLE IN PRESSD.O. Cook et al. / Journal of Financial Economics 82 (2006) 35–61 47
To address this conjecture, we examine the effects of pre-offer publicity on offer pricerevisions by regressing offer price revisions on our pre-offer publicity variable, a variablefor recent market returns, and control variables from other studies. Specifically, tomeasure recent market returns, we follow Bradley and Jordan (2002) and proxy themarket’s return with the return of the Nasdaq index over the 15 trading days prior to theoffer date. In addition, we use a firm size measure (logarithmic transformation of net sales)to control for the asymmetry of information associated with an IPO as Ljungqvist andWilhelm (2003) demonstrate that this is a significant influence on these revisions. We useour price uncertainty measure, SDmid, to capture the value uncertainty associated with anIPO. One might expect that, in the face of significant value uncertainty, offer pricerevisions would be greater as the collection of demand information becomes moreimportant. Finally, we include the ranking of the lead investment banker, whether or notthe issue was venture backed and whether or not the issue was listed on the NYSE; all ofwhich were significant in either the Benveniste et al. (2003) or the Lowry and Schwert(2004) analysis of IPO offer price revisions.
Column 1 of Table 4 reports the results of estimating the implied regression model. Ourmost important result is that we find a positive significant coefficient on pre-offer publicity,which is consistent with the claim that publicity brings sentiment investors into the marketfor an IPO and that investment bankers incorporate information on their demand in offerprice revisions. In addition, we find a positive significant coefficient on the Nasdaq returnvariable, which is consistent with prior evidence (e.g., Bradley and Jordan, 2002) and bothDerrien’s and Ljundqvist et al. models.
However, given that one could argue that pre-filing publicity should be incorporatedinto the filing price range, the relationship between pre-offer publicity and offer pricerevisions could be understated. As a consequence, we refine our pre-offer publicity measureto capture only news stories between an IPO’s filing date and offer date. We substitute thismeasure, ln(Headlines2), for ln(Headline) in the first regression to derive the regressionresults reported in Column 2 of Table 4. Once again, we find that offer price revisions arepositively correlated with pre-offer publicity. Because the results in Columns 1 and 2 areessentially the same here, and in all subsequent analyses, we shall report only in subsequenttables the broader pre-offer publicity measure, ln(Headlines).7
The evidence that offer price revisions are significantly correlated with pre-IPO publicityprovides an insight into the results of Krigman et al. (2001). Krigman, Shaw, and Womackexamine a sample of IPOs to determine the influences of a firm’s decision to switch fromtheir IPO’s lead investment banker to another investment banker for subsequent equityofferings. Krigman, Shaw, and Womack find that nonswitching firms have an upwardprice revision relative to the midpoint of the initial filing range, which we use as ourrevision variable. If an investment banker’s promotional efforts effectively attractsentiment investors into the market for an IPO and the investment banker accordinglyadjusts the offer price, then, as Kuhn (1990) suggests, firms should be less likely to switchunderwriters when these upward revisions occur. If revisions were simply the result ofmarket movements or the investment banker simply collecting demand information fromtheir regular investors, an issuer would have less incentive to stay with its lead investment
7For the same reason, we report only the pre-offer publicity measure, ln(Headline), instead of also including
ln(Full Text). Because there is no significant inference involving ln(Headline) that would change if we were to use
ln(Full Text), we select one metric to reduce clutter.
ARTICLE IN PRESS
Table 4
Analysis of offer price revisions
The dependent variable in each regression represents the offer price revision, which is defined as the difference
between the offer price and midpoint of the initial filing price relative to the midpoint of the initial filing range.
Ln(Sales) equals the logarithm of the firm’s net sales for the fiscal year prior to its offering date. SDmid is the
standard deviation of the mid-points of the bid-ask spreads during the first trading day. Ranking represents an
investment banker’s ranking from Loughran and Ritter (2003) but converted to integer rankings. Nasdaq return is
the Nasdaq return over the 15 days prior to the offer date. Ln(Headlines) equals the natural logarithm of the
number of headlines with the company name plus one over the period six months prior to its offer date.
Ln(Headlines2) equals the natural logarithm of the number of headlines with the company name plus one
between the filing date and offer date. Venture is a dummy variable that takes on the value one if a venture backed
IPO. NYSE is a dummy variable that takes on the value one if the IPO is to be listed on the NYSE. We estimate
standard errors using Huber-White estimators and report p-values associated with a null hypothesis that the
coefficient equals zero within parentheses. Each estimated equation includes unreported industry dummy
variables to control for industry-related effects.
Variables (1) (2)
Constant �0.133 �0.080
(0.00) (0.03)
ln(Sales) �0.004 �0.001
(0.11) (0.86)
Sdmid 0.103 0.101
(0.00) (0.00)
Ranking 0.009 0.005
(0.00) (0.07)
Venture 0.032 0.026
(0.01) (0.05)
NYSE �0.039 �0.028
(0.00) (0.10)
NASDAQ return 0.533 0.511
(0.00) (0.00)
ln(Headlines) 0.014 —
(0.00)
Ln(Headlines2) — 0.017
(0.00)
F statistic 38.05 33.49
(0.00) (0.00)
R-squared 0.34 0.28
No. of observations 1384 1488
D.O. Cook et al. / Journal of Financial Economics 82 (2006) 35–6148
banker simply because the offer price was higher than expected. In Section 4.7, we provideevidence consistent with this interpretation.
4.3. Analysis of offer price valuations
The above evidence shows that offer price revisions are positively and significantlycorrelated with pre-offer publicity, allowing issuers to benefit from their investmentbanker’s promotional activities. However, a further implication of both Derrien’s andLjundgqvist, Nanda, and Singh’s models is that the greater the bullishness of noise traders,the more likely the investment banker is able to raise the offer price above its truevaluation and the more likely the price drops once short-sales constraints become
ARTICLE IN PRESSD.O. Cook et al. / Journal of Financial Economics 82 (2006) 35–61 49
nonbinding. If pre-offer publicity affects investor sentiment (noise trader bullishness),then, according to these models, a positive correlation should be expected between pre-offer publicity and relative offer price valuations. Such a relationship would representanother benefit to issuers from their investment bankers’ marketing efforts.
To test this relationship, we examine the effect of pre-offer publicity on an IPO’s relativeoffer price valuation, while controlling for selected influences. Given Derrien’s model, weare specifically interested in how different factors influence the odds of an IPO’s valuationexceeding that of comparable firms. Consequently, we focus on a dummy variable thattakes on the value one if the IPO’s offer price valuation exceeds the median valuation oftraded firms within its industry (P/SIPO 4 P/Sindustry).
The additional controls that we use are firm size, price uncertainty, investment bankerranking, venture capitalist backing, and prior market returns. Because larger firms couldpossess fewer growth prospects, their valuation might be less than the industry median. Incontrast, IPOs with greater price uncertainty should be associated with an offer pricevaluation that exceeds the industry norm. Better investment bankers should be moresuccessful at marketing the IPO and obtaining a valuation that exceeds that of comparablefirms. If venture capital backing certifies the quality of the IPO firm, this should increasethe offer price valuation so that it is higher than comparable firms. The greater the recentmarket returns, the more likely that bullish noise traders will be drawn to the market forIPOs, with accompanying higher price valuation.
Column 1 of Table 5 reports the results of the regression model. Most of the results areconsistent with expectations, and, most important, greater pre-offer publicity is associatedwith a greater likelihood that the IPO’s offer price valuation exceeds those of firms withinits industry. The coefficient on the venture capitalist backing variable is negative, which isinconsistent with the venture capitalist certification hypothesis. According to this result, ifbeing backed by a venture capitalist does certify an issue, such certification does nottranslate into a higher offer price valuation than comparable firms. Alternatively, venturecapitalists could bring firms to market that have fewer growth prospects than other firms intheir industry.
While these results are consistent with Derrien’s model, another aspect of his modelindicates that such valuations should be negatively correlated with an IPO’s future stockperformance. To test this, we add our post-IPO stock performance variable, HPR, to theprior regression model and report the results in Column 2 of Table 5. We find a negativecoefficient on HPR. This is evidence that offer price valuations are biased upward, a resultthat is consistent with Derrien’s model.
In summary, our evidence suggests that issuers benefit from investment bankersmarketing efforts that increase the likelihood of offer price valuations exceeding those ofother firms in their industry.
4.4. Analysis of initial IPO trading
We predicted earlier that pre-offer publicity attracts retail investors or noise traders.This prediction is based upon both Derrien’s and Ljungqvist et al. models. Their modelsimply that sentiment investor (noise trader) demand is the primary determinant of pricerun-ups in initial IPO trading. Consequently, one should expect retail investor trading tobe positively correlated with the pre-offer publicity measure if publicity draws theseinvestors into the IPO market.
ARTICLE IN PRESS
Table 5
Analysis of offer price valuations
The dependent variable in each regression is a binary variable that takes on the value one if the price-to-sales
ratio of the IPO at its offer price exceeds the median price-to-sales ratios of its industry. Ln(Sales) equals the
natural logarithm of an IPO’s net sales for the fiscal year prior to its offering date. Nasdaq return is the Nasdaq
return over the 15 days prior to the offer date. Ln(Headlines) equals the natural logarithm of the number of
headlines with the company name plus one. Ln(ATS) represents the natural logarithm of the average trade size
during the first day of trading. HPR is an IPO’s holding period stock return from offering to the minimum of
three years or delisting date. We estimate the coefficients of the regressions using logistic regression analysis, using
Huber-White type estimators for the variances and report p-values associated with a null hypothesis that the
coefficient equals zero within parentheses.
Variable (1) (2)
Constant 0.998 0.972
(0.00) (0.01)
Ln(Sales) �1.331 �1.343
(0.00) (0.00)
Sdmid 0.410 0.395
(0.00) (0.00)
Ranking 0.314 0.321
(0.00) (0.00)
Venture �0.279 �0.268
(0.06) (0.07)
NASDAQ return 0.810 0.683
(0.59) (0.65)
Ln(Headlines) 0.361 0.373
(0.00) (0.00)
HPR — �0.034
(0.07)
F statistic/chi-square 221.50 227.87
(0.00) (0.00)
Pseudo-R squared 0.38 0.39
D.O. Cook et al. / Journal of Financial Economics 82 (2006) 35–6150
To examine this prediction, we regress our measure of retail trading during the first dayof trading on our pre-offer publicity variable. Given that average trade size, ATS, is a non-negative random variable, we use Ln(ATS) as the regressand. Greater retail tradingshould be associated with a smaller ATS. In addition to the pre-offer publicity measure,Ln(Headline), we include a number of control variables.These control variables include firm size (Ln(Sales)), public float (Float), price
uncertainty (SDmid), an investment banker ranking measure (Ranking), Nasdaq pre-offerreturn (Nasdaq return), and whether an IPO is venture capitalist backed (Venture) or not.We expect larger firms to be associated with larger average trade sizes stemming fromrestrictions on institutional investment. With larger public float, short-sell restrictions areless likely to be binding and more institutional trading is expected. Higher rankedinvestment bankers might be more capable marketers to retail investors. Venture capitalbacked firms could be more attractive to retail investors if they perceive such backing ascertifying the quality of the IPO. Recent market returns could induce more retail investorsinto equity markets, and particularly IPO markets.
ARTICLE IN PRESSD.O. Cook et al. / Journal of Financial Economics 82 (2006) 35–61 51
Column 2 of Table 6 reports the results of estimating the regression model. We find thataverage trade sizes during initial trading in an IPO are significantly and negativelycorrelated with pre-offer publicity. Adding offer price revisions to this equation does notchange this conclusion. Further, as noted earlier, using alternative small trading activitymeasures does not change this conclusion. This result is consistent with the notion that pre-offer publicity associated with an IPO brings retail investors into the market for that IPO.This evidence is also consistent with the Barber and Odean (2002) evidence for seasonedequities. In addition, the negative and significant effect of pre-offer Nasdaq returns onaverage trade size during initial trading is consistent with Derrien’s assumption thatincreased equity market returns attract retail investors to IPO equity markets. And finally,the evidence that average trade size during initial trading is positively associated with anIPO’s public float is consistent with the notion that retail investor trading dominates initialtrading when institutional investors expect short-sale constraints to be binding. Such aresult is consistent with both Derrien and Ljungqvist et al.
Table 6
Analysis of small trading activity
Ln(ATS) represents the natural logarithm of the average trade size during the first day of trading. Ln(Sales)
equals the natural logarithm of the net sales of a firm for the fiscal year prior to its offering date. Float represents
the ratio of the number of shares issued in the offering to the number of shares issued and outstanding after the
offering. SDmid represents the standard deviation of the mid-points of the bid-ask spreads during the first trading
day. Ranking represents an investment banker’s ranking from Loughran and Ritter (2003) but converted to
integer rankings. Venture is a dummy variable that takes on the value one if the IPO firm was backed by a venture
capital firm. Nasdaq return represents the Nasdaq return over the 15 days prior to the offer date. Ln(Headlines)
equals the natural logarithm of the number of headlines with the company name plus one within six months prior
to the offer date. We estimate standard errors using Huber-White estimators and report p-values associated with a
null hypothesis that the coefficient equals zero within parentheses.
Variables Ln(ATS)
Constant 7.383
(0.00)
Ln(Sales) 0.151
(0.00)
Float 0.434
(0.00)
SDmid �0.344
(0.00)
Ranking 0.005
(0.68)
Venture �0.145
(0.68)
NASDAQ return �1.991
(0.68)
Ln(Headlines) �0.072
(0.68)
F statistic 89.40
(0.68)
R-squared 0.46
Number of observations 1,401
ARTICLE IN PRESSD.O. Cook et al. / Journal of Financial Economics 82 (2006) 35–6152
4.5. Analysis of initial IPO returns
Our third prediction is that attracting retail investors through publicity is good for aninvestment banker’s regular IPO investors. If the regular investors of investment bankersare to benefit from their promotional efforts, then they should be able to sell theirallocations at higher prices in early market trading. Consequently, we expect to observe asignificantly positive correlation between pre-offer publicity and initial IPO returns.In this connection we note that, according to Benveniste and Spindt (1989), offer price
revisions should impound public and private information on investor demand gatheredduring the book-building process. However, Benveniste and Spindt’s model also impliesthat these revisions should fully capture publicly available information, which isinconsistent with the evidence of Bradley and Jordan (2002) and Loughran and Ritter(2002) who find that initial returns are correlated with prior market returns.Both Derrien and Ljungqvist et al. explain this evidence by stating that underwriters
serve both issuers and their regular investors by exploiting sentiment investors. In thesemodels, the valuations of sentiment investors in conjunction with short selling constraintsdetermine the large initial returns of IPOs. Because it is a scarcity of securities that preventsregular or institutional investors from shorting the stock, we should expect IPO initialreturns to be positively correlated with pre-offer publicity and pre-offer market returns andnegatively correlated with the issue’s public float. Further, because both models suggest apartial adjustment of the offer price to public information, we should expect initial IPOreturns to be positively correlated with pre-offer publicity and market returns even aftercontrolling for offer price revisions.To test these expectations, we estimate the following regression models. First, we regress
initial IPO returns on our pre-offer publicity measure and pre-offer market returnsmeasure, along with various control variables. Column 1 of Table 7 reports the results ofthis regression model.8 Consistent with our expectations, we find that initial returns arepositively correlated with pre-offer publicity. Thus, the regular customers of investmentbankers clearly benefit from promotional efforts.To address further the question of whether Benveniste and Spindt (1989) or the Derrien
and Ljungqvist et al. models better explain initial IPO returns, we expand the regressionmodel to include our offer price revision measure and report results in Column 2 ofTable 7. We find that prior stock market performance and pre-offer publicity continue tobe significant influences on IPO returns even after accounting for offer price revisions,reflecting a partial adjustment to public information. These results are consistent withDerrien and Ljungqvist, Nanda, and Singh but not with Benveniste and Spindt (1989),which asserts that these influences should be impounded fully in the offer price revisions.Because Derrien and Ljungqvist, Nanda, and Singh imply that it is bullish noise traders
or retail investors that drive IPO prices upward, a significantly negative correlation shouldexist between average trade sizes and initial IPO returns. We examine this by introducingour retail trading activity measure and dropping the pre-offer publicity measure. We dothis because we have just shown that pre-offer publicity affects both offer price revisions
8Our regression model is a standard linear regression model that assumes the population of IPO returns is
homogeneous. If we drop this assumption and allow for price stabilization as in Asquith et al. (1998), we draw
similar inferences to those reported for nonstabilized IPOs, though not for stabilized IPOs. Nevertheless, to
facilitate comparison with prior research, we report only the results from the standard linear regression model.
ARTICLE IN PRESS
Table 7
Analysis of initial returns
The dependent variable in each regression is the initial return for an initial public offering (IPO). Ln(Sales) is
the natural logarithm of the firm’s net sales for the fiscal year no later than its offering date. SDmid represents the
standard deviation of the midpoints of the bid-ask spreads during the first trading day. Ln(ATS) is the logarithm
of the average trade size during the first day of trading. Float represents the ratio of the number of shares issued in
the offering to the number of shares issued and outstanding after the offering. Revision equals the difference
between the offer price and midpoint of the initial filing price relative to the midpoint of the initial filing range.
Ranking represents an investment banker’s ranking from Loughran and Ritter (2003), but converted to integer
rankings. Venture is a dummy variable that takes on the value one if the IPO firm was backed by a venture capital
firm. Nasdaq return is the Nasdaq return over the 15 days prior to the offer date. Ln(Headlines) equals the natural
logarithm of the number of headlines with the company name plus one within six months prior to the offer date.
We estimate standard errors using Huber-White estimators and report p-values associated with a null hypothesis
that the coefficient equals zero within parentheses. Each estimated equation includes industry dummy variables,
which we do not report.
Variables (1) (2) (3)
Constant �0.016 0.026 0.729
(0.59) (0.00) (0.00)
Ln(Sales) �0.014 �0.011 �0.003
(0.02) (0.04) (0.55)
Sdmid 0.418 0.383 0.361
(0.00) (0.00) (0.00)
Float �0.095 �0.083 �0.051
(0.01) (0.01) (0.03)
Ranking 0.010 0.005 0.007
(0.04) (0.30) (0.09)
Venture 0.021 0.002 �0.012
(0.35) (0.97) (0.52)
NASDAQ return 1.231 1.022 0.826
(0.00) (0.00) (0.00)
Ln(Headlines) 0.026 0.023 —
(0.00) (0.00)
Revision — 0.427 0.328
(0.00) (0.00)
Ln(ATS) — — �0.093
(0.00)
F statistic 74.68 68.32 98.43
(0.00) (0.00) (0.00)
R-squared 0.72 0.75 0.76
Number of observations 1,360 1,340 1,415
D.O. Cook et al. / Journal of Financial Economics 82 (2006) 35–61 53
and retail trading activity, and so multicollinearity becomes a potential issue. Column 3 ofTable 7 reports these results, which suggest that, as average trade size increases, initialreturns drop. This result is exactly what one would expect if retail trading activity is drivingup IPO prices in the face of short-sale constraints (our float variable). Consequently, theseresults reinforce the stories told in Derrien and Ljungqvist et al.
Reese (2003) and Ho et al. (2001) also find that pre-offer IPO publicity influences anIPO’s initial returns. However, we interpret our publicity variable as a proxy for the effortsof investment bankers to promote retail interest in an IPO, while they interpret it as simplya proxy for investor sentiment.
ARTICLE IN PRESSD.O. Cook et al. / Journal of Financial Economics 82 (2006) 35–6154
Several problems arise with the notion that pre-offer publicity is simply a reflection ofinvestor sentiment. First, the Barber and Odean (2002) results make it clear that mediareporting determines investor sentiment instead of investor sentiment determining mediareporting. Second, it explains neither our earlier correlation between investment bankercompensation and pre-offer publicity nor our later correlation between investment bankerswitching and pre-offer publicity. Third, Degeorge et al. (2004) provide evidencesuggesting that the publicity associated with a French IPO is significantly greater oncethe book-building method is selected. And finally, the notion that investor sentimentdetermines media reporting is predicated upon the notion that reporters are writing storiesbased upon conversations with investors, not writing stories based upon news releases,interviews, or presentations arranged by the firm or its investment bankers. The firstmechanism is inconsistent with the Kuhn (1990) statements regarding the importance ofpublicity and also inconsistent with media economics (see Hamilton, 2003). The fact thatso many companies spend money on public relations personnel and activities reinforcesthis point. This notion also fails to explain where journalists are obtaining theirinformation. During the registration period, security analysts cannot generate printedinformation about the firm, so information about these firms must come from either thefirm or from its investment bankers.
4.6. Analysis of insider benefits
One of our predictions is that issuers benefit from the promotional efforts of investmentbankers. However, if an investment banker’s promotional efforts benefit the issuer and theregular investors of the investment banker, then these efforts might also benefit the IPO’spre-offer shareholders. Such an implication would be consistent with Ljungqvist, Nanda,and Singh’s model.Loughran and Ritter (2002) show that, when a firm goes public, those who do not sell
stock in the offering gain from the increased price of their stock (wealth effects) and losefrom the sale of stock for less than its early traded price (money on the table or dilutioneffects). Loughran and Ritter claim that a firm’s insiders consider both effects whendetermining whether or not they will be better off as a result of the offering.Bradley and Jordan (2002) simplify Loughran and Ritter’s expressions for the wealth
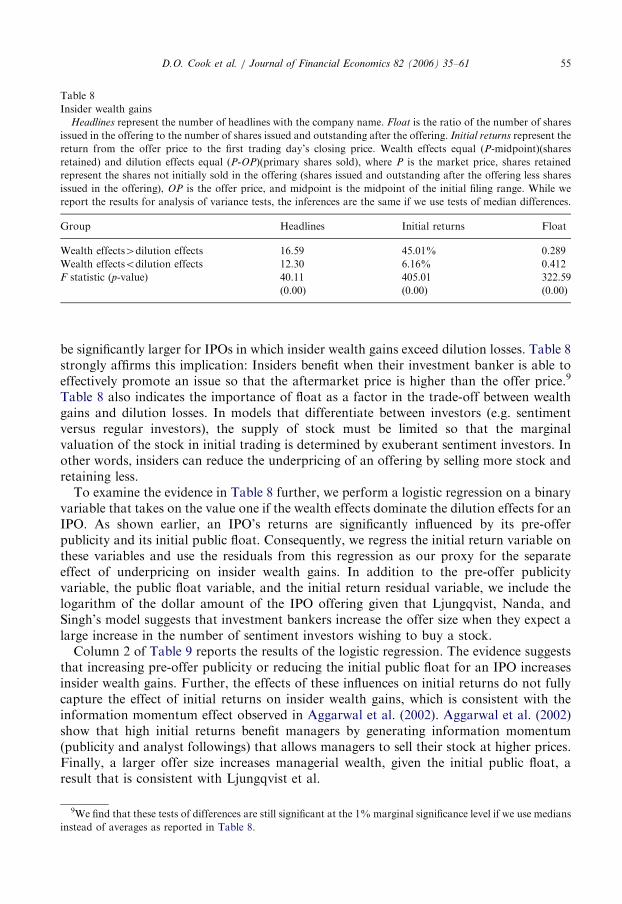
and dilution effects as follows: wealth effects ¼ (P-midpoint)(shares retained) anddilution effects ¼ (P-OP)(shares sold), where P is the market price, shares retainedrepresent the shares not initially sold in the offering, shares sold include secondaryofferings, OP is the offer price, and midpoint is the midpoint of the initial filing range. Wecalculate these values for our sample firms, estimating the shares retained as the differencebetween the shares issued and outstanding after the offering (from CRSP) less the numberof shares offered initially, including over-allotment shares (from SDC’s New Issuedatabase). While the inclusion of over-allotment shares biases downward the estimate ofinsider wealth gains from an offering, it correctly captures the additional shares that areoften sold in nonstabilized IPOs. Using these estimates, we create a dummy variablethat takes on the value one if the wealth effects are greater than the dilution effects andzero if not.Table 8 reports differences in the number of headlines, initial returns, and float for these
two groups of IPOs. If pre-offer publicity entices sentiment investors into the market for anIPO and insiders of an issuer benefit from their valuations, then pre-offer publicity should
ARTICLE IN PRESS
Table 8
Insider wealth gains
Headlines represent the number of headlines with the company name. Float is the ratio of the number of shares
issued in the offering to the number of shares issued and outstanding after the offering. Initial returns represent the
return from the offer price to the first trading day’s closing price. Wealth effects equal (P-midpoint)(shares
retained) and dilution effects equal (P-OP)(primary shares sold), where P is the market price, shares retained
represent the shares not initially sold in the offering (shares issued and outstanding after the offering less shares
issued in the offering), OP is the offer price, and midpoint is the midpoint of the initial filing range. While we
report the results for analysis of variance tests, the inferences are the same if we use tests of median differences.
D.O. Cook et al. / Journal of Financial Economics 82 (2006) 35–61 55
be significantly larger for IPOs in which insider wealth gains exceed dilution losses. Table 8strongly affirms this implication: Insiders benefit when their investment banker is able toeffectively promote an issue so that the aftermarket price is higher than the offer price.9
Table 8 also indicates the importance of float as a factor in the trade-off between wealthgains and dilution losses. In models that differentiate between investors (e.g. sentimentversus regular investors), the supply of stock must be limited so that the marginalvaluation of the stock in initial trading is determined by exuberant sentiment investors. Inother words, insiders can reduce the underpricing of an offering by selling more stock andretaining less.
To examine the evidence in Table 8 further, we perform a logistic regression on a binaryvariable that takes on the value one if the wealth effects dominate the dilution effects for anIPO. As shown earlier, an IPO’s returns are significantly influenced by its pre-offerpublicity and its initial public float. Consequently, we regress the initial return variable onthese variables and use the residuals from this regression as our proxy for the separateeffect of underpricing on insider wealth gains. In addition to the pre-offer publicityvariable, the public float variable, and the initial return residual variable, we include thelogarithm of the dollar amount of the IPO offering given that Ljungqvist, Nanda, andSingh’s model suggests that investment bankers increase the offer size when they expect alarge increase in the number of sentiment investors wishing to buy a stock.
Column 2 of Table 9 reports the results of the logistic regression. The evidence suggeststhat increasing pre-offer publicity or reducing the initial public float for an IPO increasesinsider wealth gains. Further, the effects of these influences on initial returns do not fullycapture the effect of initial returns on insider wealth gains, which is consistent with theinformation momentum effect observed in Aggarwal et al. (2002). Aggarwal et al. (2002)show that high initial returns benefit managers by generating information momentum(publicity and analyst followings) that allows managers to sell their stock at higher prices.Finally, a larger offer size increases managerial wealth, given the initial public float, aresult that is consistent with Ljungqvist et al.
9We find that these tests of differences are still significant at the 1%marginal significance level if we use medians
instead of averages as reported in Table 8.
ARTICLE IN PRESS
Table 9
Analysis of insider wealth gains
The dependent variable in the regression is a binary variable that takes on the value one if the wealth effects are
greater than dilution effects. Wealth effects equal (P-midpoint)(shares retained) and dilution effects equal (P-
OP)(primary shares sold), where P is the market price, shares retained represent the shares not initially sold in the
offering (shares issued and outstanding after the offering less shares issued in the offering), OP is the offer price,
and midpoint is the midpoint of the initial filing range. Headlines represent the number of headlines with the
company name. Float is the ratio of the number of shares issued in the offering to the number of shares issued and
outstanding after the offering. Initial returns residuals represent the residuals from regressing the initial returns of
IPOs on headlines and float. Ln(amtsold) equals the logarithm of the dollar amount sold. We estimate standard
errors using Huber-White estimators and report p-values associated with a null hypothesis that the coefficient
equals zero within parentheses.
Variable Wealth4dilution
Constant 0.648
(0.00)
Ln(amtsold) 0.396
(0.00)
Ln(Headlines) 0.574
(0.00)
Float �5.910
(0.00)
Initial returns residuals 5.988
(0.00)
Chi-square statistic 247.10
(0.00)
Pseudo-R-squared 0.27
Number of observations 2,804
D.O. Cook et al. / Journal of Financial Economics 82 (2006) 35–6156
This evidence and the evidence in Section 4.5 show that it is sentiment investors who areleaving money on the table. This result is consistent with Derrien and Ljungqvist et al. andwith the empirical evidence in Dorn (2003), and Cornelli et al. (2006). Also consistent withthis insider wealth maximizing hypothesis, Ang and Brau (2003) show that many IPOinsiders use different concealment strategies to prevent outside investors from knowinghow many shares they sell in the secondary market.
4.7. Analysis of issuer switching behavior
Earlier we provided evidence that issuers compensate investment bankers for theirmarketing efforts. Now, we examine the issue of whether issuers make future decisions onwho should manage a subsequent equity issue on the basis of the effectiveness of aninvestment banker’s IPO marketing efforts. If issuers care about such efforts, then theyshould reward investment bankers by retaining them for subsequent equity offerings(SEOs) when their marketing efforts are successful but switching to new lead bankers whenefforts are ineffective.We test this idea by examining several influences on an issuer’s decision to switch lead
IPO investment banker at its first SEO. We collect data from SDC’s New Issue database todetermine which IPOs in our sample subsequently engage in an SEO and cross-check thesedata against news stories on LexisNexis to ensure correct identifications. BecauseLjungqvist and Wilhelm (2005) also consider the effect of insider wealth gains on issuer
ARTICLE IN PRESSD.O. Cook et al. / Journal of Financial Economics 82 (2006) 35–61 57
switching behavior, we use their variables as a starting point for our analysis. Specifically,we compute the number of days between a firm’s IPO offer date and its SEO offer dateusing data from SDC’s New Issues database. However, we calculate holding period returnsfrom offer date until the minimum of three years or delisting date as our measure of firmperformance instead of using earnings per share. We also include an insider wealthdummy, not a CEO wealth dummy, because we believe it is important to capture IPObenefits for the entire board of directors. We obtain investment banker rankings fromLoughran and Ritter (2003) and use Institutional Brokers’ Estimate System data toidentify whether or not an analyst with the lead investment banker issues a report on thecompany within one year of its offer date.
We employ logistic regression analysis to examine how these variables influence whetheran issuer switches its lead IPO investment banker at the first SEO. Column 1 of Table 10effectively replicates the significant results reported in Table 4 of Ljundgqvist and Wilhelm(2004). We find that an issuer decision to switch lead investment bankers is positively andsignificantly correlated with the length of time between the IPO and the SEO, the provisionof an analyst report by the lead investment banker, and insider wealth gains (specifically,when insider wealth gains exceed their dilution losses).
To analyze the role of promotion and distribution, we substitute firm size, initial IPOreturns, and pre-offer publicity into the prior equation and report the results in Column 2of Table 10. We use a firm size measure in this analysis as the expected future SEO offersize should be correlated with firm size, not IPO offer size. We find that larger IPO issuesand greater pre-offer IPO publicity makes issuers less likely to switch to another leadinvestment banker. These results are consistent with our earlier compensation results.Further, we observe that the insider wealth dummy continues to be significant andnegatively correlated with the switching decision. These results are consistent with priorresults and reinforce our premise that issuers value an investment banker’s ability tomarket an IPO. This conclusion is also consistent with the evidence in Degeorge et al.(2004) on why book-building dominates auctions in French IPOs.
Given this evidence, we now examine whether switching lead investment bankers isassociated with an increase in pre-offer publicity for the switching firm’s SEO. To do this,we compute the number of news stories (headlines) associated with a seasoned equityoffering of a sample firm over the six-month period prior to its SEO offer date. We thencompute the difference between the number of news stories during the six months prior toits SEO offer date and the number of news stories during the six months prior to its IPOoffer date. Finally, we compute the difference in this change between firms that do and donot switch investment bankers. This last difference controls for the expected number ofnews stories if the firm does not switch. This last difference is 4.91, which is significant atthe 7% marginal significance level using a t test. More relevant, because these data arecount data, we use a median test and find that this difference is significant at the 1%marginal significance level. Thus firms that switch lead investment bankers experience asignificant increase in the pre-offer publicity associated with their SEO, which is consistentwith the notion that issuers value investment bankers’ promotional efforts.
5. Summary and conclusions
Derrien (2005) and Ljungqvist et al. (2006) build upon Miller (1977) and develop modelsof the IPO process implying that the issuer and regular customers of an investment banker
ARTICLE IN PRESS
Table 10
Analysis of IPOs that switch their lead investment banker for their seasoned equity offering (SEO)
The dependent variable in each regression is a binary variable that takes on the value one if the firm switches
lead investment bankers for its SEO. HPR is an IPO’s holding period stock return from offering to the minimum
of 3 years or delisting date. Ln(days IPO to SEO) represents the logarithm of the number of days from an IPO’s
offer date until its SEO date. Rankings are the investment banker rankings from Loughran and Ritter (2003) but
converted to integer rankings. Analyst report from lead manager represents a dummy variable that takes on the
value one if an analyst with the lead manager issues a report on the IPO within one year of its offer date. ln(Sales)
is the natural logarithm of the firm’s net sales for the fiscal year prior to its offering date. Initial Returns are the
returns from the offer price to the first trading day closing price. ln(Headlines) equals the natural logarithm of the
number of headlines with the company name plus one. Wealth dummy represents a dummy variable that takes on
the value one if the wealth effect dominates the dilution effect for IPO insiders. Each regression is a logistic
regression with Huber-White standard errors estimates. We report p-values associated with a null hypothesis that
the coefficient equals zero within parentheses.
Variables (1) (2)
Constant �5.184 �5.125
(0.00) (0.00)
HPR �0.007 0.003
(0.77) (0.90)
Ln(days IPO to SEO) 1.311 1.376
(0.00) (0.00)
Wealth dummy �0.381 �0.392
(0.01) (0.04)
Analyst report from lead manager �0.456 �0.221
(0.03) (0.00)
Rankings �0.383 �0.450
(0.00) (0.35)
Ln(Sales) — �0.128
(0.01)
Initial return — �0.085
(0.79)
Ln(Headlines) — �0.169
(0.04)
Wald’s chi-square statistic 224.93 193.49
(0.00) (0.00)
Pseudo-R-squared 0.24 0.26
D.O. Cook et al. / Journal of Financial Economics 82 (2006) 35–6158
benefit when sentiment investors are brought into the market for an IPO. If correct, theninvestment bankers have an incentive to attract these sentiment investors, and issuersshould reward investment bankers with repeat business if they do this effectively. While aninvestment banker has several ways to attract sentiment (retail) investors, it is clear fromBarber and Odean (2002) and Tetlock (2006) that generating publicity about the IPO is aneffective method.Consequently, we hypothesize that investment bankers promote an issue when they wish
to induce retail investors or noise traders into the market for that IPO. Given thishypothesis and the models of Derrien (2005) and Ljungqvist et al. (2006), we predict thefollowing. First, pre-issue publicity attracts retail (noise) investors to an IPO. Second,attracting retail investors through publicity is good for issuers. Third, attracting retailinvestors through publicity is good for an investment bank’s regular IPO investors.Fourth, attracting retail investors through publicity is good for investment banks.
ARTICLE IN PRESSD.O. Cook et al. / Journal of Financial Economics 82 (2006) 35–61 59
To examine these predictions, we use a sample of U.S. firm-commitment IPOs from 1993through 2000. Consistent with our first prediction, we find a positive and significantcorrelation between retail trading activity during the first day of trading in an IPO and theIPO’s pre-issue publicity. Consistent with our second prediction, pre-issue publicity ispositively correlated with upward revisions in IPO offer prices and offer price valuationsthat are above comparable firms in their industry. In addition, we find that insider wealthgains exceed their dilution losses when more pre-issue publicity is associated with theirIPO. Consistent with our third prediction, initial IPO returns are positively correlated withpre-issue publicity. And finally, consistent with our fourth prediction, we find thatinvestment banker compensation is positively and significantly correlated with pre-issuepublicity. Reinforcing the importance of marketing to issuers and investment bankers, wefind that issuers are less likely to switch lead investment bankers when they are effective atpromoting their IPO but, when they do switch, they often are able to increase the pre-offerpublicity associated with their SEO.
These findings are consistent with the models in Derrien (2005) and Ljungqvist et al.(2006) and with the evidence in Dorn (2003), Cornelli et al. (2006), and Purnanandam andSwaminathan (2004). Our results also provide a different interpretation of what issuersvalue in their investment bankers, which builds on the notion that investment bankers aremarketing agents for issuers.
References
Aggarwal, R., 2000. Stabilization activities by underwriters after initial public offerings. Journal of Finance 55,
1075–1103.
Aggarwal, R.K., Krigman, L., Womack, K., 2002. Strategic IPO underpricing, information momentum, and
lockup expiration selling. Journal of Financial Economics 66, 105–137.
Altinkthc, O., Hansen, R., 2000. Are there economies of scale in underwriting fees? Evidence of rising external
financing costs. Review of Financial Studies 13, 191–218.
Ang, J., Brau, J., 2003. Concealing and confounding adverse signals: insider wealth-maximizing behavior in the
IPO process. Journal of Financial Economics 67, 149–172.
Asquith, D., Jones, J., Kieschnick, R., 1998. Evidence on price stabilization and underpricing in early IPO returns.
Journal of Finance 53, 1759–1773.
Barber, B., Odean, T., 2002. All that glitters: the effect of attention and news on the buying behavior of individual
and institutional investors. Unpublished working paper. University of California, Berkeley.
Barber, B., Odean, T., Zhu, N., 2005. Do noise traders move markets? Unpublished working paper. Unversity of
California, Berkeley.
Benveniste, L., Spindt, P., 1989. How investment bankers determine the offer price and allocation of new issues.
Journal of Financial Economics 24, 343–361.
Benveniste, L., Ljungqvist, A., Wilhelm, W., Yu, X., 2003. Evidence of information spillovers in the production of
investment banking services. Journal of Finance 58, 577–608.
Bradley, D., Jordan, B., 2002. Partial adjustment of public information and IPO underpricing. Journal of
Quantitative and Financial Analysis 37, 595–616.
Carter, R., Dark, F., Singh, A., 1998. Underwriter reputation, initial returns, and the long-run performance of
IPO stocks. Journal of Finance 53, 285–311.
Clarke, R., 1989. SICs as delineators of economic markets. Journal of Business 62, 17–32.
Cornelli, F., Goldreich, D., 2001. Bookbuilding and strategic allocation. Journal of Finance 56, 2337–2369.
Cornelli, F., Goldreich, D., Ljungqvist, A., 2006. Investor sentiment and pre-IPO markets. Journal of Finance 61,
1187–1216.
Degeorge, F., Derrien, F., Womack, K., 2004. Quid pro quo in IPOs: why book-building is dominating auctions.
Unpublished working paper. Dartmouth College.
Derrien, F., 2005. IPO pricing in ‘‘hot’’ market conditions: who leaves money on the table? Journal of Finance 60,
487–521.
ARTICLE IN PRESSD.O. Cook et al. / Journal of Financial Economics 82 (2006) 35–6160
Dorn, D., 2003. Does sentiment drive the retail demand for IPOs? Unpublished working paper. Drexel University.
Dunbar, C., 1996. The choice between firm-commitment and best-efforts offering methods in IPOs: The effect of
unsuccessful offers. Journal of Financial Intermediation 7, 60–90.
Dunbar, C., 2000. Factors affecting investment bank initial public offering market share. Journal of Financial
Economics 55, 3–41.
Ellis, K., Michaely, M., O’Hara, M., 2000. When the underwriter is the market maker: an examination of trading
in the IPO aftermarket. Journal of Finance 55, 1039–1074.
Frieder, L., Subrahmanyam, A., 2005. Brand perceptions and the market for common stock. Journal of Financial
and Quantitative Analysis 40, 57–85.
Hamilton, J., 2003. All the News that’s Fit to Sell: How the Market Transforms Information into news. Princeton
University Press, Princeton, NJ.
Hanley, K., 1993. The underpricing of initial public offerings and the partial adjustment phenomenon. Journal of
Financial Economics 34, 231–250.
Hansen, R., 2001. Do investment banks compete in IPOs? The advent of the ‘‘7% plus contract. Journal of
Financial Economics 59, 313–346.
Harris, M., Raviv, A., 1993. Differences of opinion make a horse race. Review of Financial Studies 6, 473–506.
Ho, B., Taher, M., Lee, R., Fargher, N., 2001. Market sentiment, media hype, and the underpricing of initial
public offerings: the case of australian technology IPOs. Unpublished working paper. University of South
Wales.
Houge, T., Loughran, T., Suchanek, G., Yan, X., 2001. Divergence of opinion, uncertainty, and the quality of
initial public offerings. Financial Management 30, 5–23.
Johnson, C., 1991. Corporate Finance and the Securities Laws. Prentice-Hall, Englewood Cliff, NJ.
Kim, M., Ritter, J., 1999. Valuing IPOs. Journal of Financial Economics 53, 409–437.
Krigman, L., Shaw, W., Womack, K., 2001. Why do firms switch underwriters? Journal of Financial Economics
60, 245–284.
Kuhn, R., 1990. Investment Banking: The Art and Science of High-Stakes Dealmaking. Harper and Row,
New York, NY.
Lamont, O., Thaler, R., 2001. Can the market add and substract? Mispricing in tech stock carve-outs.
Unpublished working paper. University of Chicago.
Lintner, J., 1969. The aggregation of investor’s diverse judgments and preferences in purely competitive security
markets. Journal of Financial and Quantitative Analysis 4, 347–400.
Ljungqvist, A., Nanda, V., Singh, R., 2006. Hot markets, investor sentiment, and IPO pricing. Journal of
Business, forthcoming.
Ljungqvist, A., Wilhelm, W., 2003. IPO pricing in the dot-com bubble. Journal of Finance 58, 723–752.
Ljungqvist, A., Wilhelm, W., 2005. Does prospect theory explain IPO market behavior? Journal of Finance 60,
1759–1790.
Loughran, T., Ritter, J., 2002. Why don’t issuers get upset about leaving money on the table in IPOs? Review of
Financial Studies 15, 413–443.
Loughran, T., Ritter, J., 2004. Why has IPO underpricing changed over time? Financial Management 33,
5–37.
Lowry, M., Schwert, G.W., 2004. Is the IPO pricing process efficient? Journal of Financial Economics 71, 3–26.
Miller, E.M., 1977. Risk, uncertainty, and divergence of opinion. Journal of Finance 32, 1151–1168.
Mitchell, M., Pulvino, T., Stafford, E., 2002. Limited arbitrage in equity markets. Journal of Finance 57, 551–584.
Ofek, E., Richardson, M., 2003. Dotcom mania: the rise and fall of internet stocks. Journal of Finance 58,
1113–1137.
Purnanandam, A., Swaminathan, B., 2004. Are IPOs really underpriced? Review of Financial Studies 17, 811–848.
Ratner, D., 1998. Securities Regulation in a Nutshell, 6th ed. West Group, St. Paul, MN.
Reese, W., 2003. IPO underpricing, trading volume, and investor interest. Unpublished working paper. Tulane
University.
Ritter, J., 1984. The ‘‘hot issue’’ market of 1980. Journal of Business 57, 215–240.
Ritter, J., 1991. The long-run performance of initial public offerings. Journal of Finance 46, 3–27.
Rock, K., 1986. Why new issues are underpriced. Journal of Financial Economics 15, 187–212.
Securities Industry Assocation, 2004. 2004 Capital Markets Handbook, 5th ed. Aspen Publishers, New York, NY.
Soderquist, L., Gabaldon, T., 1998. Securities Laws. Foundation Press, New York, NY.
Tetlock, P., 2006. Giving content to investor sentiment: the role of media in the stock market. Journal of Finance,
forthcoming.
ARTICLE IN PRESSD.O. Cook et al. / Journal of Financial Economics 82 (2006) 35–61 61
Tinic, S., 1988. Anatomy of initial public offerings of common stock. Journal of Finance 43, 789–822.
Wall Street Journal, 2003. Banned on Wall Street, but all right aboard? E. Portanger (June 6), C1.
Further reading
Bradley, D., Jordan, B., Ritter, J., 2003. The quiet period goes out with a bang. Journal of Finance 58, 1–36.
Dallas Morning News, 2004. Google comes out swinging. D. DiMartino (August 20), D1.
DuCharme, L., Rajgopal, S., Sefcik, S., 2001. Lowballing for ‘pop’: the case of internet IPO underpricing.
Unpublished working paper. University of Washington.
Lowry, M., Schwert, G.W., 2002. IPO market cycles: bubbles or sequential learning? Journal of Finance 57,
1171–1200.
Scott, C., 1999. The unquiet period. Dow Jones News Service, September 13.