Page 1 of 23 On the Measurement of Stack Emissions at Taconite Processing Plants A progress report submitted to MPCA Michael E. Berndt Minnesota Department of Natural Resources Division of Lands and Minerals 500 Lafayette Rd. St. Paul, MN 55155 5/30/2008
Transcript
Page 1 of 23
On the Measurement of Stack Emissions at Taconite Processing Plants
A progress report submitted to MPCA
Michael E. Berndt Minnesota Department of Natural Resources
Appendix 1: FAMS measurements made at taconite processing facilities. .............. 19
Appendix 2. Process gas Hg measurements made using FAMS with QLIP modification ................................................................................................................................... 23
Page 3 of 23
Summary The Minnesota Department of Natural Resources is conducting a two year study
designed to evaluate potential mercury control technologies. Methods to monitor mercury are being tested and refined during this process in conjunction with these tests, as a part of an interagency agreement between the DNR and MPCA. This paper is a progress report for this study.
Sorbent trap methods (FAMS) were evaluated previously and found to be subject
to large interferences, thought to be related to the presence of reactive iron oxide dust in process gases at taconite plants. This method was modified using a wet filtration system, referred to as QLIP, to prevent trapping of oxidized mercury under dry conditions in the sampling filters. Early results were positive, but testing hasn’t been pursued during the present study.
Continuous Mercury Monitors (CMMs) have provided mixed results when using
dry filtration (DF) systems and/or inertial separation probes (ISPs). The difficulty appears to be related to the presence of reactive iron oxides in the process gas. A new wet filtration system (AWS = advanced wet system) has been developed by the University of North Dakota, EERC, that provides superior results compared to dry filtration, however, it was found that the conditioning liquid used in the method needed to be modified to prevent reaction between molecular halogen gases (Br2 and Cl2) and elemental mercury (termed AWSII in this document). The AWSII system is currently the preferred approach for monitoring mercury in stack gases, however, further modifications will be required for use when measuring mercury in process gases prior to the wet scrubbers.
A recent test at Minntac (Line 3) using all of the most methods for analyzing
mercury in stack gas, greenball, and scrubber water, provided a reasonable mercury mass balance for the overall induration process when the plant was operating under normal, baseline conditions. However, once mercury control tests were performed involving addition of NaBr to greenball and injection of CaBr2 to the kiln, the mercury decreases observed in the stack gas were not balanced by comparably sized increases in mercury concentration in the scrubber water. Locating the source of this discrepancy is a major goal for future research.
Page 4 of 23
Introduction The Minnesota Department of Natural Resources has been conducting mercury
research at taconite companies for approximately six years with the purpose being to evaluate mercury transport mechanisms and identify a means to control mercury in taconite stack emissions. Initial studies focused on analysis of samples collected from various locations in processing plants (Berndt et al., 2003, 2005) and conducting bench scale studies to determine how mercury is released from taconite concentrate (Berndt and Engesser, 2005a, 2005b). More recent research, which has focused on conducting short-termed Hg-control tests in active taconite plants (Berndt and Engesser, 2007), has resulted in the need to develop reliable means to assess mercury flow in several process streams (stack and process gases, greenball feed, and blow down water). This document focuses on the monitoring methods being used during many of these tests.
Mercury monitoring methods have been refined continuously over the past several
years and will continue to be improved during the next year of Hg control method testing at taconite plants. This document is a progress report for a study being conducted by the DNR to continue development of mercury monitoring technologies under contract with the MPCA. Current methods being used to monitor mercury in taconite processing streams are presented along with results from the most recent full scaled short-termed Hg control test conducted at Minntac in April, 2008. This example demonstrates the complexity associated with measuring plant emissions and estimating capture rates and identifies where updates in mercury monitoring technology are still likely needed for reliable use in taconite processing plants, especially during conduction of plant-scale mercury control tests. Completion of this study is scheduled for June, 2009.
Background Two primary means have been used to assess mercury emissions from taconite
processing plants: (1) direct measurement of mercury in taconite stack gases and (2) calculating stack emissions as the difference between mercury entering the furnace with feed streams and subtracting Hg removed with scrubber blowdown water. Measuring Hg in stack emissions directly is, conceptually, the easiest approach to understand. However, reliable stack gas measurements have been surprisingly difficult to obtain owing to strong interference related to the presence of iron oxides (Berndt et al., 2005a; Laudel, 2007) and the apparent occurrence of Br2 and Cl2 or similarly reactive gas species in taconite process gases (Berndt and Engesser, 2007). Moreover, taconite process lines can have as many as four stacks from a single line source, each with different mercury concentrations and flow rates. To monitor all four stacks using specialized continuous mercury monitors (CMMs) is cost prohibitive except in the most extreme cases when stack gas chemistry of all four stacks must be known. The alternative approach of using mass balance estimates to calculate emissions by difference, although not without its own difficulties, may, in some cases provide a substitute means to estimate stack emissions.
Page 5 of 23
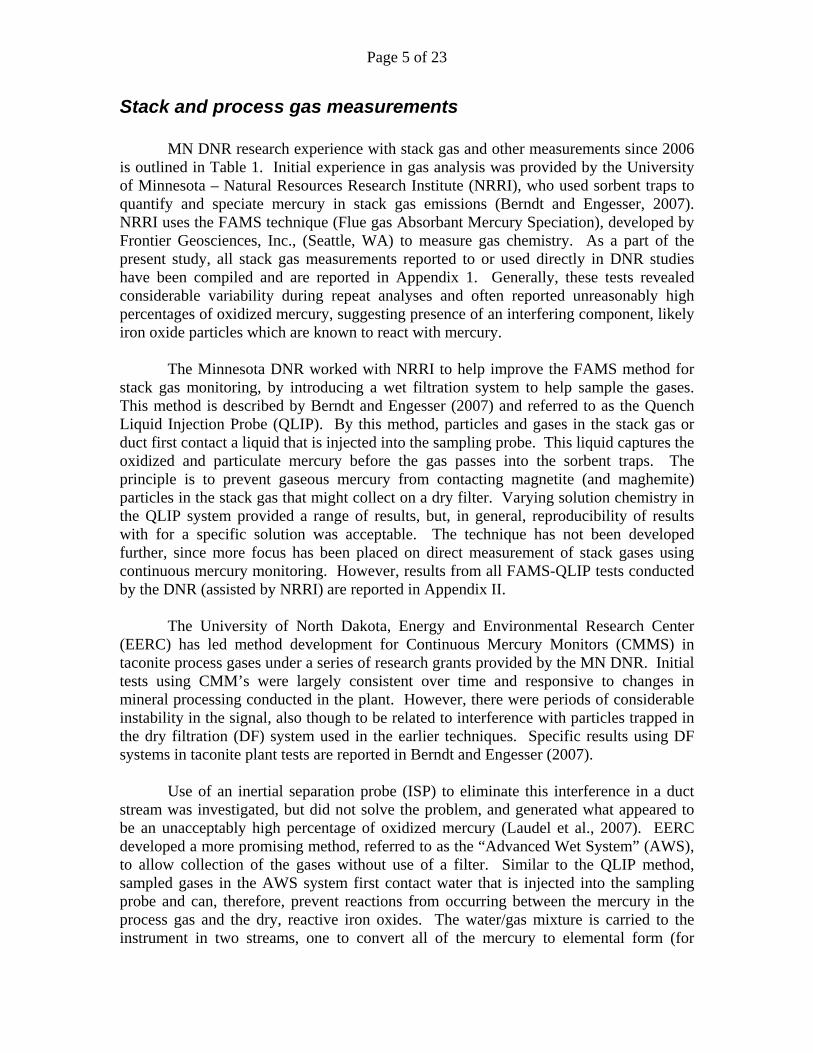
Stack and process gas measurements MN DNR research experience with stack gas and other measurements since 2006
is outlined in Table 1. Initial experience in gas analysis was provided by the University of Minnesota – Natural Resources Research Institute (NRRI), who used sorbent traps to quantify and speciate mercury in stack gas emissions (Berndt and Engesser, 2007). NRRI uses the FAMS technique (Flue gas Absorbant Mercury Speciation), developed by Frontier Geosciences, Inc., (Seattle, WA) to measure gas chemistry. As a part of the present study, all stack gas measurements reported to or used directly in DNR studies have been compiled and are reported in Appendix 1. Generally, these tests revealed considerable variability during repeat analyses and often reported unreasonably high percentages of oxidized mercury, suggesting presence of an interfering component, likely iron oxide particles which are known to react with mercury.
The Minnesota DNR worked with NRRI to help improve the FAMS method for
stack gas monitoring, by introducing a wet filtration system to help sample the gases. This method is described by Berndt and Engesser (2007) and referred to as the Quench Liquid Injection Probe (QLIP). By this method, particles and gases in the stack gas or duct first contact a liquid that is injected into the sampling probe. This liquid captures the oxidized and particulate mercury before the gas passes into the sorbent traps. The principle is to prevent gaseous mercury from contacting magnetite (and maghemite) particles in the stack gas that might collect on a dry filter. Varying solution chemistry in the QLIP system provided a range of results, but, in general, reproducibility of results with for a specific solution was acceptable. The technique has not been developed further, since more focus has been placed on direct measurement of stack gases using continuous mercury monitoring. However, results from all FAMS-QLIP tests conducted by the DNR (assisted by NRRI) are reported in Appendix II.
The University of North Dakota, Energy and Environmental Research Center
(EERC) has led method development for Continuous Mercury Monitors (CMMS) in taconite process gases under a series of research grants provided by the MN DNR. Initial tests using CMM’s were largely consistent over time and responsive to changes in mineral processing conducted in the plant. However, there were periods of considerable instability in the signal, also though to be related to interference with particles trapped in the dry filtration (DF) system used in the earlier techniques. Specific results using DF systems in taconite plant tests are reported in Berndt and Engesser (2007).
Use of an inertial separation probe (ISP) to eliminate this interference in a duct
stream was investigated, but did not solve the problem, and generated what appeared to be an unacceptably high percentage of oxidized mercury (Laudel et al., 2007). EERC developed a more promising method, referred to as the “Advanced Wet System” (AWS), to allow collection of the gases without use of a filter. Similar to the QLIP method, sampled gases in the AWS system first contact water that is injected into the sampling probe and can, therefore, prevent reactions from occurring between the mercury in the process gas and the dry, reactive iron oxides. The water/gas mixture is carried to the instrument in two streams, one to convert all of the mercury to elemental form (for
Page 6 of 23
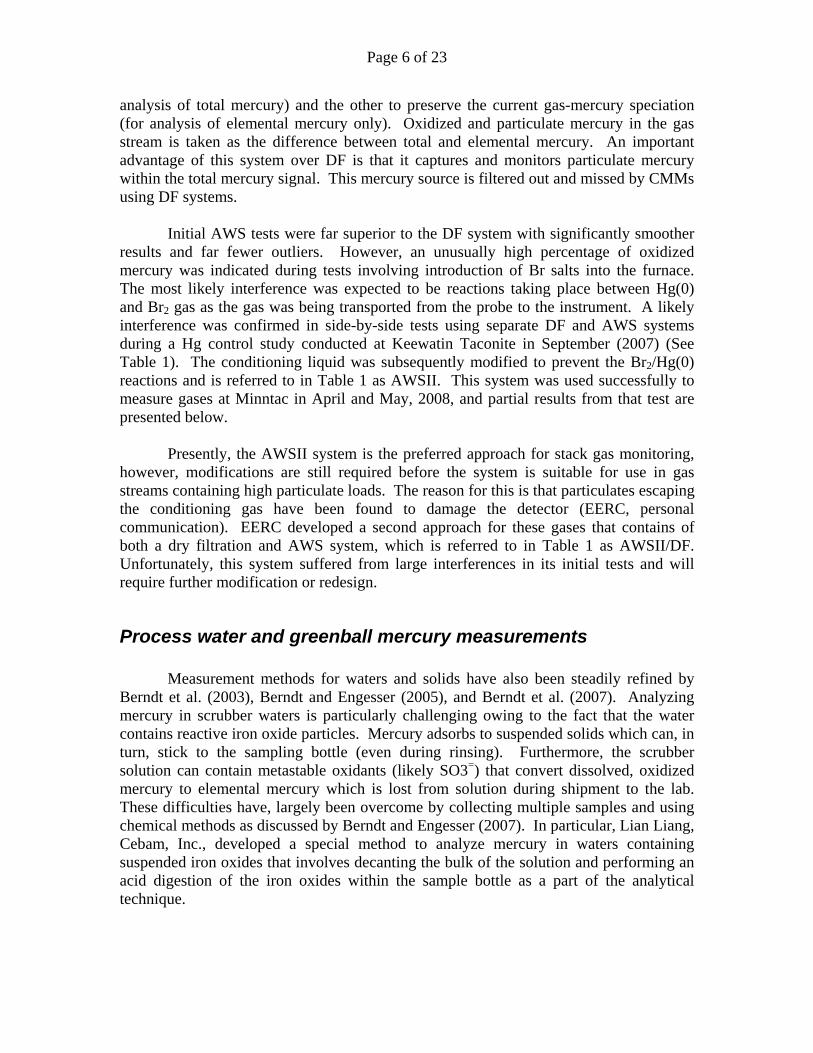
analysis of total mercury) and the other to preserve the current gas-mercury speciation (for analysis of elemental mercury only). Oxidized and particulate mercury in the gas stream is taken as the difference between total and elemental mercury. An important advantage of this system over DF is that it captures and monitors particulate mercury within the total mercury signal. This mercury source is filtered out and missed by CMMs using DF systems.
Initial AWS tests were far superior to the DF system with significantly smoother
results and far fewer outliers. However, an unusually high percentage of oxidized mercury was indicated during tests involving introduction of Br salts into the furnace. The most likely interference was expected to be reactions taking place between Hg(0) and Br2 gas as the gas was being transported from the probe to the instrument. A likely interference was confirmed in side-by-side tests using separate DF and AWS systems during a Hg control study conducted at Keewatin Taconite in September (2007) (See Table 1). The conditioning liquid was subsequently modified to prevent the Br2/Hg(0) reactions and is referred to in Table 1 as AWSII. This system was used successfully to measure gases at Minntac in April and May, 2008, and partial results from that test are presented below.
Presently, the AWSII system is the preferred approach for stack gas monitoring,
however, modifications are still required before the system is suitable for use in gas streams containing high particulate loads. The reason for this is that particulates escaping the conditioning gas have been found to damage the detector (EERC, personal communication). EERC developed a second approach for these gases that contains of both a dry filtration and AWS system, which is referred to in Table 1 as AWSII/DF. Unfortunately, this system suffered from large interferences in its initial tests and will require further modification or redesign.
Process water and greenball mercury measurements
Measurement methods for waters and solids have also been steadily refined by Berndt et al. (2003), Berndt and Engesser (2005), and Berndt et al. (2007). Analyzing mercury in scrubber waters is particularly challenging owing to the fact that the water contains reactive iron oxide particles. Mercury adsorbs to suspended solids which can, in turn, stick to the sampling bottle (even during rinsing). Furthermore, the scrubber solution can contain metastable oxidants (likely SO3=) that convert dissolved, oxidized mercury to elemental mercury which is lost from solution during shipment to the lab. These difficulties have, largely been overcome by collecting multiple samples and using chemical methods as discussed by Berndt and Engesser (2007). In particular, Lian Liang, Cebam, Inc., developed a special method to analyze mercury in waters containing suspended iron oxides that involves decanting the bulk of the solution and performing an acid digestion of the iron oxides within the sample bottle as a part of the analytical technique.
Page 7 of 23
Measurement of concentration in greenball involves a straight-forward acid dissolution method as described by Berndt and Engesser (2007). However, typical errors associated with greenball analysis on samples collected at the same time can, at times, be greater than 10%. Multiple samples must be collected to decrease error and to detect and eliminate outliers.
Numerous greenball and scrubber water samples have been collected over a
period of years. The results from many of these studies have been presented by Berndt and Engesser (2005a, 2005b, and 2007). A comprehensive list of all results presented in Table 1 is still being compiled at this time, and will be provided along with interpretation in the final report.
A Recent Example: Minntac Hg-control Tests This section presents monitoring results from Hg control tests that were
conducted at US-Steel’s Minntac Operation. The purpose of this is to illustrate the strengths and short-comings of the existing monitoring techniques, especially when used to quanitify stack mercury emissions.
The tests were conducted over a period of five days, beginning April 21, 2008.
Three one day tests mercury control tests were conducted between April 22 and April 24, with April 21 and 25 being used to set up and dismantle the testing equipment. NaBr was added to greenball pellet feed on the first day of testing, CaBr2 solutions were injected into the kiln on the second day, and NaClO2, referred to as EPAoxby Berndt and Engesser (2007), was injected into the wet scrubber on the final day of control method testing.
Tests were conducted on Line 3, which is relatively small sized a Grate-Kiln that typically produces pellets at a rate of about 300 LT/hr. Recent updates were installed to the scrubber system. These include pH monitoring and lime addition to promote acid neutralization and gypsum precipitation, as well as filtering and disposal of scrubber solids. The recirculation tank has a capacity of 25000 gallons and blow down rate is typically between 50 and 60 gpm, monitored every minute. This site was selected for several reasons, including the fact that there is only one duct leading to the wet scrubber and only a single outlet leading to the waste gas stack. Furthermore, the relatively small size of the line permits testing to be conducted using less chemical and slower injection rates which significantly affects the cost of conducting the test.
Results from these tests will be described in greater detail in future reports, however, monitoring results for process gases are presented in Figures 1 and 2, Scrubber water analysis are presented in Figure 3 and Table 2, and Greenball analysis for these tests are presented in Table 3.
Figure 1 compares Total mercury in stack gas (AWSII) with Total mercury
measured in the duct (AWSII/FD) for the time period April 22 through April 25, 2008.
Page 8 of 23
The baseline value for stack gas was approximately 5000 ng m-3, but with transgressions to lower values during a plant upset on April 22, and during NaBr addition to pellets and CaBr2 injection into the kiln on April 22 and 23, respectively. THg rebound quickly once NaBr addition to pellets was stopped, but return to baseline was very slow following CaBr2 injection to the kiln. Only a slight decrease in Hg concentration was observed when NaClO2 was added to the wet scrubber suggesting this technique will not work on this line.
Ideally, gases passing through the duct on the inlet side of the scrubber should
have considerably higher THg than stack gas because some Hg is being captured by the wet scrubber. Unfortunately, except for the time period in the afternoon of April 23 and morning of April 25th, THg for the inlet registered well below the stack gas THg concentration. It is clear that interference negatively impacted the scrubber inlet signal, thus complicating interpretation of trap mechanism.
Figure 2 compares total and elemental mercury for the stack gas which, for the
most part, appear to be of adequate quality and consistency to provide relatively confident interpretation. First, NaBr addition to pellets resulted in a decrease in the emission of mercury from THg = 5200 ng m-3 under baseline conditions to approximately 2400 ng m-3 during the short-termed test. This would indicate a 54% mercury reduction compared to baseline capture rates. Similarly, CaBr2 addition to the kiln resulted in a decline in THg from 5100 to 1400 ng m-3
suggesting a 73% reduction compared to baseline capture rates. Difficult to interpret, however, is the relatively long term response from the CaBr2 test. Is this a result of a monitoring issue or a signal that mercury is being stored somewhere in the process line or worse, somehow being emitted elsewhere?
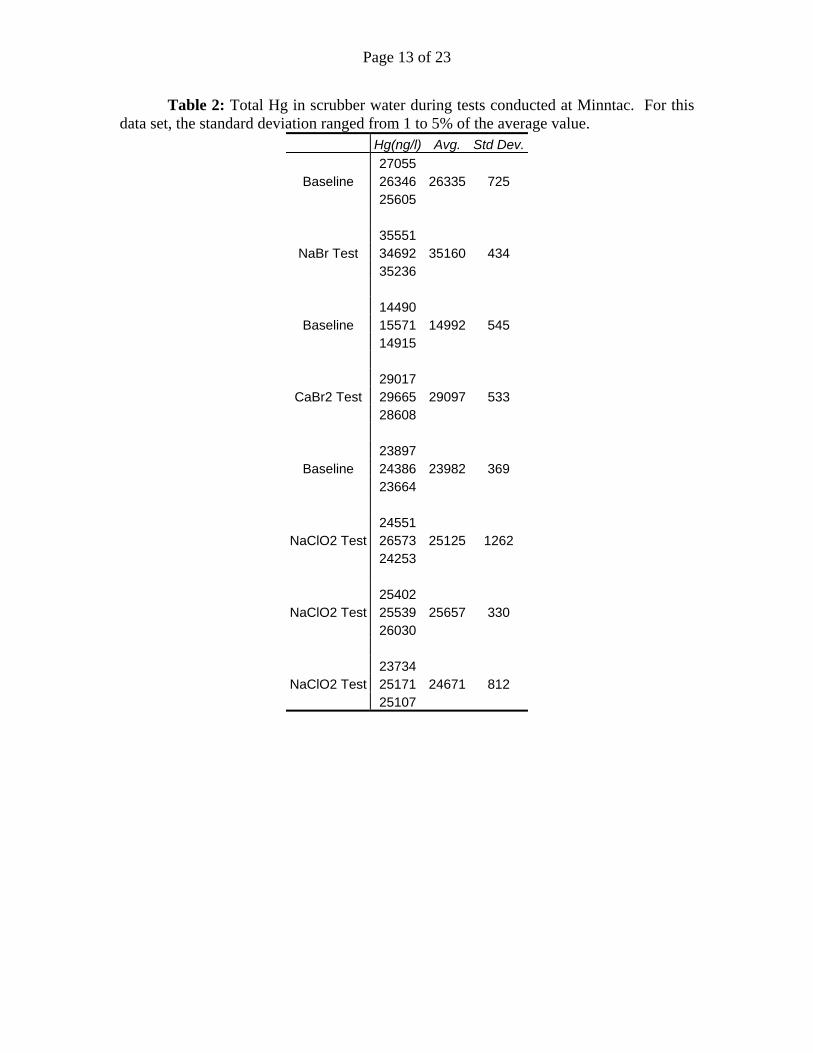
Table 2 provides THg for scrubber water blowdown water that was sampled under
baseline conditions prior to each test and for waters collected at the same location as the testing period was drawing to a close. Standard deviation for samples ranged between 1 and 5% of the total value (sampled in triplicate) which is a satisfactory result, considering that a large fraction of the mercury is adsorbed to particles in the process stream. If the percentage of particles changed greatly during collection of samples, the mercury concentration would reflect this change. However, the scrubber flow appears to be sufficiently homogeneous to allow collection of a representative sample. THg in blow down water increased from 26335 to 35160 ng/l during the NaBr test and from 14992 to 29097 during the CaBr2 test, mirroring the changes observed in stack emissions. In detail, however, full interpretation depends on comparing the actual mercury mass gains in the scrubber to the total mass of mercury removed from the stack gas (see below).
Mercury speciation in the scrubber water is important for determining ultimate
fate of the trapped mercury. The distribution of dissolved and particulate bound mercury is determined by comparing total mercury concentration in filtered and unfiltered scrubber water samples. Typically, only one water sample is filtered for this determination owing to the difficulty involved with filtering these waters, which have high suspended loads, at the plant-site. Failure to filter a sample immediately upon sampling will result in overestimation of the adsorbed fraction since adsorption occurs on
Page 9 of 23
time scales of minutes to hours (Berndt et al., 2003; Berndt and Engesser, 2005b). For the set of solutions collected during the Minntac tests, it was found that the addition of NaBr to the scrubber water resulted in transfer of much of the adsorbed mercury into the water. This is indicated by the fact that Hg(D) increased from a small percentage of the total mercury, while Hg(P) decreased. For the CaBr2 tests, performed on the day following the NaBr test, H(D) was still relatively high before the test period, and total mercury in the scrubber was significantly less than it was at the start of the previous day. Once CaBr2 was injected into the kiln, both Hg(D) and Hg(P) increased together. Finally, during the NaClO2 tests, Hg(D) increased from its baseline value at the expense of Hg(P), resulting in little net gain in Hg(T). This trend indicates that NaClO2 addition was interfering with the ability of the suspended material to adsorb mercury from solution rather than helping elemental mercury in process gas to oxidize and dissolve in the scrubber water.
Table 3 provides greenball mercury analysis, which were also sampled in
triplicate under baseline conditions before the test began, and then while the tests were being conducted. The mercury concentration in greenball is more variable than that measured for scrubber water (Std. Dev. from 0 to 30%), and it is unclear if this is related to analytical or sampling errors. However, these data suggest that the mercury concentration in greenball may have dropped slightly on the second day of testing (e.g., under baseline and test period conditions during the CaBr2 test).
Mass balance comparison for the three measured process streams are provided in
Table 4. These values are calculated based on measured production rates, monitored blowdown rates, and estimated stack gas flow rates. While all of these rates are measured constantly by Minntac for their Line 3, the unit measuring stack gas flow rate was, unfortunately, malfunctioning at the time of the mercury testing. Calculations for stack emissions were made, therefore, using a typical rate for this line (270000 scfm). The values for blowdown water are calculated based on the assumption that the entire contents of the recirculation tank (25000 gallons) changed, but that blow down water was continuously being removed at the measured rate and makeup water containing little mercury was being added. Additionally, feed to grates is typically measured before the pellets are dried and do not take into account loss of greenball during transfer of material to the grate. A so-called “pellet factor” of 0.85 was used for these calculations. These values should be regarded as preliminary.
Ideally, the rate of mercury emission at the stack should balance the mercury
delivered to the furnace in greenball minus the mercury trapped in the wet scrubbers, assuming no other significant Hg sources. The company was burning natural gas during this test and pellets have been measured previously and found to have very low mercury, as is the case for the scrubber makeup water. Multiclone dust, measured previously, has been found to have only a small fraction of the mercury generated by greenball firing (Berndt, 2003).
For the initial baseline condition, before tests began, approximately 766 ug/sec
Hg was being added to the furnace along with greenballs, but 100 ug/sec was being
Page 10 of 23
captured by the scrubber, leaving a net difference of 666 ug/sec emitted at the stack. The compares with estimated emissions of 675 ug/sec estimated from direct stack gas measurement. A similar level of agreement was obtained for baseline conditions before the CaBr2 test when stack measurements suggest emission at a rate of 649 ug/sec compared to 672-66 or 606 ug/sec for the mass balance estimate.
In contrast, there is a large divergence in stack emissions estimated by direct
measurement and mass balance estimates. For example, direct measurements suggest that 306 and 178 ug/sec Hg was being emitted during the NaBr and CaBr2 test periods, respectively, while the mass balance estimates suggest much higher values of 738 and 375 ug/sec. Mass balance estimates provide much higher calculated emission rates than those estimated from stack gas chemistry during the NaClO2 tests. Finding the source of the discrepancy in stack emissions based on the two approaches is a primary goal of the next year of research on stack gas monitoring.
Conclusions Sufficient experience has been gained to provide a relatively high degree of
confidence in our methods for measuring mercury concentration in stack gasses using CMMs (using EERC’s AWSII system), however, improvement is needed for measurement of mercury in duct gases prior to particulate control devices. Similar confidence is also found for analytical methods for Hg in scrubber water and greenball, however, the uncertainty associated with greenball concentrations can be relatively high if sampling frequency is low.
When mercury balance estimates were performed under baseline conditions before testing began, it was found that the rate of mercury addition to the furnace (in greenball feed) minus mercury captured by the wet scrubber (in the wet scrubber) balanced mercury emitted in the stacks. However, this steady-state balance was greatly upset once testing began such that the measured stack emissions were far lower than mass balance estimates would suggest. Finding the source or sources of this imbalance is a major goal of the next year of testing at taconite plant facilities.
Page 11 of 23
References Berndt, M. E. (2003) Mercury and Mining in Minnesota, Minerals Coordinating
Committee Final Report. Minnesota Department of Natural Resources Technical Report. 58 p.
Berndt, M. E. and Engesser, J. (2005a) Mercury Transport in Taconite Processing Facilities: (I) Release and Capture During Induration. Iron Ore Cooperative Research Final Report. Minnesota Department of Natural Resources. 31 pages plus appendices.
Berndt, M. E. and Engesser, J. (2005b) Mercury Transport in Taconite Processing Facilities: (II) Fate of Mercury Captured by Wet Scrubbers. EPA: Great Lakes National Program Office Report. 32 pages.
Berndt, M. E. and Engesser, J. (2007) Mercury Transport in Taconite Processing
Facilities: (III) Control Method Test Results. Iron Ore Cooperative Research Final Report. Minnesota Department of Natural Resources. 38 pages plus appendices.
Berndt, M. E., Engesser, J. E., and Johnson, A. (2003) On the distribution of mercury in
taconite plant scrubber systems. Technical report submitted to the MPCA, 30 p. Berndt, M. E., Engesser, J., and Berquó, T. S. (2005) Mercury Chemistry and Mössbauer
Spectroscopy of Iron Oxides During Taconite Processing on Minnesota’s Iron Range. In Proceedings Air Quality V, International Conference on Mercury, Trace Elements, SO3, and Particulate Matter. Washington, DC, Sept. 2005. 15 p.
Engesser, J. and Niles, H. (1997) Mercury emissions from taconite pellet production.
Coleraine Minerals Research Laboratory, Report to MPCA: U of M contract # 1663-187-6253. 16 pages plus tables, figures and appendices.
Laudal, D. (2007) “Methods Testing for Measurement of Mercury Speciation for High-Reactive Dust”; Technical Report to Minnesota Department of Natural Resources, UND Fund No. 9301.
Page 12 of 23
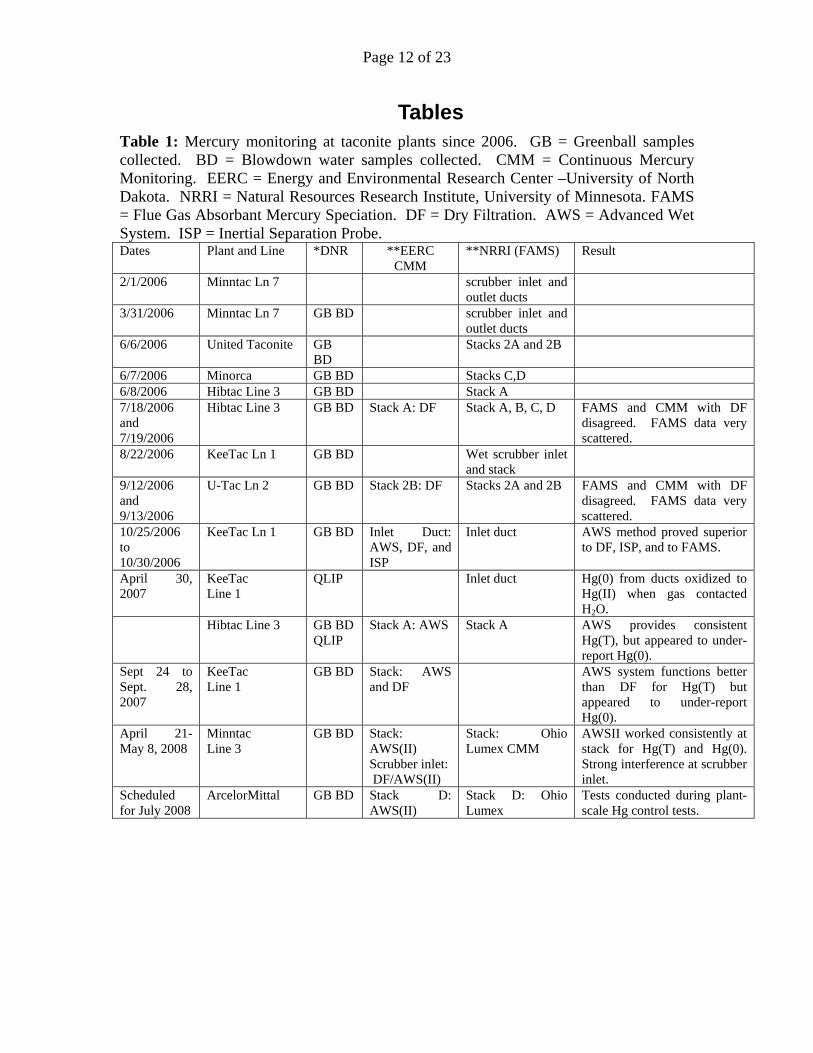
Tables Table 1: Mercury monitoring at taconite plants since 2006. GB = Greenball samples collected. BD = Blowdown water samples collected. CMM = Continuous Mercury Monitoring. EERC = Energy and Environmental Research Center –University of North Dakota. NRRI = Natural Resources Research Institute, University of Minnesota. FAMS = Flue Gas Absorbant Mercury Speciation. DF = Dry Filtration. AWS = Advanced Wet System. ISP = Inertial Separation Probe. Dates Plant and Line *DNR **EERC
CMM **NRRI (FAMS) Result
2/1/2006 Minntac Ln 7 scrubber inlet and outlet ducts
U-Tac Ln 2 GB BD Stack 2B: DF Stacks 2A and 2B FAMS and CMM with DF disagreed. FAMS data very scattered.
10/25/2006 to 10/30/2006
KeeTac Ln 1 GB BD Inlet Duct: AWS, DF, and ISP
Inlet duct AWS method proved superior to DF, ISP, and to FAMS.
April 30, 2007
KeeTac Line 1
QLIP Inlet duct Hg(0) from ducts oxidized to Hg(II) when gas contacted H2O.
Hibtac Line 3
GB BD QLIP
Stack A: AWS Stack A AWS provides consistent Hg(T), but appeared to under-report Hg(0).
Sept 24 to Sept. 28, 2007
KeeTac Line 1
GB BD Stack: AWS and DF
AWS system functions better than DF for Hg(T) but appeared to under-report Hg(0).
April 21- May 8, 2008
Minntac Line 3
GB BD Stack: AWS(II) Scrubber inlet: DF/AWS(II)
Stack: Ohio Lumex CMM
AWSII worked consistently at stack for Hg(T) and Hg(0). Strong interference at scrubber inlet.
Scheduled for July 2008
ArcelorMittal
GB BD Stack D: AWS(II)
Stack D: Ohio Lumex
Tests conducted during plant-scale Hg control tests.
Page 13 of 23
Table 2: Total Hg in scrubber water during tests conducted at Minntac. For this data set, the standard deviation ranged from 1 to 5% of the average value.
Hg(ng/l) Avg. Std Dev. 27055
Baseline 26346 26335 725 25605 35551
NaBr Test 34692 35160 434 35236 14490
Baseline 15571 14992 545 14915 29017
CaBr2 Test 29665 29097 533 28608 23897
Baseline 24386 23982 369 23664 24551
NaClO2 Test 26573 25125 1262 24253 25402
NaClO2 Test 25539 25657 330 26030 23734
NaClO2 Test 25171 24671 812 25107
Page 14 of 23
Table 3: Total Hg in greenball feed during tests conducted at Minntac. For this data set, the standard deviation ranged from 0 to 30% of the average value. Even if the
15.8 value measured for greenball during the second baseline test is rejected as an outlier, the standard deviation ranged up to 13%.
Hg (ng/g) Avg. Std Dev. 10.3
Baseline 10.0 10.6 0.7 11.4 14.4
NaBr Test 11.1 13.0 1.7 13.5 9.1
Baseline *15.8 11.5 3.7 9.5 8.5
CaBr2 Test 9.2 8.4 0.8 7.6 11.8
Baseline 11.3 11.5 0.3 11.3 11.2
NaClO2 Test 11.2 11.2 0.0 11.2 11.7
NaClO2 Test 11.3 11.8 0.6 12.4 11.8
NaClO2 Test 11.1 11.4 0.3 11.3
*Suspected outlier.
Page 15 of 23
Table 4. Preliminary mercury flux estimates for various processing streams during tests conducted at Minntac in April 2008.
Hg flux, ug/sec Greenball Blowdown Stack Gas Baseline 766 100 675 NaBr test 939 201 306
Figure 1: Hg concentration in inlet and outlet to wet scrubber as measured by CMM. Horizontal scale is a digital time scale referring to the dates in April, 2008, when testing was conducted. The inlet concentrations were measured by EERC using AWSII , but modified with a dry filter at the duct (AWS/DF). The outlet concentrations were measured at the stack using EERC’s AWSII, the currently preferred method for monitoring mercury in taconite stack emissions. The outlet signal is relatively smooth and responsive to imposed changes in processing. The inlet signal is highly irregular, often revealing concentrations lower than those found in the outlet (e.g., overnight on the 23rd and 25th of April). Beginning with the CaBr2 test on April 23rd, however, the inlet concentrations were similar to but slightly elevated compared to outlet concentrations. It is believed that the dry filtration unit placed in-line near the sampling probe for the inlet is responsible for this erratic behavior.
0
1000
2000
3000
4000
5000
6000
7000
8000
9000
10000
22.0 23.0 24.0 25.0
DDOY
Hg
(ng
m-3)
inlet total Hg outlet total Hg
0
1000
2000
3000
4000
5000
6000
7000
8000
9000
10000
22.0 23.0 24.0 25.0
DDOY
Hg
(ng
m-3)
inlet total Hg outlet total Hg
NaBr Test
CaBr2 Test
NaClO2 Test
PlantUpset
InletInterference
InletInterference
Page 17 of 23
Figure 2: Speciation of Hg as measured by the CMM using the AWS system in Line 3 Stack gases during conduction of mercury control tests at Minntac (Line 3). Horizontal scale is a digital time scale referring to the dates in April, 2008, when testing was conducted. There appeared to be a long warm-up interval for the system early on April 22, when elemental mercury was being under reported, but the results after this appear to be relatively smooth and responsive to the conducted tests. Total and elemental mercury concentrations closely parallel each other, indicating most of the emitted mercury is elemental and not oxidized or particulate mercury.
0
1000
2000
3000
4000
5000
6000
7000
8000
9000
10000
22.0 23.0 24.0 25.0
DDOY
Hg
(ng
m-3)
outlet total Hg outlet elemental Hg
NaBr Test
CaBr2 Test
NaClO2 Test
PlantUpset
NaBr Test
CaBr2 Test
NaClO2 Test
PlantUpset
Page 18 of 23
0
5000
10000
15000
20000
25000
30000
35000
40000
Baseline NaBr test Baseline CaBr2test
Baseline NaClO2 NaClO2 NaClO2
Hg(P)Hg(D)
Figure 3: Mercury speciation in scrubber blowdown water during Hg-control
testing at Minntac. Note that Hg(P) + Hg(D) = Hg(T) so the change in Hg concentration is reflected by the total height of each of the plotted columns. It was found that addition of NaBr to greenball resulted in a dramatic change in speciation during these tests. In effect, much of the Hg that was originally adsorbed to suspended particles was, instead, dissolved in solution. Injection of CaBr2 into the kiln also resulted in a change in mercury speciation, but there was still a clear observed increase in particulate mercury. Injection of NaClO2 into the scrubber water resulted in little net change in Hg(T), but indicated significant conversion of Hg(P) to Hg(D).
Page 19 of 23
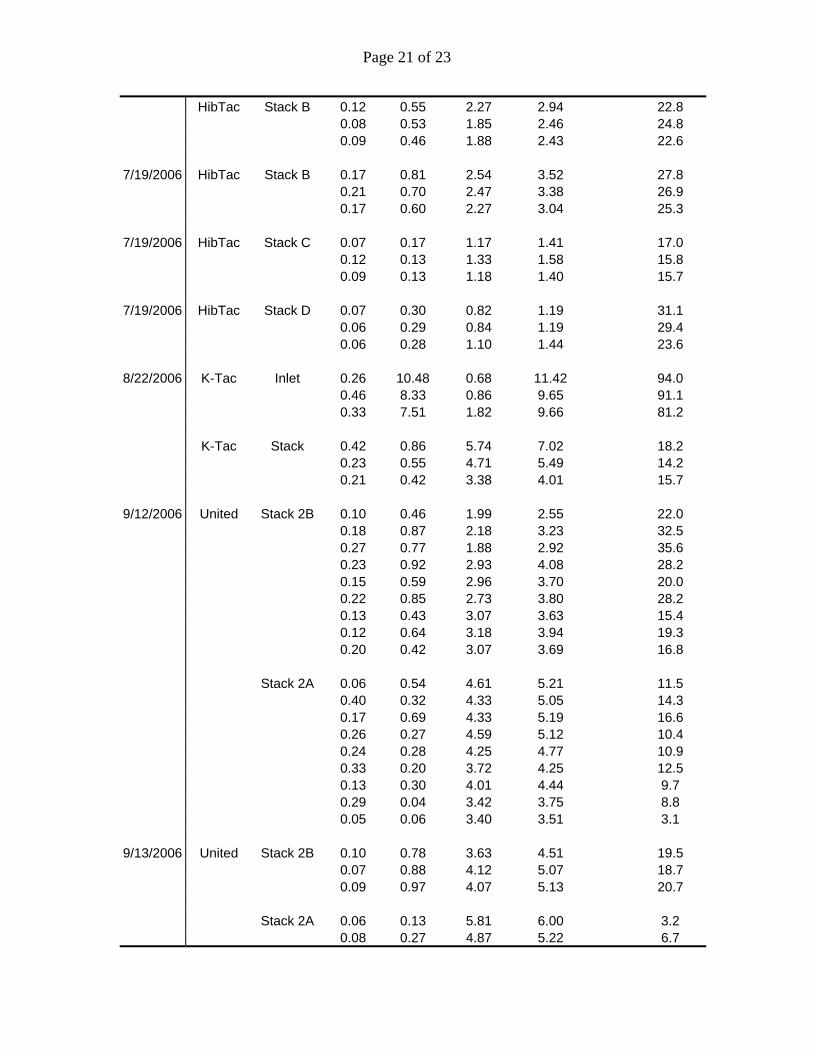
Appendix 1: FAMS measurements made at taconite processing facilities.
FAMS measurements made by NRRI at taconite processing facilities. Hg(P) is particulate Hg, Hg(Ox) is oxidized gaseous mercury, and Hg(El) is elemental mercury. %Ox is the percentage of total mercury present in particulate or gaseous oxidized forms.
Date Company Location Hg(Part) Hg(Ox) Hg(El) Hg(Tot) %Ox 1/5/2005 MnTac Ln6 Inlet 1.13 0.10 4.69 5.92 20.8
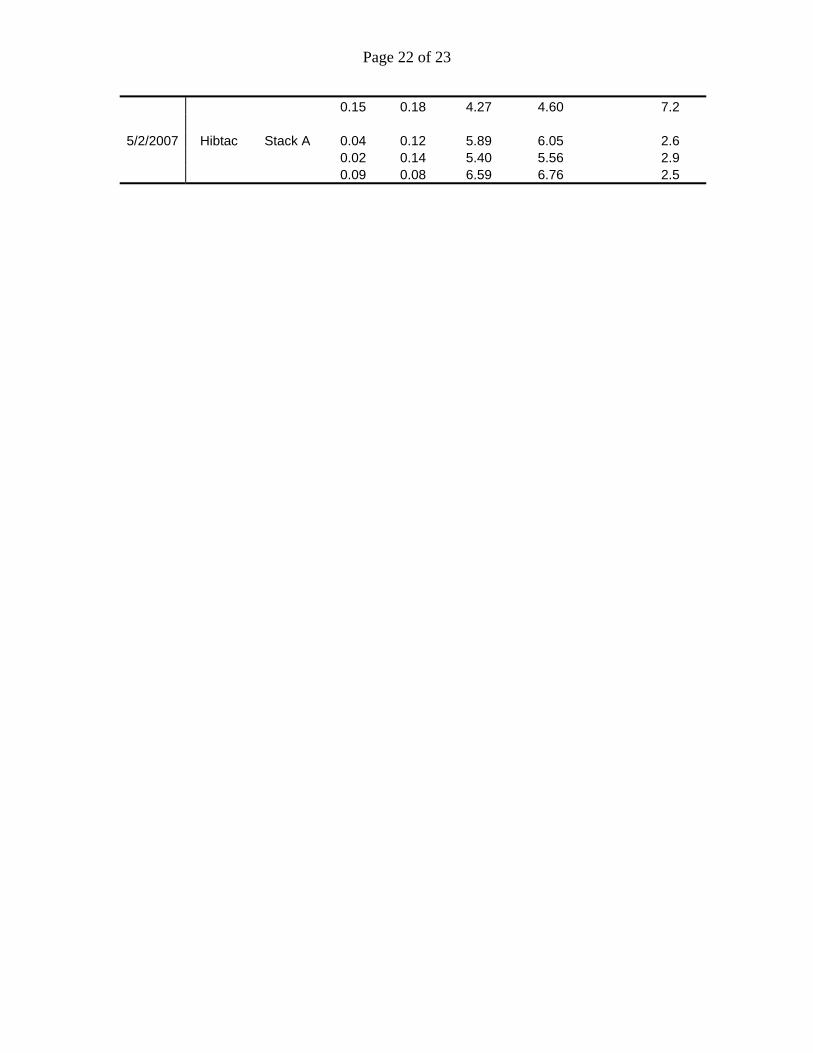
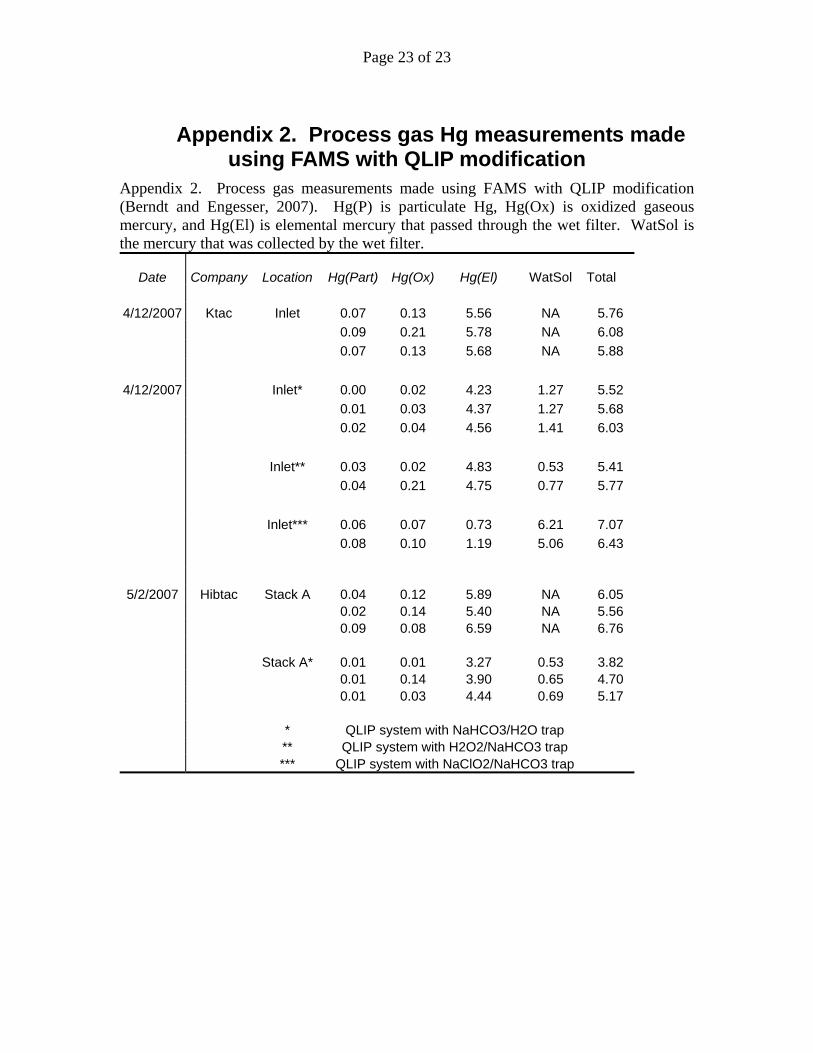
Appendix 2. Process gas Hg measurements made using FAMS with QLIP modification
Appendix 2. Process gas measurements made using FAMS with QLIP modification (Berndt and Engesser, 2007). Hg(P) is particulate Hg, Hg(Ox) is oxidized gaseous mercury, and Hg(El) is elemental mercury that passed through the wet filter. WatSol is the mercury that was collected by the wet filter.
Date Company Location Hg(Part) Hg(Ox) Hg(El) WatSol Total