On the Near-Wake of a Formula One Front Wheel R. D. Knowles A. J. Saddington K. Knowles Aeromechanical Systems Group Cranfield University, Defence Academy of the United Kingdom Shrivenham, Swindon, SN6 8LA Abstract Velocity measurements were made in the near-wake of the front wheel of a Formula One car using a laser Doppler anemometer. Tests were carried out at 50 percent-scale in a closed- return, three-quarter open-jet wind tunnel. Three configurations were investigated to determ- ine the effect of both the car, and an external wheel support strut, on the wheel wake. In each of the configurations the test Reynolds number, based on wheel diameter, was 6.8 × 10 5 . Three components of velocity were measured at two planes less than one wheel diameter downstream of the wheel axis. These data were used to visualise the extent of the wake, the flow structures present and also the streamwise turbulence intensity. The presence of the car was found to alter significantly the structure of the wheel wake when compared to an isolated wheel. In addition, the external support strut was found to have less impact in the presence of the car than previous isolated wheel measurements had suggested. 1
Transcript
On the Near-Wake of a Formula One Front Wheel
R. D. Knowles A. J. Saddington K. Knowles
Aeromechanical Systems Group
Cranfield University, Defence Academy of the United Kingdom
Shrivenham, Swindon, SN6 8LA
Abstract
Velocity measurements were made in the near-wake of the front wheel of a Formula One
car using a laser Doppler anemometer. Tests were carried out at 50 percent-scale in a closed-
return, three-quarter open-jet wind tunnel. Three configurations were investigated to determ-
ine the effect of both the car, and an external wheel support strut, on the wheel wake. In
each of the configurations the test Reynolds number, based on wheel diameter, was 6.8×10⁵.
Three components of velocity were measured at two planes less than one wheel diameter
downstream of the wheel axis. These data were used to visualise the extent of the wake, the
flow structures present and also the streamwise turbulence intensity. The presence of the car
was found to alter significantly the structure of the wheel wake when compared to an isolated
wheel. In addition, the external support strut was found to have less impact in the presence of
the car than previous isolated wheel measurements had suggested.
1
Keywords: LDA, Formula One, Wheel Wake
SYMBOLS
D wheel diameter
f focal length (of laser Doppler anemometer probe)
t transit time (of seeding particle)
u velocity component in the x-direction
u∞ freestream velocity
v velocity component in the y-direction
w velocity component in the z-direction
x streamwise Cartesian coordinate (see Figure 1)
y crosswise Cartesian coordinate (see Figure 1)
z vertical Cartesian coordinate (see Figure 1)
τi integral timescale
1 INTRODUCTION
There is an increasing amount of literature detailing experimental measurement of the wake of
isolated wheels, particularly with application to single-seat race car aerodynamics. This has been
augmented recently by several computational studies that have exploited advances in computa-
tional methods and the general reduction in the cost of computing to verify high-fidelity CFD
models against this difficult, multi-faceted flow problem.
2
Early experimental work suffered from a lack of availability of rolling roads and consequently
developed novel solutions to allow rotating wheels with static ground planes. Morelli [1] overcame
some of the problems by allowing the rotating wheel to protrude through the ground plane, thereby
ensuring that no physical contact was made. Stapleford and Carr [2] and Cogotti [3] positioned a
rotating wheel a small distance from the ground and then sealed the resultant gap with flexible /
low-friction materials. Comparison of the results of these two methods confirmed that any small
gap between the wheel and ground is sufficient to reverse the, now accepted, positive lift vector
acting on the wheel. The lack of moving-ground wind tunnels at that time drove work to establish
whether, for road-vehicle aerodynamic development, a stationary wheel could provide a sufficient
proxy for the real-life rotating alternative.
Probably the most comprehensive early experimental work on isolated wheel wakes was that
of Fackrell [4] and Fackrell and Harvey [5, 6] which gathered surface pressure and wake pressure
data for both a stationary wheel and a rotating wheel (with moving ground). In addition, the work
also demonstrated the sensitivity of wheel flow fields to tyre shoulder geometry, albeit performed
on a non-deformable tyre. Of particular significance was the theoretical proposition that the con-
vergence of moving surfaces (rotating wheel and moving ground) upstream of the tyre contact
patch would generate significant viscous action and eject a jet from this region. The proposition
was made to explain a significant pressure peak that was observed in front of the contact patch,
which was entirely absent from the stationary case. With these measurements Fackrell [4] was
the first to demonstrate that both ground motion and wheel rotation were essential for the invest-
igation of isolated wheel flows. Several studies subsequently confirmed that the same conditions
3
were also essential for correct full-vehicle simulation. These studies included research at Ford by
Hackett et al. [7], Imperial College, London by Bearman et al. [8] and General Motors by Mercker
and Berneburg [9], Mercker et al. [10], all on road car geometries. Later work by Wildi [11] and
Mueller et al. [12] at Porsche confirmed the significance of ground motion and wheel rotation on
race car aerodynamics.
One area of experimental work looked to address the problem of wheel lift measurement,
which is complicated by mechanical ground contact. Stapleford and Carr [2], Fackrell [4] and
Cogotti [3] calculated wheel force by measuring the surface pressure acting on the rotating surface
of the wheel and integrating it. Latterly Hinson [13], Skea et al. [14] and Mears [15–18] all made
measurements using the pressure integration method with higher-fidelity pressure measurement
systems. Each investigator used a different wheel geometry, therefore quantitative comparison is
impossible, but their results do agree qualitatively. In particular, Hinson and Mears both identified
a significant negative pressure peak downstream of the contact patch. This was proposed to be
generated by the rapid divergence of the wheel and road surfaces, the inverse of the action on the
upstream side of the contact patch proposed by Fackrell [4].
In recent years, the advent of steel-belt rolling road systems has allowed direct measurement of
wheel forces by load cells positioned beneath the belt, directly below the tyre contact patch, as used
by Wäschle et al. [19]. Whilst this is becoming increasingly common in automotive development,
the authors are unaware of further published literature on this topic. The remaining experimental
work has focussed on providing measurements of wheel wakes to determine the structure and
interactions at work.
4
An in-depth wake survey was conducted by Nigbur [20], who measured three-components
of velocity in the wake of a 50 percent-scale Formula One wheel using a hot-wire anemometer.
Ten streamwise planes were measured, with the data presented as time-averaged contours of each
component, plus contours of the associated root-mean-square (RMS) fluctuations. Analysis of the
vortical structures in the wake was difficult as the spanwise and vertical velocity components were
presented individually, rather than as in-plane vectors. The streamwise data were somewhat more
informative, confirming the distinctive wake profile identified by Fackrell [4] (inverted-T or ⊥ in
the vertical plane perpendicular to the stream wise direction). The data also exhibited regions with
high RMS values, particularly downstream of the support strut. No regions of reversed flow could
be identified in the wake as the anemometer was insensitive to the direction of the streamwise ve-
locity component. The wake was notably asymmetric which was attributed to ineffective boundary
layer suppression by a small moving ground that was approximately the same size as the wheel.
Further studies of the wake of isolated race car wheels were reported by Knowles [21–24],
Mears [15–18] and Wäschle et al. [19]. Knowles and Wäschle et al. used laser Doppler anem-
ometry (LDA), whilst Mears et al. used particle image velocimetry (PIV), both sensitive to flow
direction. All authors measured asymmetric wake structures, particularly in the vertical plane
perpendicular to the streamwise direction, which featured combinations of trailing vortices, de-
pendent on test geometry and measurement location. Recently Issakhanian et al. [25] produced
PIV measurements in the wake of a similar isolated race car wheel which confirmed the observa-
tions of the previous authors whilst also providing valuable validation data for their subsequent
computational research.
5
Early computational fluid dynamic wheel simulations, such as those performed by Skea et al.
[26], Axon [27], Basara et al. [28], Knowles [23], Mears et al. [17] were predominantly steady-
state, finite-volume simulations using various Reynolds-Averaged Navier-Stokes (RANS) codes
and turbulence models. The various turbulence models and numerical schemes all failed to ac-
curately predict the main forces on the wheel. In the majority of cases this was due to incorrect
prediction of flow separation from the tyre. In general these investigations did not greatly add to
the information provided by the experimental literature. The Lattice-Boltzman simulation carried
out by Wäschle et al. [19] improved lift prediction but drag forces were still in error, suggesting
that the flow field remained incorrect. More recently two authors have published the results of sig-
nificantly higher-fidelity computational models than those previously mentioned. McManus and
Zhang [29] extended previous RANS work presenting results from Unsteady RANS (URANS)
simulations of the experiments of Fackrell [4]. The work clearly visualised the flow features pos-
tulated by Fackrell from his experimental data and also extended the wake schematic previously
proposed by Knowles [23]. As with the previous RANS-based computational studies, the simula-
tions struggled to predict the lift and drag forces acting on the wheel.
Axerio et al. (2009 and 2012) reported simulations of the experimental work of [25] compar-
ing several turbulence modelling approaches and found significantly improved prediction of both
the flow field and vortex dynamics using URANS (k-ω Shear Stress Transport) and Large Eddy
Simulation. This work was, however, performed on a stationary wheel, which is perhaps less com-
putationally challenging, due to the different predominant flow features. Force predictions were
not compared to experimental values.
6
2 AIMS AND OBJECTIVES
The aim of this study was to outline the wake of a Formula One wheel in the presence of a Formula
One car and identify the main areas of difference between that and an isolated wheel. In addition
the study aimed to illustrate the effect of an external support strut in the presence of the car. The
objective of the study was to generate three-dimensional mean velocity data in a region less than
one wheel diameter downstream of the wheel axis, termed the near-wake.
3 EXPERIMENTAL SET-UP
The following description of the experimental set-up is broken down into three main sections: the
wind tunnel; the test components; and the anemometer.
3.1 Wind Tunnel
Cranfield University’s D.S. Houghton wind-tunnel at the Defence Academy of the United King-
dom in Shrivenham was used for all testing. It is a 2.74 m by 1.66 m closed-return, three-quarter
open-jet wind tunnel (Figure 1) equipped with a continuous-belt rolling road system. The moving-
ground, synchronised with the tunnel freestream velocity, provided both boundary layer suppres-
sion and wheel rotation. The wind-tunnel ground boundary layer was removed by the application
of suction immediately upstream of the rolling-road. The level and distribution of the suction were
optimised during wind tunnel commissioning, and coupled with a knife-edge transition to the belt,
ensured minimal belt boundary layer. A vertical profile of total pressure (normalized to the tunnel
7
Fan
RollingRoad
Boundary LayerSuction
FlowDirection
TurbulenceReduction Screens
X
X
Z
SeedingGenerator
Wheel Assembly& Support Sting
Y
Fig. 1: Schematic representation of the test configuration.
centreline value) is shown in Figure 2 and reveals a small total pressure gradient, which rose by ap-
proximately 0.7% as the belt was approached. The minimum recorded total pressure was 99.76%
of the freestream value, occurring 0.754 mm above the surface of the belt. The action of the aero-
dynamic loads from both the wheel, and more significantly, the model car were counteracted by
the application of distributed suction to the underside of the rolling-road belt. The temperature of
the air and rolling-road surface were held constant (25 ◦C ± 0.5 ◦C) throughout testing by active
temperature control. Further details of the wind tunnel, rolling road and calibration can be found
in Finnis et al. [32].
8
Normalized Total Pressure
z[m
m]
0.6 0.7 0.8 0.9 1.0 1.10
100
200
300
400
500
0.6 0.7 0.8 0.9 1.0 1.10
10
20
30
40
50
Fig. 2: Boundary layer profile at the wheel test location.
9
3.2 Test components
All of the components represented the state-of-the-art when tested having been employed in the
development of Formula One cars from 2000 onwards. The following sections describe the wheel,
external support sting and car model. Three combinations of these components were tested: wheel
and sting; wheel, sting and car and wheel and car. Comparison of these three test configurations
allowed the effect of the car and the effect of the external support sting to be separately evaluated.
3.2.1 Wheel and sting assembly
The 50 percent-scale Formula One front wheel assembly is shown in exploded detail in Figure 3.
The figure illustrates the hub spoke pattern and the shape of the non-deformable, carbon-fibre tyre,
including the grooves on its surface. Flow through the hub is restricted by the presence of the brake
rotor and suspension upright. The brake rotor was mounted to the hub and rotated with it, the radial
channels in the disc acting as a simple centrifugal pump. The suspension upright was mounted
directly to either the wheel support strut or car suspension (depending on test configuration) and
therefore remained stationary (non-rotating). The upright was produced using stereolithographic
sintering and featured an intricate spoke pattern which allowed limited air passage.
The support sting featured a symmetrical aerofoil cross-section (thickness-to-chord ratio of
0.39) which (see Figure 1) was mounted beside the rolling road such that the wheel position
remained constant throughout the test configurations. No additional vertical force was applied to
the wheel. Regular checks were performed with a stroboscope and optical tachometer to confirm
that wheel vibration was minimal and that the rotational speed of the wheel matched the belt/wind
10
Fig. 3: Formula One wheel assembly and support sting.
Key: 4 = Suspension Upright
1 = Wheel Hub 5 = Wheel Drag Loadcell
2 = Non-Deformable Tyre 6 = Loadcell Shroud
3 = Brake Rotor 7 = Support Sting
11
Fig. 4: Installed Formula One car model.
speed.
3.2.2 Formula One Car
Two of the three test configurations featured a fully-detailed, 50 percent-scale model Formula One
car. The car was suspended from the tunnel overhead support strut in close proximity to the road.
The car parameters (ride-height, pitch angle, front wing configuration etc) were fixed for all of
the tests. Only one wheel assembly was used, supported either by the sting or the car suspension
depending on the test configuration. The lack of the other three wheels was assumed to have
negligible effect in this configuration, although this assumption was not experimentally verified.
A photograph of the test configuration is shown in Figure 4.
12
3.2.3 Laser Doppler Anemometer
The laser Doppler anemometer used in this study was a Dantec FibreFlow system operating in
back-scatter mode. The system included a frequency shift on one of each of the beam pairs
(acheived by a Bragg cell) to allow determination of flow direction as well as magnitude. Or-
dinarily, this system would be operated in coincidence mode, collecting three-component velocity
data. In this case, the tunnel layout required a probe focal length greater than 2m, and only one
such lens was available. The single, f = 2.5 m probe could collect two velocity components
simultaneously, however the mean data were improved by collecting a single velocity component
per test and repeating each test three times to gather u,v and w data. A shorter focal-length probe
would have enabled simultaneous measurement of the three velocity components but placed the
probe body in the wind-tunnel jet and effectively negated the non-intrusive benefit of the LDA
technique.
The signal-to-noise ratio of the probes operating in back-scatter mode was found to be ad-
versely affected by the reflection of laser light from the test components. In particular, the reflec-
tions from the light-coloured barge-board of the car affected approximately one quarter of each
measurement plane. It was not possible to remove the reflections completely, but the application
of matt, fluorescent-magenta tape to the car doubled the data rate and increased the signal-to-noise
ratio. Fluorescent magenta was found to be more effective than conventional matt black or red as
it actively absorbed some laser light during fluorescence reducing the amount of light reflected at
the incident wavelength.
13
Flow seeding was provided by a JEM Hot2000 fog generator positioned inside the wind tunnel
duct (see Figure 1). The wake of the seeder was not detectable in the working section as it was
dissipated following passage through a set of cascades, three turbulence-reduction screens and the
boundary-layer suction. The seeder produced high-volume, ambient-temperature seeding which
was continuously generated throughout all tests. An 85:15 water-ethylene-glycol mix was used to
reduce the volatility of the seeding, which had a mean particle size of 1.3 µm.
3.3 Test procedure
All testing was carried out at a freestream velocity of 30 ms−1, which yielded a Reynolds number,
based on wheel diameter, of 6.8 × 10⁵. Reynolds number effects were not investigated in this
study. The mean freestream turbulence intensity, without the test components, was 0.25%.
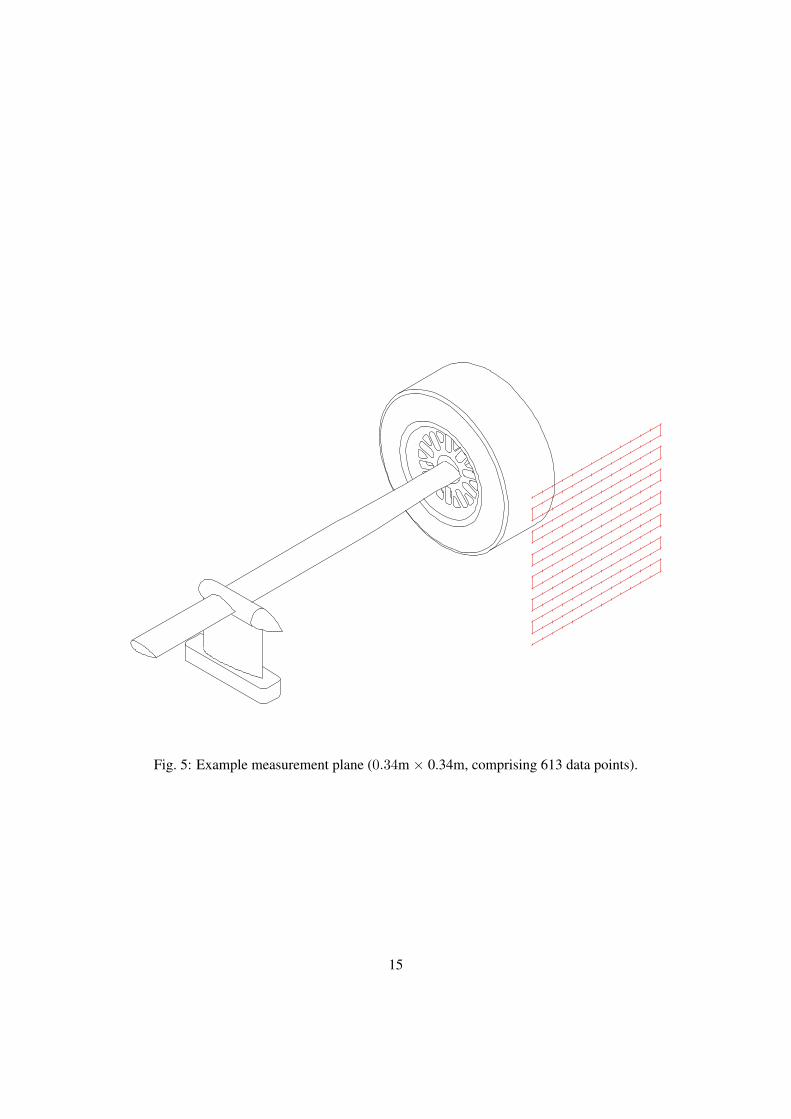
Figure 5 illustrates one of the measurement planes in the wake of the wheel. Each plane was
0.34m× 0.34m and comprised 613 data points, arranged in a y–z planar grid, perpendicular to the
freestream. The spatial resolution of the measurement plane (20 mm and 10 mm in the spanwise
and vertical directions, respectively) was chosen to ensure that the measurement volume at each
point did not overlap that of other points. Two measurement planes were extracted for each test
configuration, positioned 0.75 and 1 wheel diameter downstream of the wheel axis.
The stochastic nature of LDA sampling meant that, in order to limit the time required to com-
plete a measurement plane, the maximum sampling time (20 s) and maximum number of samples
(5000) was held constant for each data point. The data acquisition would move to the next point on
breach of either condition. These conditions attempted to maximise the sample population whilst
14
Fig. 5: Example measurement plane (0.34m × 0.34m, comprising 613 data points).
15
avoiding potentially unlimited acquisition time. A five second pause was inserted after each probe
movement to allow any probe vibration to decay.
4 UNCERTAINTY ANALYSIS
4.1 Wind and Ground Speed
Freestream air velocity was maintained to within ±0.2% of the target wind speed by the wind
tunnel control system, whilst the rolling-road belt speed was governed to within ±0.07% of the
same target.
4.2 Positional Uncertainty
The passage of a particle through any part of the LDA measurement volume would trigger a ve-
locity measurement and as such the exact location of any measurement is unknown. The physical
extents of the measurement volume was known and therefore the maximum positional error was
one half of the volume’s dimensions, ±4.1 mm streamwise, ±5.5 mm spanwise and ±1.5 mm
vertically.
4.3 Seeding response
The response of a seeding particle to flow accelerations was analysed to provide an estimate of the
ability of the particles to accurately track the flow. The analysis was based on the method of Dring
[33], and involved calculation of the seeding Stokes number. Dring determined experimentally
that for low Stokes numbers (< 0.01), the maximum velocity error is equal to the seeding Stokes
16
number. The Stokes number, and therefore maximum velocity error in this case, was estimated as
6.4× 10⁻⁴ ms−1.
4.4 Velocity bias
Continuous sampling meant that individual LDA measurements were triggered by the transit of
any particle through the measurement volume and introduced a velocity bias. It follows that a
higher velocity would lead to more observations than a lower velocity, biasing the raw mean of
a set of observations to be higher than the true mean velocity at that location. The transit time
of each particle through the measurement volume was also recorded for each measurement and
it’s inverse provided a convenient weighting to produce an unbiased estimate of the mean at each
location. This method of bias correction was originally proposed by Buchave et al. [34].
4.5 Sampling error
LDA measurement is a stochastic process and therefore the collection of statistically independent
samples is difficult. As previously mentioned, the sampling rate is partly determined by the local
flow conditions and thus varied with measurement location. It follows therefore, that the uncer-
tainty also varied with location. The uncertainty was estimated using the method of Benedict and
Gould [35] based on the integral timescale, τi, which was in turn estimated using a method out-
lined by Nobach [36]. It was subsequently determined that, to a 95% confidence level, 30% of
the measurement points had an error of less than 1% with the remainder having an error less than
10%.
17
5 RESULTS AND DISCUSSION
Data from two planes (0.75 D and 1.0 D downstream of the wheel axis) are presented for three
configurations, labeled F1 Wheel - Aluminium Sting, F1 Wheel & Car - Aluminium Sting and F1
Wheel & Car - No Sting. comparison of the first two gives an indication of the effect of the car on
the wheel wake whilst comparison of the latter two gives an indication of the effect of the support
sting in the presence of the car. The effect of the car on the wheel wake will no doubt be dependent
on the particular car configuration, front wing span, downforce level etc. and likewise the effect
of the sting has been shown to be dependent on its particular geometry [23].
5.1 Streamwise Velocity Contours
The contours of streamwise velocity (Figure 6) effectively outline the shape and extent of the
velocity deficit in the wake of the wheel. Comparison of the structures of these wakes clearly
shows that the car has a marked impact on the wake structure. Firstly, the central portion of the
wake, above wheel-axle height, has changed significantly in the presence of the car. Whilst this
section of wake was contained within the projected profile of the tyre for the isolated wheel wake,
the presence of the car has increased the overall height of the wake by approximately one-third
and increased the width to approximately that of the tyre. The increase in height suggests that the
point at which flow separates from the tyre surface has moved upstream in the presence of the car.
The increased width suggests that the two upper vortex structures, which reduce the width of the
wake by entraining freestream air and are prevalent in the literature for isolated wheels, may not
18
be present in the wheel-and-car configurations.
Secondly, the distribution of the reversed flow regions (delineated by the dashed lines) are
also significantly affected by the presence of the car. The higher central position of the main
reversed flow region may suggest that the entrainment of flow into this region, usually provided
by the upper vortices, has been replaced by a strong recirculation with an approximately vertical
axis and almost entirely contained within the projected profile of the wheel. This containment
within the profile may somewhat explain the lack of advection of the reversed flow regions in the
presence of the car which are no longer present by one diameter downstream. Comparison of the
two configurations that feature the car suggest that the external support strut has little effect in
terms of the overall wake shape, except for a slight change in the magnitude and distribution of
the reversed flow regions.
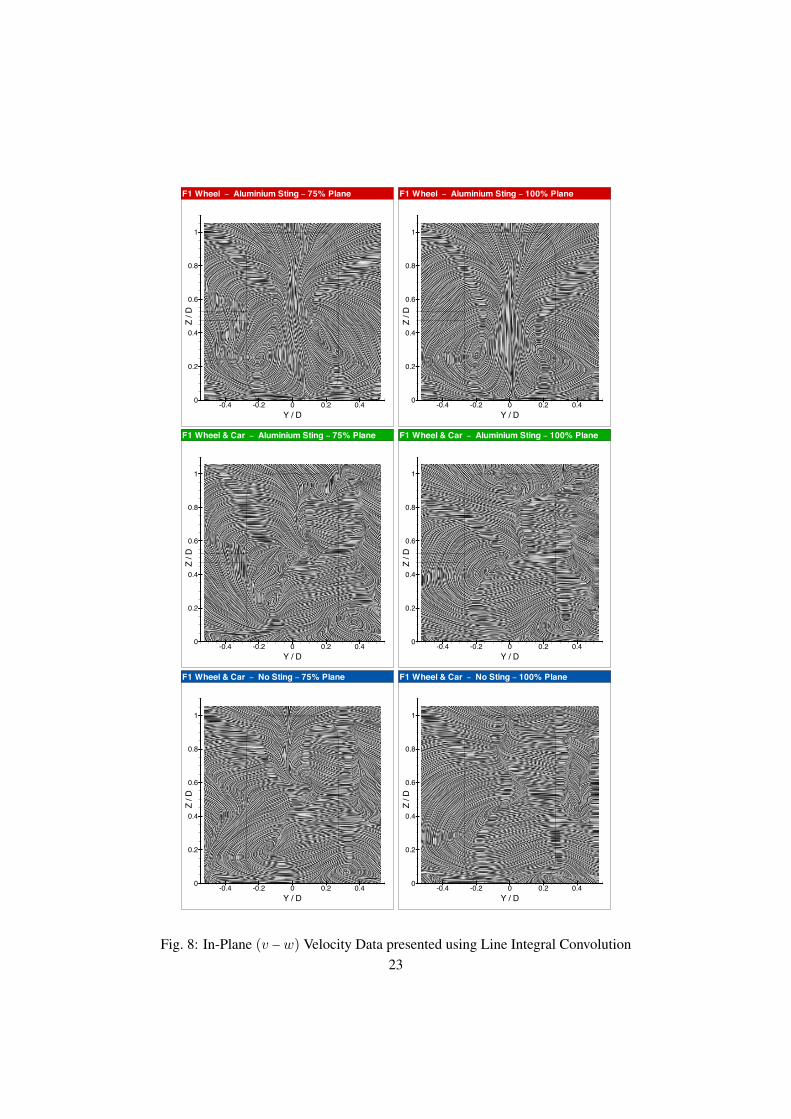
5.2 In-Plane Velocity Data
The in-plane velocity data are presented as both vectors to give comparison of magnitudes (Figure
7) and also using the line-integral convolution (LIC) technique which improves the visualisation
of the wake structures (Figure 8). The output of the LIC technique is similar to an oilflow im-
age, producing a monochrome, constant-length streamline plot of very high density. Streamlines
are traced from all points in a velocity field and often reveal structure which are not immediately
apparent in conventional velocity vector plots. The LIC plots are best interpreted in conjunction
with velocity vector plots as the LIC plots contain no velocity magnitude or directional informa-
tion. More information on the LIC implementation used for this work can be found in an earlier
19
Y / D
Z/D
-0.4 -0.2 0 0.2 0.40
0.2
0.4
0.6
0.8
1
F1 Wheel < Aluminium Sting < 75% Plane
Y / D
Z/D
-0.4 -0.2 0 0.2 0.40
0.2
0.4
0.6
0.8
1
F1 Wheel < Aluminium Sting < 100% Plane
Y / D
Z/D
-0.4 -0.2 0 0.2 0.40
0.2
0.4
0.6
0.8
1
F1 Wheel & Car < Aluminium Sting < 75% Plane
Y / D
Z/D
-0.4 -0.2 0 0.2 0.40
0.2
0.4
0.6
0.8
1
F1 Wheel & Car < Aluminium Sting < 100% Plane
Y / D
Z/D
-0.4 -0.2 0 0.2 0.40
0.2
0.4
0.6
0.8
1
F1 Wheel & Car < No Sting < 75% Plane
Y / D
Z/D
-0.4 -0.2 0 0.2 0.40
0.2
0.4
0.6
0.8
1
F1 Wheel & Car < No Sting < 100% Plane
u / u∞
1.20
1.10
1.00
0.90
0.80
0.70
0.60
0.50
0.40
0.30
0.20
0.10
0.00
-0.10
-0.20
-0.30
Fig. 6: Contours of mean u velocity for x/D = 0.75 and 1.0 at three test configurations (reversed
flow regions bounded by dashed lines).20
paper by the author [37].
The in-plane velocity data for the isolated wheel clearly show the two trailing vortices that
have been observed in the wake of isolated wheels since the early work of Fackrell [4]. However,
in the presence of the car there are very few coherent wake structures.
The strong central downwash region has been replaced by in-wash which, as revealed by the
velocity contours, turns towards the wheel to generate the reversed flow rather than downwards
in the isolated case. It was proposed earlier that this was due to the lack of vortices to entrain
flow into this region. The velocity vectors do not feature the large trailing vortices associated with
isolated wheels. There exists a single, relatively small trailing vortex on the inboard side of the
wheel. Both Knowles [23] and more recently, Axerio-Cilies et al. [31] observed that the centre of
the isolated-wheel vortices tended to remain within the projected profile of the wheel. Therefore
as this vortex has its origin outside the wheel profile it may suggest that it is not generated by the
wheel itself. The work of van den Berg [38] on wing-wheel interaction suggests that the structure
has the correct sense and is on the likely track of the front-wing endplate vortex.
The lack of coherent structures in the wheel wake when the car is present make it difficult to
assess the impact of the support strut. However, as with the previous velocity contours, the sting
appears to have had little quantifiable effect in the presence of the car.
5.3 Streamwise Turbulence Intensity
Comparison of the contours of streamwise turbulence intensity (Figure 9) reveal similar differ-
ences to those outlined for the velocity contours. One item of note however, is the effect of the
21
Y / D
Z/D
-0.4 -0.2 0 0.2 0.40
0.2
0.4
0.6
0.8
1
1
F1 Wheel < Aluminium Sting < 75% Plane
Y / DZ/D
-0.4 -0.2 0 0.2 0.40
0.2
0.4
0.6
0.8
1
1
F1 Wheel < Aluminium Sting < 100% Plane
Y / D
Z/D
-0.4 -0.2 0 0.2 0.40
0.2
0.4
0.6
0.8
1
1
F1 Wheel & Car < Aluminium Sting < 75% Plane
Y / D
Z/D
-0.4 -0.2 0 0.2 0.40
0.2
0.4
0.6
0.8
1
1
F1 Wheel & Car < Aluminium Sting < 100% Plane
Y / D
Z/D
-0.4 -0.2 0 0.2 0.40
0.2
0.4
0.6
0.8
1
1
F1 Wheel & Car < No Sting < 75% Plane
Y / D
Z/D
-0.4 -0.2 0 0.2 0.40
0.2
0.4
0.6
0.8
1
1
F1 Wheel & Car < No Sting < 100% Plane
Fig. 7: In-Plane (v – w) Velocity Vectors22
Y / D
Z/D
-0.4 -0.2 0 0.2 0.40
0.2
0.4
0.6
0.8
1
F1 Wheel < Aluminium Sting < 75% Plane
Y / DZ/D
-0.4 -0.2 0 0.2 0.40
0.2
0.4
0.6
0.8
1
F1 Wheel < Aluminium Sting < 100% Plane
Y / D
Z/D
-0.4 -0.2 0 0.2 0.40
0.2
0.4
0.6
0.8
1
F1 Wheel & Car < Aluminium Sting < 75% Plane
Y / D
Z/D
-0.4 -0.2 0 0.2 0.40
0.2
0.4
0.6
0.8
1
F1 Wheel & Car < Aluminium Sting < 100% Plane
Y / D
Z/D
-0.4 -0.2 0 0.2 0.40
0.2
0.4
0.6
0.8
1
F1 Wheel & Car < No Sting < 75% Plane
Y / D
Z/D
-0.4 -0.2 0 0.2 0.40
0.2
0.4
0.6
0.8
1
F1 Wheel & Car < No Sting < 100% Plane
Fig. 8: In-Plane (v – w) Velocity Data presented using Line Integral Convolution23
support sting on the regions of high (> 30%) turbulence intensity. Without the support sting the
0.75D plane has a significantly larger region of high turbulence intensity which increased diffusion
and mixing such that by the next plane this configuration had much lower turbulence intensity than
the others measured. Fackrell [4] observed regions of high turbulence intensity in the wake of the
support strut, this is not evident from the measurements presented here.
6 CONCLUSIONS
Three-component velocity data were recorded in the near-wake of the front wheel of a Formula
One car. Tests were carried out at 50 percent-scale, with the wheel rotating on a moving ground.
All tests were conducted at a Reynolds number, based on wheel diameter, of 6.8 × 10⁵. Three
component configurations were investigated to determine the effect of both the car and the wheel
support strut on the wheel wake.
These data were used to visualise the extent of the wake, the flow structures present and also
the streamwise turbulence intensity.
The presence of the car was found to significantly alter the structure of the wheel wake when
compared to an isolated wheel.
The measurements reported in this study suggest that separation from the tyre surface is much
earlier in the presence of a car, leading to a taller wake. The earlier separation also reduces the
entrainment effect of any upper vortices, resulting in a wider wheel wake in the upper section.
The large trailing-vortex structures previously identified for isolated wheels were not measured