We explored O 2 flash yield in two cyanophytes, Anacystis nidulans andAgmeneilum quadruplicatum. On a rate-measuring electrode, a single flash gave a contour of O z evolution with a peak at about 10 ms which was maximum (100) for 680 nm background light. On 625 nm illumination the peak was smaller (62) but was followed by an increased tail of O 2 attributed to enhancement of the background. After a period of darkness, repetitive flashes (5 Hz) gave a highly damped initial oscillation in individual flash yields which finally reached steady state at 94% of the yield for 680 um illumination. When O z of repetitive flashes was measured as an integrated flash yield the result was distinctive and similar to that for a continuous light 1 (680 nm). An apparent inhibition of respiration which persisted into the following dark period was taken as evidence for the Kok effect. With a concentration-measuring electrode, integrated flash yield vs. flash rate showed the same nonlinear behavior as O 2 rate vs. intensity of light 1. We draw three conclusions about the two cyanophytes. (a) The plastoquinone pool is substantially reduced in darkness. (b) Because of a high ratio of reaction centers, reaction center 1 / reac t ion center 2, for the two photoreactions, saturating flashes behave as light 1. (c) Because repetitive flashes are light 1, they also give a Kok effect which must be guarded against in measurements designed to count reaction centers.
Introduction
The 02 flash yield has been a widely used analytical tool in studies on the process of photo- synthesis. Under properly chosen conditions it can be used to count reaction centers of photoreaction 2; or alternatively, it can be used as a probe of reaction center conditions.
We report herein a study of the O 2 flash yield in two cyanophytes (cyanobacteria, blue-green algae). Comparative or background illuminations are cho- sen as 625 nm (light 2) and 680 nm (light 1). Our results relate to two peculiar characteristics of these procaryotic organisms. It is now well docu- mented that in a number of species the ratio of
reaction centers for the two photoacts, reaction center 1/reaction center 2, is greater than one and often greater than two [1-4]. This characteristic has a special consequence in the effects of repeti- tive saturating flashes. There is considerable evi- dence that a single system serves electron flow for both photosynthesis and respiration [5-7]. This leads to the expectation that in darkness the elec- tron carriers between the photoacts will be poised by respiration.
Materials and Methods
Anacystis nidulans is the designation given to strain Tx20 when it was isolated [8]. It is consid- ered identical to Synechococcus sp. PCC6301 [9]. It was grown in continuous culture in a modified medium D [4] at 39°C, with aeration by 2% CO 2 in
282
air, and illumination by a tungsten lamp to give a cell concentration of 1.2 # l / m l and a specific growth rate of 0.6 da y - ~. For some measurements reported in Table II the growth temperature was 25°C. Agmenellum quadruplicatum, strain PR6 (ATCC29404 [9]), was obtained from C. van Baalen and grown in his ASP-2 medium [10]. It was also grown in continuous culture (as above) but at a cell concentration of 4.0 t d / m l and a specific growth rate of 2.3 day - ~. We shall refer to the two organisms by their original strain designations.
Measurements were made with two electrode arrangements. Absolute values of 02 yield were obtained with a Clark-type concentration-measur- ing electrode previously described [4]. The amperometric signal was calibrated vs. air satura- tion of the medium using the solubilities stated by Green and Carritt [11]. Measurements were made upon cell suspensions as harvested or with dilution in original medium. Before each rate measurement a fresh aliquot of suspension in the electrode chamber was aerated briefly with 2% CO 2 in N 2 to give an initial 02 tension of about 20 mm. One face of the electrode cuvette was illuminated by a projection system through interference filters (HBW 12 nm); the opposite face could be il- luminated by an EG & G Fx-76 flash tube with yellow filter [4].
Oxygen exchange was measured also on a one- cell layer film settled upon the 6 mm platinum disc of a rate-measuring electrode previously described [4,12,13]. Illumination was provided via three beams (Fig. 4 of Ref. 13). Beam 1 of constant low intensity (the probe) was chopped at 55 Hz near the exit of a monochromator. Beam 2 from an Fx-76 flash tube was added via a half-silvered mirror. Beam 3 from a second monochromator at varied intensity was added via a half-silvered mir- ror. All beams could be chopped by a 73 Hz sector before reaching the electrode. For observation of flash yields from beam 2 the 73 Hz sector was removed. Light intensities upon the electrode were measured by a calibrated silicon photocell and will be expressed as time-averaged intensities without correction for reflectance by the platinum.
The amperometric current of the rate-measur- ing electrode was processed by a circuit designed to minimize ohmic resistance and converted to an output voltage with bias to suppress the d.c. level
[12,13]. The 55 and 73 Hz components were fur- ther processed by lock-in amplifiers and recorded. The d.c. component of voltage output could be observed at variously chosen time constants, e.g., 1 ms for recording individual flash yields to 0.5 s for time averaging repetitive flash yields. In addition, the d.c. component was also processed by an in- tegrating amplifier. The direct and integrated sig- nals were fed to two channels of a Brush (Mark 220) recorder.
Chlorophyll and P-700 were measured by meth- ods previously described [4]. In some experiments with the concentration measuring electrode we used benzoquinone as an acceptor. From exploratory experiments with strain Tx20 we chose concentra- tions of 0.05 mM quinone and 2 mM ferricyanide and found no effect of added 1 mM KCN for a maximum flash yield.
Results
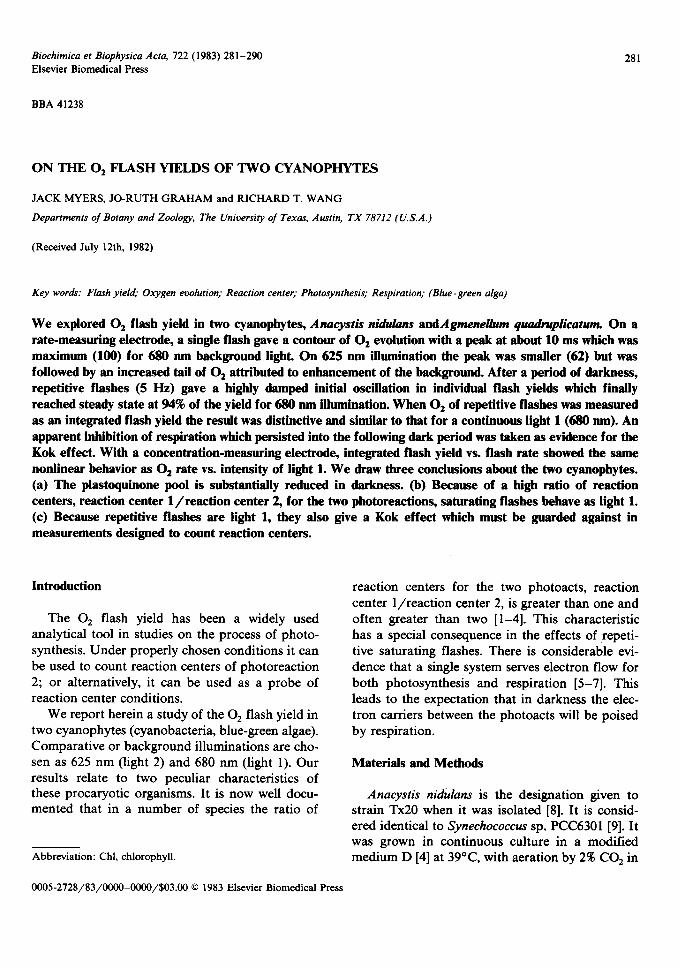
Intensity requirements for maximum 02 yield. Fig. 1 describes intensity relations of 02 yield ob- served on the rate electrode. In Fig. IA the lower curves describe V, the total 02 evolution rate produced by beams 1 plus 3 and observed at 73 Hz. The curves for 625 and 680 nm illumination could be adjusted to equal slope (as shown) if the intensity,/ , was adjusted so that 1 -- 1625 = 0.351680.
The upper curves of Fig. 1A show the yields (v) for the constant low-intensity 55 Hz beam 1 (probe) plotted vs. total intensities of beams 1 plus 3. As expected, maximum yield for the 625 nm probe on 625 nm illumination is about 0.66 of its yield on 680 nm illumination. The enhancement ratio is 1 : 0.66 = 1.5. However, it is surprising to find that attainment of maximum yield requires so much higher intensity of 625 nm light than of 680 nm light. Actually, the difference is even greater than shown because our normalizing of intensities is incomplete. If we correct further for the fraction of open reaction centers and estimate intensity available to photoreaction 2, then the intensity requirements for maximum yield at 625 nm be- come 1.5-times greater. Evidently, 680 nm light is much more effective than 625 nm light in accom- plishing the activation of S-states needed for maxi- mum 02 yield.
Fig. 1B shows a further calibration obtained
1.0
5.0 :>
I00
200 400 600 I ,pE cm "z s -I
Io
~5 5o < >
0 0 0
Flash Rate,s"
3 6 I0 15 I I ! I
J I Flash=37 pE/cm z
i I I I I I
200 400 71, pE crn-2s -'
Fig. 1. Intensity requirements for max imum 02 yield in strain Tx20 at 36°C. A shows measurements in modulated light, v is the response to a constant low-intensity probe at 55 Hz vs. total intensity (background plus probe); (o) 680 n m probe on 680 nm background, (O) 625 nm probe on 680 n m background, ( x ) 625 n m probe on 625 n m background. V is relative rate of 02 evolution (background plus probe) observed at 73 Hz and at 625 n m ( x ) or at 680 nm (e). Measured intensities were normalized to give equal slopes V/I for 625 and 680 nm so that the abscissa I = 1625 = 0.3516s o in p E . c m - 2 . s - I. B shows measurements of the d.c. signal for net 02 evolution vs. intensity of 625 n m ( x ). Also shown are the time-averaged d.c. signals obtained at various flash rates (O) on a constant background of 680 n m at 70 pE. c m - 2 . s - I. The two sets of data have been normalized to equal slopes by the equivalence: 1 flash = 37 pE. c m - 2.
283
from d.c. records. For net 02 evolution flash rate can be normalized to intensity if each saturating flash is set equivalent to 37 p E . cm -2 . s - i . The 02 rate in flashing light was measured on a b a c k - ground of 680 nm light so that all reaction centers, conventionally called Q, turn over with each flash (see below). Hence, we can equate flash rate to a turnover rate of reaction centers, Q / s . However, for 625 nm continuous light Q = 0.66Qmax and the 02 rate is only 0.66 of what it would be for a 680 nm background. If the 02 rate is used as photome- ter for quanta available to Q, the calibration should be corrected to 1 Q / s = 37.0.66 = 24pE. c m - 2 . S - 1 .
The data of Fig. 1 were obtained on strain Tx20 at 36°C. At 25°C maximum quantum yield (v/vma,,) was achieved at a lower intensity (about 1/2) than that required at 36°C. However, the relation of the value in p E . cm -2 per flash was temperature independent; we obtained values of 37 and 41 at 25°C and 37, 38, 39 at 36°C. For strain PR6 at 36°C, the V/Vma,, curves were shifted
to higher intensities than those required for strain Tx20.
A practically useful feature of Fig. 1 is that it defines intensities needed to achieve maximum quantum yield at 625 and at 680 nm. Hereafter, either wavelength chosen as a background will be used at an intensity needed to give near-maximum (greater than 95%) 02 yield.
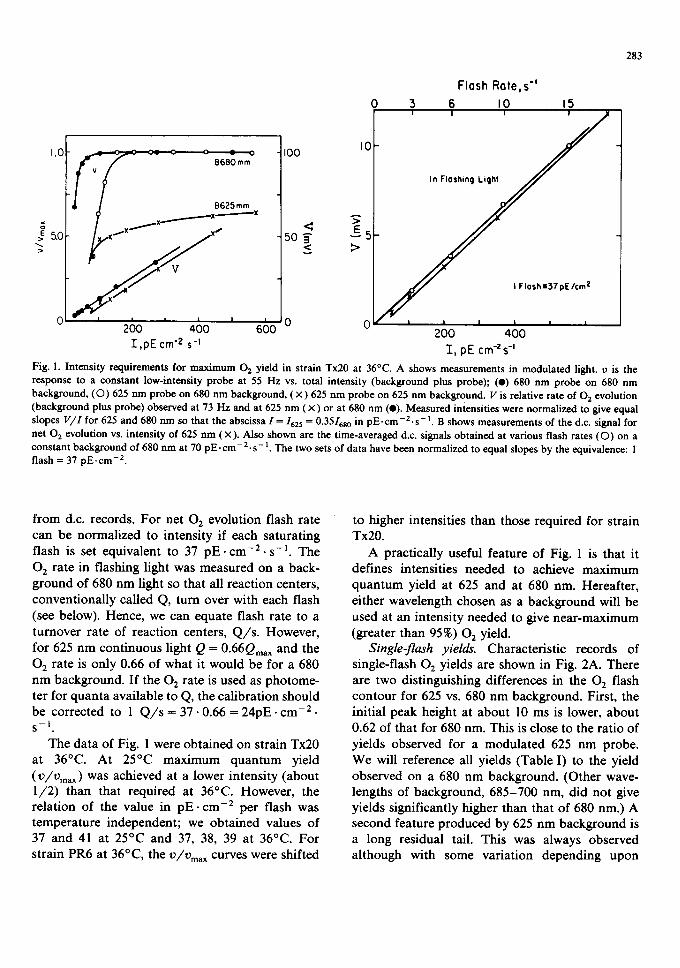
Single-flash yields. Characteristic records of single-flash 02 yields are shown in Fig. 2A. There are two distinguishing differences in the 02 flash contour for 625 vs. 680 nm background. First, the initial peak height at about 10 ms is lower, about 0.62 of that for 680 nm. This is close to the ratio of yields observed for a modulated 625 nm probe. We will reference all yields (Table I) to the yield observed on a 680 nm background. (Other wave- lengths of background, 685-700 nm, did not give yields significantly higher than that of 680 nm.) A second feature produced by 625 nm background is a long residual tail. This was always observed although with some variation depending upon
284
-I I- t 0.2s
A
J -I 9
"-lf-Y--V"-V-'V~
4 25 t - Y - v -
60 260
Fig. 2. Reproductions of original records obtained with strain Tx20. (A) Single flash yields observed on backgrounds of 680 and 625 n m at intensities chosen to give max imum yield. (B) Repetitive flash yields for a train of flashes at 5 Hz beginning 60 s after a similar train. Chart speed was decreased for the period between flashes 26 and 260. (C) Integrated flash yield. The lower trace records the d.c. voltage signal for net 02 exchange from the dark level, a, to steady-state light level, c. After light-off the trace drops quickly to initial level, b i, and then more slowly to the original dark level, a. The recording was made with a low-pass filter of about 0.5 s time constant to smooth out individual flash yields which otherwise would have appeared as in record B. The upper trace records the same d.c. signal, but after processing by an integrating amplifier. The upper trace was biased to zero slope in darkness and shunted to zero position after each excursion. The steady slope in light (25 mV) is an integration of area ( c - a).t ime for the lower trace. The transient slope (9 mV) following light-off is an integration of area (b i - a ) . t i m e . The sum )Cab is the total area under ( b - a).
TABLE I
0 2 YIELDS FOR STRAIN Tx20 AT 36°C
All values are relative to a yield of 100 on a 680 nm back- ground. In parentheses are numbers of values averaged.
625 nm modulated probe 66(16)
Single flash yield on 625 nm background 62(10) on dark a 94(10)
Integrated flash yield on 625 nm background 160(13) on dark b 95(13)
= Max imum value at flash rate chosen as in Fig. 3. From slope of ( c - a) vs. flash rate as in Fig. 4.
background intensity. We interpret the residual tail as an enhancing effect of a flash upon the 625 nm background. Because of the reaction center 1/react ion center 2 ratio of 2.4 (Table II) a saturating flash perturbs the system by a transient oxidation of reaction center 2. The same dif- ferences between 625 and 680 nm backgrounds were observed also for single-flash yields of strain PR6.
The flash-yield contour on 680 nm illumination appeared to be invariant with time. However, after changing from a 680 to a 625 nm beckground the initial peak was depressed and the residual tail greater; several minutes of background were re-
quired to develop reproducible contours such as that of Fig. 2A. We suppose that the change in contour represents development of State 2 with increased excitation delivery to photoreaction 1.
The single-flash yield could also be used as a probe in the same way as a modulated probe. Single-flash yield vs. intensity of 680 nm back- ground gave a yield curve close to that for a 680 nm modulated probe (Fig. 1A).
Repetitive-flash yields. Because of dark decay reactions of the S-states [14,15] a single flash after a long period of darkness gives negligible yield. Without background light a single-flash yield can be observed only as one of a series of repetitive flashes. The repetitive flashes then become both the probe and the actinic light.
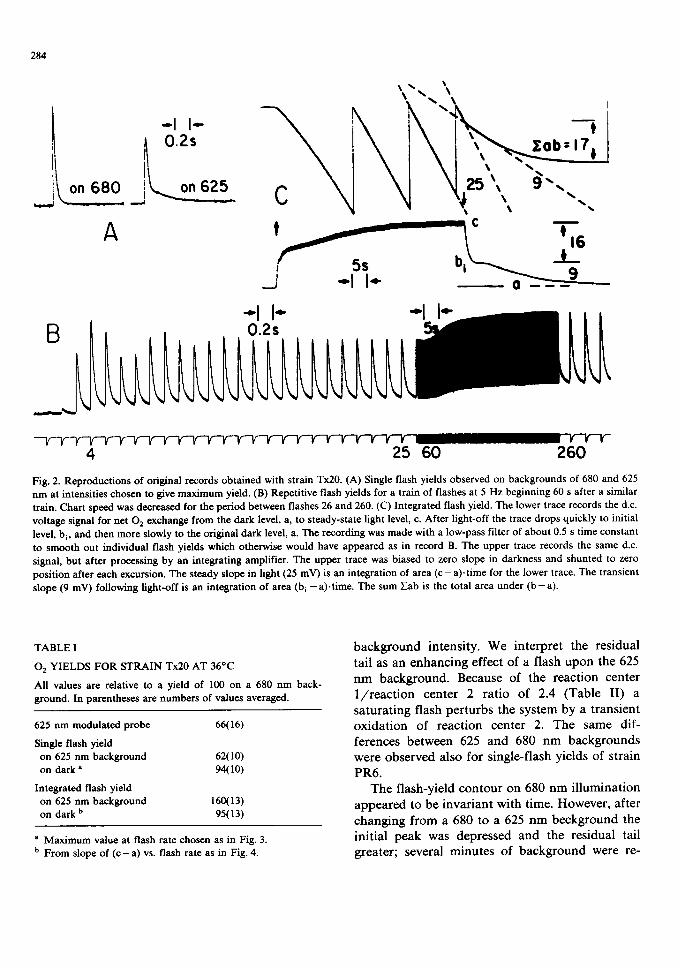
Fig. 2B reproduces the recording of a series of repetitive flashes beginning after 60 s of darkness. We consider three characteristic features. Final steady-state yield depends upon flash rate as shown in Fig. 3. 90% of maximum yield requires flashes at about 2 Hz for 36°C and 1 Hz for 25°C. In comparison to the yield curves of Fig. 1A, repeti- tive flashes are much more like 680 nm than 625 nm light.
° ° I "
o j1?" ,_7
0 / I I I I 2 4
Flash Rate, s -=
Fig. 3. Relative individual flash yields vs. flash rate for strain Tx20 at 25 and at 36°C. Maximum yield is taken as that observed at greater than 3 s - l and after a sufficient number of flashes (cf, Fig. 2B).
285
With strain Tx20 the first flashes after darkness give an oscillating yield sequence but with much more damping than observed in chloroplasts or Chlorella [15,16]. At 25°C and 5 Hz, Y3 was about 0.85Y~s and maximum Y4 was only 1.5Yss. In terms of the model of Kok et al. [15], assuming S l = 0.75 and S O = 0.25 and ignoring double hits, the flash- yield sequence estimates a miss factor, a, of 0.35. This is essentially identical to the estimate of Ley et al. [16] at a =0.32. At 36°C, Y3 was about 0.4Y~, maximum yield shifted to Y5 at 1.2Ys~, and the estimated a was about 0.5.
An additional feature shown in Fig. 2B is that, even after complete loss of oscillation, e.g., II20 to Y25, there was a subsequent increase in yield often requiring 60 or more flashes. The final steady-state yield was about 94% of the yield on 680 nm background (Table I), again implying that repeti- tive flashes are actinic light 1.
In strain PR6 oscillations in flash yield were even more severely damped. At 25°C, Y4 was maximum but only 1.3Y~s and Y3 was 0.75Y~s. At 36°C, Y5 was maximum at about 1.1Y,~ and I13 was 0.30Y~s. Following Radmer and Kok [17] and Di- ner [18,19], we suppose that relative flash yield depends upon fraction of reaction centers in the form S3Qox. Hence, we attribute the large fraction of misses, a, to a low value of Qo~ and high fraction of the A pool (plastoquinone) reduced in darkness.
Integrated flash yield The original estimates of flash yield [20] and, in fact, most measurements in absolute terms (mol O2/flash ) depend on integra- tion of flash yields. A time-averaged 02 rate is measured in steady state at a chosen flash rate. Although the rate-measuring electrode does not submit to absolute calibration, we have used it to study in relative terms some characteristics of the integrated flash yield. A typical recording for one set of data is shown in Fig. 2C. The lower trace describes the d.c. voltage, a signal proportional to net 02 evolution. Sufficient filtering has been pro- vided (RC about 0.5 s) to damp responses to individual flashes and give the time-averaged net 02 rate. The upper channel of Fig. 2C records the output voltage of an integrating amplifier which sums its input voltage to give an output propor- tional to the net amount of 02 exchanged. The slope of the upper trace is analogous to the slope
286
of the output signal of a Clark electrode measuring O 2 concentration vs. time.
In Fig. 2C the lower trace begins and ends at a dark level of net 02 exchange designated a. With the onset of flashing it rises in a bimodal fashion to a steady-state level, c. On return to darkness the net 02 exchange drops rapidly to a level, bi, and thereafter more slowly to the dark level, a. The upper integrated trace was biased to zero slope in darkness. It was shunted to zero level initially and after each scale excursion. It finally returns to zero slope in darkness. The maximum light slope and initial dark slope provide redundant measures of ( c - a) and of (b i - a ) , respectively. In addition, the total excursion after return to darkness, desig- nated Eab, measures the area under b. In most experiments, the large RC filtering was removed before return to darkness though without much effect on the size of Eab.
All features shown in Fig. 2C for integrated flash yield were observed also under appropriate intensities of 680 nm light. Further, they are much like those observed by Ried [21] for Chlorellafusca and Scenedesmus obliquus except that we never observed his characteristic postillumination dip be- low the steady-state dark level. We accept his interpretation that the low dark decay measures the decay in the light-stimulated inhibition of res- piration. If this is correct, then the initial dark level, bi, represents a level of zero O 2 exchange, the difference ( c - bi) measures actual O 2 evolu- tion, and Eab measures the initial deficit of 02 not taken up by dark respiration.
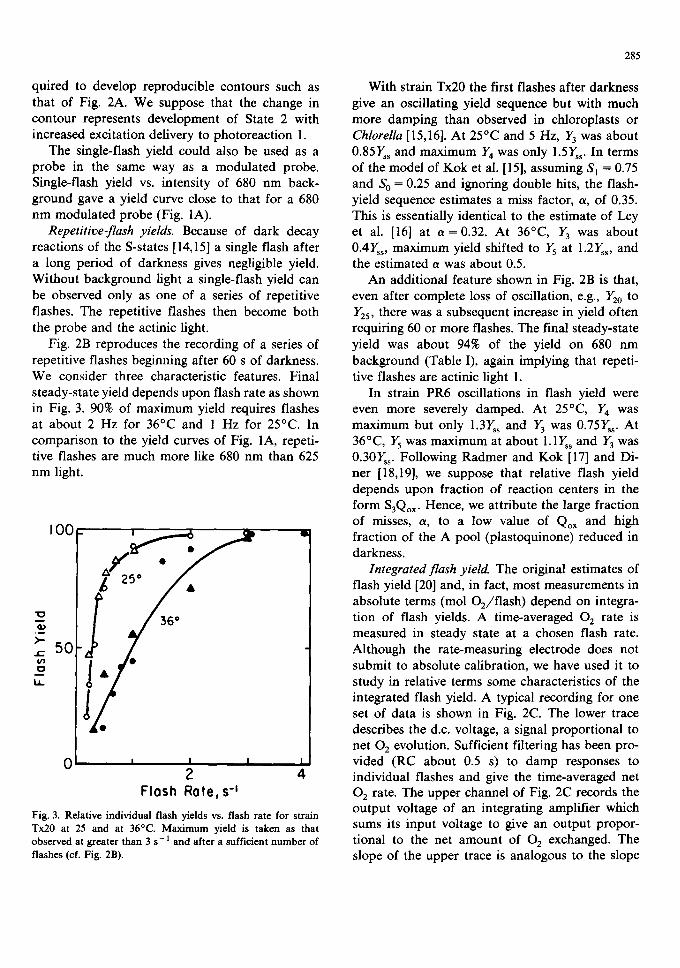
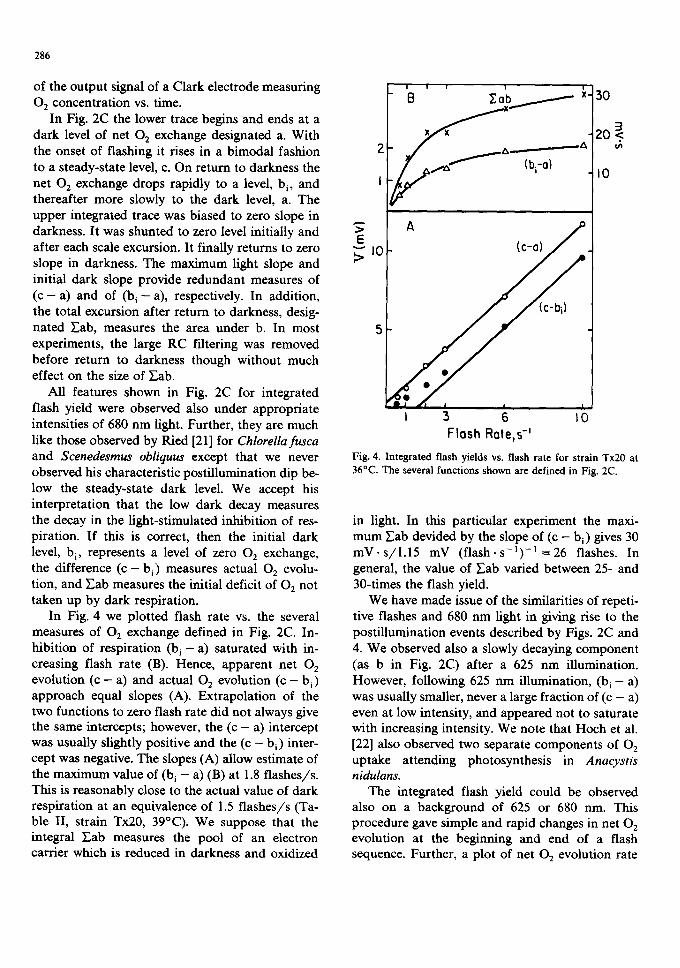
In Fig. 4 we plotted flash rate vs. the several measures of 02 exchange defined in Fig. 2C. In- hibition of respiration (b i - a ) saturated with in- creasing flash rate (B). Hence, apparent net O 2 evolution ( c - a) and actual 02 evolution ( c - bi) approach equal slopes (A). Extrapolation of the two functions to zero flash rate did not always give the same intercepts; however, the (c - a) intercept was usually slightly positive and the (c - hi) inter- cept was negative. The slopes (A) allow estimate of the maximum value of (b i - a) (B) at 1.8 flashes/s. This is reasonably close to the actual value of dark respiration at an equivalence of 1.5 flashes/s (Ta- ble II, strain Tx20, 39°C). We suppose that the integral F.ab measures the pool of an electron carrier which is reduced in darkness and oxidized
I ! I I I
B 7.ob~ ~" 30
2 z~-- _ A
(hi-o} I 0 I
E ~" I0 (c-o)
5
I 3 6 I0 Flash Rate,s-'
Fig. 4. Integrated flash yields vs. flash rate for strain Tx20 at 36°C. The several functions shown are defined in Fig. 2C.
in light. In this particular experiment the maxi- mum Eab devided by the slope of (c - hi) gives 30 mV. s/1.15 mV (flash. s- 1)- ] = 26 flashes. In general, the value of Y'.ab varied between 25- and 30-times the flash yield.
We have made issue of the similarities of repeti- tive flashes and 680 nm light in giving rise to the postillumination events described by Figs. 2C and 4. We observed also a slowly decaying component (as b in Fig. 2C) after a 625 nm illumination. However, following 625 nm illumination, (b i - a) was usually smaller, never a large fraction of (c - a) even at low intensity, and appeared not to saturate with increasing intensity. We note that Hoch et al. [22] also observed two separate components of O 2 uptake attending photosynthesis in Anacystis nidulans.
The integrated flash yield could be observed also on a background of 625 or 680 nm. This procedure gave simple and rapid changes in net O 2 evolution at the beginning and end of a flash sequence. Further, a plot of net 02 evolution rate
vs. flash rate, as (c - a) in Fig. 4, extrapolated to zero. From the integrated flash yield on a 680 nm background, which we take as maximum, the flash yield on darkness (zero background) averaged 0.95 (Table I) as expected from the single-flash yields. However, a 625 nm background gave a much higher integrated flash yield, average value 1.6 (Table I). Because of the single-flash yield contour (Fig. 2A), we argue that this apparently anoma- lous value arises from an enhancing effect of repe- titive flashes upon the 625 nm background.
Measurements with the concentration-measuring electrode. The rate-measuring electrode, used in the work described above, has advantages of rapid response. It also has limitations in lack of any absolute calibration and lack of a fixed point for zero 02 exchange. In contrast, the concentration- measuring electrode, though of slower response, can be calibrated in terms of 02 concentration. Further, it responds to net 02 exchange by the positive, negative, or zero slope of its signal vs. time. In conventional use we designate net 02 evolution of photosynthesis as the light rate minus the negative dark rate observed in the 2 rain following a light period. For purposes of discus- sion we shall distinguish between this net 02 rate and the light-only rate (without dark correction). The latter will be the preferred measure if respira- tion is inhibited during the light period.
Fig. 5 presents the following characteristic fea- tures uniformly observed: (a) at 625 nm net O 2 rate vs. intensity extrapolates to a zero or slightly positive rate at zero intensity; (b) at 680 nm net O 2 rate extrapolates always to a positive rate close to the observed rate of dark repiration; (c) at 680 nm the light-only rate extrapolates to a rate close to zero; (d) repetitive flashing light (B) gives results like those observed in 680 nm light; (e) extrapola- tion to zero for net 02 rate vs. flash rate can be accomplished by a continuous 680 nm back- ground. All of the above are observed in both strain Tx20 and PR6 but are more dramatic in the latter because of its higher rate of respiration. Fig. 5A is a confirmation of the Kok effect for a light l (cf. Refs. 22 and 23). Fig. 5B demonstrates that in strain Tx20 and in PR6 repetitive flashes are equivalent to light 1 in giving the Kok effect.
Table II summarizes data obtained with the concentration-measuring electrode. Viewing all
40
P
20
287
0
_ B ' '
4 " / " - 4"/"
Tx20 ~'sf~ £ ,jy I J..;/
,-'7 ./ ,-,;" ,/7 i" ,-2" i ' X _I~ s' ~" . . , , / ~PR6
4 0
P
2 0
I I " 0 6 I 0 2 0
F l a s h R a t e , s "1 , , ,
A f
/ ;.< 80 - PR
p
I I I 0 2 4 6
I, nE cm-Zs "1 Fig. 5 . 0 2 exchange, P ( O 2 . C h l - ] . h - I ) , by the concentration- measuring electrode at 39°C. A, for strain PR6 vs. intensity at 625 nm, i ; vs. intensity at 680 nm, • and O. Solid symbols, • and • , are for values of P as net 02 evolution from light-dark rates. Open symbols, O, are for rates observed in light only and without dark respiration correction. I is the measured intensity, either at 625 or at 680 nm in n E . c m - 2 . s -1. B, for strains PR6 and Tx20 vs. flash rate. Solid ( • ) and open (O) symbols are used as in A. Measurements on a constant back- ground of 680 n m corrected for rate observed in 680 n m alone, x . Ordinate scales are given on left for strain Tx20, on right for strain PR6.
288
TABLE II
FLASH YIELDS, 0 2 RATES, AND REACTION CENTERS IN STRAINS Tx20 and PR6
Flash yields were estimated as the slope of a plot of 02 rate vs. flash rate with and without a 680 nm background. Turnover rates of photoreaction 2 (reaction center 2 s - 1) were estimated for light-saturated photosynthesis from flash yields and observed 02 rates. Equivalent reaction center 2 turnover rates are estimated from respiration rates. Chl/reaction center 2 was estimated as 1 /4 of the reciprocal of flash yield. Chl/reaction center 1 was estimated from the absorbance change at 703 nm attributed to P-700. All values shown are averages of measurements made on at least two different preparations.
Tx20 Tx20 PR6 Grown at 39°C Grown at 25°C Grown at 39°C
680 nm background 7.19 6.91 7.14 no background 7.33 6.89 7.00 with quinone 6.55 6.11 5.55
Light-saturated rate O2. Chl- i . h - i 364 104 510 reaction center 2 s - i 141 42 198
Dark respiration O 2 • Chl- 1. h - 1 3.95 2.64 8.99 reaction center 2 s - i 1.53 1.08 3.50
Chl/reaction center 2 347 361 350 Chl/reaction center 1 - 147
6.86 5.86 6.16 6.58 6.16 6.39 5.67 4.80 5.67
247 383 218 100 182 98
3.87 12.3 7.80 1.57 5.83 3.50
364 427 405 144 - 122
data on flash yield we find no significant dif- ference between measurements on dark or on 680 nm background, provided that yield is estimated as the slope of a plot of yield vs. flash rate. If yield is estimated from the 02 rate at a single flash rate, and without background, the estimate will be too high because of the Kok effect. We had hoped to obtain a separate kind of flash yield estimate by using benzoquinone. This serves as an excellent electron acceptor for whole cells of strain Tx20 and supports a light-saturated rate of 02 evolution about twice as high as that of normal photosynthe- sis. In spite of attempts to optimize conditions for measuring 02 rate at low intensity, flash yields with quinone were only 80-90% of those observed without.
Table II also cites rates of 02 exchange and equivalent reaction center 2 turnover rates for light-saturated photosynthesis and for respiration. Any' anomalies due to the Kok effect are mini- mized at flash rates large compared to the reaction center 2 turnover equivalent of respiration. We were not surprised to observe some decay in yield
at higher flash rate (even at 20 s-1) for cells of strain Tx20 grown at 39°C and measured at 25°C; such ceils have an unuaually low maximum reac- tion center 2 turnover rate of only about 42 s-~. Finally, our estimates of reaction center numbers confirm the high ratio (greater than 2) in these strains.
Discussion
The Kok effect. The Kok effect, found in a variety of organisms, is operationally homoge- neous: a light-dependent inhibition of respiration which saturates at low intensity [24]. However, the effect is not necessarily homogeneous in origin. Two diverse explanations have been given for the mode of interaction between photosynthesis and respiration. (a) The light effect arises as a de- creased respiratory electron supply, e.g., as a re- sponse to an increased cyclic photophosphoryla- tion. (b) The light effect occurs as a competition between photoreaction 1 and O 2 for respiratory electrons, i.e., interaction on the demand side.
Evidence for both explanations has been reported [25]. We note that the mechanisms proposed are not mutually exclusive and that both might oper- ate, even in the same organism.
We confirm previous reports of the Kok effect in strain Tx20 [22,23]. Improved time resolution of the rate-measuring electrode allowed observation of an inhibited 02 uptake persisting several sec- onds after a light period, as previously demon- strated by Ried [21]. The magnitude of the inhibi- tion, as measured in rate of 02 exchange, was greater in strain PR6 which had a higher rate of respiration (Fig. 5). However, the magnitude as viewed by amount of 02 not taken up after a light period, the area which we designated Eab (Fig. 4), was not significantly different between strain PR6 and Tx20. We suppose that Eab represents a pool of reductant which must be filled to support the full rate of dark 02 uptake. Our observed value of Y.ab as 25-30-times the single-flash yield is surprisingly high. It is likely to be an overestimate because of the procedure used but an underesti- mate if the pool measured is not completely re- duced in darkness. We have not attempted resolu- tion of the components of Eab.
Redox state of plastoquinone in darkness. Evi- dence for a dark electron flow into and out of the plastoquinone pool has been presented for chloro- plasts [17] and for Chlorella [26]. For cyanophytes there is a further argument that a common mem- brane system serves both respiratory and photo- synthetic electron transport [5-7]. It is of interest, therefore, to consider the redox condition of plastoquinone in darkness for the particular case of the cyanophytes. Hirano et al. [5] have used rate of reduction after a flash-induced oxidation of cytochrome c-553 to observe the plastoquinone pool in whole cells of a thermophilic cyanophyte, Synechococcus sp. For the cytochrome reduction, presumably from the plastoquinone pool, they ob- served (a) a lowered rate as the respiratory rate was decreased by dark starvation, (b) in such starved cells an increase in rate by 1 mM KCN which suppressed 02 uptake, and (c) inhibition by 2 ,5 -d ib romo-3 -m e thy l -6 - i sopropy l -p -benzo- quinone, These results clearly favor a competition between photoreaction 1 and 02 as the site of interaction and establish that the plastoquinone pool is partially reduced in darkness.
289
02 flash yields do not provide direct assay for the redox condition of plastoquinone (the A pool) because of dependence also upon the S-states on the donor side of photoreaction 2. Diner [18,19] has used various levels of anaerobiosis to control reduction of the A pool and observe effects on the S-states in Chlorella. At very low 02 the flash yield sequence lost most of its oscillation and gave a low maximum yield delayed to Ys. For our observa- tions we can say that the two cyanophytes behave like a partially anaerobic Chlorella, i.e., they have a partially reduced A pool. Damping of the initial flash yield oscillation was greater at higher tem- perature in strain Tx20 and still greater in strain PR6 which has a higher respiratory rate. As previ- ously argued by Ley et al. [16], we take the large damping effect as evidence for a substantial reduc- tion of the A pool in darkness.
Counting of reaction center 2. Our observations with the rate-measuring electrode make clear that information provided by repetitive flashes may be different from that provided by a single flash. The single flash is a probe; repetitive flashes also pro- vide actinic light. Because of a high reaction center 1/reaction center 2 ratio in cyanophytes, saturat- ing flashes serve as actinic light 1 and give near- maximum flash yield. However, for the same rea- son, they also give a Kok effect. Hence, proper measure of flash yield requires either (a) de- termination with a continuous low background of light 1 (as 680 nm) or (b) estimation from a plot of flash yield vs. flash rate.
Throughout this report our treatment has been based upon established rules of behavior for the photosynthetic mechanism in flashing light: that every available photochemical unit works once and only once during an appropriately short and saturating flash. Further, we have assumed that a very large fraction of photochemical events result in useful work of electron transfer. We have recog- nized but not considered further the possibilities of significant back-reactions or cyclic flow. For example, significant cyclic flow around reaction center 2 would give a lowered 02 flash yield and a lowered count of reaction centers 2; it would also give a large fraction of misses and attendant damping of the flash yield sequence. We have rejected this possibility simply because it places such a large constraint on throughput quantum yield.
290
Although the entire flash yield behavior of the two cyanophytes is consistent with expected effect of a high reaction center 1/reaction center 2 ratio, there is now a possible anomaly in comparison with chloroplast-containing plants. In spinach chloroplasts the ratio is less than one and, in pea chloroplasts, appears to vary during development [3]. If the reaction center 1/reaction center 2 ratio is less than one then a problem arises in how all reaction centers 2 can become oxidized and re- laxed between repetitive flashes. If the reaction center 1/reaction center 2 ratio in Chlorella is less than one, then we would have difficulty in under- standing how the classical repetitive flash yield [20] could be valid in its count of reaction centers.
References
1 Fujita, Y. (1976) Plant Cell Physiol. 17, 187-191 2 Kawamura, M., Mimuro, M. and Fujita, Y. (1979) Plant
Cell Physiol. 20, 697-705 3 Melis, A. and Brown, J.S. (1980) Proc. Natl. Acad. Sci.
U.S.A. 77, 4712-4716 4 Meyers, J., Graham, J.R. and Wang, R. (1980) Plant Phys-
iol. 66, 1144-1149 5 Hirano, M., Satoh, K. and Katoh, S. (1980) Photosynth.
Res. 1, 149-162 6 Lockau, W. (1981) Arch. Microbiol. 128, 336-340 7 Kienzl, P.F. and Peschek, G.A. (1982) Plant Physiol. 69,
580-584
8 Kratz, W.A. and Myers, J. (1955) Am. J. Bot. 42, 282-287 9 Rippka, R., Derulles, J., Waterbury, J.B., Herdman, M. and
Stanier, R.Y. (1979) J. Gen. Microbiol. 111, 1-69 10 Van Baalen, C. (1962) Bot. Mar. 4, 129-139 11 Green, E.J. and Carritt, D.E. (1967) J. Mar. Res. 25,
140-147 12 Wang, R. and Myers, J. (1974) Biochim. Biophys. Acta 347,
134-140 13 Wang, R. and Myers, J. (1976) Photochem. Photobiol. 23,
405-410 14 Joliot, P. (1968) Photoehem. Photobiol. 8, 451-463 15 Kok, B., Forbush, B. and McGloin, M. (1970) Photochem.
Photobiol. 11,457-475 16 Ley, A.C., Babcock, G.T. and Sauer, K. (1975) Biochim.
Biophys. Acta 387, 379-387 17 Radmer, R. and Kok, B. (1973) Biochirn. Biophys. Acta
314, 28-41 18 Diner, B. (1974) in Proceedings of the 3rd International
Congress on Photosynthesis (Avron, M., ed.), pp. 589-601, Elsevier, Amsterdam
19 Diner, B. (1977) Biochim. Biophys. Acta 460, 247-258 20 Emerson, R. and Arnold, W. (1932) J. Gen. Physiol. 16,
195-205 21 Ried, A. (1969) in Progress in Photosynthesis Research
(Metzner, H., ed.), pp. 512-530, International Union of Biological Sciences, Tfibingen
22 Hoch, G., Owens, O. and Kok, B. (1963) Arch. Biochem. Biophys. 101, 171-180
23 Jones, L.W. and Myers, J. (1963) Nature 199, 670-672 24 Kok, B. (1949) Biochim. Biophys. Acta 3, 625-631 25 Healey, F.P. and Myers, J. (1971) Plant Physiol. 47, 373-379 26 Diner, B. and Mauzerall, D. (1973) Biochim. Biophys. Acta