This paper presents preliminary findings and is being distributed to economists and other interested readers solely to stimulate discussion and elicit comments. The views expressed in this paper are those of the authors and do not necessarily reflect the position of the Federal Reserve Bank of New York or the Federal Reserve System. Any errors or omissions are the responsibility of the authors. Federal Reserve Bank of New York Staff Reports On the Scale of Financial Intermediaries Tobias Adrian Nina Boyarchenko Hyun Song Shin Staff Report No. 743 October 2015 Revised December 2016
Transcript
This paper presents preliminary findings and is being distributed to economists
and other interested readers solely to stimulate discussion and elicit comments.
The views expressed in this paper are those of the authors and do not necessarily
reflect the position of the Federal Reserve Bank of New York or the Federal
Reserve System. Any errors or omissions are the responsibility of the authors.
Federal Reserve Bank of New York
Staff Reports
On the Scale of Financial Intermediaries
Tobias Adrian
Nina Boyarchenko
Hyun Song Shin
Staff Report No. 743
October 2015
Revised December 2016
On the Scale of Financial Intermediaries
Tobias Adrian, Nina Boyarchenko, and Hyun Song Shin
Federal Reserve Bank of New York Staff Reports, no. 743
October 2015; revised December 2016
JEL classification: E02, E32, G00, G28
Abstract
This paper studies the economic scale of financial institutions. We show that banks and security
broker-dealers actively smooth book equity by adjusting payouts. The smoothing of book equity
is associated with procyclical book leverage and procyclical net payouts. In contrast, market
leverage largely reflects movements in valuation levels as measured by book-to-market ratios.
The 2008 crisis caused a structural break, after which the growth rates of the banking and dealer
sectors have been subdued relative to pre-crisis levels. We draw conclusions for theories of
financial intermediation and for capital regulation.
Key words: financial intermediation, macro-finance, capital regulations
_________________
Adrian, Boyarchenko: Federal Reserve Bank of New York (e-mails: [email protected],
[email protected]). Shin: Bank for International Settlements (e-mail:
[email protected]). This paper was previously distributed under the title “The Cyclicality of
Leverage.” The authors thank Daniel Stackman for providing excellent research assistance, as
well as Paul Glasserman, Jennifer La’O, and participants at the Workshop on Systemic Risk at
Columbia University for comments on previous drafts of the paper. The views expressed in this
paper are those of the authors and do not necessarily reflect the position of the Bank for
International Settlements, the Federal Reserve Bank of New York, or the Federal Reserve
System.
1 Introduction
Recent theoretical literature has come to recognize the importance of financial intermediation in
propagating macroeconomic shocks. Within dynamic equilibrium models, financial intermediation
has been shown to matter for asset pricing, systemic risk, monetary policy, and macroprudential
policy.1 This recent literature builds on earlier papers by Bernanke and Gertler (1989) and Kiyotaki
and Moore (1997) but, instead of studying frictions faced by the productive firms in economy,
considers frictions faced by intermediaries that finance the productive firms.
In these general equilibrium models, the frictions faced by the financial sector determine both
how intermediaries propagate shocks to the real economy and how intermediaries shape their own
balance sheets. In a frictionless Modigliani and Miller (1958) world, balance sheet management
decisions such as payouts to equity holders and leverage choices are irrelevant to the value of the
firm. When frictions are present, the amount of leverage and the timing of payouts matters, and
intermediary equity and leverage become key state variables in describing equilibrium outcomes.
The equity of intermediaries not only represents the value of the firm from the point of view of the
owners of the firm, but also determines their capacity to withstand adverse shocks and to borrow.
The size of equity is managed by the intermediaries via payout and leverage decisions. Earnings
can be paid out or retained, and leverage can be scaled up and down over time.
In this paper, we document empirically how intermediaries manage their leverage and make
payout decisions. Our aim is to help discriminate between different theories of financial interme-
diation by providing additional evidence on both long-run and business-cycle-frequency behavior
of intermediaries. The theoretical literature has identified two hypotheses for the behavior of inter-
mediaries over the business cycle: procyclical and countercyclical leverage. The importance of the
leverage cycle for aggregate fluctuations was first pointed out by Geanakoplos (2003) and Fostel
1He and Krishnamurthy (2013) and Adrian and Boyarchenko (2012) examine asset pricing implications, He andKrishnamurthy (2012b,a), Brunnermeier and Sannikov (2014), and Gertler and Kiyotaki (2012) analyze systemic risk,Brunnermeier and Sannikov (2011) investigate monetary policy, and Goodhart, Kashyap, Tsomocos, and Vardoulakis(2012), Angelini, Neri, and Panetta (2011), Angeloni and Faia (2013), Korinek (2011), and Bianchi and Mendoza(2011) examine macro prudential policy.
1
and Geanakoplos (2008). In their theory, heterogenous agents are subject to collateral constraints,
giving rise to an inherently procyclical leverage cycle: booms are fueled by a loosening in collateral
requirements, while busts feature contractions in leverage. Such procyclicality of leverage has also
been a key amplification mechanism in models with value-at-risk constraints, as shown by Brun-
nermeier and Pedersen (2009), Danielsson, Shin, and Zigrand (2011), Adrian and Shin (2014),
and Adrian and Boyarchenko (2012). Value-at-risk constraints loosen in booms when volatility
is low, enabling higher leverage, and tighten in downturns when volatility increases. In addition,
Gertler and Kiyotaki (2012) introduce accounting frictions that fuel procyclical leverage. In con-
trast, He and Krishnamurthy (2012b, 2013), and Brunnermeier and Sannikov (2014, 2011) feature
countercyclical leverage, driven by the intuition that equity is run down in bad times, leading to an
involuntary increase in leverage.
Figure 1 presents the long sweep of the evolution of total assets and book equity of the U. S.
commercial bank sector, the U. S. broker-dealer sector, the largest five universal banks (JP Morgan,
Bank of America, Citigroup, Goldman Sachs, and Morgan Stanley), and all U. S. nonfinancial firms
from 1985, where we have superimposed the linear time trend estimated through Q4 2008 of each
series.2 We note four features. First, the broker-dealer sector has grown at a slightly faster pace
than the commercial bank sector over this period, and has operated at a higher book leverage than
the commercial bank sector, as indicated by the wider tram-lines between the total assets and book
equity trend series. This difference is not driven by the largest institutions but is instead a robust
feature of the data.
Second, the book equity series for the each subgroup of financial institutions displays a smoother
path over time than total assets, suggesting that banks and dealers actively smooth book equity. We
will see shortly that this is indeed the case, and banks adjust payouts to achieve a desired trajec-
tory of book equity. We document the evidence both through the determinants of book equity,
but also through dynamic impulse responses from a panel vector autoregression (VAR) of a large
2We have also estimated corresponding trend lines generated using a Hodrick-Prescott filter, and have found theresults to be both quantitatively and qualitatively similar. We focus on the linear trend in the exposition in order to beable to formally test for a structural break in the trend after the financial crisis.
2
Figure 1. Equity and Assets of Banks and Dealers over Time
0
2
4
6
8
Log(
Billio
n U
SD)
1985:1 1990:1 1995:1 2000:1 2005:1 2010:1 2015:1
Commerical Banks
0
2
4
6
8
Log(
Billio
n U
SD)
1985:1 1990:1 1995:1 2000:1 2005:1 2010:1 2015:1
Broker-Dealers
0
2
4
6
8
Log(
Billio
n U
SD)
1985:1 1990:1 1995:1 2000:1 2005:1 2010:1 2015:1
JPM, BoA, C, GS, MS
0
2
4
6
8
Log(
Billio
n U
SD)
1985:1 1990:1 1995:1 2000:1 2005:1 2010:1 2015:1
Nonfinancials
This figure plots average total assets (in black) and book equity (in blue) together with the corresponding time trendfor the commercial bank sector, the broker-dealer sector, the largest five universal banks (JP Morgan, Bank ofAmerica, Citigroup, Goldman Sachs, and Morgan Stanley), and all nonfinancial firms, over time. The linear timetrend is estimated through 2008:4. Total assets and book equity are from Compustat.
cross-section of banks and how they manage their balance sheets.
Third, there is an apparent structural break after the 2008 financial crisis in asset and equity
growth of both the broker-dealer and the commercial bank sectors. While this structural break is
apparent in both financial sectors, growth in the broker-dealer sector has been particularly subdued,
with the current total assets and book equity of the broker-dealer sector remaining substantially
below the pre-crisis trend line. In contrast, the level of GDP has resumed its growth after the Great
Recession and has recovered all of the losses incurred during the financial crisis.
Fourth, the balance sheet behavior of nonfinancial firms is significantly different from that of
the financial sectors. Assets and equity move in parallel, suggesting that leverage dynamics are
3
less important for nonfinancials. The deviation of book equity from the linear trend is larger than
the deviation for book assets, suggesting that, unlike the financials, nonfinancial firms manage the
size of their balance sheet. Furthermore, there does not appear to be a pronounced structural break
after the financial crisis, and the post-crisis deviations from trend have been to the positive side:
both the total assets and the book equity have grown faster after the crisis than predicted by the
pre-crisis linear trend.
Taken together, the smooth evolution of financial firm equity over the long-run and the rela-
tively more volatile evolution of financial firm assets imply that the long-run scale of these types
of financial firms is determined by book equity. In the short-run, financials adjust leverage condi-
tional on a book equity realization, making total assets fluctuate around their long-run trend. When
book equity deviates from its time trend, financials tend to adjust their net payouts, bringing them
back to the equity trend line. These findings suggest that financial firms have decreasing returns to
scale. In Table 3 we further document that financial firms pay down book equity during upswings,
a fact that is especially noteworthy since book equity growth reflects strong profitability of banks.
Financials thus actively manage the size of their book equity. They tend to pay out, and leverage,
to the maximum, so as to achieve high return on equity.
Overall, Figure 1 illustrates the fundamental finding of our paper: size plays a different role
financial and nonfinancial firms. While financial firms target equity growth and actively manage
their leverage, nonfinancial firms appear to target asset growth and adjust their leverage more
passively.
This payout behavior raises the question why banks choose to finance the growth in credit
through debt, even while they erode the size of their book equity through increased payouts. This
suggests that banks’ operations do not exhibit constant returns to scale. If the banking business had
constant returns to scale, the bank could refrain from dividend payouts by retaining the profit as
book equity and replicate their existing operations based on a larger book equity foundation. Cash
dividends dissipate book equity and shareholders are reluctant to be diluted by issuing new shares.
This points towards the existence of an optimal scale of the bank as given by an optimal size of its
4
book equity. The optimal size of the book equity determines the shadow value of book equity. The
existence of such a optimal scale for the bank reconciles the long-run unit elasticity of book equity
with respect to total assets with the payout behavior of banks targeting a level of book equity.
The above results are obtained by considering equity at book values. Empirically, equity and
leverage can be measured using book values or using market values. The definition of book lever-
age is the ratio of total assets to book equity, while the definition of market equity is the ratio of
enterprise value to market equity (enterprise value is the sum of total liabilities and market equity).
Adrian and Shin (2014) document that book leverage is procyclical while market leverage is coun-
tercyclical. These facts raise the question whether the relevant empirical measure of leverage is at
book or at market values. Book values figure prominently in both financial firms’ discussions of
what they do, as well as in the regulations that govern banks. For example, the annual reports of
major U. S. banking organizations commonly present their targets for return on equity – a measure
of performance at book value – and they report the evolution of leverage at book values. Regula-
tions are typically built around ratios related to book leverage, not market leverage. In particular,
the Basel bank capital regulations all refer to measures of capital at book value. In addition, U. S.
and European stress tests measure capital adequacy in terms of the book value of equity.
We document empirically that banks base their balance sheet management around book equity
and book leverage. Market leverage also plays a role in the banks’ balance sheet management,
but that role is secondary, and turns out to matter at shorter horizons. Furthermore, we present
evidence that balance sheet management of intermediaries is linked to market risk.
As for market leverage, we show that virtually all the cyclical variation of market leverage is
driven by fluctuations in the book-to-market ratio, reflecting the valuation changes of free cash
flows generated by the bank. Nevertheless, there are important links between market leverage and
shifts in the book leverage of the bank. At short horizons, an increase in market leverage (reflecting
the higher valuations of intangible income) has a similar effect as a decline in the implicit haircut
paid by the bank to borrow.
Crucially, just as we observe a structural break in the total assets and book equity series around
5
the financial crisis, we also observe a structural break in the relationship between market leverage
and the book-to-market ratio; in particular, the slope of the relationship between the two undergoes
a structural shift, so that the book-to-market ratio for any given market leverage is significantly
lower after the crisis. In other words, both book leverage and market leverage undergo a structural
shift post-crisis.
The remainder of the paper is organized as follows. Section 2 shows the procycliality of book
leverage and countercyclicality of market leverage for commercial banks and broker-dealers. Sec-
tion 3 shows that book leverage is actively managed via changes to payout that impact the equity
cushion of firms, while market leverage is largely a function of fluctuations in market to book val-
ues. Section 4 links leverage management to the scale of banking by showing that net payout is a
function of the equity gap – the difference between book equity and its long term trend. Section 6
discusses the points of contact with the asset pricing literature. Section 7 concludes.
2 Cyclicality of Leverage
As a starting point, we study the behavior of leverage over the business cycle, and the determi-
nants of the evolution of leverage. Previous work (see Adrian and Shin, 2014) has established the
importance of distinguishing between book and market values of equity and leverage. We follow
this work in defining book equity as the difference between total assets and total debt, and market
equity as market capitalization. Similarly, book leverage is defined as the ratio of total assets to
book equity, while market leverage is defined as the ratio of enterprise value (total assets - book
equity + market equity) to market equity. Maintaining the distinction between these different con-
cepts of equity and leverage is important, as they have distinct interpretations and display disparate
behavior both across sectors and over the business cycle.
The enterprise value of a firm addresses how much the firm is worth to its stakeholders. A
firm’s enterprise value is the theoretical sum of money that would be needed to buy out the share-
holders and debt holders. In contrast, the total assets of financial firms measure how much the firm
6
lends, either directly as loans or through other claims. For nonfinancial firms, total assets mea-
sure how much productive capital the firm has. Both of these valuation concepts are economically
meaningful and capture different facets of how financial institutions manage their balance sheets.
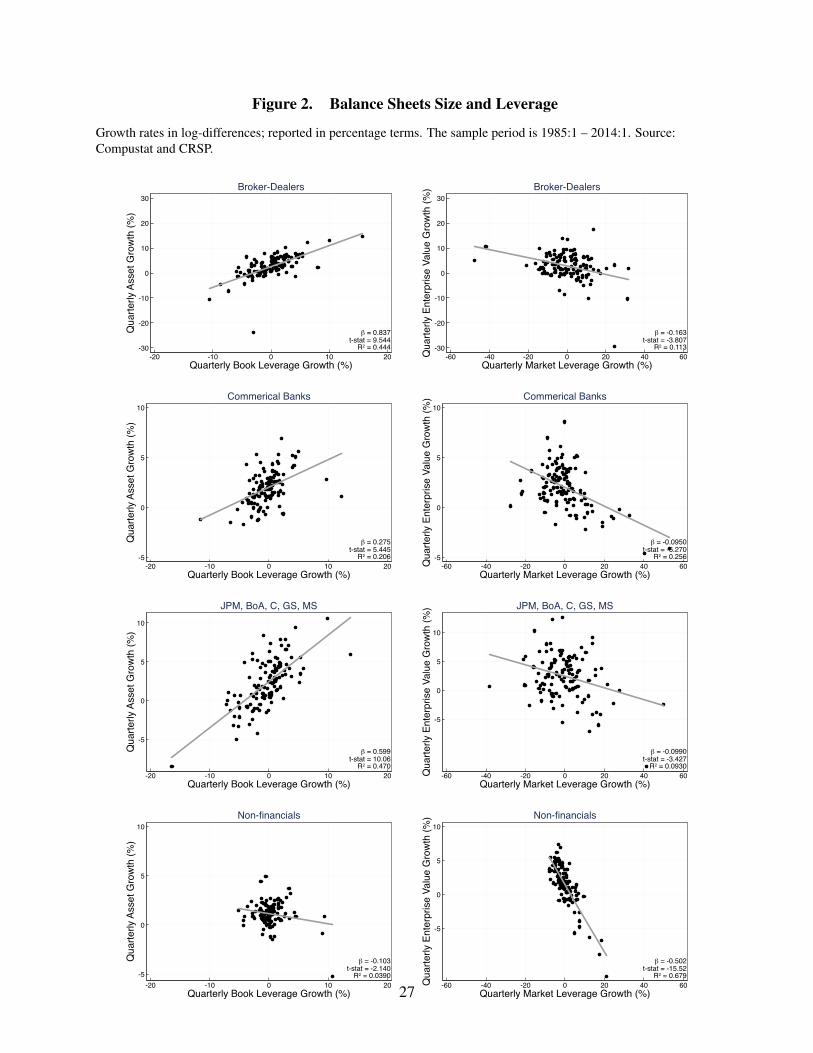
Figure 2 shows the procyclicality of book leverage for broker-dealers, commercial banks, five
of the largest U. S. banks and broker-dealers (JP Morgan, Citibank, Bank of America, Goldman
Sachs, and Morgan Stanley). For each cut of the financial sector data, book leverage is procyclical,
while market leverage is countercyclical, as noted by Adrian and Shin (2014). That is, book
leverage is high when total assets are large, but market leverage is low when enterprise value
is high. This result illustrates the fundamental difference between book and market leverage:
while financial institutions can actively manage the behavior of book leverage, market leverage is
determined primarily by market forces. The procyclicality of book leverage derives from financials
reducing lending by reducing their debt – that is, by deleveraging. Hence, book leverage is low
during downturns and high during booms. The countercyclicality of market leverage comes from
the fact that more of the value of the financial firm is in the hands of the debt holders during
downturns, as the share price of the bank falls. Thus, market leverage is high during downturns.
Figure 2 also shows that the balance sheet management of nonfinancial firms is markedly dif-
ferent. For book leverage, nonfinancials exhibit very weak, negative correlation between asset
growth and leverage growth. This points to a balance sheet management that is passive relative to
the book value of equity. The picture for the market value is very different. There is a strong, neg-
ative relationship between enterprise value and market leverage, indicating that market leverage is
determined by enterprise value.
Figure 3 provides another look at the procyclicality of book leverage by plotting the dollar
changes of book equity and debt against the dollar changes of total assets for commercial banks,
broker-dealers, the five largest banks and broker-dealers, as well as the nonfinancial sector. For the
financial sector, changes in book equity are very small compared to changes in debt. The margin
of balance sheet adjustment is thus leverage, not equity. In contrast, for nonfinancial firms, both
asset size and equity are adjusting in comparable magnitude.
7
To delve further into the difference between book leverage and market leverage, it is helpful
to consider the relationship of leverage with book-to-market values, reported in Figure 4. The top
four panels show that market leverage moves almost one-for-one with the book-to-market ratio.
In contrast, book leverage exhibits very low correlation with the book-to-market ratio (lower four
panels). It is worth emphasizing that the countercylicality of market leverage is not simply about
the marking-to-market of balance sheets and the potentially stale nature of accounting values.
Broker-dealers mark their whole balance sheet to market, while commercial banks use historical
cost accounting for their loan book. However, Figures 2 and 4 show that the behavior of leverage
and of the book-to-market ratio is qualitatively very similar when comparing broker-dealers and
commercial banks. This suggests that accounting is an unlikely driver of the different cyclicality
using book and market values, as dealers are fully marking to market their balance sheets, while
banks use historical cost accounting.
This observation brings us to the importance of intangible assets in accounting for the differ-
ence between book equity and market capitalization. Market capitalization is the discounted value
of free cash flows, and those cash flows can be generated by intangible assets. For example, the re-
lationships that firms have with their clients, or the human capital of their workforce are important
determinants of future profitability, but those assets are not visible on the balance sheet, and hence
do not count towards book equity. An important reason for fluctuations in book-to-market values
for financial firms therefore consist in fluctuations of the value of future cash flows from intangible
assets.
Fluctuations in the book-to-market ratio due to variations in the discounted future value of in-
tangible assets are distinct from leverage management. Active leverage management of financial
intermediaries reflects asset sales and purchases, lending decisions, market making, and other fi-
nancial transactions. The intangible assets of intermediaries, on the other hand, are related to fee
income from investment banking and similar activities. Such activities need little, if any, balance
sheet. These considerations thus establish that the countercyclicality of market leverage is pri-
marily related to fluctuations in value not directly related to financial assets and liabilities on the
8
balance sheets of intermediaries.
The cyclicality of book and market leverage can also be seen from Table 1 for financial firms
in Panel A and for nonfinancial firms in Panel B. Columns (1) and (2) report the regression of
quarterly (book) asset growth on quarterly book leverage growth using firm fixed effects and time
fixed effects, respectively, while columns (4) and (5) show the regressions of quarterly enterprise
value growth on quarterly market leverage growth, again using fixed effects and time effects, re-
spectively. Columns (1) and (2) show that the procyclicality of leverage holds both in the time
series (using firm fixed effects) and in the cross section (using time fixed effects). In contrast,
for market leverage, the time series relationship is negative, but the cross-sectional relationship is
actually positive. It is particularly revealing that the R2s for the book value regressions are large,
while the R2s for the enterprise value regressions are small.
Panel B of Table 1 shows these same regressions for nonfinancial firms. Unlike financials,
nonfinancials appear to manage enterprise value of the firm, rather than book equity. In particular,
while the regression of asset growth on book leverage growth still has a positive coefficient, it is
no longer significant in the time series, is of much smaller magnitude than for the financials and,
crucially, has almost no explanatory power (as demonstrated by the low R2s). In contrast, the
relationship between enterprise value growth and market leverage growth has large R2s, is robust
to including either time or firm fixed effects (or both), and the coefficients are economically large.
These results again suggest that the balance sheet management of financial firms is very distinct
from the balance sheet management of nonfinancial firms.
3 Balance Sheet Management over Short and Long Run
We now examine the role of book equity in banks’ lending decisions and how banks adjust their
balance sheets over the short and long run. Figure 5 from Adrian and Shin (2014) shows three
ways that a firm (financial or otherwise) can increase its leverage. In each case, the grey shaded
area represents the balance sheet component that does not change.
9
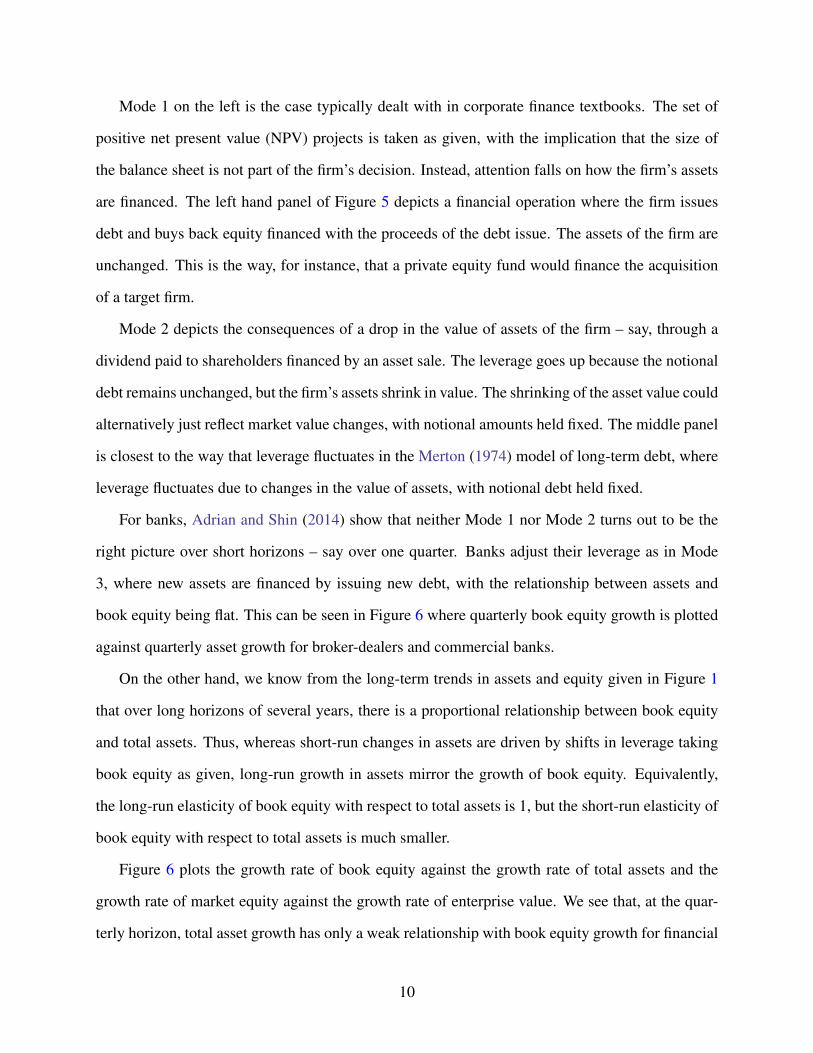
Mode 1 on the left is the case typically dealt with in corporate finance textbooks. The set of
positive net present value (NPV) projects is taken as given, with the implication that the size of
the balance sheet is not part of the firm’s decision. Instead, attention falls on how the firm’s assets
are financed. The left hand panel of Figure 5 depicts a financial operation where the firm issues
debt and buys back equity financed with the proceeds of the debt issue. The assets of the firm are
unchanged. This is the way, for instance, that a private equity fund would finance the acquisition
of a target firm.
Mode 2 depicts the consequences of a drop in the value of assets of the firm – say, through a
dividend paid to shareholders financed by an asset sale. The leverage goes up because the notional
debt remains unchanged, but the firm’s assets shrink in value. The shrinking of the asset value could
alternatively just reflect market value changes, with notional amounts held fixed. The middle panel
is closest to the way that leverage fluctuates in the Merton (1974) model of long-term debt, where
leverage fluctuates due to changes in the value of assets, with notional debt held fixed.
For banks, Adrian and Shin (2014) show that neither Mode 1 nor Mode 2 turns out to be the
right picture over short horizons – say over one quarter. Banks adjust their leverage as in Mode
3, where new assets are financed by issuing new debt, with the relationship between assets and
book equity being flat. This can be seen in Figure 6 where quarterly book equity growth is plotted
against quarterly asset growth for broker-dealers and commercial banks.
On the other hand, we know from the long-term trends in assets and equity given in Figure 1
that over long horizons of several years, there is a proportional relationship between book equity
and total assets. Thus, whereas short-run changes in assets are driven by shifts in leverage taking
book equity as given, long-run growth in assets mirror the growth of book equity. Equivalently,
the long-run elasticity of book equity with respect to total assets is 1, but the short-run elasticity of
book equity with respect to total assets is much smaller.
Figure 6 plots the growth rate of book equity against the growth rate of total assets and the
growth rate of market equity against the growth rate of enterprise value. We see that, at the quar-
terly horizon, total asset growth has only a weak relationship with book equity growth for financial
10
firms and especially so for commercial banks and the five global banks. Thus, the short-run elas-
ticity of total assets with respect to book equity is small. This translates into a weak negative
relationship between growth rate of book leverage and book equity growth, as shown in the left
column of Figure 7.
In contrast, market equity growth has a strong positive relationship with enterprise value growth,
shown in the right column of Figure 6. This short-run relationship between the firms’ worth to their
stakeholders and market equity translates into a strong relationship between market equity growth
and market leverage growth. The panels on the relationship between market equity growth and
market leverage growth in the right column of Figure 7 is particularly striking, as they demonstrate
that market equity growth is strongly negatively related to market leverage growth. To a first ap-
proximation, market leverage is entirely determined by the valuation of equity: the R2 is 90 percent
for broker-dealers, and 97 percent for commercial banks. For book equity and book leverage the
R2 is only slightly lower for the case of commercial banks, at 71 percent, but considerably lower
for the broker-dealers (18 percent).
4 Book Equity and the Scale of the Bank
The scale of a firm is given by its total assets. In corporate finance textbooks, the assets of a
firm are determined exogenously by the set of positive net present value projects available to the
firm. When the firm happens to be a financial firm, we have seen that the firm’s book equity plays
an important role in defining the scale of the firm. The long-run scale of the financial firm is
determined by the book equity of the firm, and any short-run fluctuations in total assets take place
around a fixed book equity base. In other words, it is the book equity of the financial firm that
takes the role of the scaling variable for the firm.
Additional evidence that book equity is the right scale variable for the bank comes from the
active management of the size of the bank’s book equity through dividend payouts by the bank.
The evidence is that banks tend to adjust net payouts so as to target a fixed trend level of book
11
equity. Figure 1 shows that book equity evolves very smoothly over the long-run, and much more
so than total assets.
More specifically, consider the balance sheet identity
At = Dt +Et , (1)
where At denotes total assets, Dt the level of debt, and Et book equity. This identity implies the
where earnings and payouts are between t and t−1. Net payout are defined as dividend distribu-
tions plus share repurchases minus equity issuances. Changes in book equity are thus determined
by the flow variables (earnings, payout, issuance) and changes in the stock variables (total assets
and debt). The amount of equity and the level of leverage thus depend not only on adjustments to
balance sheet size and debt levels, but also on payout and issuance decisions.
Figure 8 shows the relationship between net payouts, equity growth and leverage growth across
different lags. The top panels shows that increases in net payouts precede positive book leverage
growth for financial institutions and coincides with negative market leverage growth. In other
words, book leverage increases after net payouts have been high. When the firm increases net
payouts, market leverage decreases as the market valuation of the firm increases, as shown in the
middle right panel. The middle left panel shows that increases in book equity precede increase
in net payouts. Thus, when book equity has been strong in the recent past (over the preceding 4
to 5 quarters), net payouts increase significantly, and book equity dissipates. Taken together, the
evidence is that financials actively manage the size of their book equity, paying down book equity
through higher payouts when it has been growing strongly. Finally, the bottom two panels show
that book leverage growth precedes decreases in both the market-to-book ratio and market equity
growth. In other words, when financial firms raise debt, the value of the firms to its shareholders
12
decreases, dissipating the market equity of the institution.
The evidence in the cross-correlograms on the active management of book equity by the banks
is confirmed in the impulse response charts in Figure 9 obtained from a panel VAR where the
variables in the VAR are ordered from left to right in the order depicted in Figure 9. The estimates
of the panel VAR are reported in Table 2. We focus in particular on the panel showing the response
of book leverage to a payout shock and the response of payouts to a book equity shock. Regarding
the former, we see that book leverage tends to increase after a payout, showing that payouts are one
way for the bank to keep book leverage high. For the response of payouts to a book equity shocks,
we see first that there is an instantaneous negative relationship between payouts and book equity
– a mechanical relationship – but there is a more interesting effect at a longer horizon of around
5 quarters in which payout increases significantly when book equity increases. This response of
payouts to an equity shock indicates that the bank is actively managing book equity and trying to
keep book equity along a smooth path. Indeed, the opening chart in Figure 1 showed how smooth
book equity was, and the VAR evidence supports the hypothesis of active management of book
equity.
Table 3 reports the results of a panel regression for net payouts of the bank as a function of the
de-trended book equity of the bank, defined as the deviation of book equity from its linear trend
line plotted in Figure 1. We see that the coefficient on detrended book equity 4 quarters-lagged is
strongly positive, implying that the bank pays down book equity if it has recently (over the year)
seen strong growth in book equity. Conversely, if the bank has suffered losses and has seen an
erosion of book equity, the bank takes action to rebuild book equity.
The fact that banks pay down book equity during the upswing is especially noteworthy. Since
book equity growth reflects strong profitability of banks, the period of rapid book equity growth
coincides with periods of buoyant economic conditions and strong credit growth. The question is
why banks choose to finance the growth in credit through debt, even while they erode the size of
their book equity through increased payouts.
Another way to pose the question is to ask whether the banks’ operations have constant returns
13
to scale. If the banking business had constant returns to scale, the bank could refrain from dividend
payouts by retaining the profit as book equity and replicate their existing operations based on a
larger book equity foundation. To the extent that the bank’s shareholders are reluctant to issue new
equity due to the dilution of incumbent shareholders’ claims, the shadow value of book equity is
bigger than one. That is, one dollar in book equity is worth more to the shareholders than one
dollar in cash. However, to the extent that banks’ shareholders are also willing to pay out cash
dividends suggests that the shadow value of book equity cannot be strictly larger than 1.
We need to reconcile (1) cash dividends that dissipate book equity and (2) reluctance of share-
holders to be diluted by issuing new shares. One way to reconcile these two features would be the
existence of an optimal scale of the bank as given by an optimal size of its book equity E∗. The
optimal size of the book equity determines the shadow value of book equity, so that the shadow
value of book equity is larger than one when book equity E is below this optimal scale (E < E∗),
but the shadow value is less than 1 when E > E∗. Moreover, we may hypothesize that the optimal
scale E∗ is a slow-moving variable. The existence of such an optimal scale E∗ for the bank rec-
onciles the long-run unit elasticity of book equity with respect to total assets (Figure 1) with the
payout behavior of banks targeting a level of book equity.
In terms of equation (2), the active usage of leverage via changes in total assets and debt levels
suggests that firms have a preference for positive net payouts, preferring dividends and repurchases
in favor of equity issuance. Such a preference for net payouts would then lead firms to adjust
leverage in order to achieve the optimal scale E∗. Around the long-term trend for book equity,
the bank’s lending behavior in the short-run is determined by its leverage decision, which in turn
is closely related to the market conditions that tie down the bank’s market capitalization and the
book-to-market ratio of the bank.
Our finding that financials institutions appear to have an optimal scale given its book equity E∗
raises a more fundamental question: do financial institutions operate according to constant returns
to scale? In other words, if the institution could simply replicate its existing business by expanding
its balance sheet in exact proportion, what would happen to the overall value of the institution? If
14
the institution had constant returns to scale, the firm’s value would be proportional to the size of
its balance sheet, and the shadow value of its book equity would be constant. If the shadow value
of book equity is strictly larger than one, the firm’s shareholders value one dollar of book equity
more than one dollar of cash. Under constant returns to scale, the institution would never pay
a cash dividend and instead would retain all profits, expanding the firm’s business by replicating
the existing balance sheet. The fact that the financial firm appears to have an optimal scale of
book equity and actively manages it suggests that the firm’s business is not perfectly scaleable. Its
intangible assets, such as its workforce and relationships with clients would be very difficult to
replicate.
Table 4 reports the panel regressions of leverage on payout and equity. Higher payout increases
book leverage, as it leads to a compressed equity cushion for a given level of assets. Consequently,
net payout is highly significantly related to book leverage. However, it has low explanatory power.
Book equity, on the other hand, is strongly negatively correlated with book leverage, yielding a 32
percent R2. Market equity growth, and book-to-market growth have very low explanatory power
for book leverage. When all indicators are used jointly (column (5)), only book equity growth
appears significant. Hence we conclude that net payout and equity valuations matter for book
leverage only to the extent to which they have an impact on book equity growth.
For market leverage the panel regressions give R2s of 87 percent, respectively, when market
leverage growth is regressed on market equity or the book-to-market ratio (columns (3) and (5) in
Panel B of Table 4). Net payout and book leverage, on the other hand, have barely any explanatory
power for market leverage, with R2s below 1 percent. These findings are consistent with the notion
that market leverage growth rates are largely outside of the control of firms, and are instead moved
by exogenous variations in valuations. This contrasts with book leverage, which is pinned down
by book equity, which is directly in control of the firms, via retained earnings and net payout.
15
5 Post-crisis Trends
The preceding discussion focused on the long sweep of book equity and total assets evolution.
Figure 1, however, shows that, after Q4 2008, the financial sector has grown at much slower rates.
We now study the difference between pre-crisis and post-crisis trends more formally.
Panel A of Table 5 documents the difference in trends prior to Q3 2007 and after Q3 2009.
For broker-dealers and the five global banks, the trend growth rate of total assets decreased from
3% pre-crisis to 0.3% post-crisis, a ten-fold decline. For book equity, the decrease is even more
dramatic, from 3.8% pre-crisis to -0.1% post-crisis. The last two columns of Table ?? show that
these changes are statistically significant at the 1% level. For commercial banks, we observe a
similar decline in trend growth, albeit at much less dramatic rates: total asset growth rate declines
from 2.5% to 0.5% and book equity growth rate declines from 3.5% to 0.4% percent. Finally, while
nonfinancials also experienced a decline in growth rates (from 1.7% to 0.8% for total assets and
from 1.3% to 0.2% for book equity), the decline is much more mild and less statistically significant.
Overall, Panel A shows that the 2008 crisis caused a structural break that is particular pro-
nounced for broker-dealers. The trend growth rate of total assets declines ten-fold for the dealers,
five-fold for commercial banks, and two-fold for the nonfinancial sector. Thus, firms most affected
by post-crisis regulation have decreased in size the most. The decrease in total assets for finan-
cial firms implies a decrease in the total lending capacity of broker-dealers and commercial banks,
which translates into a decrease in the size of non-financial firms.
Panel B of Table 5 shows the differences in mean absolute deviation from the pre-crisis trend
for the different sectors. The table shows large increases in the absolute deviations for the dealers
and banks since the financial crisis, and increases for the nonfinancial sector, albeit on a smaller
scale. This additional evidence confirms the structural break that occurred around the financial
crisis which seems to have the financial sector of its desired growth path.
16
6 Points of Contact with Asset Pricing Literature
We have seen that, although book equity and total assets are accounting constructs, rather than
market variables, they nevertheless hold important information on market conditions, as book eq-
uity and book leverage determine the supply of credit to the economy, including to the financial
system. To the extent that asset prices are sensitive to credit conditions through, for instance, the
ease with which financial market participants can obtain leverage, the combination of book equity
and book leverage will hold important information that is relevant for asset returns.
Recent asset-pricing literature has explored the impact of book leverage on asset returns.
Adrian, Etula, and Muir (2014) use shocks to the leverage of broker-dealers to construct an in-
termediary SDF. Intuitively, deteriorating funding conditions are associated with deleveraging and
high marginal value of wealth. The single-factor model of Adrian, Etula, and Muir (2014) prices
size, book-to-market, momentum, and bond portfolios with an R2 of 77 percent and an average an-
nual pricing error of 1 percent. The model performs as well as standard multi-factor benchmarks
designed to price these assets. The findings support the hypothesis that financial intermediaries
trade frequently in many markets using sophisticated models. Building on Adrian, Etula, and Muir
(2014), Adrian, Moench, and Shin (2014) investigate predictions from alternative intermediary as-
set pricing theories which distinguish themselves in their use of intermediary equity or leverage as
pricing factors or forecasting variables. Adrian, Moench, and Shin (2014) find strong support for
a parsimonious dynamic pricing model based on broker-dealer leverage as the return forecasting
variable and shocks to broker-dealer leverage as a cross-sectional pricing factor. The model per-
forms well in comparison to other intermediary asset pricing models as well as benchmark pricing
models. Adrian, Moench, and Shin (2014) in turn extends results by Adrian, Moench, and Shin
(2010) who document that broker-dealer leverage growth contains strong predictive power for ex-
cess returns on a broad set of equity and corporate bond portfolios. Adrian, Friedman, and Muir
(2015) build a model for the cost of equity capital of financial intermediaries that absorbs the com-
mon variation of financial sector equity returns in both the cross section and time series. Adrian,
17
Friedman, and Muir (2015) construct risk factors from the cross-section of intermediary returns,
including a leverage and a return on equity factor, and a financial sector excess return. Despite
apparent overlap, the return factors have surprisingly low correlation with standard benchmark
pricing factors that are not specifically constructed for the financial sector, and these benchmark
pricing models fail to price financial sector portfolio returns. Adrian, Friedman, and Muir (2015)
relate the leverage factor to the balance sheet expansion of intermediaries which predicts low fu-
ture returns, in sharp contrast to nonfinancials. The model is used to estimate the time-series for
the cost of capital of the financial sector.
7 Lessons and Conclusions
Banking organizations manage payout and leverage in order to achieve a scale of operation that is
best captured by its book equity. The long-run leverage of the bank is then built on the trend book
equity.
In the short-run, however, the bank’s total assets can fluctuate considerably depending on mar-
ket conditions, especially on those same forces that determine the book-to-market ratio of the
bank. Qualitatively, the book-to-market ratio behaves similarly to the implied volatility of the
bank’s share price, which is known to be closely linked with the Value-at-Risk (VaR) and the hair-
cut variables that banks are subject to (Adrian and Shin, 2014). Net payout is high in booms,
and issuance only occurs in severe financial crisis. Furthermore, book leverage is managed in a
strongly procyclical manner. Market leverage, on the other hand, appears to be primarily linked to
the market to book ratio, which is largely determined by fluctuations in valuations.
Intriguingly, we have documented a structural break with the onset of the 2008 financial crisis
that has subdued both the market leverage of the bank but also its book equity growth. Post-crisis,
the trend growth of the book equity of the banking sector (but especially the broker dealer sector)
has been on a flatter trajectory. At the same time, the book-to-market ratio of the banks have also
undergone a step decline, to the extent that the book value of equity has exceeded the market value
18
in aggregate since the crisis. The relationship between market leverage and the book-to-market
ratio lies on a different line altogether after the crisis.
ReferencesADRIAN, T., AND N. BOYARCHENKO (2012): “Intermediary Leverage Cycles and Financial Sta-
bility,” Federal Reserve Bank of New York Staff Reports, 567.
ADRIAN, T., E. ETULA, AND T. MUIR (2014): “Financial Intermediaries and the Cross-Sectionof Asset Returns,” Journal of Finance, 69, 2557–2596.
ADRIAN, T., E. FRIEDMAN, AND T. MUIR (2015): “The Cost of Capital in the Financial Sector,”Federal Reserve Bank of New York Staff Reports.
ADRIAN, T., E. MOENCH, AND H. S. SHIN (2010): “Financial Intermediation, Asset Prices, andMacroeconomic Dynamics,” Federal Reserve Bank of New York Staff Reports No. 442.
(2014): “Dynamic Leverage Asset Pricing,” Federal Reserve Bank of New York StaffReports No. 625.
ADRIAN, T., AND H. S. SHIN (2014): “Procyclical Leverage and Value-at-Risk,” Review of Fi-nancial Studies, 27, 373–403.
ANGELINI, P., S. NERI, AND F. PANETTA (2011): “Monetary and Macroprudential Policies,”Bank of Italy Staff Report Number 801.
ANGELONI, I., AND E. FAIA (2013): “Capital Regulation and Monetary Policy with FragileBanks,” Journal of Monetary Economics, 60(3), 311–324.
BERNANKE, B., AND M. GERTLER (1989): “Agency Costs, Net Worth, and Business Fluctua-tions,” American Economic Review, 79(1), 14–31.
BIANCHI, J., AND E. MENDOZA (2011): “Overborrowing, Financial Crises and Macro-prudentialPolicy,” IMF Working Paper 11/24.
BRUNNERMEIER, M. K., AND L. H. PEDERSEN (2009): “Market Liquidity and Funding Liquid-ity,” Review of Financial Studies, 22(6), 2201–2238.
BRUNNERMEIER, M. K., AND Y. SANNIKOV (2011): “The I Theory of Money,” Unpublishedworking paper, Princeton University.
(2014): “A Macroeconomic Model with a Financial Sector,” American Economic Review,104(2), 379–421.
DANIELSSON, J., H. S. SHIN, AND J.-P. ZIGRAND (2011): “Balance Sheet Capacity and En-dogenous Risk,” Working Paper.
19
FOSTEL, A., AND J. GEANAKOPLOS (2008): “Leverage Cycles and the Anxious Economy,” Amer-ican Economic Review, 98(4), 1211–1244.
GEANAKOPLOS, J. (2003): “Liquidity, Default, and Crashes: Endogenous Contracts in Gen-eral Equilibrium,” in Advances in Economics and Econometrics II, ed. by M. Dewatripont,L. Hansen, and S. Turnovsky, pp. 107–205. Econometric Society.
GERTLER, M., AND N. KIYOTAKI (2012): “Banking, Liquidity, and Bank Runs in an InfiniteHorizon Economy,” Unpublished working papers, Princeton University and NYU.
GOODHART, C. A., A. K. KASHYAP, D. P. TSOMOCOS, AND A. P. VARDOULAKIS (2012):“Financial Regulation in General Equilibrium,” NBER Working Paper No. 17909.
HE, Z., AND A. KRISHNAMURTHY (2012a): “A Macroeconomic Framework for QuantifyingSystemic Risk,” Unpublished working paper.
(2012b): “A Model of Capital and Crises,” Review of Economic Studies, 79(2), 735–777.
(2013): “Intermediary Asset Pricing,” American Economic Review, 103(2), 732–770.
KIYOTAKI, N., AND J. MOORE (1997): “Credit Cycles,” Journal of Political Economy, 105(2),211–248.
KORINEK, A. (2011): “Systemic Risk-taking: Amplification Effects, Externalities, and Regula-tory Responses,” ECB Working Paper.
MERTON, R. C. (1974): “On the pricing of corporate debt: The risk structure of interest rates,”The Journal of Finance, 29(2), 449–470.
MODIGLIANI, F., AND M. H. MILLER (1958): “The Cost of Capital, Corporation Finance and theTheory of Investment,” The American Economic Review, 48(3), pp. 261–297.
20
A DataFirm-level data are from CRSP and the merged CRSP-Compustat databases. Daily and monthlyreturns, and monthly prices and shares outstanding from CRSP are merged with quarterly account-ing data from Compustat. Following much of the asset pricing literature, we only retain commonstocks. Firm characteristics are winsorized at the 5% and 95% levels. Additionally, firms’ balancesheets and market values are adjusted for mergers, and an analysis of the merger-adjusted sam-ple is presented in the appendix as a robustness check. The sample period is 1985:1-2014:1. Wewindsorize at the 95 and 5 percent levels in both levels and growth rates.
A.1 The universe of firmsOur full sample includes any firm with a SIC code between 6000 and 6799, which we take tobe the CRSP universe of all financial firms. This universe includes banks, dealers, real estate,and insurance, as well as a variety of smaller lenders, investment advisors, and holding offices.However, only banks and dealers are retained for analysis. We define commercial banks broadly,as firms with SIC codes less than 6200. This includes all commercial banks, from small communitybanks to large financial conglomerates 3, as well as credit unions, and a few government-sponsoredentities (e.g., Fannie and Freddie). We define broker-dealers as firms with SIC codes between 6200and 6300, and 6712. Our sample of dealers is much smaller than our sample of commercial banks,and is dominated by a few big firms (Bear Sterns, Goldman Sachs, Lehman Brothers, MerrillLynch, and Morgan Stanley). Finally, we drop any firms whose total assets fall below $2 billionand any firm that has zero observations for assets, book equity, or market equity over the wholesample.
A.2 Merger adjustmentMergers and acquisitions create discontinuities in the time series of firm characteristics. Therefore,we use the delisting file from CRSP to merger-adjust the raw data. Given firms A, B, and C, whereB acquires A and is acquired by C, merger adjustment is simply the process of consolidating thebalance sheets of A, B, and C over the whole sample period. Additive variables, such as assetsand equity, are simply summed up, while for non-additive variables, such as returns and returnvolatility, we take a (lagged) market equity weighted average across the firms. Ratios (e.g. ROE)and growth rates are then re-calculated for the merger-adjusted entity. Merger adjusting has theadvantage of removing irrelevant (for our purposes) discontinuities in the data, but has severaldrawbacks. Most importantly, two out of the five large U.S. broker-dealers are folded into thebalance sheets of commercial banks (Bear into JPMorgan, and Merrill into Bank of America).Therefore, we opt to focus on our analysis of the unadjusted firms.
3While we categorize Bank of America, Citibank, and JPMorgan Chase as commercial banks, we often distinguishbetween these three firms and the rest of the commercial banks, due to the fact that they each have large broker-dealersubsidiaries.
21
B Tables and Figures
Table 1: Asset Growth and Leverage Growth
This table displays estimates from panel regressions of total asset (enterprise value) growth on book (market) leveragegrowth, for financial (A) and nonfinancial (B) firms. Enterprise value is the sum of total debt and market equity; book(market) leverage is the ratio of total assets (enterprise value) to book (market) equity. Balance sheet data are quarterlyfrom Compustat (SEC), and returns are daily from CRSP. Growth rates are quarterly, and expressed as percentages.The sample period is - . *** ** and * denote significance at the 1%, 5%, and 10% levels, respectively. Robust standarderrors, clustered by PERMNO, in parentheses.
Firm FE Yes No Yes Yes No YesTime FE No Yes Yes No Yes Yes
22
Table 2: Vector Autoregression
This table reports the panel vector autoregression of annual growth rates of equity volatility, market-to-book, bookequity, book leverage, and net payout. Data on book values are quarterly from Compustat, data on market equity aremonthly from CRSP, and returns are daily from CRSP. Growth rates are quarterly, and expressed as percentages. Thesample period is 1985:1 - 2014:1. ***, ** and * denote significance at the 1%, 5%, and 10% levels, respectively.
Market-to-Book Book Equity Book Leverage Net PayoutsMarket-to-Book (1M lag) 0.792∗∗∗ 0.004 0.003 0.009
This table displays the estimates of panel regressions of net payouts on detrended book equity. Book values arequarterly from Compustat (SEC). Growth rates are quarterly, and expressed as percentages. The sample period is1985:1 - 2014:1. *** ** and * denote significance at the 1%, 5%, and 10% levels, respectively. Robust standarderrors, clustered by PERMNO, in parentheses.
Net Payouts, as a percent of:Contemporaneous Assets 4Q Lagged Assets
(1) (2) (3) (4) (5) (6)Detrended Book Equity (4Q) Lag 1.142∗∗∗ 1.114∗∗∗ 1.071∗∗ 1.289∗∗ 1.285∗∗∗ 1.235∗∗
(0.395) (0.407) (0.423) (0.495) (0.485) (0.504)
Market/Book (4Q) Lag -0.094 -0.087 -0.023 -0.014(0.096) (0.094) (0.177) (0.176)
Book Leverage (4Q) Lag -0.026∗ -0.031(0.015) (0.020)
This table displays estimates from panel regressions of leverage growth on net payouts, book equity growth, marketequity growth, and book/market growth. Data on book values are quarterly from Compustat (SEC), and data on marketvalues are monthly from CRSP. Net payouts are in billions of US dollars. Growth rates are quarterly, and expressed aspercentages. The sample period is 1985:1 - 2014:1. *** ** and * denote significance at the 1%, 5%, and 10% levels,respectively. Robust standard errors, clustered by PERMNO, in parentheses.
Table 5: Mean Absolute Deviation of Book Value Aggregates from Pre-Crisis Trend
This table displays estimates of the pre-Crisis trends and mean absolute deviation (MAD) of log assets and bookequity around their pre-Crisis trend, before and after financial crisis. We compute both statistics for the four differentuniverses of firms plotted in Figure 1: broker-dealers, commercial banks, the top five universal banks, and non-financialfirms, and we test for differences pre- and post-crisis. The sample period is 1985:1 - 2014:1. *** ** and * denotesignificance at the 1%, 5%, and 10% levels, respectively.
Mode 1 is through an equity buyback through a debt issue. Mode 2 is through a dividend financed by asset sale.Mode 3 is through increased borrowing to fund new assets. In each case the shaded area indicates the balance sheetcomponent that is held fixed.
A L
AssetsEquity
Debt
A L
Assets
Equity
Debt
Mode 1: Increased leverage due to equity buyback
A L
AssetsEquity
Debt
A L
Assets Equity
Debt
Mode 2: Increased leverage due to fall in asset value
A L
AssetsEquity
Debt
A L
Assets
Equity
Debt
Mode 3: Increase borrowing to fund asset growth
30
Figure 6. Equity and Balance Sheet Size
The left hand panel is the scatter chart of the growth of book equity and growth of total assets at quarterly frequencyfor broker-dealers. The right panel is the equivalent scatter for the commercial banks. Growth rates inlog-differences; reported in percentage terms. The sample period is 1985:1 – 2014:1. Source: Compustat and CRSP.
-20
-10
0
10
20
Qua
rterly
Boo
k Eq
uity
Gro
wth
(%)
-20 -10 0 10 20Quarterly Asset Growth (%)
β = 0.274t-stat = 5.662
R2 = 0.219
Broker-Dealers
-75
-50
-25
0
25
50
Qua
rterly
Mar
ket E
quity
Gro
wth
(%)
-30 -15 0 15 30Quarterly Enterprise Value Growth (%)
β = 1.730t-stat = 9.426
R2 = 0.438
Broker-Dealers
-20
-10
0
10
20
Qua
rterly
Boo
k Eq
uity
Gro
wth
(%)
-20 -10 0 10 20Quarterly Asset Growth (%)
β = 0.243t-stat = 1.896
R2 = 0.0310
Commerical Banks
-75
-50
-25
0
25
50
Qua
rterly
Mar
ket E
quity
Gro
wth
(%)
-30 -15 0 15 30Quarterly Enterprise Value Growth (%)
β = 3.639t-stat = 8.217
R2 = 0.372
Commerical Banks
-20
-10
0
10
20
Qua
rterly
Boo
k Eq
uity
Gro
wth
(%)
-20 -10 0 10 20Quarterly Asset Growth (%)
β = 0.163t-stat = 2.079
R2 = 0.0370
JPM, BoA, C, GS, MS
-75
-50
-25
0
25
50
Qua
rterly
Mar
ket E
quity
Gro
wth
(%)
-30 -15 0 15 30Quarterly Enterprise Value Growth (%)
β = 2.031t-stat = 7.130
R2 = 0.308
JPM, BoA, C, GS, MS
31
Figure 7. Equity and Leverage
Growth rates in log-differences; reported in percentage terms. The sample period is 1985:1 – 2014:1. Source:Compustat and CRSP.
Figure 8. Net Payout, Leverage, and Market-to-Book: Cross-Correlation
Filled in points indicate statistical significance at the 5% level. Net payouts are measured as total dividends plus totalshare repurchases minus total share issuance. Growth rates in log-differences; reported in percentage terms. Thesample period is 1985:1 – 2014:1. Source: Compustat and CRSP.
-.6
-.4
-.2
0
.2
.4
.6
Boo
k Le
vera
ge G
row
th
-8 -4 0 4 8Net Payouts
Dealers and Banks
-.6
-.4
-.2
0
.2
.4
.6
Mar
ket L
ever
age
Gro
wth
-8 -4 0 4 8Net Payouts
Dealers and Banks
-.6
-.4
-.2
0
.2
.4
.6
Net
Pay
outs
-8 -4 0 4 8 Book Equity Growth
Dealers and Banks
-.6
-.4
-.2
0
.2
.4
.6
Net
Pay
outs
-8 -4 0 4 8 Market Equity Growth
Dealers and Banks
-.6
-.4
-.2
0
.2
.4
.6
Mar
ket/B
ook
Gro
wth
-8 -4 0 4 8 Book Leverage Growth
Dealers and Banks
-.6
-.4
-.2
0
.2
.4
.6
Mar
ket E
quity
Gro
wth
-8 -4 0 4 8 Book Leverage Growth
Dealers and Banks
33
Figu
re9.
Impu
lse
Res
pons
eFu
nctio
nsfr
omth
ePa
nelV
ecto
rAut
oreg
ress
ion
Est
imat
edim
puls
ere
spon
sefu
nctio
ns(i
nbl
ue)f
rom
apa
nelv
ecto
raut
oreg
ress
ion
(VA
R)a
ndth
e5%
confi
denc
eba
nds
fora
one
stan
dard
devi
atio
nsh
ock.
Impu
lses
resp
onse
sre
port
edin
perc
enta
gedi
ffer
ence
sre
lativ
eto
the
base
line.
Ret
urn
vola
tility
,mar
ket-
to-b
ook,
book
equi
tyan
dbo
okle
vera
gear
eal
lin
quar
terl
ylo
ggr
owth
term
s;pa
yout
isne
tpay
outn
orm
aliz
edby
asse
ts.S
hock
sar
eor
dere
dac
cord
ing
toth
eor
dero
fcol
umns
inth
efig
ure.
The
sam
ple
peri
odis
1985
:1–
2014
:1.S
ourc
e:C
ompu
stat
and
CR
SP.
0.002.004.006.008.00Market-to-Book
04
812
1620
24
Mar
ket-t
o-Bo
ok s
hock
-0.500.000.50
04
812
1620
24
Book
Equ
ity s
hock
-0.100.000.100.200.30
04
812
1620
24
Book
Lev
erag
e sh
ock
-0.40-0.200.000.200.400.60
04
812
1620
24
Net
Pay
outs
sho
ck
-1.50-1.00-0.500.00Book Equity
04
812
1620
24
Mar
ket-t
o-Bo
ok s
hock
0.001.002.003.004.00
04
812
1620
24
Book
Equ
ity s
hock
-0.100.000.100.200.30
04
812
1620
24
Book
Lev
erag
e sh
ock
-0.30-0.20-0.100.00
04
812
1620
24
Net
Pay
outs
sho
ck
0.000.501.001.50Book Leverage
04
812
1620
24
Mar
ket-t
o-Bo
ok s
hock
-2.50-2.00-1.50-1.00-0.500.00
04
812
1620
24
Book
Equ
ity s
hock
0.000.501.001.502.002.50
04
812
1620
24
Book
Lev
erag
e sh
ock
0.000.100.200.300.40
04
812
1620
24
Net
Pay
outs
sho
ck
0.000.020.040.060.080.10Net Payouts
04
812
1620
24
Mar
ket-t
o-Bo
ok s
hock
-0.10-0.050.000.05
04
812
1620
24
Book
Equ
ity s
hock
-0.04-0.020.000.020.04
04
812
1620
24
Book
Lev
erag
e sh
ock
0.000.501.001.500
48
1216
2024
Net
Pay
outs
sho
ck
34
Figure 10. Net Payout over Time
Deviations from a Hodrick-Prescott filtered trend and returns reported in percentage terms. The sample period is1985:1 – 2014:1. Source: Compustat and CRSP.