On the Tradeoff Between Blocking and Dropping Probabilities in CDMA Networks Supporting Elastic Services G´ abor Fodor 1 , Mikl´ os Telek 2 , and Leonardo Badia 3 1 Ericsson Research, SE-164 80 Stockholm, Sweden [email protected]2 Budapest University of Technology and Economics, H-1111 Budapest, Hungary [email protected]3 Consorzio Ferrara Ricerche, 44100 Ferrara, Italy [email protected]Abstract. This paper is a sequel of previous work, in which we proposed a model and computational technique to calculate the Erlang capacity of a single CDMA cell that supports elastic services. The present paper extends that base model by taking into account two important features of CDMA. First, we capture the impact of soft blocking by modeling the neighbor cell interference as a lognor- mally distributed random variable. Secondly, we model the impact of the outage by taking into account that in-progress sessions can be dropped with a probabil- ity that depends on the current load in the system. We then consider a system with elastic and rigid service classes and analyze the trade-off between the total (soft and hard) blocking probabilities on the one hand and the throughput and the session drop probabilities on the other. 1 Introduction The teletraffic behavior of code division multiple access (CDMA) networks has been the topic of research ever since CDMA started to gain popularity for military and com- mercial applications, see for instance Chapter 6 of [1] (and the references therein) that are concerned with the Erlang capacity of CDMA networks. The paper by Evans and Everitt used an M/G/∞ queue model to assess the uplink capacity of CDMA cellular networks and also presented a technique to calculate the outage probability [2]. These classical papers have focused on ”rigid” traffic in the sense that elastic or best effort traffic whose bit rate can dynamically change was not part of the models. Subsequently, the seminal paper by Altman proposed a Shannon like capacity measure called the ”best effort capacity” that explicitly takes into account the behavior of elastic sessions [3]. The importance of modeling outages and session drops and their impacts on the Er- lang capacity in cellular networks in general and in CDMA in particular has been em- phasized by several authors, see for instance [2] and more recently [7]. Session drops are primarily caused by outages, when the desired signal-to-noise ratio for a session stays under a predefined threshold during such a long time that the session gets inter- rupted. However, sessions can be dropped by a load control algorithm (typically lo- cated in the radio network controller in WCDMA) to preserve system stability. Session F. Boavida et al. (Eds.): NETWORKING 2006, LNCS 3976, pp. 954–965, 2006. c IFIP International Federation for Information Processing 2006
Transcript
On the Tradeoff Between Blocking and DroppingProbabilities in CDMA Networks Supporting Elastic
Abstract. This paper is a sequel of previous work, in which we proposed amodel and computational technique to calculate the Erlang capacity of a singleCDMA cell that supports elastic services. The present paper extends that basemodel by taking into account two important features of CDMA. First, we capturethe impact of soft blocking by modeling the neighbor cell interference as a lognor-mally distributed random variable. Secondly, we model the impact of the outageby taking into account that in-progress sessions can be dropped with a probabil-ity that depends on the current load in the system. We then consider a systemwith elastic and rigid service classes and analyze the trade-off between the total(soft and hard) blocking probabilities on the one hand and the throughput and thesession drop probabilities on the other.
1 Introduction
The teletraffic behavior of code division multiple access (CDMA) networks has beenthe topic of research ever since CDMA started to gain popularity for military and com-mercial applications, see for instance Chapter 6 of [1] (and the references therein) thatare concerned with the Erlang capacity of CDMA networks. The paper by Evans andEveritt used an M/G/∞ queue model to assess the uplink capacity of CDMA cellularnetworks and also presented a technique to calculate the outage probability [2]. Theseclassical papers have focused on ”rigid” traffic in the sense that elastic or best efforttraffic whose bit rate can dynamically change was not part of the models. Subsequently,the seminal paper by Altman proposed a Shannon like capacity measure called the ”besteffort capacity” that explicitly takes into account the behavior of elastic sessions [3].
The importance of modeling outages and session drops and their impacts on the Er-lang capacity in cellular networks in general and in CDMA in particular has been em-phasized by several authors, see for instance [2] and more recently [7]. Session dropsare primarily caused by outages, when the desired signal-to-noise ratio for a sessionstays under a predefined threshold during such a long time that the session gets inter-rupted. However, sessions can be dropped by a load control algorithm (typically lo-cated in the radio network controller in WCDMA) to preserve system stability. Session
On the Tradeoff Between Blocking and Dropping Probabilities 955
interruptions are perceived negatively by end users - more negatively than blocking asession - and therefore their probability should be minimized by suitable resource man-agement (including admission control) techniques.
The purpose of this paper is to develop a model that can be used to analyze thetrade-off between the blocking and dropping probabilities in CDMA in the presenceof elastic traffic. We build on the model developed for elastic traffic in previous work[4] and extend it with allowing for a state dependent soft blocking and capturing thefact that sessions are sometimes dropped. The main assumption that we make is thatthe session drop probability is connected to the load of the system. When the load ishigh, the interference from neighbor cells leads to outages with a higher probabilitythan when it is low. For elastic sessions, fast rate and power control attempts to reducethe transmission rates and the required received power at the base station, as long as thetransmission rates stay above the session specific so called guaranteed bit rate (GBR).Therefore, it seems intuitively clear that there is a trade-off between how conservativethe admission control algorithm is (on the one hand) and what is the average bit rateof elastic sessions and what session drop probabilities users experience (on the otherhand). The contribution of the paper is to propose a model that can be used for theanalysis of this trade-off.
2 Revisiting CDMA Uplink Equations and State Space Structure
The basic CDMA uplink equations that serve as a starting point for this paper are de-scribed in details in [3] and [4]. In this section we summarize these results and refer tothese references for the derivation of them.
2.1 Revisiting the Basic CDMA Equations
We consider a single CDMA cell at which sessions belonging to one of I service classesarrive according to a Poisson arrival process of intensity λi (i = 1, . . . , I). Each class ischaracterized by a peak bit-rate requirement Ri and an exponentially distributed nomi-nal holding time with parameter μi. When sending with the peak rate for a session, therequired target ratio of the received power from the mobile terminal to the total inter-ference energy at the base station is given by Δi = RiEi
WN0. Here Ei/N0 is the class-wise
signal energy per bit divided by the noise spectral density that is required to meet apredefined QoS (e.g. bit error rate, BER) and W/Ri is the CDMA processing gain.
Let ni be the number of ongoing sessions of class i. We will refer to vector n = {ni}as the state of the system. We now assume that arriving sessions are blocked by asuitable admission control algorithm that prevents the system from reaching the state inwhich the power that should be received at the base station would go to infinity. In otherwords, a suitable admission control algorithm must prevent the system to reach its polecapacity (as defined by Equation (8.10) of [8] and (5) of [3]).
The power Pi that is received at the base station from the mobile terminal for sessioni must fulfill (see [4]):
Pi =(
PN +PN · Ψ1 − Ψ
)· Δi =
PN · Δi
1 − Ψ; Ψ � Ψ(n) =
I∑�=1
n� · Δ�; Δi � Δi
1 + Δi
(1)
956 G. Fodor, M. Telek, and L. Badia
Table 1. Model (Input) Parameters
I Number of service classesRi Peak bit rate associated with class-i sessionsλi Arrival intensity of sessions belonging to class-i
1/μi Mean (nominal) holding time of sessions belonging to class-iai Maximum slow down (using the terminology of [3]) of Ri
ϕ Parameter of the other cell (sector) interference (see Equation (4))Ei/N0 Normalized signal energy per bit requirement of class-i
In practice, Ψ is defined such that the noise rise in the system stays under some prede-fined threshold, typically less than 7dB. In the single class case it means that the numberof admitted sessions must fulfill: n1 < �Ψ/Δ1�.
2.2 The Impact of Slow Down
Recall that the required target ratio (Δi) depends on the required bit-rate. Explicit ratecontrolled elastic services tolerate a certain slow down of their peak bit-rate (Ri) as longas the actual instantaneous bit rate remains greater than Ri/ai. When the bit rate of aclass-i session is slowed down to Ri/ai, (0 < ai ≤ ai) its required Δai value becomes:
Δai =Δi
ai + Δi
=Δi
ai · (1 − Δi) + Δi, i = 1, . . . , I, (2)
which increases the number of sessions that can be admitted into the system, since nowΨa must be kept below Ψ , where Ψa =
∑Ii=1 ni · Δai .
We use the notation Δmin,i = Δai to denote the class-wise minimum target ratios(can be seen as the minimum resource requirement), that is when the session bit-ratesof class-i are slowed down to the minimum value (GBR) associated with that class.The smallest of these Δmin,i values Δ = mini Δmin,i can be thought of as the finest”granularity” with which the overall CDMA resource is partitioned between competingsessions.
2.3 Determining the System State Space
The maximum number of sessions from each class can is given by ni = �(Δmin,i)−1�.Then, recall that in each n state of the system, the inequality
∑i ni ·Δai < Ψ must hold.
The states that satisfy this inequality are the feasible states and constitute the state spaceof the system (Θ). The feasible states, in which the acceptance of an additional class-isession would result in a state outside of the state space are the class-i blocking states.The set of the class-i blocking states is denoted by Θi. Due to the ”Poisson Arrivals SeeTime Averages” (PASTA) property, the sum of the class-i blocking state probabilitiesgives the (overall) class-i blocking probability. In each feasible state, it is the task ofthe bandwidth sharing policy to determine the Δai(n) class-wise target ratios for eachclass. The Δai(n):s reflect the fairness criterion that is implemented in the resource
On the Tradeoff Between Blocking and Dropping Probabilities 957
sharing policy mentioned above. From these, the class-wise slow down factors and theinstantaneous bit-rates of the individual sessions can be calculated as follows:
ai(n) =Δi · (1 − Δai(n))Δai(n) · (1 − Δi)
; Rai(n) = Ri/ai(n) (3)
For ease of presentation, in the rest of the paper we will not indicate the dependence ofai, Δai and Rai on the system state n.
3 Modeling Soft Blocking and Session Drop
3.1 Modeling the Interference from Neighbor Cells
The interference contribution from other cells is typically quite high (around 30-40%).This is taken into account as follows. We think of the CDMA system as one that hasa maximum of n = Ψ
Δ number of (virtual) channels. The neighbor cell interference ξis a random variable of log-normal distribution with the following mean and standarddeviation respectively :
α =ϕ
ϕ + 1· n and σ = α, (4)
where ϕ is factor characterizing the neighbor cell interference and is an input parameterof the model (Table 1).
The mean value of the interference α is equal to the average capacity loss in the celldue to the neighbor cell interference and σ is chosen to be equal to α as proposed by[6] and also adopted by [5]. (When ϕ = 0, the neighbor cell interference is ignored inthe model.)
Recall that we think of Ψ(n) as the used resource in state n. Then in a given staten let bΨ (n) denote the probability that the neighbor cell interference is greater than theavailable capacity in the current cell that is (Ψ − Ψ ):
where D(x) is the cumulative distribution function of the log-normal distribution:
D(x) =12
(1 + erf
( ln(x) − N
S√
2
)); N = ln
(α2
√α2 + σ2
); S2 = ln
(1 +
σ2
α2
).
The impact of state dependent soft blocking resulted, e.g. by the neighbor cell inter-ference, can conveniently be taken into account by modifying the λi arrival rates ineach state by the (state dependent) so called passage factor: σi(n) = gi(1 − bΨ (n)) =gi(D(n−Ψ(n))). The passage factor is the probability that a class-i session is not blockedby the admission control algorithm when such a session arrives in system state n [5].
3.2 Modeling Session Drop
When the system is in state n, a class-i session leaves the system with intensity γi(n) ·μi
ai(n) , where γi(n) is the state dependent session drop factor. The session drop factor is
958 G. Fodor, M. Telek, and L. Badia
such that for all i: γi(n) |ni=0 = 1; and γi(n) |ni �=0 ≥ 1 . Furthermore, we can assumethat the drop probability for a given session does not depend on the instantaneous slowdown of that session. This is because whether a session gets out of coverage or whetherit gets dropped by the radio network does not depend on the slow down. The sessiondrop probabilities, however, depend on the actual level of the noise rise, because highernoise rise level at the base station makes decoding of signals more difficult. We will thusassume that the session drop factor is a function of the macro state only and is the samefor all classes : γi(x) = f(x) = f(Ψ) ∀i ∈ I . That is, we assume that the session dropprobability is determined by the load in the system and is equal for all service classes.
4 System Behavior
4.1 The Markovian Property and Determining the Generator Matrix
We now make use of the assumptions that the arrival processes are Poisson and the nom-inal holding times are exponentially distributed (see Subsection 2.1). The transitionsbetween states are due to an arrival or a departure of a session of class-i. The arrivalrates are given by the intensity of the Poisson arrival processes. Due to the memorylessproperty of the exponential distribution, the departure rates from each state depend onthe nominal holding time of the in-progress sessions and on the slow down factor in thatstate. Specifically, when the slow down factor of a session of class-i is ai(n), its depar-ture rate is γi(n)μi/ai(n). Thus, the system under these assumptions is a continuoustime Markov chain (CTMC) whose state is uniquely characterized by the state vector n.
4.2 Determining the Generator Matrix
For ease of presentation, but without losing generality, we use an example to illustratethe structure of the generator matrix. Assume that a1 = 1, a2 > 1 and a3 > 1. In thiscase, the task of the bandwidth sharing policy simplifies to determining Δa,2 and Δa,3for each state, from which a2 and a3 follows.
Based on the considerations of the preceding subsections, we see that the generatormatrix Q possesses a nice structure, because only transitions between ”neighboringstates” are allowed in the following sense. Let q(n1, n2, n3 → n′
1, n′2, n
′3) denote the
transition rate from state (n1, n2, n3) to state (n′1, n
′2, n
′3). Then the non-zero transition
rates between the feasible states are (taking into account the impact of the passagefactors and session drop factors):
The first three equations represent the state transitions due to session arrivals, whilethe second three equations represent the transitions due to session departures. Here we
On the Tradeoff Between Blocking and Dropping Probabilities 959
utilized the fact that Class-1 sessions cannot be slowed down, while Class-2 and Class-3sessions can be slowed a2 : 1 ≤ a2 ≤ a2, and a3 : 1 ≤ a3 ≤ a3 respectively.
4.3 Determining the Blocking Probabilities and Session Drop Probabilities
From the steady state analysis, the blocking and dropping probabilities directly follow.The hard blocking probabilities can be easily calculated, because we assume that thesessions from each class arrive according to a Poisson process: Phard,i =
∑n∈Θi
π(n).
The total blocking probabilities include the soft blocking probabilities in each stateand the hard blocking probabilities: Ptotal,i = 1 −
∑n∈Θ
π(n)σi(n). Finally, the class-
wise dropping probabilities can be calculated using the following observation. Since thedropping related departure rate from state n is (γi(n)−1) · niμi
ai(n) , the long-term fraction
of the dropped sessions must be proportional to γi(n)−1γi(n) · niμi
ai(n) . Weighing this quantitywith the stationary probability distribution of the system and normalizing yields:
Pdrop,i =
∑n∈Θ
π(n) · γi(n) − 1γi(n)
· niμi
ai(n)∑n∈Θ
π(n) · niμi
ai(n)
. (5)
In the next section we will show how this intuitively clear formula can be verified bydefining a trapping state in this system.
5 Solution Based on the Tagged Customer Approach
The calculation of the (mean and the distribution of the) time to completion of successfulsessions requires some additional effort. As we shall see, the method we follow here canalso be used to verify the dropping probability calculations as suggested by Equation (5).
5.1 Session Tagging and Modifying the State Space
In order to calculate the moments and the distribution of the holding time of successful(not dropped) sessions we modify the state space by introducing a trapping (absorbing)state and make the following considerations.
We will continue to think of an elastic session as one that brings with itself an expo-nentially distributed amount of work and, if admitted into the system, stays in the systemuntil this amount of work is completed or the session gets dropped. The method we fol-low here is based on (1) tagging an elastic session arriving to the system, which, at thetime of arrival is in one of the feasible states; and (2) carefully examining the possibletransitions from the moment this tagged call enters the system until it acquires the re-quired service or gets dropped and therefore leaves the system. Finally, un-conditioningon all possible entrance state probabilities, the distribution of the best effort service timecan be determined.
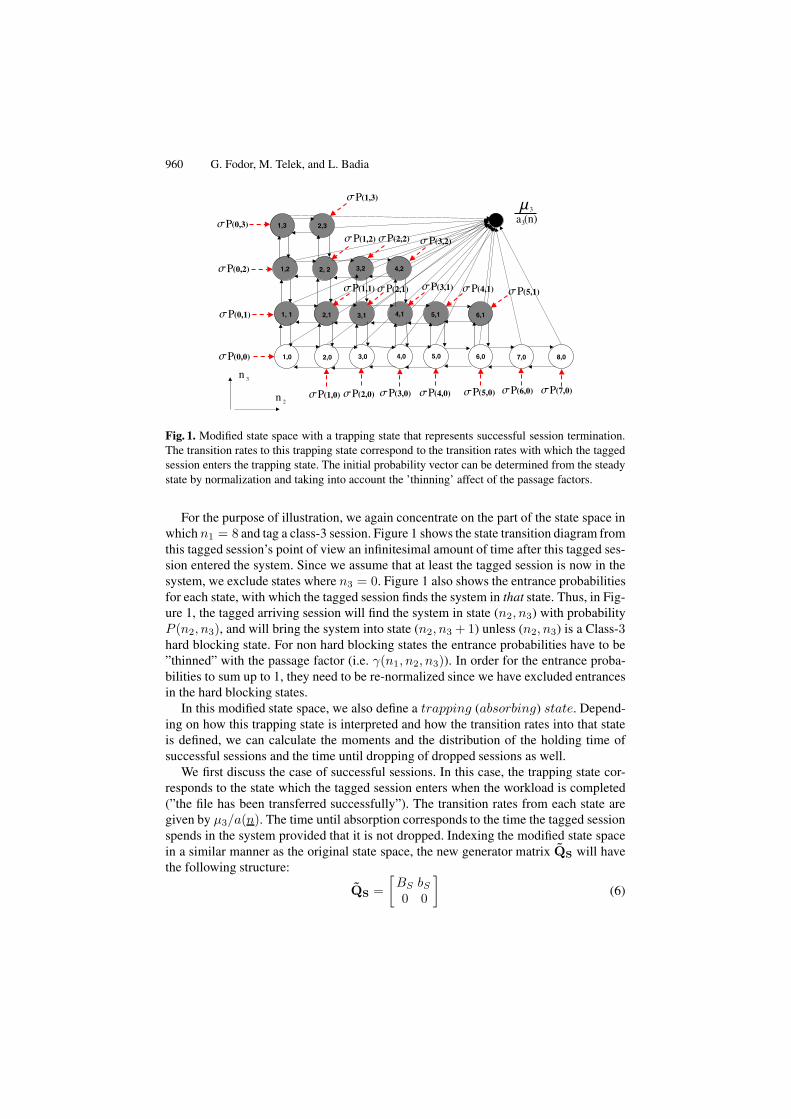
Fig. 1. Modified state space with a trapping state that represents successful session termination.The transition rates to this trapping state correspond to the transition rates with which the taggedsession enters the trapping state. The initial probability vector can be determined from the steadystate by normalization and taking into account the ’thinning’ affect of the passage factors.
For the purpose of illustration, we again concentrate on the part of the state space inwhich n1 = 8 and tag a class-3 session. Figure 1 shows the state transition diagram fromthis tagged session’s point of view an infinitesimal amount of time after this tagged ses-sion entered the system. Since we assume that at least the tagged session is now in thesystem, we exclude states where n3 = 0. Figure 1 also shows the entrance probabilitiesfor each state, with which the tagged session finds the system in that state. Thus, in Fig-ure 1, the tagged arriving session will find the system in state (n2, n3) with probabilityP (n2, n3), and will bring the system into state (n2, n3 + 1) unless (n2, n3) is a Class-3hard blocking state. For non hard blocking states the entrance probabilities have to be”thinned” with the passage factor (i.e. γ(n1, n2, n3)). In order for the entrance proba-bilities to sum up to 1, they need to be re-normalized since we have excluded entrancesin the hard blocking states.
In this modified state space, we also define a trapping (absorbing) state. Depend-ing on how this trapping state is interpreted and how the transition rates into that stateis defined, we can calculate the moments and the distribution of the holding time ofsuccessful sessions and the time until dropping of dropped sessions as well.
We first discuss the case of successful sessions. In this case, the trapping state cor-responds to the state which the tagged session enters when the workload is completed(”the file has been transferred successfully”). The transition rates from each state aregiven by μ3/a(n). The time until absorption corresponds to the time the tagged sessionspends in the system provided that it is not dropped. Indexing the modified state spacein a similar manner as the original state space, the new generator matrix QS will havethe following structure:
QS =[BS bS
0 0
](6)
On the Tradeoff Between Blocking and Dropping Probabilities 961
where the BS matrix represents the transitions between the non-trapping states, thebS vector contains the transitions to the trapping state, the 0 vector indicates that notransitions are allowed from the trapping state. When the trapping state represents thestate that the tagged session enters when it is dropped, the transition rates to the trappingstate are given by γ3(n)−1
a3(n) μ3 and the generator matrix takes the following form:
QD =[
BD bD
0 0
](7)
where the BD matrix represents the transitions between the non-trapping states, and thebD vector contains the transitions to the trapping state. Once the structure of the ex-panded state space and the associated transition rates together with the (thinned) initialprobability vector, PR(0), are determined, we can determine the rth moment of TS:
E[T rS ] = r! · P t
R(0) · (−BS)−r · e (8)
We note that the procedure to calculate the moments of TD is the same as that for TS ,except that we now have to make use of the BD matrix instead of BS . The distributionsof TS and TD are given by:
Pr{TS < x} = 1 − P tR(0) · exBS · e; Pr{TD < x} = 1 − P t
R(0) · exBD · e.
5.2 Verifying Equation (5): An Alternative Way to Calculate the DroppingProbabilities
The trapping state approach can also be used to determine the dropping probabilities,which can be used to verify results obtained from Equation (5). In order to do this, weconsider the modified state space with two trapping states illustrated in Figure 2. Fromeach state, the tagged class-i session can enter any of the two trapping states corre-sponding to the case when the tagged session successfully terminates or gets dropped.The generator matrix of this state space is given by:
Qi =
⎡⎣Bi bS,i bD,i
0 0 00 0 0
⎤⎦ (9)
where bdrop,i is the column vector containing the transition rates to the trapping staterepresenting the session drops. The Bi matrix has to be determined considering the totaltransition rates to the two trapping states.
The class-wise dropping probabilities can be calculated using Equation (10):
Pdrop,i = P tR(0) · (−Bi)−1 · bD,i, (10)
6 Numerical Results
6.1 Input Parameters
The input parameters for the two cases that we study are summarized by Table 2. In CaseI, Class-1 is a rigid class, whereas in Case II, Class-1 is elastic with a maximum slow
Fig. 2. Modified state space with two trapping states representing successfully terminated anddropped sessions respectively. Seen from the transient states, the total transition rates with whichthe tagged session enters either of these states is the sum of the two transition rates. This modifiedstate space can be used to determine the probabilities of success and drop.
down factor a1 = 3. In both cases we change the maximum slow down factor of Class-2a2 = 1 . . . 4. (a2 is changed along the x axis in each Figure.) The offered traffic is set to2.72 Erlang per each class and the required Δi value for sessions of each class is ≈ 0.15.The function γi(n) = f(n) is set such that it does not depend on the slow down factors,according to the discussion at the end of Section 3.2. Specifically, in this paper we choosethe following dropping factor: f(n) = 1 + νln(1 + n1 · Δ1 + n2 · Δ2), expressing thatthe dropping factor is a function of the total load in the system (see also Table 2).
6.2 Numerical Results
Blocking Probabilities. Figures 3-4 and Figures 5-6 show the impact of state depen-dent blocking on the total blocking probabilities. State dependent blocking implies thatthe admission control takes into account the instantaneous value of the noise rise at thebase station rather than just the state of the own cell. This increases the class-wise totalblocking probabilities from around 7% and 2% to 10% and 6% in Case I when a2 = 4.We also note that when both classes are rigid (Case I, a2 = 1), the total blocking valuesare high, but these high values are brought down to reasonably low blocking probabilityvalues when either one and especially when both classes tolerate slowing down of theinstantaneous transmission rates (Case II, a2 = 4).
Dropping Probabilities. Figures 7-8 and Figures 9-10 show the impact of soft block-ing on the session drop probabilities. First, we note that the session drop probabilitiesslightly (less than 2%) increase as traffic becomes more elastic. The reason is that thesystem utilization increases when traffic is elastic and the system operates in ”higherstates” with a higher probability than when traffic is rigid.
On the Tradeoff Between Blocking and Dropping Probabilities 963
Table 2. Model (Input) Parameters
I 2Ri 128 [kbps]λi 87.2613 [1/s]μi 32.03 [1/s]a1 1 (Case I); 3 (Case II)a2 1 . . . 4 (along the x axis)ϕ 0.25
Fig. 3. Case I, no soft blocking, blocking prob-abilities (total and hard blocking probabilitiesbeing equal)
1 1.5 2 2.5 3 3.5 4CLASS-2 SLOWDOWN
0
0.05
0.1
0.15
0.2H
AR
DêT
OT
AL
BLO
CK
ING
PR
OB
AB
ILIT
IES
TOTAL-2
TOTAL-1
HARD-2
HARD-1
Fig. 4. Case I, soft blocking, blocking probabil-ities
1 1.5 2 2.5 3 3.5 4CLASS-2 SLOWDOWN
0
0.01
0.02
0.03
0.04
0.05
0.06
HA
RD
êTO
TA
LB
LOC
KIN
GP
RO
BA
BIL
ITIE
S
TOTAL-2
TOTAL-1
HARD-2
HARD-1
Fig. 5. Case II, no soft blocking, blocking prob-abilities (total and hard blocking probabilitiesbeing equal)
1 1.5 2 2.5 3 3.5 4CLASS-2 SLOWDOWN
0
0.02
0.04
0.06
0.08
0.1
0.12
HA
RD
êTO
TA
LB
LOC
KIN
GP
RO
BA
BIL
ITIE
S
TOTAL-2
TOTAL-1
HARD-2
HARD-1
Fig. 6. Case II, soft blocking, blocking proba-bilities
We also see that state dependent blocking decreases the session drop probabilitiesin both cases (for example from around 7% to 5% in Case I when a2 = 4). This isbecause soft blocking entails that in average there are fewer sessions in the system thatdecreases session drops.
Mean Holding Time of the Successful (Not Dropped) Sessions. Figures 11-12 showthe mean holding times of successful sessions (normalized to the nominal expectedholding time, that is when the slow down factors are 1). In Case I, Class-1 sessions are
964 G. Fodor, M. Telek, and L. Badia
1 1.5 2 2.5 3 3.5 4CLASS-2 SLOWDOWN
0.064
0.066
0.068
0.07
0.072
CLA
SS-
1ê2
Ses
sion
Dro
pP
roba
bilit
y
CLASS-2
CLASS-1
Fig. 7. Case I, no soft blocking, session dropprobability
1 1.5 2 2.5 3 3.5 4CLASS-2 SLOWDOWN
0.042
0.044
0.046
0.048
CLA
SS-
1ê2
Ses
sion
Dro
pP
roba
bilit
y
CLASS-2
CLASS-1
Fig. 8. Case I, soft blocking, session drop prob-ability
1 1.5 2 2.5 3 3.5 4CLASS-2 SLOWDOWN
0.071
0.072
0.073
0.074
0.075
0.076
CLA
SS-
1ê2
Ses
sion
Dro
pP
roba
bilit
y
CLASS-2
CLASS-1
Fig. 9. Case II, no soft blocking, session dropprobabilities
1 1.5 2 2.5 3 3.5 4CLASS-2 SLOWDOWN
0.049
0.05
0.051
0.052C
LAS
S-
1ê2
Ses
sion
Dro
pP
roba
bilit
y
CLASS-2
CLASS-1
Fig. 10. Case II, soft blocking, session dropprobabilities
1 1.5 2 2.5 3 3.5 4CLASS-2 SLOWDOWN
1
1.05
1.1
1.15
1.2
1.25
1.3
CLA
SS-
1ê2
Suc
cess
fulS
essi
onM
ean
Tim
e
Class-2
Class-1
Fig. 11. Case II, no soft blocking, successfulsessions’ mean holding time
1 1.5 2 2.5 3 3.5 4CLASS-2 SLOWDOWN
1
1.05
1.1
1.15
1.2
CLA
SS-
1ê2
Suc
cess
fulS
essi
onM
ean
Tim
e
Class-2
Class-1
Fig. 12. Case II, soft blocking, successful ses-sions’ mean holding time
rigid and there is no increase in their mean holding times. In this case, Class-2 sessionsbenefit from soft blocking (keeping in mind that we are now only taking into accountthe sessions that are successful). Their holding time is somewhat lower in the case ofsoft blocking.
7 Conclusions
In this paper we have proposed a model to study and analyze the trade-off betweenthe blocking and dropping probabilities in CDMA systems that support elastic services.The model of this present paper captures the impact of state dependent blocking, whichis a consequence of the CDMA admission control procedure that takes into account
On the Tradeoff Between Blocking and Dropping Probabilities 965
the actual noise rise value at the base station (including the interference coming fromsurrounding cells) rather than just the state of the serving cell. Session drops happenwith a probability that increases with the overall system load.
As traffic becomes more elastic, the session drop probability increases, but this in-crease can be compensated for by a suitable admission control algorithm. Such statedependent admission control algorithms increase the blocking probabilities somewhat,but this increase can be mitigated if sessions tolerate some slow down of their sendingrates. Thus, the design of the CDMA admission control algorithm should take into ac-count the actual traffic mix in the system and the per-class blocking and session dropprobability targets.
An important consequence of the presence of elastic traffic is that the blocking prob-abilities decrease as the maximum slow down factors increase. This is a nice practicalconsequence of one of the key findings in [3], namely that the Erlang capacity increases.Another consequence of elasticity is that the dropping probabilities increase somewhat,but this increase is not significant (the exact value would depend on the model assump-tions, for instance the value of ν).
References
1. A. J. Viterbi, ”CDMA - Principles of Spread Spectrum Communication”, Addison-Wesley,ISBN 0-201-63374-4, 1995.
2. J. S. Evans and D. Everitt, ”On the Teletraffic Capacity of CDMA Cellular Networks”, IEEETrans. Vehicular Techn., Vol. 48, pp. 153-165, No. 1, January 1999.
3. E. Altman, ”Capacity of Multi-service Cellular Networks with Transmission-Rate Control: AQueueing Analysis”, ACM Mobicom ’02, Atlanta, GA, September 23-28, 2002.
4. G. Fodor and M. Telek, ”Performance Anlysis of the Uplink of a CDMA Cell SupportingElastic Services”, in the Proc. of IFIP Networking 2005, Waterloo, Canada, Springer LNCS3462, pp. 205-216, 2005.
5. V. B. Iversen, V. Benetis, N. T. Ha and S. Stepanov, ”Evaluation of Multi-service CDMANetworks with Soft Blocking”, Proc. ITC Specialist Seminar, pp. 223-227, Antwerp, Belgium,August/September 2004.
6. A. Mader and D. Staehle, ”An Analytic Approximation of the Uplink Capacity in a UMTSNetwork with Heterogenous Traffic”, 18th International Teletraffic Congress (ITC 18), Berlin,September 2003.
7. T. Bonald and A. Proutiere, ”Conservative Estimates of Blocking and Outage Probabilities inCDMA Networks” Performance 2005, Elsevier Science, June 2005.
8. H. Holma and A. Toskala, ”WCDMA for UMTS - Radio Access for Third Generation MobileCommunications”, Wiley, ISBN 0 471 72051 8, First Edition, 2000.
9. W. Ye and A. M. Haimovich, ”Outage Probability of Cellular CDMA Systems with SpaceDiversity, Rayleigh Fading and Power Control Error”, IEEE Communications Letters, Vol. 2,No. 8, pp. 220-222, August 1999.