Welcome to OnCommand Insight reporting ............................................. 8Variations due to installed licenses ............................................................................. 8
Which report answers your question? ......................................................................... 9
Reporting made easy .................................................................................. 14Opening the Reporting Portal .................................................................................... 14
Navigating to the pre-defined OnCommand Insight reports and dashboards ........... 15
Locating IBM Cognos documentation ...................................................................... 15
Running a report ........................................................................................................ 16
VM Paths report ............................................................................................ 63
Capacity and chargeback dashboards and reports ................................. 65Capacity and chargeback report dashboards ............................................................. 65
Accessing capacity and chargeback dashboards ........................................... 65
Plan - Capacity Forecast dashboard .............................................................. 66
Plan - Cost Accounting dashboard ................................................................ 67
Plan - Port Forecast dashboard ...................................................................... 68
Plan - Tiers dashboard ................................................................................... 69
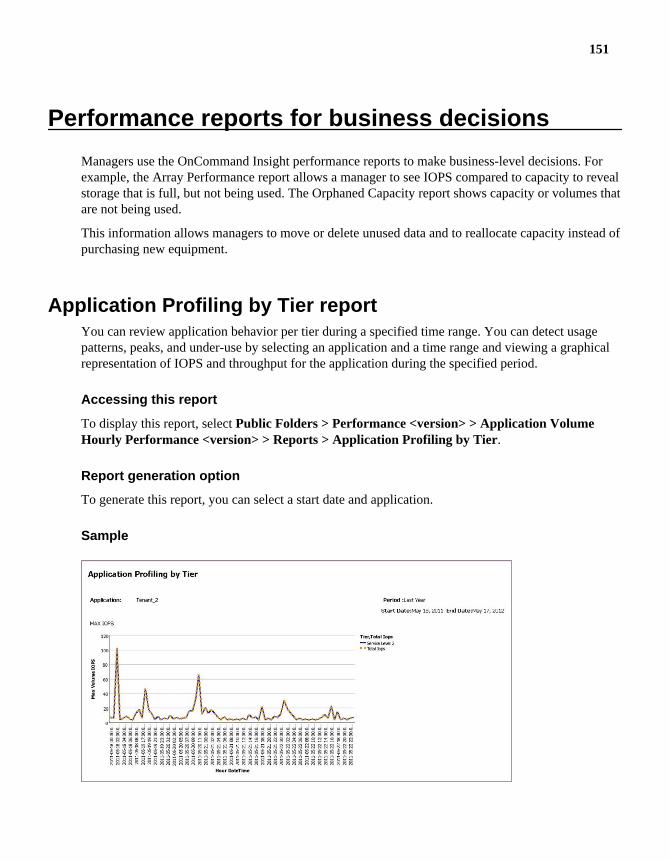
Performance reports for business decisions ........................................... 151Application Profiling by Tier report ........................................................................ 151
Copyright information ............................................................................. 160Trademark information ........................................................................... 161How to send your comments .................................................................... 162Index ........................................................................................................... 163
Table of Contents | 7
Welcome to OnCommand Insight reporting
The OnCommand Insight Reporting Connection is a business intelligence tool that enables you toview pre-defined reports or create your own custom reports. The OnCommand Insight ReportingConnection generates the reports from the Data Warehouse (DWH) data.
You can do the following with OnCommand Insight Reporting Connection reports:
• Run a report.• Customize the report format and delivery method.• Schedule reports to run.• Email reports.• Use colors to represent thresholds on data.• Access a collection of report results on a dashboard.• Add tabs to views to show a dashboard collection of report results.
The pre-defined Inventory reports are the standard OnCommand Insight reports. Additional pre-defined reports are provided with the Assure, Perform, and Plan licenses. This guide describes onlythe pre-defined reports available with all of the product licenses.
Note: The OnCommand Insight data can be viewed in any standard browser. However, the reportgeneration engine requires the Microsoft Windows Internet Explorer (IE) browser. Reports cannotbe dependably generated when using other web browsers.
Variations due to installed licensesData in the OnCommand Insight reports is based upon the OnCommand Insight licenses that youhave purchased. For example, if you do not have OnCommand Insight Plan installed, then you willnot receive any data in the capacity reports.
You might see differences between the available reports in your OnCommand Insight windowscompared to the illustrations in the documentation. These variations are due to differences betweenthe installed licenses on your system and the licenses on the system used to create the illustrations.
8 | OnCommand Insight Reporting Guide
Which report answers your question?The following table lists some of the OnCommand Insight pre-defined reports that answer commonquestions.
Question Report Locating the report
What are the paths from thishost to its storage devices?
• Available FCPaths report
• Available NFSPaths report
Public Folders > Inventory <version> >Reports
Where can I get an overview ofstorage utilization by host?
Host Capacity report Public Folders > Inventory <version> >Dashboards
How do I determine where acertain device is connected andfind free switch ports?
Host to SwitchConnectivity report
Public Folders > Inventory <version> >Dashboards
What is my storage utilizationby host per storage device?
Host Usage report Public Folders > Inventory <version> >Reports
Do I have any unmaskedvolumes that can be seen byany host?
Mapped But NotMasked Volumesreport
Public Folders > Inventory <version> >Reports
What are the file size quotaslimits set on each qtree?
Qtree report Public Folders > Inventory <version> >Reports
Where can I find a list all of thevirtual machine IPs and theirhosts?
Virtual Machinesreport
Public Folders > Inventory <version> >Dashboards > Host Reports
What are the SAN pathviolations we have for eachviolation type?
SAN Path Violationsreport
Public Folders > Inventory <version> >Dashboards > SAN Path ViolationReports
Public Folders > Performance<version> > Volume Daily Performance<version> > Reports
Where can I find a forecast forfuture storage consumptionbased on past trends?
Storage CapacityTrend report
Public Folders > Capacity <version> >Storage Capacity <version> >Dashboards
Welcome to OnCommand Insight reporting | 9
Question Report Locating the report
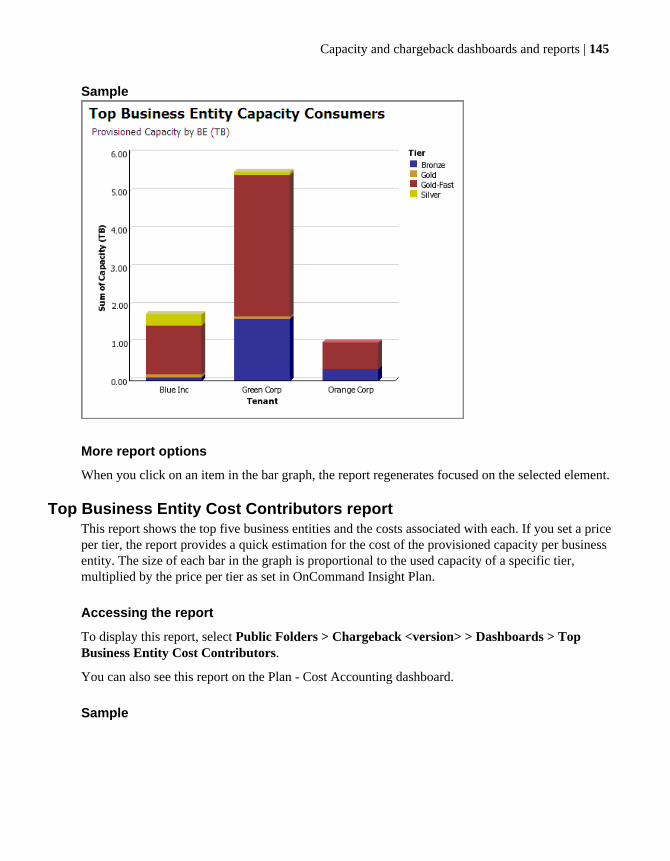
Which business entities are thetop capacity consumers?
Top Business EntityCapacity Consumersreport
Public Folders > Chargeback <version>> Dashboards
Related concepts
Inventory dashboards and reports on page 26
Capacity and chargeback dashboards and reports on page 65
Performance reports for business decisions on page 151
Locating pre-defined reportsThe pre-defined OnCommand Insight reports can be accessed from different locations in theOnCommand Insight Reporting Portal.
One report may be part of a dashboard and can also be generated from a list of individual reports. Infact, there can be several locations in the portal for any one report. The multiple access points forreports are a result of OnCommand Insight customer requests for report groupings to help them withdifferent types of analysis.
This guide lists the shortest paths to locate the individual reports. For example, you can locate theRisk Index for Over Provisioned Storage Pools report in two different folders:
However, the documentation lists only the shorter path to help you to find the report quickly. If anindividual report is generated on a dashboard, that information is also provided.
As you use the reports, you can group favorite dashboards and reports together into your own folderin the portal.
Related tasks
Navigating to the pre-defined OnCommand Insight reports and dashboards on page 15
Accessing dashboards and creating a dashboard tab on page 21
Where to find more information about OnCommand InsightYou can find more information about OnCommand Insight on the NetApp web site and in otherOnCommand Insight documentation.
10 | OnCommand Insight Reporting Guide
OnCommand Insight on the webFor comprehensive, up-to-date information about OnCommand Insight, use these NetApp web siteresources.
• OnCommand Insight product web site atwww.netapp.com/oncommandinsight
• The NetApp Support Site at: support.netapp.com• The OnCommand Insight data source Interoperability Matrix at support.netapp.com/NOW/
products/interoperability.
Videos for OnCommand InsightYou can access how-to videos that show you how to perform some actions in OnCommand Insight.The videos are located on the OnCommand Insight Customer Community, a forum for customers.
Many individual topics in the OnCommand Insight documentation include links to specific videos.
Note: To see OnCommand Insight videos, use your web browser to access the CustomerCommunity at the following link:
You need a user name and password for some features of this community. To obtain them, clickthe Join Now link.
The following video topics and more are included in the Community:
• How to tell OnCommand Insight about your tiering• How to identify over utilized disks in OnCommand Insight• How to view orphaned storage• How to set thresholds for storage efficiency• How to identify candidates for tiering• How to identify candidates for host virtualization• How to group violations• How to set business entity annotations
OnCommand Insight product documentationThe OnCommand Insight products are accompanied by a set of guides.
You can access the following documents from the NetApp Support Site at support.netapp.com/documentation/productsatoz/index.html.
OnCommand InsightGetting Started Guide
Helps new OnCommand Insight users set up and customize their installedsystem and begin using it for improved efficiency.
Provides an overview of suite architecture with instructions to get thesystem up and running, discover the logical and physical storage resourcesin your storage environment, and perform administrative tasks.
Describes the configuration parameters and some installation proceduresfor data sources used by OnCommand Insight. Provides recommendedmethods of discovering your storage environment for the OnCommandInsight deployment.
OnCommand InsightInventory User Guide
Provides information about the tools and features to help you gain visibilityinto your SAN or NAS inventory environment. The Inventory features arethe foundation used by all other products in the OnCommand Insight suite.After looking at the OnCommand Insight Getting Started Guide, use thisguide to learn about basic features common across all OnCommand Insightmodules.
OnCommand InsightAssurance UserGuide
Provides an overview of how to use OnCommand Insight to analyze andvalidate your storage network environment and to automate operationalmonitoring, as well as procedures for making safe changes withoutdisrupting availability.
OnCommand InsightPerformance UserGuide
Provides an overview of how to use OnCommand Insight to reclaim under-utilized resources, manage tiers, identify multipath risks, and troubleshootongoing performance bottlenecks.
OnCommand InsightPlanning User Guide
Provides an overview of how to use OnCommand Insight to enableeducated capacity management decisions by managing the end-to-endresource order and allocation process.
Describes how system administrators can communicate storage capacityrequirements to SAN managers using OnCommand Insight ConnectApplications web access instead of the full OnCommand Insight featureset.
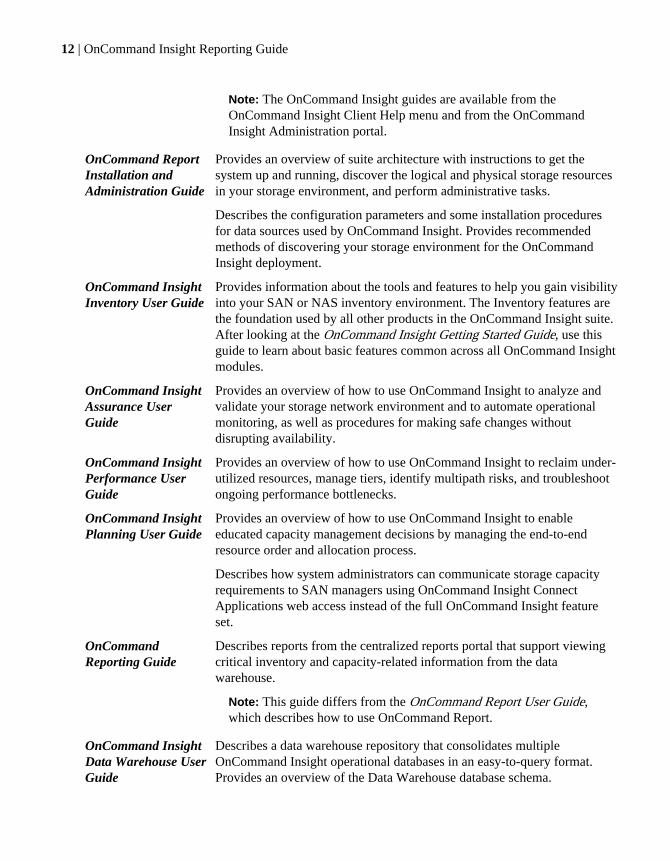
OnCommandReporting Guide
Describes reports from the centralized reports portal that support viewingcritical inventory and capacity-related information from the datawarehouse.
Note: This guide differs from the OnCommand Report User Guide,which describes how to use OnCommand Report.
OnCommand InsightData Warehouse UserGuide
Describes a data warehouse repository that consolidates multipleOnCommand Insight operational databases in an easy-to-query format.Provides an overview of the Data Warehouse database schema.
12 | OnCommand Insight Reporting Guide
Describes the metadata model upon which OnCommand Insight reports arebased.
OnCommand InsightConnect APIReference
Provides an overview of how to use the API interface to enable integrationwith other applications, such as reporting and monitoring systems. Helpscustomers and Independent Software Vendors (ISVs) to developapplications on top of the OnCommand Insight repository and engine.
Welcome to OnCommand Insight reporting | 13
Reporting made easy
You can generate pre-defined reports from the OnCommand Insight Reporting Portal, email them toother users, and even modify them. Several reports enable you to filter by device, business entity, ortier. The reporting tools use IBM Cognos as a foundation and give you many data presentationoptions.
• The OnCommand Insight pre-defined reports show your inventory, storage capacity, chargeback,performance, and storage efficiency data. You can modify the pre-defined reports and save yourmodifications.
• You can create custom reports using the OnCommand Insight Reporting Portal tools: BusinessInsight and Business Insight Advanced.
• OnCommand Insight provides quick access to report data through dashboards. Additionally, youcan group your own report selections and using the Business Insight tools, you can display themin your own dashboards.
The report data available to you is controlled by several things, including the following:
• Login access to the OnCommand Insight Reporting Portal, which is defined by roles.• The setup of the OnCommand Insight Data Warehouse, which stores the data for the reports.
For additional instructions about how to use the IBM Cognos features, see the Cognos online Help.
Related tasks
Locating IBM Cognos documentation on page 15
Opening the Reporting PortalYou can access the OnCommand Insight Reporting Portal directly from a web browser or from DataWarehouse. Use the portal to access the pre-defined reports in the Query Studio or Report Studio(where you can create your own reports using Data Warehouse data). IBM Cognos software is usedto create and generate the pre-defined reports.
About this task
This procedure describes how to access the portal from the Data Warehouse.
Steps
1. Open a web browser.
2. Enter the following URL:
http://<host-name>/dwh
14 | OnCommand Insight Reporting Guide
3. Enter your username and password and click OK.
4. In the Data Warehouse main menu, select Reporting Portal.
5. Another browser page appears where you must log in. Enter your username and password andclick OK.
If data has not yet been retrieved from OnCommand Insight, some options might not appear.
6. In the NetApp OnCommand Insight Reporting view, click "NetApp OnCommand InsightReporting Content."
The portal lists the public folders in which the individual packages are listed.
Navigating to the pre-defined OnCommand Insight reportsand dashboards
When you open the Reporting Portal, the Public Folders tab is the starting point for you to select thetype of information you need in the reports and dashboards.
Steps
1. Click the Public Folders link and select the information category that you want to use.
2. In the information category, you can select dashboards, folders, and individual reports.
For example, the Capacity > Storage Capacity information category has Dashboards and Reportslinks as well as custom folders for your own reports and dashboards.
3. Click Dashboards or Reports to navigate to specific OnCommand Insight reports.
Related concepts
Locating pre-defined reports on page 10
Locating IBM Cognos documentationFor basic information such as how to start and stop the Reporting portal software, see the IBMCognos documentation installed with the product. You can search in a web browser for informationabout any of the IBM Cognos reporting products, such as Query Studio, Report Studio, Business
Reporting made easy | 15
Insight, or Business Insight Advanced on the IBM website in the Information Centers for thosesoftware products.
Steps
1. To locate the IBM Cognos documentation installed with OnCommand Insight, navigate to thisdirectory.
For 32-bit installations: <install_dir>\cognos\c10\webcontent\documentation\help_docs.html
For 64-bit installations: <install_dir>\cognos\c10_64\webcontent\documentation\help_docs.html
2. You can also display topics describing individual IBM Cognos windows used in the OnCommandInsight Reporting Portal. Click the ? icon on the window toolbar.
Running a reportYou can quickly run the pre-defined reports from the OnCommand Insight Reporting Portal. Somereports might require you to select parameters that filter the data to be displayed in the generatedreport.
Steps
1. Select the folder containing the types of reports you want.
2. Click the report link to generate the report or to open the parameter filtering page for that report.
3. If the report has a parameters page, select the report parameters you want to use to filter the datadisplayed.
In many reports, you can leave the parameter selections untouched to select all of the possibletypes.
4. Click Finish to generate the report.
16 | OnCommand Insight Reporting Guide
Managing reports
For each report, you can select the More link in the Actions column and access all of the reportoperations, such as setting report properties, scheduling reports, or emailing reports. Administratorshave more management options available than other users.
Note: To see a video describing the report management features, click this link to start the videoon the NetApp Community site: Report Formatting and Scheduling video.
Administrators can set permissions for other report users according to their OnCommand Insightroles.
Related tasks
Customizing a report's output format and delivery on page 18
Setting report propertiesYou can set properties, such as entering your own screen tip, setting permissions, and running historysaved on individual reports.
Steps
1. From the OnCommand Insight Reporting Portal, identify the report.
2. Click the More link for that report and then click Set properties.
For detailed information about each of these properties, click the Help link.
3. If you select the Disable this entry option, the report is no longer visible in the portal.
If you select the Hide this entry, it removes it from your view of the portal, but it does not affectother users' access to the report.
4. To select a specific package for this report, click Link to a package.
This takes you into the Public Folders directory, where all packages are listed. You can select apackage and link it to the report.
Customizing a report's output format and deliveryYou can customize the format and delivery method of a pre-defined OnCommand Insight report.
Steps
1. Log into the OnCommand Insight Data Warehouse.
2. Open the OnCommand Insight Reporting Portal and select the report you want to customize.
3. To the right of the report name are several Actions icons and a More link. Click the Run withoptions triangle icon to open the output format options for this report.
4. Set these options:
• Format as HTML, PDF, Excel 2007, Excel 2003, Delimited Text (CSV), or XML• Accessibility check to enable accessibility support for this report• Language select from the list of available languages. The default is English (United States).• Delivery select to view the report, save it, or print the report on a selected printer• Prompt values check to prompt for values
5. Click Run to produce the report using the selections.
18 | OnCommand Insight Reporting Guide
Scheduling reportsYou can set up the report to run at a recurring date and time and set its runtime priority. You can runit using the default values or specify the options, and you can disable the schedule without losing anyof its details.
Steps
1. From the OnCommand Insight Reporting Portal, select the report.
2. Click the More link and then click New schedule.
3. Enter the schedule parameters for the report.
For more information about these selections, click the Help link.
4. Click OK.
Setting up email notification in Reporting ConnectionSetting up email notification in OnCommand Insight Reporting Portal is required to send out reportsfrom Query Studio or Reports Studio via email.
Steps
1. From the Windows Start menu, select All Programs > IBM Cognos <version> > IBM Cognosconfiguration.
Note: For 64-bit installations, the version does not appear in the selections.
2. Under the explorer column at the end, select Notification.
3. On the right side of the Notification screen, enter the following information:
• SMTP mail server: Enter the server name registered in DNS or SMTP server IP, for example,10.10.10.10:25
• Account and password needed to log into the mail server• Default sender: Enter the email account that was added to the generated emails as the sender,
5. In the Cognos Configuration window, right-click on Local Configuration and select Restart torestart the Cognos service.
You could also select Actions > Restart or Start if the server is not running.
6. Test the email server setting by doing the following:
Managing reports | 19
a) From the Windows Start menu, select All Programs > IBM Cognos <version> > IBMCognos configuration.
b) Right-click on Notification and select Test.
Creating your own reportsYou can use one of the report design tools to create your own reports using OnCommand Insightdata. All of the report development tools are available from the Launch link on the far right of theOnCommand Insight Reporting Portal.
You can use the Business Insight and Business Insight Advanced tools to create your customizedreports.
Note: To see a video of how to use Business Insight Advanced to create a report, click this link tostart the video on the NetApp Community site: Creating an Adhoc Report video.
For detailed information about using the data marts and report creation tools, see the OnCommandInsight Data Warehouse User Guide.
OnCommand Insight provides report groupings in the form of dynamic dashboards to show differentviews of data relating to a specific management concern. Clicking elements in the dashboardsdisplays more detailed information.
About this task
The dashboards group information on a subject of interest and provide these dynamic features:
• Click on chart elements to regenerate charts showing more details for the selected items.• Links to other reports and more detailed information.
If you have a favorite dashboard, you can add a tab for it using one of these methods:
• Add the dashboard tab from the public folders.• Add the dashboard tab from User Preferences.
Related tasks
Using dashboards to survey information and display details on page 23
Accessing dashboards and creating a dashboard tabYou might want to display a dashboard group of reports in a tab for easy access. You can add the tabfrom the public folders list.
Steps
1. Open the OnCommand Insight Reporting Portal.
2. In the Public Folders list, open the package, for example, Inventory <version>.
3. Click the Dashboards link.
21
Individual reports and dashboards are listed together in the folder. The dashboard names have this
icon beside their names.
Within the package, several options appear, including Dashboards and Reports.
4. For quick access to a dashboard in the future, you can create a separate tab for it: to the right ofthe dashboard, click the More link.
5. In the list that opens, click the Add to my portal tabs link.
The new tab then displays at the top of the window with the selected dashboard as the tab label.
Adding a dashboard from User PreferencesYou might want to display a dashboard group of reports in a tab for easy access. You can add the tabfrom User Preferences.
Steps
1. Open the OnCommand Insight Reporting Connection.
2. At the upper right, click the Person icon to show a drop-down menu.
22 | OnCommand Insight Reporting Guide
3. Select My Preferences.
4. In the Set preferences view, click the Portal Tabs tab.
5. In the Portal Tabs tab, click the Add link.
6. In the Public Folders and Dashboard folder, locate the dashboard that you want as a tab and checkit.
7. Click the arrow to move it to the Selected Entries box, and click OK.
Using dashboards to survey information and display detailsYou can access report data through individual reports or by viewing that data in a group of reportresults on a dashboard.
Steps
1. To display dashboards, open the OnCommand Insight Reporting Portal.
2. Select Public Folders and one of the report categories.
3. Select Dashboards.
The list that opens may contain reports, folders, and dashboards.
4.To open a dashboard, select an item in the list with the dashboard icon beside it.
The dashboard might display immediately or require you to identify environment elements for thereports and submit your selections.
Managing dashboards | 23
5. In the dashboard, click items in graphs to open more detailed versions of the reports for thosespecific items.
In this example, you might want to know more about the Gold-Fast tier, so you would clickportions of the graphs that depict that tier.
6. To display more information about data in report lists, click the links.
In the example, the Business Entity Accountability report in the Plan-Cost Accounting dashboardcontains linked information.
7. At the bottom of most dashboards is a list of report links. Click any of these links to generateadditional reports.
Related concepts
Inventory reporting dashboards on page 26
Capacity and chargeback report dashboards on page 65
24 | OnCommand Insight Reporting Guide
Related tasks
Managing dashboards on page 21
Managing dashboards | 25
Inventory dashboards and reports
The OnCommand Insight provides dashboards and reports that display inventory information.
The Inventory dashboards and reports supply information in these categories:
• Available FC and NFS paths• Connected ports• Data sources• Device inventory• Fabric summary• Glossary• Host data• Internal volumes• Mapped but not masked volumes• Qtree information• SAN path violation information• Switch connectivity
Inventory reporting dashboardsThe Inventory dashboards summarize inventory data with groups of reports displayed together. Youcan use the links in the dashboard reports to display more detailed information on items of interest.
The inventory dashboards provide this information:
• By Host provides a filter to select hosts to examine host capacity, paths, and switch connectivity.• By Array presents a summary of your environment size and the top ten arrays and hosts by
accessed capacity.• Detailed Reports lists links to many of the most popular OnCommand Insight reports.• SAN Path Violations contains charts of Application Priority SAN Path Violations and SAN Path
Violation Type Distribution with links to SAN Path violation lists.
Accessing Inventory dashboardsTo locate inventory, you can search in the array, host, and SAN path violations dashboards in thePublic Folders.
Steps
1. Open the OnCommand Insight Reporting Connection.
26 | OnCommand Insight Reporting Guide
2. Click the Public Folders link and select Inventory <version> link from the list. Click theDashboards folder.
The Dashboards page contains folders and individual reports in addition to the dashboards.
3.Click the link beside a dashboard icon to display inventory information in a dashboardformat.
Related references
By Array dashboard on page 27
By Host dashboard on page 28
Detailed Reports dashboard on page 30
SAN Path Violations dashboard on page 31
By Array dashboardThe By Array dashboard summarizes your storage environment from an array point of view. You canfilter by many options including vendor, storage family, models, and serial numbers.
To open the By Array dashboard, select Public Folders > Inventory <version> > Dashboards > ByArray.
The dashboard displays these reports at the top:
• Environment Size: Click on a link in the report to display report choices for details.• Top Ten Arrays: Click on a bar in the chart to display details.• Top Ten Hosts: Click on a bar in the chart to display details.
You can click links and items in charts to display more detailed information.
Below the generated reports is a list of inventory report links followed by filters to select the datadisplayed in the inventory reports.
Inventory dashboards and reports | 27
By Host dashboardThe By Host dashboard summarizes host capacity, paths and switch connectivity.
To open the By Host dashboard, select Public Folders > Inventory <version> > Dashboards > ByHost.
You use the filter at the top of this dashboard to select the hosts you want shown in the dashboardreports. In this example, the letter "e" was used to list the host names of interest. After you make yourselections in the filtered list of hosts, click Insert, and then Submit to generate the reports.
28 | OnCommand Insight Reporting Guide
The dashboard displays the following reports for your selected hosts:
• Host Capacity• Host Paths• Host to Switch Connectivity
You can click the bars in two charts and the links in the Host to Switch Connectivity report to displaymore detailed information.
Inventory dashboards and reports | 29
Below the three reports is a list of the other Inventory reports. Click on the links to generate thosereports.
To open the Detailed Reports dashboard, select Public Folders > Inventory <version> >Dashboards > Detailed Reports.
The Detailed Reports dashboard is particularly useful because it lists many of the most popularOnCommand Insight reports in these categories:
• Hosts• Arrays• SAN path violations• Capacity chargeback• Capacity storage• Capacity tiering• Capacity switches• Plan - Cost Accounting
30 | OnCommand Insight Reporting Guide
The reports you are able to access depend on the OnCommand Insight licenses you have installed.For example, you need an Insight Assure license to generate the SAN Path Violations report.
SAN Path Violations dashboardThe SAN Path Violations dashboard shows the applications affected by SAN violations and thedistribution of the violations by type in charts and enables you to display more detailed lists forportions of the charts.
To open the Detailed Reports dashboard, select Public Folders > Inventory <version> >Dashboards > SAN Path Violations.
This dashboard contains two charts:
• Application Priority SAN Path Violations illustrates the violation count and type in relation to thepriority of the applications running on the affected hosts.
• SAN Path Violation Type Distribution shows the violation counts for each of the SAN pathviolation types such as Missing Redundancy and Path Outage.
If you click a bar in one of the charts, you can display the SAN Path Violations report for thatelement.
Inventory dashboards and reports | 31
Below the charts is a link to generate the SAN Path Violations report for a selected group of hosts.
Related references
SAN Path Violations report on page 52
32 | OnCommand Insight Reporting Guide
Inventory reportsThe detailed Inventory reports provide information about devices, FC and NSF paths, connectedports, devices, data sources, hosts, internal volumes, and qtrees.
You can access the Inventory reports from Public Folders > Inventory <version> > Reports or in
the Inventory Dashboards location. Look for the report icon that distinguishes the individualreports from dashboards and folders.
For reports where you can search and select resources, you can leave the search criteria blank toselect all resources or enter criteria for specific resources.
Accessing Inventory reportsAccess the list of reports from the OnCommand Insight main Web portal.
Steps
1. Open the OnCommand Insight Reporting Connection.
2. From the Public Folders tab, click Inventory.
The report category names also include the version number of OnCommand Insight that isinstalled in your environment.
3. Click Reports.
4. Click the report name link to enter parameters, if required, and generate the report.
Note: Individual inventory reports might also be listed in the Inventory > Dashboards folder.
These reports are identified with the report icon .
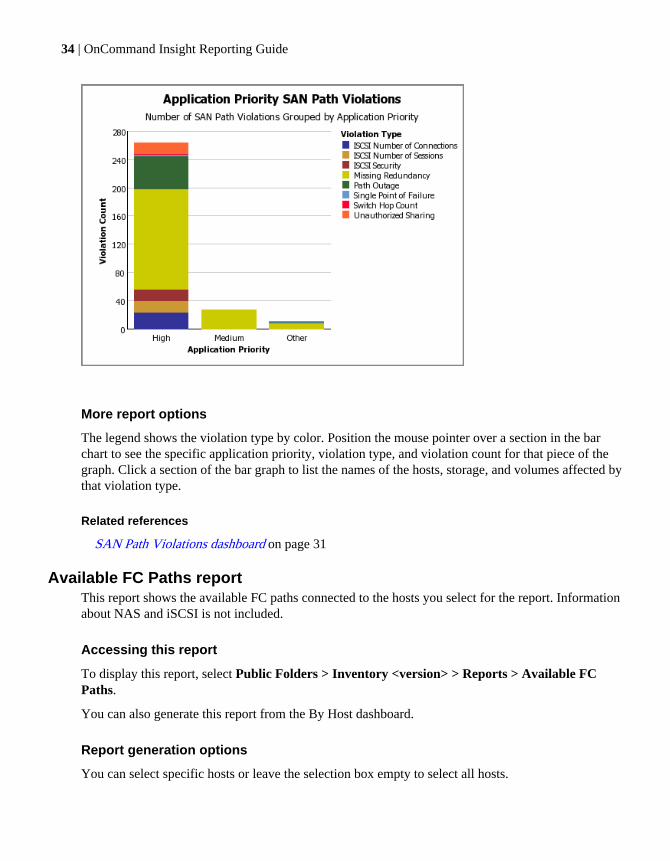
Application Priority SAN Path Violations reportApplication Priority SAN Path Violations report illustrates the violation count and type in relation tothe priority of the applications running on the affected hosts.
Accessing this report
To display this report, select Public Folders > Inventory <version> > Dashboards > ApplicationAffected by SAN Path Violations.
You can also see this report on the SAN Path Violations dashboard.
Sample
Inventory dashboards and reports | 33
More report options
The legend shows the violation type by color. Position the mouse pointer over a section in the barchart to see the specific application priority, violation type, and violation count for that piece of thegraph. Click a section of the bar graph to list the names of the hosts, storage, and volumes affected bythat violation type.
Related references
SAN Path Violations dashboard on page 31
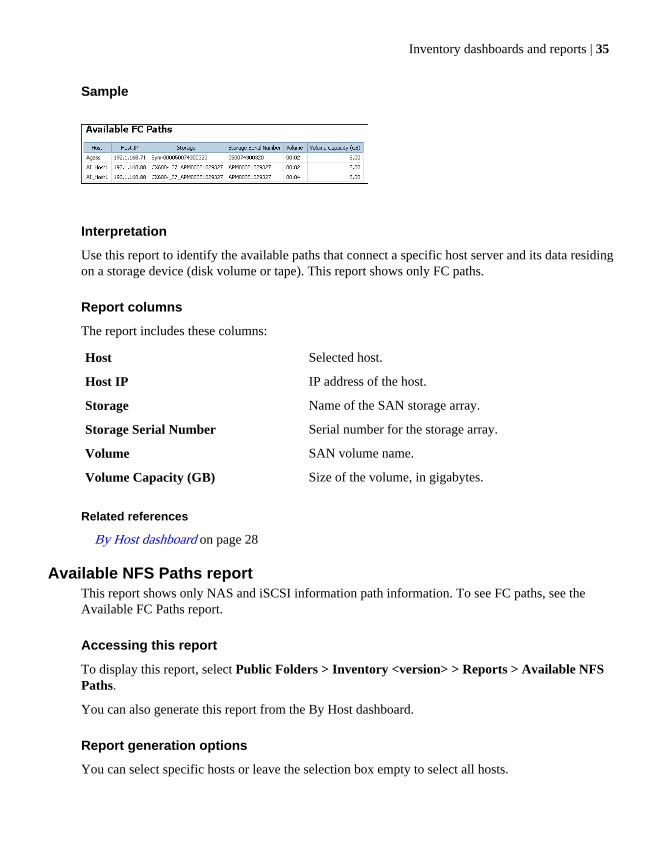
Available FC Paths reportThis report shows the available FC paths connected to the hosts you select for the report. Informationabout NAS and iSCSI is not included.
Accessing this report
To display this report, select Public Folders > Inventory <version> > Reports > Available FCPaths.
You can also generate this report from the By Host dashboard.
Report generation options
You can select specific hosts or leave the selection box empty to select all hosts.
34 | OnCommand Insight Reporting Guide
Sample
Interpretation
Use this report to identify the available paths that connect a specific host server and its data residingon a storage device (disk volume or tape). This report shows only FC paths.
Report columns
The report includes these columns:
Host Selected host.
Host IP IP address of the host.
Storage Name of the SAN storage array.
Storage Serial Number Serial number for the storage array.
Volume SAN volume name.
Volume Capacity (GB) Size of the volume, in gigabytes.
Related references
By Host dashboard on page 28
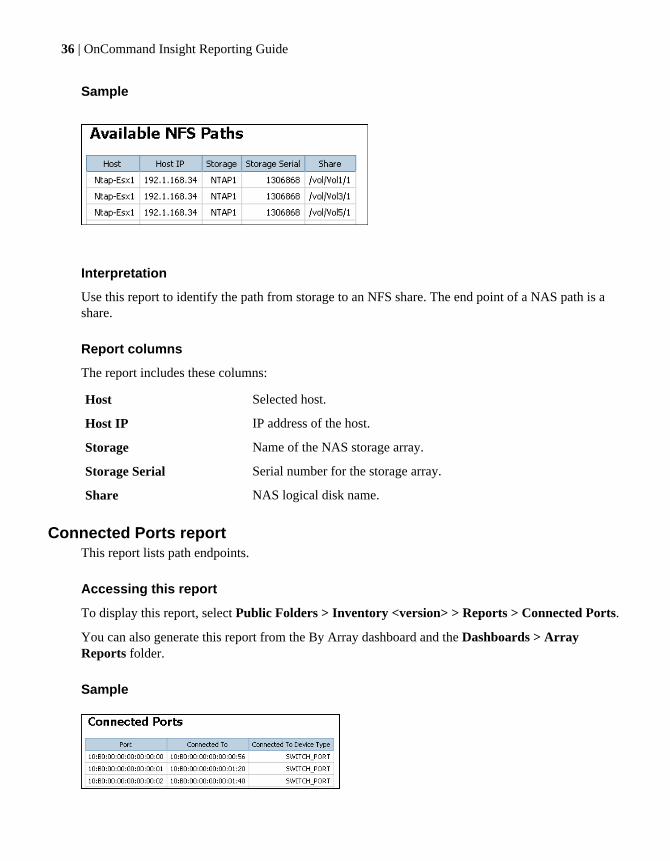
Available NFS Paths reportThis report shows only NAS and iSCSI information path information. To see FC paths, see theAvailable FC Paths report.
Accessing this report
To display this report, select Public Folders > Inventory <version> > Reports > Available NFSPaths.
You can also generate this report from the By Host dashboard.
Report generation options
You can select specific hosts or leave the selection box empty to select all hosts.
Inventory dashboards and reports | 35
Sample
Interpretation
Use this report to identify the path from storage to an NFS share. The end point of a NAS path is ashare.
Report columns
The report includes these columns:
Host Selected host.
Host IP IP address of the host.
Storage Name of the NAS storage array.
Storage Serial Serial number for the storage array.
To display this report, select Public Folders > Inventory <version> > Reports > Connected Ports.
You can also generate this report from the By Array dashboard and the Dashboards > ArrayReports folder.
Sample
36 | OnCommand Insight Reporting Guide
Interpretation
You might want to use this report to identify initiator (host) ports and their target (storage) ports andidentify the type of device. In OnCommand Insight, initiator nodes are associated with hosts andtarget nodes with storage.
Report columns
The report includes these columns:
Switch port World Wide Port Name (WWPN) for the initiator (host) port.
Connected To World Wide Port Name (WWPN) for the target (storage) port.
Connected To Device Type Type of device, for example, switch port or host port.
Data Sources reportThis report lists the data sources for each site and the current acquisition status of those data sources.
Accessing this report
To display this report, select Public Folders > Inventory <version> > Reports > Data Sources.
Sample
Report columns
The report includes these columns:
Site Name Name of the location of the data sources.
Acquisition Unit The type of acquisition unit.
Vendor Name of the data source manufacturer.
Data Source Name of the data source in your environment.
Type Your environment designation for the type of data source device.
Model Manufacturer's description of the data source device.
Last Status Indicates whether the data source could be recognized during acquisition.
Last Status Date Date and time of the most recent inspection of the data source status.
Inventory dashboards and reports | 37
Message Description of the status.
Device Inventory reportThis report displays summary information for all devices in the SAN.
Accessing this report
To display this report, select Public Folders > Inventory <version> > Reports > Device Inventory.
You can also generate this report from the By Host dashboard.
Report generation options
Select one or more device types or leave the selection box untouched to select all of the device types.
Sample
Report columns
The report includes these columns:
Alias Device name as it appears in OnCommand Insight.
Port WWN World Wide Port Name (WWPN). This is the same as WWNN for a single portdevice.
Port Alias assigned to the port, if any.
Environment Size reportThis report provides a quick summary of the devices in your environment with links to more detailedreports on specific device types.
Accessing this report
To display this report, select Public Folders > Inventory <version> > Dashboards > EnvironmentSize.
You can also see this report on the By Array dashboard.
Sample
More report options
Click on a link in the chart to open the related detailed reports for fabrics, hosts, storage devices,tapes, switches, and switch ports.
Fabric Summary reportThis report contains an overview of all the fabrics in the environment. For each fabric, the reportindicates the switch ports that create the fabric.
Accessing this report
To display this report, select Public Folders > Inventory <version> > Reports > Fabric SummaryReport.
Sample
Inventory dashboards and reports | 39
Report columns
The report includes these columns:
Switch Name Name of the switch.
Switch Firmware Version of the firmware running on the switch.
Serial Number Serial number of the switch, if available.
Port Count Number of ports that the switch can accommodate.
Connected Port Count Number of switch ports connected to the fabric.
Licensed Port Count Number of licensed ports on the switch.
Licensed Connected Port Count Number of switch ports logically connected to the fabric.
GlossaryThe Glossary explains the terms used for the contents of the columns that are displayed in thesummary reports.
Accessing this report
To display this report, select Public Folders > Inventory <version> > Reports > Glossary.
Sample
40 | OnCommand Insight Reporting Guide
Host Capacity reportThe Host Capacity report contains an overview of storage utilization by each host in theenvironment, with capacity information highlighted.
Accessing this report
To display this report, select Public Folders > Inventory <version> > Dashboards > HostCapacity.
You can also see this report on the By Host dashboard.
Sample
More report options
Click a bar in the graph to open the Host Summary report for the host you selected.
Report columns
The Host Summary report of the report includes these columns:
Host Name Selected host.
Port Count Number of ports on that host.
FC Path Count Number of paths connected to Fibre Channel hosts.
ISCSI Path Count Number of paths connected to ISCSI hosts.
Inventory dashboards and reports | 41
Accessed Capacity (GB) Amount of storage that is accessible for host, in gigabytes.
Accessed Raw Capacity (GB) Actual raw disk capacity for the device, in gigabytes.
FC Violation Count Number of Fibre Channel host violations.
ISCSI Violation Count Number of ISCSI host violations.
Host HBAs reportThis report contains an overview of hosts in the environment including the vendor, model, andfirmware version of HBAs, and firmware level of the switches to which they are connected.
Accessing this report
To display this report, select Public Folders > Inventory <version> > Reports > Host HBAs.
Report generation options
You can select one or more hosts for this report.
Sample
Interpretation
The primary use of this report is to analyze firmware compatibility when doing a firmware upgradefor a switch or an HBA.
Report columns
The report includes these columns:
Host Selected host.
Host OS Operating system running on the host.
Host Port WWN World Wide Name of the HBA port.
42 | OnCommand Insight Reporting Guide
HBA Vendor Name of the vendor who sells the HBA.
HBA Model Manufacturer’s model number for the HBA.
HBA Firmware Version Version of the firmware running on the HBA.
HBA Driver Version of the driver running the HBA.
Switch Serial Number The serial number for the switch.
Switch Firmware Version Version of the firmware running on the switch that is connected to theHBA.
Host Paths reportThis bar graph provides information about the number of paths that can be accessed by each host.
Accessing this report
To display this report, select Public Folders > Inventory <version> > Dashboards > Host Paths.
You can display this report on the By Host dashboard.
Report generation options
You need to enter the names of one or more hosts and click OK to generate this report.
Sample
Inventory dashboards and reports | 43
Host Summary reportThis report contains an overview of storage utilization by each selected host with information forFibre Channel and ISCSI hosts.
Accessing this report
To display this report, select Public Folders > Inventory <version> > Reports > Host Summary.
You can also generate this report by clicking a bar in the Host Capacity report.
Report generation options
Sample
Interpretation
This summary report allows you to compare ports and paths and the Fibre Channel and ISCSIcapacity and violation counts.
Report columns
The report includes these columns:
Host Name Selected host.
Port Count Number of ports on that host.
FC Path Count Number of paths connected to Fibre Channel hosts.
ISCSI Path Count Number of paths connected to ISCSI hosts.
Accessed Capacity (GB) Amount of storage that is accessible for host, in gigabytes.
Accessed Raw Capacity (GB) Actual raw disk capacity for the device, in gigabytes.
FC Violation Count Number of Fibre Channel host violations.
ISCSI Violation Count Number of ISCSI host violations.
44 | OnCommand Insight Reporting Guide
Host to Switch Connectivity reportThis report lists all the switches in the SAN, their ports, and their connectivity. The report is used todetermine where a certain device is connected and to find free switch ports.
Accessing this report
To display this report separately, select Public Folders > Inventory <version> > Dashboards >Host Switch Connectivity.
You can also see this report on the By Host dashboard.
Sample
More report options
Click on host name in the report to display a summary table for the Host HBAs.
Report columns
The report includes these columns:
Host Selected host.
OS Operating system running on the host.
HBA Port WWN World Wide Name of the HBA port.
HBA Vendor Name of the vendor who sells the HBA.
HBA Model Model number for the HBA.
HBA Firmware Version of the firmware running on the HBA.
Switch Firmware Version of the firmware running on the switch.
Switch Name of the switch.
Serial Number Serial number of the switch, if available.
Inventory dashboards and reports | 45
Switch Port Switch ports discovered by OnCommand Insight.
Switch Port Speed Speed capability of the switch port.
Switch Port Status Current status of the switch port, as reported by the switch.
Host Usage reportThis report indicates storage utilization by each selected host, grouped by storage device.
Accessing this report
To display this report, select Public Folders > Inventory <version> > Reports > Host Usage.
Report generation options
You can search for host names or enter specific host names to generate this report.
Sample
Interpretation
This report is useful for analyzing hosts accessing a certain storage device for utilization purposes.
Report columns
The report includes these columns:
Host Selected host.
Port Count Number of licensed ports.
FC Path Count Number of active Fibre Channel paths.
ISCSI Path Count Number of active ISCSI paths.
Storage Name of the storage array.
Storage Capacity (TB) Storage arrays accessed the most, shown according to capacity.
46 | OnCommand Insight Reporting Guide
Internal Volumes reportYou use this report to find out capacity and storage pool information of internal volumes.
Accessing this report
To display this report, select Public Folders > Inventory <version> > Reports > InternalVolumes.
You can also generate this report from the Public Folders > Inventory <version> > Dashboards >Array Reports folder.
Report generation options
You can select one or more storage systems to report on.
Sample
Report columns
The report includes these columns:
Volume Name of the volume.
Capacity (GB) Total capacity of the volume.
Used Capacity (GB) Capacity that is allocated to virtual machines.
Consumed Capacity(GB)
The amount of capacity that the volume consumes from underlyingstorage(internal volume, storage pool, and so on). For non-thin provisionedvolumes, this value is the same as the volume's capacity.
Available Capacity(GB)
Free capacity.
Storage Pool The physical layer of storage that consists of the disks within a RAIDgroup that provide thin provisioning capabilities.
Storage The name of the storage device where the data for this path resides.
State The current state of the switch as reported by the switch, for example,online, OK, offline, or testing.
Type Vendor brand of the storage device.
Inventory dashboards and reports | 47
Mapped But Not Masked Volumes reportThis report lists those volumes whose LUN (logical unit number) has been mapped for use by aparticular host, but not masked to that host. Unmasked volumes can be accessed by any host, makingthem vulnerable to data corruption.
Accessing this report
To display this report, select Public Folders > Inventory <version> > Reports > Mapped But NotMasked Volumes.
Report generation options
You can select one or more data centers, storage vendors, or volumes with capacities larger than aspecified amount. Leave the selection boxes untouched to select all data centers or storage vendors.
Sample
Interpretation
Use this report to locate any unmasked volumes.
Report columns
The report includes these columns:
Data Center Location of the storage array.
Tier The storage tier (access priority) of the volume.
Storage Name of the storage array.
Volume Volume name.
Capacity (GB) Sizes of the disks comprising the volume.
Volume Type Types of disks comprising the volume, for example SSD for solid state or FCfor Fibre Channel.
48 | OnCommand Insight Reporting Guide
LUN Logical Unit Number or host volume ID.
Protocol Controller Protocol converter through which the volume is mapped to the storage port(applicable only for some types of storage arrays, such as EMC CLARiiON).
Storage Ports Worldwide Port Name of the storage controller ports.
Storage Targets Worldwide Node Name of the storage controller.
Qtree reportYou use this report to view the qtree details including the security state, qtree status, and qtree type.
Accessing this report
To display this report, select Public Folders > Inventory <version> > Reports > Qtree.
Report generation options
You can select one or more storage systems and internal volumes.
Sample
Interpretation
You use this report to see the file size quotas limits set on each qtree.
Report columns
The report includes these columns:
Storage Name Name of the storage associated with the volume.
Internal Volume The internal volume on which the target share resides.
Qtree Name of the qtree associated with the quota.
Type The vendor-specific type of volume.
Inventory dashboards and reports | 49
Capacity HardLimit (GB)
The disk space limit imposed on this qtree by a quota. If this is exceeded,data cannot be written. This differs from the soft quota; if used capacityexceeds the soft quota, OnCommand Insight displays a warning message.
Capacity Soft Limit(GB)
The soft quota space limit that, if exceeded, issues warnings rather thanrejects space requests.
Used Capacity (GB) Amount of capacity used towards the hard and soft capacity limit set on thequota. This is blank if the qtree does not include quotas.
Security Style Type of security used on the host associated with the qtree (UNIX, NTFS, orMixed). For example, if you have a project that needs to use NTFS-stylesecurity because the members of the project use Windows files andapplications, data for that project in a qtree can be grouped and its securitystyle set to NTFS, without requiring that other projects also use the samesecurity style.
Status Status of the qtree as reported by the device vendor.
Oplocks Indicates whether CIFS Opportunistic Locking is enabled (True) on theqtree.
Volume Count The number of volumes that were created on the qtree.
Volumes Comma-separated list of the volumes that were created on the qtree.
Share Count The number of shares that were created on the qtree.
Application Application that is associated with this qtree.
Business Unit Business unit associated with this qtree.
Qtree with Configuration Problems reportThis report displays qtrees in your environment where at least one quota limit is not set. The businessentities can be used to sort the data in this report.
Accessing this report
To display this report, select Public Folders > Inventory <version> > Reports > Qtree withconfiguration problems.
Sample
50 | OnCommand Insight Reporting Guide
Report columns
The report includes these columns:
Storage Name Name of the storage.
Internal Volume Internal volume on which this qtree is defined.
Qtree Name of the qtree associated with the configuration problem.
Capacity Hard Limit Hard limit of capacity as given by the tree quota, if it exists.
Capacity Soft Limit Soft limit of capacity as given by the tree quota, if it exists.
Used Capacity Used capacity of the qtree as given by the tree quota, if it exists.
Status Status of the qtree.
Volume Count Number of volumes defined on top of this qtree.
Share Count Number of shares defined on top of this qtree.
Application The application associated with the qtree.
Business Unit The business unit associated with the qtree.
Replicas reportThis report shows all connections between all initiator and target volumes in the system.
Accessing this report
To display this report, select Public Folders > Inventory <version> > Dashboards > ArrayReports > Replicas.
You can also generate this report form the Detailed Reports dashboard.
Sample
Interpretation
Replicas can be local or remote in the following ways:
• Local replica in the storage• Local storage to remote storage
Inventory dashboards and reports | 51
• Local replica to remote storage
The initiator is the storage that is being replicated. The target is the storage that was replicated.
Report columns
The report includes these columns:
Initiator Storage Identifier ID of the initiator storage array.
Initiator Storage Name of the initiator storage array.
Initiator Storage Serial Number Serial number of the initiator storage array.
Target Storage Identifier Storage ID as it appears in OnCommand Insight.
Target Storage Storage name of the Target volume.
Target Storage Serial Number Target storage serial number.
Target Volume Target (replica) volume name.
SAN Path Violations reportThis report provides information on the location of SAN path violations.
Accessing this report
To display this report, select Public Folders > Inventory <version> > Dashboards > SAN PathViolation Reports > SAN Path Violations.
This report can also be generated from the SAN Path Violations dashboard.
Report generation options
You can select one or more hosts and violation types. Leave the selection boxes untouched to selectall data.
Sample
52 | OnCommand Insight Reporting Guide
Report columns
The report includes these columns:
Host Selected host name.
Storage Name of the SAN storage array.
Volume SAN volume name.
Volume Capacity Size of the volume.
Violation Type The SAN path violation for this host.
Since Time that the error occurred.
Related references
SAN Path Violations dashboard on page 31
Inventory dashboards and reports | 53
SAN Summary reportThis report provides total numbers of the SAN devices in your environment and the switch portutilization as a percentage. It also provides a storage utilization summary and analysis.
Accessing this report
To display this report, select Public Folders > Inventory <version> > Dashboards > Host Reports> SAN Summary.
You can also generate this report from the By Host dashboard.
Sample
54 | OnCommand Insight Reporting Guide
Shares reportThis report lists all NAS shares in the SAN. You can choose to report on all or only selected NASshares.
Accessing this report
To display this report, select Public Folders > Inventory <version> > Dashboards > ArrayReports > Shares.
Report generation options
You can select one or more NAS storage systems and internal volumes. Leave the selection boxesuntouched to select all.
Sample
Inventory dashboards and reports | 55
Report columns
The report includes these columns:
Storage Name The name (public name) of the share that the NAS storage uses to expose thedirectory or the full path to the exposed directory.
Internal VolumeName
The internal volume on which the share resides.
Qtree Name of the qtree on which the share resides.
Share The path to the share.
Type The volume type as Qtree, Internal Volume, or Folder.
Permission The read, write, or execute privileges assigned to the share.
Protocol The CIFS or NFS protocol. NAS storage can expose the directory as a UNIXor Windows directory.
Path The path to the directory.
Status Status of the qtree as reported by the device vendor.
Security Type Type of security used on the host associated with the qtree (UNIX, NTFS, orMixed). For example, if you have a project that needs to use NTFS-stylesecurity because the members of the project use Windows files andapplications, data for that project in a qtree can be grouped and its securitystyle set to NTFS, without requiring that other projects also use the samesecurity style.
Storage Pools reportThis report lists information about selected storage pools including the capacity, used capacity, andraw capacity values for those pools.
Accessing this report
To display this report, select Public Folders > Inventory <version> > Dashboards > ArrayReports > Storage Pools.
Report generation options
You can select one or more data centers or volumes with capacities larger than a specified amount.Leave the Storage selection box untouched to select all data centers and volumes.
Sample
56 | OnCommand Insight Reporting Guide
Report columns
The report includes these columns:
Storage The name of the storage array associated with the storage pool.
IP The IP address of the storage pool.
Manufacturer The name of the storage vendor.
Model The name that storage vendor assigns to the storage type.
CPU Count The number of CPUs running in the storage pool
Memory The total amount of memory available in the storage pool.
Serial The manufacturer's number on the storage unit.
Firmware The version of the storage unit software.
Storage Pool The name of the storage pool.
Capacity (GB) The size of the storage pool that is available for storing user data, ingigabytes.
Raw Capacity (GB) The physical disk capacity of the storage pool, in gigabytes.
Used Capacity (GB) The capacity consumed in the device, in gigabytes.
Unused Capacity (GB) The usable capacity that might be available for storing additional data onthe storage pool, in gigabytes.
Inventory dashboards and reports | 57
Storage Summary reportThis report gives an overview of the storage devices in the environment. Storage devices are listedwith their vendor, model, and microcode or firmware version, as well as a brief summary of theirutilization.
Accessing this report
To display this report, select Public Folders > Inventory <version> > Dashboards > ArrayReports > Storage Summary.
Report generation options
You can select one or more data centers, storage vendors, storage families, storage models, andstorage names. Take no action in the selection boxes to select all data.
Sample
Report columns
The report includes these columns:
Data Center Location of the storage array.
Manufacturer Name of manufacturer of the storage array.
Family Product classification of the storage array (for example, CLARiiON,Symmetrix).
Model Model number supplied by the manufacturer.
Storage Name of storage array.
Microcode version Version of firmware running on the storage array.
Port Count Number of ports on the array.
Storage Raw Capacity Sum of capacity of all the disks in the array.
Masked Capacity Volume capacity that has been masked.
58 | OnCommand Insight Reporting Guide
Masked Raw Capacity Volume raw capacity that has been masked.
Accessed Capacity Capacity for which an access path exists.
Accessed Raw Capacity Raw capacity for which an access path exists.
Replication Capacity Volume capacity that has been allocated for replication and/orbusiness continuance volumes (including the replication capacity forvirtualized volume, local, and remote replication volume capacity)only if there is a Replica relation to the target volume.
Replication Raw Capacity Volume raw capacity that has been allocated for replication and/orbusiness continuance volumes (including the replication capacity forvirtualized volume, local, and remote replication volume capacity)only if there is a Replica relation to the target volume.
Internal Volume Capacity SUM of all Internal volume Total Capacity figures.
Internal Volume RawCapacity
SUM of all Internal volume Total Capacity (raw).
Internal VolumeReplication Capacity
Capacity that has been allocated for replication of internal volumes(including the replication capacity for local and remote replicationcapacity) like volume replica.
Internal VolumeReplication Raw Capacity
Raw Capacity that has been allocated for replication of internalvolumes (including the raw replication capacity for local and remotereplication capacity) like volume replica.
Storage Pool UnusedCapacity
SUM of all storage pool unused capacity.
Storage Pool Unused RawCapacity
SUM of all storage pool unused (raw) capacity.
Block Storage Utilization Ratio between array raw capacity and the sum of the total allocatedraw capacity and the orphaned raw capacity.
Switch Connectivity reportThis report lists the switches in the SAN, their ports, and their connectivity. Use this report todetermine where a certain device is connected and to find free switch ports.
Accessing this report
To display this report, select Public Folders > Inventory <version> > Dashboards > Host Reports> Switch Connectivity.
Inventory dashboards and reports | 59
Report generation options
You can select one or more data centers, switch vendors, models, and switch names. Leave theselection boxes untouched to select all data centers or storage vendors.
Sample
Report columns
The data is not only related to the switch, but to other related devices as well. Fabric-related reportsshow only the fabrics related to the device.
The report includes these columns:
Data Center Location of the switch.
Switch The name of the switch, as provided by the SAN manager at the switchconsole.
Fabric The fabric on which this switch is configured to operate.
Serial Number The serial number of the device.
Model The switch manufacturer's model number.
Vendor The name of the vendor who sells the switch.
Firmware The version of the firmware running on the switch.
Port The name of the port.
Port Status Status of the port as reported by the device vendor.
60 | OnCommand Insight Reporting Guide
Connected DeviceType
The type of device (for example, host, switch, or storage) connected tothe switch (one hop away).
Connected Device The device connected to the switch (one hop away).
Connected Port The port connected to the switch.
Top Ten Arrays reportYou can see the ten arrays that access the most capacity in the Top Ten Arrays report and additionalarrays that consume almost as much as the top ten.
Accessing this report
To display this report, select Public Folders > Inventory <version> > Dashboards > Top TenArrays.
This report is also displayed on the By Array dashboard.
Report generation options
You can select specific array models, data centers, storage families, storage names, and storagevendors or leave the boxes blank to select all of any category.
Sample
Inventory dashboards and reports | 61
Virtual Machines reportThis report lists all virtual machines in the environment.
Accessing this report
To display this report, select Public Folders > Inventory <version> > Dashboards > Host Reports> Virtual Machines.
Sample
Report columns
The report includes these columns:
VM Virtual machine name.
IP IP address assigned to the virtual machine.
Host Name of the host.
Host IP IP address of the host.
Cluster Name of a cluster of virtualization hosts sharing access to the same SANvolumes or NAS share. A V-Cluster is either a VMware HA cluster or amanually-defined group of hosts. Blank for standard physical servers.
VM OS Guest operating system.
VM State Shows the combined power state of the virtual hardware of the virtual machineand of the guest OS: Running, Powered Off, Powered On, Not Running,Standby, Shutting Down, Unknown, or Suspended.
Datastore Name of the datastore used by the virtual machine.
Storage SAN or NAS storage array name. May be blank if OnCommand Insight isunable to identify the storage containing the virtual machine.
VM Capacity Capacity allocated to the virtual machine on the datastore. This is the sum ofall virtual disks stored on the datastore that are used by the virtual machine.
Powered OffSince
Time when the virtual machine was shut down, if it is not running.
62 | OnCommand Insight Reporting Guide
VM Paths reportWith this report, you can quickly identify the current virtual configuration.
Accessing this report
To display this report, select Public Folders > Inventory <version> > Dashboards > Host Reports> VM Paths.
Sample
Interpretation
You might want to use this report to see the following:
• Which virtual machine is running on which host• Which hosts are accessing which shared volumes• What the active access path is• What comprises capacity allocation and usage
Report columns
The report includes these columns:
VM Virtual machine name. Is blank when the row represents a SAN volume or aNAS share that is being accessed from a virtual host (ESX) but does notcontain virtual machine data.
VM IP IP address assigned to the virtual machine.
Host Name of the host.
Host IP IP address of the host.
OS Guest operating system.
State Shows the combined power state of the virtual hardware of the virtualmachine and of the guest OS: Running, Powered Off, Powered On, NotRunning, Standby, Shutting Down, Unknown, Suspended.
Resource Name Name of the SAN volume or NAS logical disk where the data for this pathresides. Might be blank if one of the following occurs:
• The SAN volume is accessible to the host but is not part of any database.
Inventory dashboards and reports | 63
• OnCommand Insight is unable to identify the storage containing the virtualmachine.
ResourceTechnology
Populates with either SAN or NAS values which indicate what storagetechnology is used by the VM Path. Unlike the Client view, ResourceTechnology does not differentiate the SAN value between Fibre Channel oriSCSI.
ResourceCapacity (GB)
Size of the volume, in gigabytes.
Datastore Name of the datastore that resides on the volume and is used by the virtualmachine.
Storage SAN or NAS storage array name. May be blank if OnCommand Insight isunable to identify the storage containing the virtual machine.
VM Capacity Capacity allocated to the virtual machine on the datastore. This is the sum ofall virtual disks stored on the datastore that are used by the virtual machine.
DatastoreCapacity
Storage capacity that is allocated to the datastore (provided by the SDK).
Datastore FreeCapacity
Datastore capacity that is not allocated to virtual machines (provided by theSDK).
DatastoreUtilization
The ratio of used capacity divided by total capacity. Shows how muchcapacity is being used.
Powered Off Since Time when the virtual machine was shut down, if it is not running.
64 | OnCommand Insight Reporting Guide
Capacity and chargeback dashboards and reports
The capacity, chargeback, and trending data provides information to plan the overall storageallocation at a business level.
Senior managers, business unit managers, and application managers have different requirements forcapacity report information. A wide variety of reports to satisfy these needs are provided in thesereport groups:
• Capacity is a large group of reports with folders for file system utilization and capacityinformation for internal volumes, ports, qtrees, storage, storage pools, and virtual machines.
• Chargeback provides capacity accountability, historical capacity accountability, and trendinginformation.
Capacity and chargeback report dashboardsCapacity and chargeback report dashboards are used to group reports to provide a broader view of aparticular environment.
A dashboard contains links to all of the related summary reports and can display summary reportstogether. This allows you to select individual reports and refine the data for greater detail in one areaof interest.
For example, the Plan - Tiers dashboard enables you to assess tier usage trends at a glance anddetermine the average price per terabyte.
You can click portions of the dashboard charts and links to generate more detailed information fromeach dashboard.
Accessing capacity and chargeback dashboardsTo open the capacity and chargeback dashboards, you search for the type of information you want inthe Public Folders tab. You must have a Plan license to display data in these dashboards.
Steps
1. Open the OnCommand Insight Reporting Connection.
2. Select Public Folders.
3. To locate a dashboard folder, select from these categories:
• Chargeback <version>.• Capacity <version> and Port Capacity <version> or Storage Capacity <version>
65
4. Click Dashboards.
5.To open the dashboard, click the link beside the dashboard icon .
Related concepts
Plan - Capacity Forecast dashboard on page 66
Plan - Cost Accounting dashboard on page 67
Plan - Tiers dashboard on page 69
Related references
Plan - Port Forecast dashboard on page 68
Plan - Capacity Forecast dashboardThe Plan - Capacity Forecast dashboard summarizes capacity trends per tier and data center.
To open this dashboard, select Public Folders > Capacity <version> > Storage Capacity<version> > Dashboards > Plan - Capacity Forecast.
Administrators and managers use these reports to accomplish these tasks:
• Review the time to run out of reservation space and request space for each tier.• Verify that there are no major changes that may affect resource availability.• Get a capacity planning report per data center or per tier.• Know which top business entities are using a certain tier.
This dashboard displays the following reports:
• Capacity Consumption Forecast• Storage Capacity Trend• Storage Utilization• Top Business Entity Capacity Consumers
You can click portions of the charts and links to generate more detailed information from thisdashboard.
66 | OnCommand Insight Reporting Guide
Plan - Cost Accounting dashboardUse the OnCommand Insight Plan - Cost Accounting dashboard to review tier trends and find the topconsumers of provisioned capacity.
To open this dashboard, select Public Folders > Chargeback <version> > Dashboards > Plan -Cost Accounting.
The cost accounting dashboard includes these reports:
• Top Business Entities Capacity shows the top business entities by their provisioned capacity.• Top Business Entity Capacity Consumers identifies the top consumers of provisioned capacity by
business entity.• Business Entity Accountability identifies the top business entities that contribute most to costs by
tier.• Top Business Entity Cost Contributors identifies the use of provisioned capacity by business
entities and see the top contenders by tier.
You can click portions of the charts and links to generate more detailed information from thisdashboard.
Capacity and chargeback dashboards and reports | 67
Related concepts
Chargeback reports on page 121
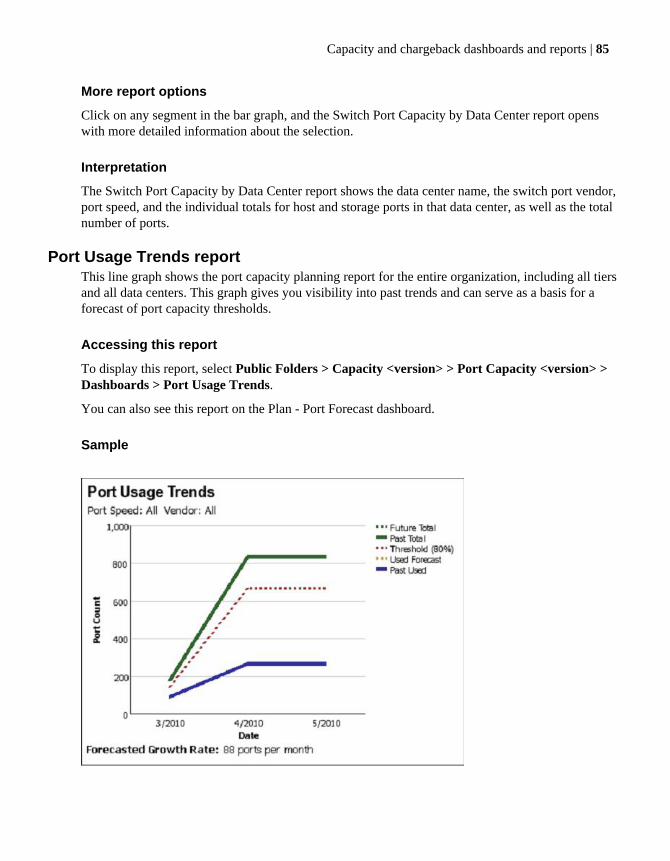
Plan - Port Forecast dashboardUse the Plan - Port Forecast reports to review the detailed switch port capacity planning reports in thedata centers—according to vendor and speed—that will run out in the near future.
To open this dashboard, select Public Folders > Capacity <version> > Port Capacity <version> >Dashboards > Plan - Port Forecast.
Using these dashboard reports you can:
• Estimate what type of port capacity is needed, indicating whether the organization is about to runout of ports of a certain speed or from a certain vendor.
• Determine where this capacity is needed.• Estimate the optimal time to purchase capacity and make it available.
For more detailed information, click elements of the charts and the links to regenerate reports withthe requested information.
68 | OnCommand Insight Reporting Guide
Plan - Tiers dashboardUse the OnCommand Insight Plan - Tiers dashboard to review tier trends.
To open this dashboard, select Public Folders > Capacity <version> > Storage Capacity<version> > Dashboards > Plan - Tiers.
The Tiers dashboard includes these reports:
• Tier Usage Trends• Average TB Price• Tier Usage by Applications• Tier Usage by Business Entity• Business Entity Capacity by Data Center and Tier
These reports allow you to:
• See increases in usage by tier.• Verify that usage shifts over time from more expensive tiers to less expensive tiers.
Capacity and chargeback dashboards and reports | 69
• See whether global indicators such as average price per TB and yield go down.• Reduce cost.
You can click portions of the charts and links to generate more detailed information from thisdashboard.
Accessing capacity reportsIn addition to the report dashboards, you can open individual capacity reports. To locate a report,search for it in the Public Folders tab of the OnCommand Insight Reporting Connection. You canalso open a dashboard and select an individual report from the group of reports listed.
Steps
1. Open the OnCommand Insight Reporting Connection.
2. Click the Public Folders tab.
3. From the Public Folders tab, click Capacity.
The report category names also include the version number of OnCommand Insight that isinstalled in your environment.
4. Open any of these folders to access the individual capacity reports:
• File System Utilization• Internal Volume Capacity• Port Capacity
70 | OnCommand Insight Reporting Guide
• Qtree Capacity• Storage and Storage Pool Capacity• Storage Capacity• VM Capacity
Note: Individual reports might be in the Reports or Dashboards folders within thesecategories.
5.To generate the report, click the link beside the report icon .
Average TB Price reportThis report presents the trend of average price per terabyte over time. As an organization becomesmore efficient in utilizing more inexpensive resources, that number should be going down. You canquickly assess whether the organization is successfully implementing a tiering strategy that drivescost savings.
Accessing this report
To display this report, select Public Folders > Capacity <version> > Storage Capacity <version>> Dashboards > Average TB Price.
Sample
Interpretation
If there is no cost associated with a tier, the report shows $1.
Capacity and chargeback dashboards and reports | 71
Capacity Accountability Details by Host reportThis report page shows the details of the capacity that is charged to the selected host. It includes theprotection type and protection volumes not directly accessed by the host, but which are charged to it.Protection volumes are replicas of volumes that are accessed and charged to the host.
Accessing this report
Select the Public Folders > Capacity <version> > Storage Capacity <version> > Reports >Capacity Accountability Details by Host.
Report generation options
You can select any host or group of hosts in your environment as the focus for this report.
Sample
Report columns
Tier Level of service.
Storage Name of the SAN or NAS storage array.
Protection Type Indication of whether this capacity or this resource is used as a replica.Possible values are Primary, Volume Replica, Internal Volume Replica, orQtree replica.
Volume Type The vendor-specific type of volume, for example, SFS or BCV.
Volume Name of the volume.
Physical UsableCapacity
Capacity actually present on the storage device and available for use,excluding capacity used by technologies such as RAID.
The Total line of this report page is the total capacity the selected host ischarged.
72 | OnCommand Insight Reporting Guide
Accessing Hosts Hosts that are accessing each volume.
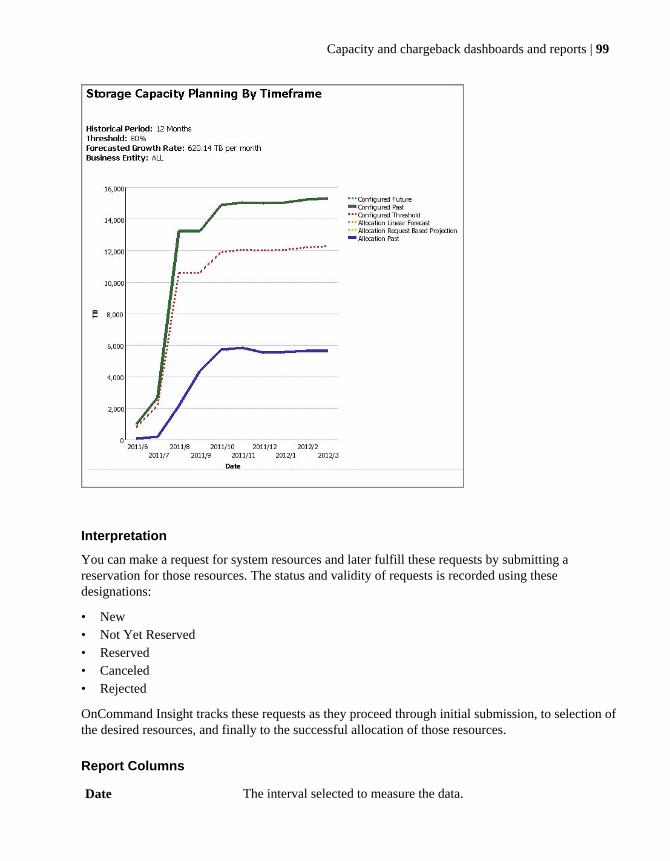
Capacity Consumption Forecast reportThis report presents the number of months before the Capacity Usage Threshold is reached for thespecified tier and data center combination. This report shows where there are potential problemareas. For example, when there are fewer than four months remaining, the intersection of the tier anddata center is shaded in red, signaling a need for attention.
You can also access this report as part of the Plan - Capacity Forecast dashboard.
Sample
More report options
Threshold is defined as a percentage value between 1 and 100 of the total capacity of arraysavailable. The report estimates the number of months before the capacity usage exceeds the thresholdlimit. Clicking on any part of the chart—tier, data center, or value—automatically refreshes the restof the Capacity Consumption Forecast reports to match the outcome signaled by that attribute orintersection.
Interpretation
The Capacity Consumption Forecast report analyzes the capacity usage of data centers categorizedby tier. It shows an estimate of the number of months before the capacity usage (based on historicaltrends) will exceed a specified threshold.
Capacity and chargeback dashboards and reports | 73
Connected Ports History reportThis report provides information about the connection history of switch ports per selected date.
Accessing this report
To display this report, select Public Folders > Capacity <version> > Port Capacity <version> >Reports > Connected Ports History.
Report generation options
The report enables you to select the time frame for the historical information. If the selected timeframe cannot be located, the report displays data from the closest to the time the report request waslogged by the system.
Sample
74 | OnCommand Insight Reporting Guide
Interpretation
This report displays historical information about the connected active switch ports.
Report columns
Port Name of the port or, if no name is available, WWN of the port.
Connected to Device Device and port to which the port is physically connected.
Connected to DeviceType
The type of device to which the port is connected, for example, storage,host, switch, generic, or tape.
Capacity and chargeback dashboards and reports | 75
Data Center VM Capacity Details reportThis report provides detailed information on the VM capacity in your data center. You might want touse this report to find capacity information that includes provisioned capacity, commit ratio anddeduplication savings at the VM level.
Accessing this report
To display this report, select Public Folders > Capacity <version> > VM Capacity <version> >Reports > Data Center VM Capacity Details.
Report generation options
Select the data center to examine.
Sample
Interpretation
For the selected data center, usage data in the graph and in the table show:
• Data Store Capacity (storage capacity allocated to the data store).• Data Store Free Capacity (free capacity that is not used by any virtual machine).
This report provides details about these VM elements:
• Datastores• Storage with the associated datastore• VM total capacity• Provisioned capacity• Unused capacity• Percentage savings from deduplication
The report also supplies information about the commit ratio (ratio of data store provisioned capacityto the total capacity of the data store).
76 | OnCommand Insight Reporting Guide
File System Details reportThe File System Details report shows the used capacity in selected file systems per host.Administrators use this report to see how currently allocated storage is being consumed, who is usingit, and who is purchasing it.
Accessing this report
To display this report, select Public Folders > Capacity <version> > File System Utilization<version> > Reports > File System Details.
Report generation options
You can select the file system and host names to be included.
Sample
Capacity and chargeback dashboards and reports | 77
Interpretation
This report provides detailed data on a specific file system. Administrators can see how currentlyallocated storage is being consumed, who is using it, and who is purchasing it.
Report columns
Host Name The names of the hosts included in this file system.
File System Name Displays the name given to the file system on the host.
Type Displays the type of file system, for example, NTFS or FAT32.
File System Size (GB) Displays the usable capacity of the file system, in gigabytes.
File System UsedCapacity (GB)
Capacity Used is the sum in the file system of all volumes' consumedcapacity, in gigabytes.
File System UsedCapacity (%)
The percentage of capacity consumed by a file system.
Date This is the last time the data source reported to OnCommand Insight.
Historical VM Cost Accountability reportUse this report to identify costs associated with business entities (tenants, lines of business, businessunits, and projects), applications, and service levels for virtual machines.
Accessing this report
To display this report, select Public Folders > Capacity <version> > VM Capacity <version> >Reports > Historical VM Cost Accountability.
Report generation options
For this report, you first select the hosts, tiers, and applications. Then, you select the business entitiesand dates.
Sample
78 | OnCommand Insight Reporting Guide
Report columns
The report includes these columns:
Business Entity Tenants, lines of business, business units, and projects selected for the report.
Application Applications associated with the business entities.
ESX Host Name of the virtual machine host.
Guest VM Name of the virtual machine.
Storage Name of the SAN or NAS storage array.
Virtualizer Indication of virtualization. Identifies whether the storage acts as a virtualizerdevice or as backend storage. If virtualization is not associated with the host,"N/A" appears.
Capacity and chargeback dashboards and reports | 79
Tier Service level tier associated with the application. If the resource does not haveany tiers associated with it, "N/A" appears.
Inactive VMs reportThis report identifies which VMs in your data center have not been used for a selected number ofdays or longer. You can use this report to look at a summary of VM guests that have been poweredoff for a configurable number of days.
Accessing this report
To display this report, select Public Folders > Capacity <version> > VM Capacity <version> >Reports > Inactive VMs.
You can also display this report from the Plan - Capacity Forecast dashboard.
Report generation options
You can select a length of time for which any VMs were inactive. In this example, 60 days wasselected. You can also select the Virtual Data Center or a specific IP address for this report.
Report columns
The report includes the following columns:
Host Data Center Name of the data center.
VM Name to identify the VM.
OS Operating system running on the host.
ESX VMware host.
Cluster Name of a cluster of virtualization hosts sharing access to the same SANvolumes or NAS share. A VM Cluster is either a VMware HA cluster or amanually-defined group of hosts.
VMDK Names of virtual disks.
Powered Off Since Time of shutdown.
Capacity (GB) Capacity allocated to the virtual machine on the data store. This is the sum ofall virtual disks stored on the data store which are used by the VM.
Masked Orphaned Volumes reportThis report helps you improve resource utilization by identifying orphaned volumes that could beused. It lets you determine which volumes are not being accessed by any host and thus are candidates
80 | OnCommand Insight Reporting Guide
for reclamation to be reused or moved. Report data is grouped by storage name and data center. Asummary of orphaned capacity in GB is displayed at the end.
Accessing this report
To display this report, select Public Folders > Capacity <version> > Storage Capacity <version>> Reports > Masked Orphaned Volumes.
You can also display this report from the Plan - Capacity Forecast dashboard.
Sample
Interpretation
Using this report lets you get the information you need without having to discover the entire fabric.The information in this report might help you increase valuable storage capacity and decrease theneed for capital expenditures.
Capacity and chargeback dashboards and reports | 81
Report columns
The report includes these columns:
Data Center Location of the storage array.
Storage Name of the storage array.
Volume Name of the orphaned volume.
Capacity (GB) The usable capacity each volume has, in gigabytes.
Port Consumption Forecast reportWith this report, you are able to monitor storage resources consumption to ensure that yourorganization is on track as planned. The report helps you determine where and when current portusage trends will negatively impact resource availability.
Accessing this report
To display this report, select Public Folders > Capacity <version> > Port Capacity <version> >Dashboards > Port Consumption Forecast.
You can also run this report from the Port Forecast dashboard.
Sample
More report options
Click on a link in a column or row in the table, and the Port Usage Trends report opens to displaymore focused data.
82 | OnCommand Insight Reporting Guide
• If you click on a vendor, then the report shows only that vendor and all port speeds.• If you click on a port speed, the report shows all vendors and only that port speed.• If you click on the number, the report only shows that vendor and that port speed.
Interpretation
This report provides a forecast of port consumption by data center, switch vendor, and port speed todetermine when additional ports are needed.
Ports by Data Center, Vendor reportThis report enables you to review port usage filtered by data center and vendor.
Accessing this report
To display this report, select Public Folders > Capacity <version> > Port Capacity <version> >Dashboards > Ports by Data Center, Vendor.
You can also see this report on the Plan - Port Forecast dashboard.
Sample
More report options
Click on any vendor segment in the bar graph, and the Switch Port Capacity by Data Center reportopens to show more data for the selection.
Capacity and chargeback dashboards and reports | 83
Interpretation
This report displays the number of active ports by data center and vendor.
Ports by Data Center, Vendor, Port Speed reportThis report displays the number of active ports, grouped by data center, vendor, and port speed. Youcan see the number of ports of each vendor and speed as well as where they are located.
Accessing this report
To display this report, select Public Folders > Capacity <version> > Port Capacity <version> >Dashboards > Ports by Data Center, Vendor, Port Speed .
You can also see this report on the Plan - Port Forecast dashboard.
Sample
84 | OnCommand Insight Reporting Guide
More report options
Click on any segment in the bar graph, and the Switch Port Capacity by Data Center report openswith more detailed information about the selection.
Interpretation
The Switch Port Capacity by Data Center report shows the data center name, the switch port vendor,port speed, and the individual totals for host and storage ports in that data center, as well as the totalnumber of ports.
Port Usage Trends reportThis line graph shows the port capacity planning report for the entire organization, including all tiersand all data centers. This graph gives you visibility into past trends and can serve as a basis for aforecast of port capacity thresholds.
Accessing this report
To display this report, select Public Folders > Capacity <version> > Port Capacity <version> >Dashboards > Port Usage Trends.
You can also see this report on the Plan - Port Forecast dashboard.
Sample
Capacity and chargeback dashboards and reports | 85
More report options
Click an item in the graph, and the Switch Port Capacity Planning by Timeframe report opens toprovide more data on the selection. When you make a change to any element in the PortConsumption Forecast, that change immediately affects the data shown in the Port Usage Trendsreport.
Interpretation
This report provides a forecast of future port consumption by start and end time, port speed andvendor based on past trends (port count).
Note: For all trend charts, if there is no data for the corresponding date (for example, if you select"End of Quarter" and have no Data Warehouse data for that particular date) the chart will bemissing that data point.
Port Utilization reportThis report helps you understand how resource allocation is being used with indicators for a safelevel of capacity allocation and for resource problems.
Accessing this report
To display this report, select Public Folders > Capacity <version> > Port Capacity <version> >Dashboards > Port Utilization Dial.
You can also see this report on the Plan - Port Forecast dashboard.
Sample
Interpretation
The report shows two dials per data center:
• Port Utilization by Data Center = the percent of allocated capacity vs. available capacity.
86 | OnCommand Insight Reporting Guide
• Global Port Utilization = the total percent for the entire environment (an aggregate all datacenters).
The dial pointer indicates a safe level of capacity allocation in green. Resource problems exist whenthe dial points to yellow or red.
Risk Index for Over Provisioned Business Entities reportUse this report to find business entities that are at risk of using storage capacity that they werepromised but is larger than is available in the usable physical capacity. This report details the specificbusiness entity's storage systems and storage pools and provides the percent contribution of everystorage pool to the business unit.
Accessing this report
To display this report, select Public Folders > Storage Capacity <version> > Reports > RiskIndex for Over Provisioned Business Entities.
Sample
Capacity and chargeback dashboards and reports | 87
Interpretation
Use this report to determine which storage pools are contributing to the over provisioning risk.
Report columns
BE Name of the business entity.
Risk Index Weighted average of storage pool provisioned capacity multiplied bystorage pool risk index for a business entity.
Storage Name Name of the storage that contains the storage pools.
Storage Pool Name Name of the storage pool associated with the business entity.
88 | OnCommand Insight Reporting Guide
Business EntityPercentage Storage PoolUsage
Ratio of storage pool provisioned capacity and total capacity of thestorage pool.
Risk Index for Over Provisioned Data Centers reportThis report identifies data centers that are at risk of using storage capacity that they were promisedbut is larger than is available in the physical capacity. This report details the data center's storagearrays and storage pools and shows the percent contribution of every storage pool to the data center.
Accessing this report
To display this report, select Public Folders > Capacity <version> > Storage Capacity <version>> Reports > Risk Index for Over Provisioned Data Centers.
Capacity and chargeback dashboards and reports | 89
Sample
Interpretation
Use this report to determine which storage pools are contributing to the risk.
Report columns
Data Center Location of the storage.
Risk Index Weighted average of (storage pool provisioned capacity X storagepool risk index) for a data center.
Storage Name Name of the storage unit.
Storage Pool Name Name of the storage pool.
90 | OnCommand Insight Reporting Guide
Storage Pool Risk Index Weighted average of storage pool provisioned capacity multipliedby storage pool risk index for a business entity.
Percentage of Data CenterUsage
Percentage of the entire data center capacity used by this storagepool.
Risk Index for Over Provisioned Storage Pools reportThis report identifies all storage pools that are at risk of being assigned for use that is beyond theirusable physical capacities.
Accessing this report
To display this report, select Public Folders > Capacity <version> > Storage Capacity <version>> Reports > Risk Index for Over Provisioned Storage Pools.
Sample
Capacity and chargeback dashboards and reports | 91
Interpretation
The risk index for storage pools uses this calculation:
92 | OnCommand Insight Reporting Guide
Risk Index for Over Provisioned Tiers reportUse this report to identify tiers that are at risk of being over-provisioned. This report provides detailsabout the storage arrays and storage pools associated with a specified tier.
Accessing this report
To display this report, select Public Folders > Capacity <version> > Storage Capacity <version>> Reports > Risk Index for Over Provisioned Tiers.
Sample
Interpretation
Use this report to identify tiers that are at risk of being over-provisioned and to obtain details aboutthe storage arrays and storage pools associated with a specified tier. The report also shows thepercent contribution of every storage pool to the tier, to help you determine which storage pools arecontributing to the risk.
Capacity and chargeback dashboards and reports | 93
Report columns
Tier Name The annotation designation used to identify the level of service.
Risk Index Weighted average of storage pool provisioned capacity multiplied bystorage pool risk index for a tier.
Storage Name Name of the storage that contains the storage pools.
Storage Pool Name Name of the storage pool associated with the tier.
Percentage of TierCapacity
The portion of the total tier provisioned capacity that was contributedby a particular storage pool.
ROI Model reportThis report is used in estimating return on investment (ROI). You can also use this report to reviewthe capacity by tier including the physical usable and raw capacity and the provisioned usable andraw capacity.
Accessing this report
To display this report, select Public Folders > Capacity <version> > Storage Capacity <version>> Reports > ROI Model.
Sample
94 | OnCommand Insight Reporting Guide
Interpretation
This report supplies an environment overview and is most often used for planning changes. Thereport provides capacity and utilization information that helps you calculate the OnCommand InsightReturn On Investment (ROI).
Storage Capacity by Tier reportThis report shows the current storage capacity and storage capacity usage trends and gives youvisibility into capacity replenishment needs by tier. For example, you can answer questions abouthow much of tier1 capacity is available for servers and hosts or what the projected date for reaching80% capacity threshold on your physical storage might be.
Accessing this report
To display this report, select Public Folders > Capacity <version> > Storage and Storage PoolCapacity <version> > Reports > Storage Capacity by Tier.
Sample
Interpretation
The report shows the following charts:
• Tier Capacity Distribution: Displays the used raw capacity and unused raw capacity in TB by tier.• Tier Utilization Trend: Displays the utilization percentage by tier per month.
Capacity and chargeback dashboards and reports | 95
Report columns
Storage Name of storage array.
Tier The annotation designation used to identify the level of service.
Raw Capacity Sum of capacity of all the disks in the array in terabytes.
Used Raw Capacity The amount of raw capacity in use on the storage array, including reservedcapacity, Snapshot used capacity, Snapshot reserved capacity, and storageefficiency technology overhead.
Unused Raw Capacity The available raw capacity.
Utilization % The amount of capacity being used. Ratio between used raw capacity andunused raw capacity.
Storage Capacity Details reportYou can use this report to find out information about a specified storage vendor, storage family,storage model, and storage name, or a combination of these. The report shows capacity informationwith details about both FC and NAS.
Accessing this report
To display this report, select Public Folders > Capacity <version> > Storage Capacity <version>> Dashboards > Capacity Storage Reports > Storage Capacity Details.
Report generation options
For this report, you can select the Data Centers, Storage Vendors, Storage Families, Storage Models,and Storage Names.
Sample
96 | OnCommand Insight Reporting Guide
Interpretation
This report displays the storage summary details including all the capacities masked, accessedvolumes, non-accessed volumes, and internal volume capacities.
Report columns
The report includes the following columns:
Tier Name The storage tier of the volume.
Data Center Location of the storage array.
Storage Name Name of storage array.
Model Model name supplied by the device manufacturer.
Storage Family Product classification of the storage array (for example,CLARiiON or Symmetrix).
Manufacturer The name of the storage vendor.
Serial Number The serial number of the device.
Microcode Version Version of the firmware running on the volume.
Masked Capacity Capacity of volumes that are masked to hosts but not accessed.
Masked Raw Capacity Volume raw capacity that has been masked.
Accessed Capacity Capacity of volumes accessed by hosts.
Accessed Raw Capacity Raw capacity for which an access path exists.
Orphaned Capacity Volume capacity that has been masked, but for which no accesspaths exist.
Capacity and chargeback dashboards and reports | 97
Orphaned Raw Capacity The physical capacity of a disk or array; for a volume, the physicalstorage space consumed by a volume, including RAID and volumeoverhead. An orphaned volume is a volume that has not beenaccessed for the given time.
Replication Capacity Volume capacity that has been allocated for replication and/orbusiness continuance volumes.
Replication Raw Capacity Volume raw capacity that has been allocated for replication andbusiness continuance volumes.
Unused Volume Capacity The usable capacity of the volumes promised to the storageinitiators that is currently unused.
Internal Volume Capacity Capacity of internal volumes promised to the storage initiators.
NAS Accessed Capacity Internal volume capacity that is specific to NAS.
NAS Accessed Raw Capacity Internal volume raw capacity that is specific to NAS.
Storage Pool UnusedCapacity
Available capacity of the storage pools.
Storage Pool Unused RawCapacity
Available raw capacity of the storage pools.
Storage Capacity Planning by Timeframe reportThis report presents capacity planning in months and the estimated time that you will run out ofstorage for a specific tier and data center combination. The report also provides a forecast of futureconsumption based on past trends to determine when additional capacity is needed based on start andend time, data center, tier, business entity, and storage.
Accessing this report
To display this report, select Public Folders > Capacity <version> > Storage Capacity <version>> Reports > Storage Capacity Planning by Timeframe.
Report generation options
Select the specific infrastructure elements to be analyzed from your business entities (tenant, line ofbusiness, business unit, and project), data centers, and tiers. You can also set these values:
• Threshold percentage of the array capacity shown in the report.• Historical time period to set the report date range and spacing of the sample points.
Sample
98 | OnCommand Insight Reporting Guide
Interpretation
You can make a request for system resources and later fulfill these requests by submitting areservation for those resources. The status and validity of requests is recorded using thesedesignations:
• New• Not Yet Reserved• Reserved• Canceled• Rejected
OnCommand Insight tracks these requests as they proceed through initial submission, to selection ofthe desired resources, and finally to the successful allocation of those resources.
Report Columns
Date The interval selected to measure the data.
Capacity and chargeback dashboards and reports | 99
Configured Past (TB) Total raw capacity in past time to the current time.
Configured Threshold(TB)
Selected percentage of the total raw capacity to be the threshold.
Allocated Past (TB) Raw capacity provisioned to hosts in the past to the current time.
Allocated Linear Forecast(TB)
Raw capacity provisioned to hosts in the future based on a forecast.
Total Provisioned Total provisioned capacity.
Threshold Provisioned An amount of the total allocated capacity that is set as a safety level.If the used capacity is about to cross that threshold, immediate actionis needed.
Used Provisioned (TB) The capacity promised to the storage initiators that is currently beingused.
Allocation Request BasedProject (TB)
Raw capacity provisioned to hosts as projected by capacity requestsusing the Insight Plan license features.
Storage Capacity Trend reportUsage data in the graph and in the table provide a forecast of future storage consumption by start andend time, application, host, tier and business entity based on past trends. Usage data in the graph andin the table show the usage growth rate for the selected business entity and tier.
Accessing this report
To display this report, select the Public Folders > Capacity <version> > Storage Capacity<version> > Dashboards > Storage Capacity Trend.
You can also display this report from the Plan - Capacity Forecast dashboard and the Tier Usage byApplications and Tier Usage by Business Entities reports.
Report generation options
To generate this report, you can select the applications, hosts, tiers, business entities, and time period.You can leave the selections untouched to generate the report for all.
Sample
100 | OnCommand Insight Reporting Guide
Storage Capacity Usage Trends by Timeframe reportThe report shows the storage capacity planning for the entire organization, including all tiers and alldata centers. This line graph gives you visibility into past trends and can serve as a basis for aforecast of storage capacity thresholds.
Accessing this report
To display this report, select Public Folders > Chargeback (version> <version> > Reports >Storage Capacity Usage Trends by Timeframe or Public Folders > Capacity <version> >Storage Capacity <version> > Reports > Storage Capacity Usage Trends by Timeframe.
Report generation options
To generate this report, you select the business entities, applications, hosts, tiers, thresholdpercentage, and time period.
Capacity and chargeback dashboards and reports | 101
Sample
Interpretation
For all trend charts, if there is no data for the corresponding date (for example, if you select End ofQuarter and have no Data Warehouse data for that particular date) the chart will be missing that datapoint.
Report columns
The report includes the following columns.
Date The time line selected to measure the data.
Configured Past (TB) Total raw capacity in past time to the current time.
102 | OnCommand Insight Reporting Guide
Configured Threshold(TB)
Selected percentage of the total raw capacity to be the threshold.
Past Allocation (TB) Raw capacity provisioned to hosts in the past to the current time.
Allocated Forecast Future storage allocation needed based on past trends.
Total Provisioned (TB) Capacity promised to storage initiators. Often used for chargeback.
Threshold Provisioned An amount of the total allocated capacity that is used as a safety level.If the used capacity is about to cross that threshold, immediate actionis needed.
Allocated Provisioned(TB)
Future storage provisioned allocation needed based on past trends.
Used Provisioned (TB) The capacity promised to the storage initiators that is currently beingused.
Storage Utilization by Application and then Host reportThis report provides visibility into current and historical usage of allocated storage resources. Usingthis report, you can verify that requests for additional storage are valid, and that users have managedwell with the resources provided already. Receiving current file system utilization data enables youto make a case for responsible behavior with the application manager or administrator.
Accessing this report
To display this report, select Public Folders > Storage Capacity > Dashboards > CapacityStorage Reports > Storage Utilization by Application and then Host.
Report generation options
To generate this report, you select the applications and hosts.
Sample
Capacity and chargeback dashboards and reports | 103
Interpretation
For each host selected, usage data in the tables show how capacity is used and allocated according toapplication, with capacity breakdown and storage details. You can click on the File System Nameand see more details in the File System Details report, showing Used and Allocated storage.
Report columns
Host Information section
Host Name Selected host name.
Total Capacity VolumeAllocated
The total volume capacity masked usage and/or designated forreplication storage.
Total File SystemAllocated Capacity
The total capacity masked usage and/or designated for replicationstorage.
Total File System UsedCapacity
The sum of all internal volumes' consumed capacity, includingreserved capacity, Snapshot used capacity, Snapshot reserved
104 | OnCommand Insight Reporting Guide
capacity, and storage efficiency overhead. In no internal volumes arepresent, this is the sum of all volumes consumed capacity.
File System Utilization (%) Percentage of storage space used on the file system.
Capacity Breakdown section
File System Name Mounting point or drive letter.
Date Date when data sample was taken.
File SystemAllocated Capacity
The sum of all internal volumes' consumed capacity, including reservedcapacity, Snapshot used capacity, Snapshot reserved capacity, and storageefficiency technology overhead.
File System UsedCapacity
The sum of all internal volumes' consumed capacity, including reservedcapacity, Snapshot used capacity, Snapshot reserved capacity, and storageefficiency overhead. In no internal volumes are present, this is the sum of allvolumes consumed capacity.
Storage Information section
Storage Name Name of the storage array
Volume Name Name of the volume.
Volume Type Vendor-specific type of volume, for example, SFS or B.V. This column alsodisplays replication type, such as striped, sequential, or image.
Is Virtual Indicates that the volume is a virtualized with a "1" in this column.
Usable Capacity available after technologies such as RAID-5 are used, where someof the raw capacity is used for protection purposes.
Raw Physical disk capacity of the volume.
Related references
File System Details report on page 77
Storage Virtualization reportThis report displays the virtual storage, backend storage, volume capacity, and internal volumecapacity data.
Accessing this report
To display this report, select Public Folders > Capacity <version> > Storage Capacity <version>> Reports > Storage Virtualization.
Capacity and chargeback dashboards and reports | 105
Sample
Report columns
The report includes these columns:
Virtual Storage The virtual volume that is exposed to the hosts. This is the "volume" beingmapped and masked to hosts.
Backend Storage A storage array that provides physical storage to the virtualizer.
Volume Allocated The volume capacity that was masked and/or designated for replicationstorage.
Volume Consumed The sum of all volumes' consumed capacity, including reserved capacity,Snapshot used capacity, and storage efficiency technology overhead.
Internal VolumeAllocated
The volume capacity that is masked and/or designated for replicationstorage, taking into account use of technologies such as RAID-5, wheresome of the raw capacity is used for protection purposes.
Internal VolumeConsumed
The amount of capacity taken from the underlying storage pool for thisinternal volume, including reserved capacity, Snapshot copy used capacity,Snapshot copy reserved capacity, and storage efficiency technologyoverhead.
Backend RawCapacity
The physical disk capacity of the backend volume.
Switch Port Capacity by Data Center ReportThis report provides a chart that shows what port speeds are available for each data center.
Accessing this report
To display this report, select Public Folders > Capacity <version> > Port Capacity <version> >Reports > Switch Port Capacity by Data Center.
This report can also be displayed from the Ports by Data Center, Vendor and Ports by Data Center,Vendor, Port Speed reports.
Report generation options
You can select data centers, switch vendors, and port speed for the data in this report.
106 | OnCommand Insight Reporting Guide
Sample
Interpretation
The table in the report gives information on the ports selected for each of several speeds, showing thedata center, the vendor, the individual totals for switch, host, and storage ports in the data center, aswell as the total number of ports.
Capacity and chargeback dashboards and reports | 107
Switch Port Capacity Planning by Timeframe reportThis report provides a forecast of port consumption by data center, switch vendor and port speed todetermine when additional ports are needed.
Accessing this report
To display this report, select Public Folders > Capacity <version> > Port Capacity <version> >Reports > Switch Port Capacity Planning by Timeframe.
You can also display this report from the Port Consumption Forecast report.
Report generation options
You can select the data centers, switch vendors, port speeds, threshold, and time period for the datain this report.
Sample
108 | OnCommand Insight Reporting Guide
Report columns
The report includes the following columns.
Date The timeline selected to measure the data.
Total Ports Total number of active ports.
Threshold Level of the total allocated capacity that is used as a safety level. If the usedcapacity is about to cross that threshold, immediate action is needed.
Used Ports Total number of ports being used.
Used Forecast Amount of time before current capacity will run out.
Tier Trends for Business Entities reportThis report provides trend charts for selected tiers, business entities (tenant, line of business, businessunit, and project), and data centers to compare the trends of total, configured, and total capacity bytier.
Accessing this report
To display this report, select Public Folders > Capacity <version> > Storage Capacity <version>> Reports > Tier Trends for Business Entities.
Report generation options
To generate this report, you select the tiers, data centers, business entities (tenant, line of business,business unit, and project), and time period.
Sample
Capacity and chargeback dashboards and reports | 109
Interpretation
The table displays Physical Usable Capacity values by Business Entity, Tier, and the Unused, Used,Masked not Accessed, and Totals metric for each. If you click on an element in the table, the reportregenerates showing the detailed information for the selected element. When you page down fromthe table, you see the graphs of the trends by tier.
Tier Trends for Storage Devices reportThis report provides trend charts for selected tiers, data centers, and storage models to compare.
Accessing this report
To display this report, select Public Folders > Capacity <version> > Storage Capacity <version>> Reports > Tier Trends for Storage Devices.
Report generation options
To generate this report, you select the tiers, data centers, storage models, and date range.
110 | OnCommand Insight Reporting Guide
Sample
Interpretation
The table within the report displays values showing Physical Usable Capacity by tier and a specifieddate range with Masked Not Accessed, Unused, Used, and Total capacity amounts included for eachtier. You can use this information to observe the following trends:
• Trends of total, configured, and total capacity by tier.• Trends of each tier by total, allocated and configured capacity.
Each element of the table is also presented in a separate graph below the table.
Capacity and chargeback dashboards and reports | 111
Tier Usage Trends reportThis report shows the physical raw capacity trends for the top tier users. The top tiers are selectedbased on the top highest priced tiers.
Accessing this report
To display this report, select Public Folders > Capacity <version> > Storage Capacity <version>> Dashboards > Tier Usage Trends.
Sample
Interpretation
This report displays the physical raw capacity indicator trends and details on top tier usage over aperiod of time. Based on the information, you can make decisions about increasing or decreasing tierusage.
Top Business Entity Consumers by Data Center reportThis bar graph shows the top seven business entities that use capacity in each data center. With thegraph, you can generate and review the detailed usage report on the data centers and tiers that willrun out in the near future.
Accessing the report
To display this report, select Public Folders > Capacity <version> > Storage Capacity <version>> Dashboards > Top Business Entity Consumers by Data Center.
112 | OnCommand Insight Reporting Guide
Sample
More report options
If you click a data center bar in the graph, the report regenerates to show more details for the selecteddata center and business entity.
Interpretation
The table within the report displays percentage values of Provisioned Raw Capacity by data center.The colors in the bars represent the business entities.
Top Utilized Storage Pools reportThis report compares the capacity consumption of the storage pools.
Accessing
To display this report, select Public Folders > Capacity <version> > Storage and Storage PoolCapacity <version> > Reports > Top Utilized Storage Pools.
Virtualized Storage Coverage Trends reportThis report can be used to monitor the current coverage status of projects, for example, when data isbeing migrated from a SAN to a virtualized SAN environment. The report displays the percentage ofmigration to the new virtualized environment within the quarter. The report can also monitor the
Capacity and chargeback dashboards and reports | 113
progress of the project and receive the coverage status according to applications, business units ordata center.
Accessing this report
To display this report, select Public Folders > Capacity <version> > Storage Capacity <version>> Dashboards > Capacity Tiering Reports > Virtualized Storage Coverage Trends.
Report generation options
To generate this report, you select data centers, applications, and business entities for the specifieddate range and grouped by tiers.
Sample
Interpretation
The date range dictates the granularity of the samples in the report. For each period, the reportcontains a single point that represents all values for that period of time. The start and end datesestablish the range of time for which data points are created. The report provides trend charts foreach tier showing the physical capacity and the virtualized and non-virtualized storage types. Thecoverage trends are shown by tiers into separate graphs.
114 | OnCommand Insight Reporting Guide
VM Capacity Summary reportThe VM Capacity Summary report shows capacity information that includes provisioned capacityand commit ratio by data stores. This report provides details about the virtual machine, including itstotal capacity, provisioned capacity, and commit ratio.
Accessing this report
To display this report, select Public Folders > Capacity <version> > VM Capacity <version> >Reports > VM Capacity Summary.
Report generation options
For this report, you select the data store names to be represented.
Sample
Capacity and chargeback dashboards and reports | 115
Interpretation
These definitions and formulas are presented in this report:
Datastore Name of the data store or volume.
Actual Capacity Total amount of space available in the data store.
VM Name Name of the virtual machine or machines.
ESX Host Name of the Hypervisor host.
Provisioned Capacity Amount of space vCenter reports as per guest VMs. Provisioned capacityon the data store on the whole.
Commit Ratio Ratio of data store provisioned capacity/Total capacity of the data store.
VM Cost Accountability reportThis report provides information about the capacity used on each virtual machine by eachapplication. You can select the host, tier, business entity, application, and date. The reportsummarizes capacity by host, application, and business entity.
Accessing this report
To display this report, select Public Folders > Capacity <version> > VM Capacity <version> >Reports > VM Cost Accountability.
Report generation options
For this report, you select hosts, tiers, business entities, and applications that you want to research.For the Historical VM Cost Accountability version of this report, you also select a time frame.
Sample
116 | OnCommand Insight Reporting Guide
Interpretation
You might want to use this report to gain visibility into capacity cost accounting for your VMenvironment (useful for doing chargeback). This report associates VM guest level capacity to theappropriate business entity for cost accounting.
Report columns
The report includes the following columns.
ProvisionedCapacity (GB)
The amount of capacity that a virtual machine can use from its data stores andpromised to the storage initiators. This includes the basic VM capacity fromits virtual disks (VMDKs), but also other items, such as memory swap files,Snapshot files, configuration files, and log files.
Note: Provisioned capacity in Data Warehouse shows different values thanthose in the OnCommand Insight Client. The Client shows provisionedcapacity as the sum of capacity for the virtual machine and includes theVMDKs allocated to it. On the other hand, Data Warehouse shows capacityfor just the VMDKs and just the allocated size, not the physical size.
Business Entity Tenant, line of business, business unit, and project.
Application Name of the application.
Capacity and chargeback dashboards and reports | 117
ESX Host Name of the VMware ESX server.
Guest VM Name of the virtual machine.
Storage Name of the storage system.
Virtualizer Front-end name of the storage system.
Tier Level of service.
Total Total provisioned capacity for the tier.
VM Guests reportThis report provides information about guest operating systems that are running on virtual machines.
Accessing this report
To display this report, select Public Folders > Capacity <version> > VM Capacity <version> >Reports > VM Guests.
Sample
118 | OnCommand Insight Reporting Guide
Interpretation
The report includes the following columns:
Storage Data Center Name of the data center.
Host Data Center The data center for the host displayed here comes from the virtualcenter and not the annotation from the client.
Business Unit Name identifying the BU.
Host Name Name of the host server.
VM Name Name identifying the virtual machine.
VM OS Name of the operating system running the VM.
DNS Name Name of the DNS.
VM Power State Powered On or Off.
VM Power State Change Date Last date that the power state was changed.
Guest OS State State of the guest operating system .
Processors Number of processors in the OS.
Memory Size of memory.
Virtual Center IP IP address of the Virtual Center.
VMDK Names of virtual disks.
Provisioned Capacity (GB) How much capacity has been provisioned for the data center, ingigabytes.
VM Storage Utilization reportThis report provides detailed information on storage capacity usage at the level of the host, datastore, and inactive virtual machines (VMs) to enable increased utilization or reclamation of unusedcapacity. It also displays statistics for available capacity in the data stores and on virtual machinesthat have been inactive for 60 days or more.
Accessing this report
To display this report, select Public Folders > Capacity <version> > VM Capacity <version> >Reports > VM Storage Utilization.
Report generation options
To generate this report, you select the Inactive VM Threshold (in days) and Virtual Center.
Capacity and chargeback dashboards and reports | 119
Sample
The generated report contains a bar graph and several possible sections of tables depending on yourdata.
Report columns
The Unused Capacity - ESX Accessible LUNs not in Datastores table displays report values forunused capacity ESX LUNs that are not in data stores. This data allows you to identify the inactivevirtual machines that are using high tier storage. Each line is a volume.
ESX VMware ESX server.
LUN Number assigned to a logical unit (volume).
Capacity Allocated capacity of the volume.
Tier Tier where the capacity resides.
120 | OnCommand Insight Reporting Guide
Storage Name of the storage array (may be empty if no volume is mapped to the LUN).
Volume Volume name (left blank if no volume is mapped to the LUN).
The Inactive Virtual Machines (not running for 30 days or more) table contains these columns:
VM Virtual machine name.
OS Operating System.
ESX VMware ESX server.
Cluster Name of a cluster of virtualization hosts sharing access to the same SANvolumes or NAS share. A V-Cluster is either a VMware HA cluster or amanually-defined group of hosts. Blank for standard physical servers.
VMDK Name of virtual disk.
Powered Off Since Time when the virtual machine was shut down, if it is not running.
Capacity Allocated capacity of the volume.
Chargeback reportsThe chargeback reports allow administrators and managers to evaluate capacity usage by application,business entity, service level, and tier.
The chargeback reports include capacity accountability, historical capacity accountability, andtrending data.
You can run new reports at any time with refreshed data and publish them to other users. The data forthese reports are built and scheduled from the OnCommand Insight Data Warehouse.
Some reports used for chargeback are also used for capacity reporting.
Chargeback data is impacted by internal volumes:
• For storage without internal volumes, chargeback reports show chargeback by volumes.• For storage with internal volumes:
• If business entities are assigned to volumes, chargeback reports show chargeback by volumes.• If business entities are not assigned to volumes but assigned to qtrees, chargeback reports
show chargeback by qtrees.• If business entities are not assigned to volumes and not assigned to qtrees, chargeback reports
show the internal volume.• The decision whether to show chargeback by volume, qtree or internal volume is made per
each internal volume, so it is possible for different internal volumes in the same storage poolto show chargeback at different levels.
Capacity and chargeback dashboards and reports | 121
Related concepts
Plan - Cost Accounting dashboard on page 67
Business Entity Accountability reportThis report shows the usable capacity of each business entity in terabytes for each tier. Use thisreport to evaluate the usable capacity of each business entity for each tier and generate a chargebackreport.
Accessing this report
To display this report, select Public Folders > Chargeback <version> > Dashboards > BusinessEntity Accountability.
You can also display this report on the Plan - Cost Accounting dashboard.
Sample
More report options
When you click on a value in the table, a Capacity Accountability by Application report is generatedfor the specific business entity. Each type of link shows different data:
• If you click on a business entity link, then the report shows only that business entity and all tiers.• If you click on a tier, the report shows only that tier and all business entities.• If you click on a number the report shows only that tier and business entity.
Business Entity Capacity by Data Center and Tier reportThe pie chart shows the capacity distribution of business entities and how much each one is using forthe different tiers in each data center.
Accessing this report
To display this report, select Public Folders > Chargeback <version> > Dashboards > BusinessEntity Capacity by Data Center and Tier.
122 | OnCommand Insight Reporting Guide
You can also display this report on the Capacity Forecast and the Tiers dashboards.
Sample
More report options
The top seven business entities in each tier are shown. Click a business entity on any portion of thebar graph to see more details.
Capacity Accountability by Application reportThis capacity accountability report shows which business units are using capacity, allowing the datato be accounted for by application, business entities, and tier.
Accessing this report
To display this report, select Public Folders > Chargeback <version> > Reports > CapacityAccountability by Application.
You can also generate this report from the Plan - Cost Accounting dashboard and by clicking on anelement in the Business Entity Accountability report.
Report generation options
To generate this report, you select specific or all tiers, business entities, and applications.
Sample
Capacity and chargeback dashboards and reports | 123
Interpretation
This report supplies the details of which business entities are using capacity and enables you todisplay the data by application, business entity, and tier.
Report columns
The report includes these columns.
Business Entity Business entity selected for the report.
Application Applications associated with the business entities.
Host Host on which the application resides.
Storage Name of the SAN or NAS storage array.
Protection Type Specifies whether this capacity or this resource is used as a replica. Possiblevalues are Volume Replica, Internal Volume Replica, or Qtree replica.
Virtual Capacity Indication of virtualization. If there is no virtualization "False" is listed in thiscolumn.
Tier Service level tier associated with the application. If the resource does not haveany tiers associated with it, "N/A" appears.
124 | OnCommand Insight Reporting Guide
Capacity Accountability by Business Entity and Service Level reportThis report shows which business entities are using capacity, allowing the data to be accounted for bybusiness entity, service level, and protection type. Use this report to understand, plan, implement andmanage tiering to optimize budget versus performance. The non-detail reports show provisionedcapacity, while the detail reports show information about provisioned and used capacity.
Accessing this reportTo access this report, select Public Folders > Chargeback <version> > Reports > CapacityAccountability by Business Entity and Service Level.
You can also generate this report from the Plan - Cost Accounting dashboard.
Report generation options
To generate this report, you select all of the tiers and business entities or specific ones for carefulexamination.
Sample
Interpretation
This report shows capacity for masked capacity as well as accessed capacity. The accountabilityreport associates volumes with hosts, applications, and business entities even when the volume is
Capacity and chargeback dashboards and reports | 125
only masked to the host. If the volume is masked and there is no path (for example, there is a pathoutage), the report still displays volume capacity with the host, application, or business entity.
Report columns
The report includes these columns.
Business Entity Business entity selected for the report.
Application Applications associated with the business entity.
Host Host on which the application resides.
Storage Name of the SAN or NAS storage array.
Protection Type Specifies whether this capacity or this resource is used as a replica. Possiblevalues are Volume Replica, Internal Volume Replica, or Qtree replica.
Virtual Capacity Indication of virtualization. If virtualization is not associated with the host,"False" is listed in this column.
Resource Type Resource that is being charged for the capacity, for example, volume, internalvolume, or qtree. If the charge is by qtree, the volumes in it are not charged. Ifthe charge is by the internal volume, the qtrees or volumes in it are not charged.
Service Level Service level, which is the agreement between a service consumer or applicationand the storage service provider, associated with the application. The servicelevel cost can be the cost of providing the service or the actual price to servicethe consumer, while the tier cost is the average cost per TB for the specific tier.If the resource does not have any tiers associated with it, "N/A" appears.
Capacity Accountability by Business Entity and Service Level Detailsreport
This report shows which business entities are using capacity, allowing the data to be accounted for bybusiness entity and tier and the protection type. Use this report to understand, plan, implement, andmanage tiering to optimize budget versus performance. The non-detail reports show provisionedcapacity, while the detail reports show information about provisioned and used capacity.
Accessing this reportTo access this report, select Public Folders > Chargeback <version> > Reports > CapacityAccountability by Business Entity and Service Level Details.
You can also generate this report from the Plan - Cost Accounting dashboard.
Report generation options
To generate this report, you select any of the service levels, business entities, application names,hosts, and other items for careful examination.
126 | OnCommand Insight Reporting Guide
Sample
Report columns
The report includes these columns.
Business Entity Business entity selected for the report.
Application Applications associated with the business entity.
Host Host on which the application resides.
Storage Name of the SAN or NAS storage array.
Service Level Service level associated with the application. which is the agreement betweena service consumer or application and the storage service provider. The servicelevel cost can be the cost of providing the service or the actual price to servicethe consumer, while the tier cost is the average cost per TB for the specifictier. If the resource does not have any tiers associated with it, "N/A" appears.
Internal Volume Name of storage device exposed to hosts as shares or LUNs.
Qtree Name of qtree within the internal volume.
Capacity and chargeback dashboards and reports | 127
Protection Type Specifies whether this capacity or this resource is used as a replica. Possiblevalues are Volume Replica, Internal Volume Replica, or Qtree replica.
Resource Name Name of the resource that is being charged for the capacity, for example,volume, internal volume, or qtree. If the charge is by qtree, the volumes in itare not charged. If the charge is by the internal volume, the qtrees or volumesin it are not charged.
Resource Type Type of resource that is being charged for the capacity, for example, volume,internal volume, or qtree. If the charge is by qtree, the volumes in it are notcharged. If the charge is by the internal volume, the qtrees or volumes in it arenot charged.
ProvisionedCapacity
Capacity promised to storage initiators
Used Capacity Capacity consumed in the device.
Capacity Accountability by Business Entity and Tier reportThis report shows which business entities are using capacity, allowing the data to be accounted for bybusiness entity and tier and the protection type. Use this report to understand, plan, implement andmanage tiering to optimize budget relative to performance. The non-detail reports show provisionedcapacity, while the detail reports show information about provisioned and used capacity.
Accessing this report
To display this report, select Public Folders > Chargeback <version> > Reports > CapacityAccountability by Business Entity and Tier.
You can also generate this report from the Plan - Cost Accounting dashboard.
Report generation options
To generate this report, you might select all of the tiers and business entities or specific ones forcareful examination.
Sample
128 | OnCommand Insight Reporting Guide
Report columns
The report includes these columns.
Business Entity Business entity selected for the report.
Application Applications associated with the business entity.
Storage Name of the SAN or NAS storage array.
Host Host on which the application resides.
Protection Type Specifies whether this capacity or this resource is used as primary or a replica.
Virtual Capacity Indication of virtualization. If there is no virtual capacity associated with thehost, "False" is listed in the column.
Resource Type Type of resource that is being charged for the capacity, for example, volume,internal volume, or qtree. If the charge is by qtree, the volumes in it are notcharged. If the charge is by the internal volume, the qtrees or volumes in it arenot charged.
Tier Service level tier associated with the application. If the resource does not haveany tiers associated with it, "N/A" appears.
Capacity Accountability by Business Entity and Tier Details reportThis report shows which business entities are using capacity, allowing the data to be accounted for bybusiness entity and tier and the protection type. Use this report to understand, plan, implement, and
Capacity and chargeback dashboards and reports | 129
manage tiering to optimize budget versus performance. The non-detail reports show provisionedcapacity, while the detail reports show information about provisioned and used capacity.
Accessing this reportTo access this report, select Public Folders > Chargeback <version> > Reports > CapacityAccountability by Business Entity and Tier Details.
You can also generate this report from the Plan - Cost Accounting dashboard.
Report generation options
When selecting the parameters for this report, you might select all of the tiers, business entities, andother items or specific ones for careful examination.
Sample
Report columns
The report includes these columns.
Business Entity Business entity selected for the report.
Application Applications associated with the business entity.
Host Host on which the application resides.
Storage Name of the SAN or NAS storage array.
Tier Service level tier associated with the application. If the resource does nothave any tiers associated with it, "N/A" appears.
130 | OnCommand Insight Reporting Guide
Internal Volume Name of storage device exposed to hosts as shares or LUNs.
Qtree Name of qtree within the internal volume.
Protection Type Specifies whether this capacity or this resource is used as a replica. Possiblevalues are Volume Replica, Internal Volume Replica, or Qtree replica.
Resource Name Name of the resource that is being charged for the capacity, for example,volume, internal volume, or qtree. If the charge is by qtree, the volumes in itare not charged. If the charge is by the internal volume, the qtrees orvolumes in it are not charged.
Resource Type Type of resource that is being charged for the capacity, for example, volume,internal volume, or qtree. If the charge is by qtree, the volumes in it are notcharged. If the charge is by the internal volume, the qtrees or volumes in itare not charged.
ProvisionedCapacity (TB)
Capacity promised to storage initiators.
Used Capacity (TB) Capacity consumed in the device.
Capacity Accountability by Business Entity, Service Level, and Tier reportThis report shows which business entities are using capacity, allowing the data to be accounted for bybusiness entity, service level, and protection type. Use this report to understand, plan, implement andmanage tiering to optimize budget versus performance.
Accessing this report
To display this report, select Public Folders > Chargeback <version> > Reports > CapacityAccountability by Business Entity, Service Level, and Tier.
Report generation options
When selecting the parameters for this report, you might select all of the tiers, service levels, andbusiness entities or specific ones for careful examination.
Report columns
The report includes these columns.
Business Entity Business entity selected for the report.
Application Applications associated with the business entity.
Storage Name of the SAN or NAS storage array.
Host Host on which the application resides.
Capacity and chargeback dashboards and reports | 131
ProtectionType
Specifies whether this capacity or this resource is used as primary or a replica.
VirtualCapacity
The configured capacity of the virtual disk. Relates to the actual VMDK files forthis virtual disk in the data store. For VMware thin provisioning, this is themaximum size that the file can reach, not its current size. If the disk is not thinprovisioned, this is the size of the VMDK file.
This size counts against the provisioned capacity taken from the data store. Thesefiles or disks represent only a subset of the provisioned capacity
Service Level Service level associated with the application. which is the agreement between aservice consumer or application and the storage service provider. The servicelevel cost can be the cost of providing the service or the actual price to service theconsumer, while the tier cost is the average cost per TB for the specific tier. If theresource does not have any tiers associated with it, "N/A" appears.
For example, a customer might request that the level of storage service sustains5,000 IOPS. However, because the customer uses only 100 IOPS, the serviceprovider might decide to move this service to a lower tier that sustains only 500IOPS.
Tier Service level tier associated with the application. If the resource does not haveany tiers associated with it, "N/A" appears.
Capacity Accountability by Uncharged Capacity per Internal Volume reportThis report shows uncharged capacity on each internal volume. Uncharged capacity is the totalallocated capacity on the internal volume minus the total capacity charged to internal volume.
Accessing this report
To display this report, select Public Folders > Chargeback <version> > Reports > CapacityAccountability by Uncharged Capacity per Internal Volume.
You can also generate this report from the Plan - Cost Accounting dashboard.
Report generation options
For this report, you select the storage units you want to research.
Sample
132 | OnCommand Insight Reporting Guide
Interpretation
Use this report to determine uncharged capacity on each internal volume. The internal volumeincludes total capacity.
Report columns
Storage Name of the SAN or NAS storage array.
Internal Volume Name of the internal volume.
Allocated Capacity (TB) The capacity that is masked and/or designated for replication storage.
Charged Capacity (TB) The total allocated capacity on the internal volume minus the totalcapacity charged to internal volume.
Uncharged AllocatedCapacity (TB)
Capacity, masked and/or designated for replication storage, that hasnot be charged to an entity.
Historical Capacity Accountability by Application reportThis report shows the physical capacity of storage organized by tier and the hosts, applications, andbusiness units using that storage. This report differs from the Capacity Accountability by ApplicationReport in that you can specify a date for this report rather than simply viewing the latest capacitydata.
Accessing this report
To display this report, select Public Folders > Chargeback <version> > Reports > HistoricalCapacity Accountability by Application.
Report generation options
To generate this report, you can select specific or all tiers, business units, applications, and a date.
Interpretation
This report provides the details of which business entities are using capacity and enables the data tobe grouped by application, business entity, and tier for historical data.
Report columns
Business Entity Business entity selected for the report.
Application Applications associated with the business entity.
Host Host on which the application resides.
Capacity and chargeback dashboards and reports | 133
Guest VM Name of the virtual machine.
ESX Host Name of the virtual machine host.
Storage Name of the SAN or NAS storage array.
Virtual Capacity The configured capacity of the virtual disk. Relates to the actual VMDK filesfor this virtual disk in the data store. For VMware thin provisioning, this is themaximum size that the file can reach, not its current size. If the disk is not thinprovisioned, this is the size of the VMDK file.
This size counts against the provisioned capacity taken from the data store.These files or disks represent only a subset of the provisioned capacity.
Tier Service level tier associated with the application. If the resource does not haveany tiers associated with it, "N/A" appears.
Historical Capacity Accountability by Business Entity and Service LevelReport
This report shows the physical capacity of storage including protection type, categorized by servicelevel, and the hosts, applications, and business entities using that storage. This report differs from theCapacity Accountability by Business Entity and Service Level Report in that for the historical reportyou can specify a date rather than simply viewing the latest capacity data. You might want to viewthis report to determine how to charge back specific business entities for capacity by storage servicelevel.
Accessing this report
To display this report, select Public Folders > Chargeback <version> > Reports > HistoricalCapacity Accountability by Business Entity and Service Level.
You can also generate this report from the Plan - Cost Accounting dashboard.
Report generation options
To generate this report, you select the service level and business entities (tenants, lines of business,business units, and projects).
Sample
134 | OnCommand Insight Reporting Guide
Report columns
The report includes these columns.
Business Entity Business entity selected for the report.
Application Applications associated with the business entity.
Host Host on which the application resides.
Storage Name of the SAN or NAS storage array.
ProtectionType
Specifies whether this capacity or this resource is used as a primary or a replica.
VirtualCapacity
The configured capacity of the virtual disk. Relates to the actual VMDK files forthis virtual disk in the data store. For VMware thin provisioning, this is themaximum size that the file can reach, not its current size. If the disk is not thinprovisioned, this is the size of the VMDK file.
This size counts against the provisioned capacity taken from the data store. Thesefiles or disks represent only a subset of the provisioned capacity
Resource Type Resource that is being charged for the capacity, for example, volume, internalvolume, or qtree. If the charge is by qtree, the volumes in it are not charged. If thecharge is by the internal volume, the qtrees or volumes in it are not charged.
Capacity and chargeback dashboards and reports | 135
Service Level Service level associated with the application. which is the agreement between aservice consumer or application and the storage service provider. The servicelevel cost can be the cost of providing the service or the actual price to service theconsumer, while the tier cost is the average cost per TB for the specific tier. If theresource does not have any tiers associated with it, "N/A" appears.
For example, a customer might request that the level of storage service sustains5,000 IOPS. However, because the customer uses only 100 IOPS, the serviceprovider might decide to move this service to a lower tier that sustains only 500IOPS.
Historical Capacity Accountability by Business Entity and Tier reportThis report shows the physical capacity of storage including protection type sorted by tier, and thehosts, applications, and business entities using that storage. This report differs from the CapacityAccountability by Business Entity and Tier Report in that for the historical report, you can specify adate rather than simply viewing the latest capacity data.
Accessing this report
To display this report, select Public Folders > Chargeback <version> > Reports > HistoricalCapacity Accountability by Business Entity and Tier.
You can also generate this report from the Plan - Cost Accounting dashboard.
Report generation options
To generate this report, you can select all of the tiers and business entities or specific ones and a daterange.
Sample
136 | OnCommand Insight Reporting Guide
Report columns
The report includes these columns.
Business Entity Business entity selected for the report.
Application Applications associated with the business entity.
Host Host on which the application resides.
Storage Name of the SAN or NAS storage array.
Protection Type Indication whether this capacity or this resource is used as primary or a replica.
Virtual Capacity The configured capacity of the virtual disk. Relates to the actual VMDK filesfor this virtual disk in the data store. For VMware thin provisioning, this is themaximum size that the file can reach, not its current size. If the disk is not thinprovisioned, this is the size of the VMDK file.
This size counts against the provisioned capacity taken from the data store.These files or disks represent only a subset of the provisioned capacity.
Resource Type Type of resource that is being charged for the capacity, for example, volume,internal volume, or qtree. If the charge is by qtree, the volumes in it are notcharged. If the charge is by the internal volume, the qtrees or volumes in it arenot charged.
Capacity and chargeback dashboards and reports | 137
Tier Service level tier associated with the application. If the resource does not haveany tiers associated with it, "N/A" appears.
Storage Capacity Usage Trends by Timeframe reportThe report shows the storage capacity planning for the entire organization, including all tiers and alldata centers. This line graph gives you visibility into past trends and can serve as a basis for aforecast of storage capacity thresholds.
Accessing this report
To display this report, select Public Folders > Chargeback (version> <version> > Reports >Storage Capacity Usage Trends by Timeframe or Public Folders > Capacity <version> >Storage Capacity <version> > Reports > Storage Capacity Usage Trends by Timeframe.
Report generation options
To generate this report, you select the business entities, applications, hosts, tiers, thresholdpercentage, and time period.
Sample
138 | OnCommand Insight Reporting Guide
Interpretation
For all trend charts, if there is no data for the corresponding date (for example, if you select End ofQuarter and have no Data Warehouse data for that particular date) the chart will be missing that datapoint.
Report columns
The report includes the following columns.
Date The time line selected to measure the data.
Configured Past (TB) Total raw capacity in past time to the current time.
Configured Threshold(TB)
Selected percentage of the total raw capacity to be the threshold.
Capacity and chargeback dashboards and reports | 139
Past Allocation (TB) Raw capacity provisioned to hosts in the past to the current time.
Allocated Forecast Future storage allocation needed based on past trends.
Total Provisioned (TB) Capacity promised to storage initiators. Often used for chargeback.
Threshold Provisioned An amount of the total allocated capacity that is used as a safety level.If the used capacity is about to cross that threshold, immediate actionis needed.
Allocated Provisioned(TB)
Future storage provisioned allocation needed based on past trends.
Used Provisioned (TB) The capacity promised to the storage initiators that is currently beingused.
Tier Trends for Applications reportThis report provides trend charts for selected tiers, applications, and data centers to show the trendsof capacity used by applications.
Accessing this report
To display this report, select Public Folders > Chargeback <version> > Reports > Tier Trendsfor Applications or Public Folders > Capacity <version> > Storage Capacity <version> >Dashboards > Capacity Tiering Reports > Tier Trends for Applications.
Report generation options
To generate this report, you select the tiers, data centers, applications, and time period. Leave theselection boxes untouched to select all.
Sample
140 | OnCommand Insight Reporting Guide
Interpretation
The table above the graph displays report values showing Provisioned Usable Capacity in terabytes(TB) by tier for all data centers and for applications triggered on a quarterly basis.
Tier Usage by Applications reportThe report consists of a pie chart that shows the percentage distribution of applications and howmuch each one is using the different tiers. The top seven applications are shown in each tier.
Accessing this report
To display this report, select Public Folders > Chargeback <version> > Dashboards > Tier Usageby Applications.
Sample
Capacity and chargeback dashboards and reports | 141
More report options
To display more detailed information, identify a tier pie chart of interest and click on any applicationportion of the chart.
Interpretation
Usage data in the graph and in the table provide a forecast of storage consumption by start and endtime, application, host, tier and business entity based on past trends.
Tier Usage by Business Entity reportThe pie charts show the percentage distribution of the top seven business entities and how much eachone is using the different tiers.
Accessing this report
To display this report, select Public Folders > Chargeback <version> > Dashboards > Tier Usageby Business Entity.
Sample
142 | OnCommand Insight Reporting Guide
Interpretation
Click any item in a pie chart to generate another version of the report focused on the selectedelement.
Top Business Entities Capacity reportThe pie chart shows the top five business entities in terms of the provisioned capacity each has used,measured in terabytes.
Accessing this report
To display this report, select Public Folders > Chargeback <version> > Dashboards > TopBusiness Entities Capacity.
You can also see this report on the Plan - Cost Accounting dashboard.
Sample
Capacity and chargeback dashboards and reports | 143
More report options
When you click on a business entity in the pie chart, the report regenerates focused on the selectedelement.
Top Business Entity Capacity Consumers reportThis report presents a bar graph of the top five business entities according to the provisioned capacity(in terabytes).
Accessing this report
To display only this report, select Public Folders > Chargeback <version> > Dashboards > TopBusiness Entity Capacity Consumers.
You can also access this report from the Plan - Cost Accounting and Plan - Capacity Forecastdashboards.
144 | OnCommand Insight Reporting Guide
Sample
More report options
When you click on an item in the bar graph, the report regenerates focused on the selected element.
Top Business Entity Cost Contributors reportThis report shows the top five business entities and the costs associated with each. If you set a priceper tier, the report provides a quick estimation for the cost of the provisioned capacity per businessentity. The size of each bar in the graph is proportional to the used capacity of a specific tier,multiplied by the price per tier as set in OnCommand Insight Plan.
Accessing the report
To display this report, select Public Folders > Chargeback <version> > Dashboards > TopBusiness Entity Cost Contributors.
You can also see this report on the Plan - Cost Accounting dashboard.
Sample
Capacity and chargeback dashboards and reports | 145
More report options
When you click on a Tier Name in the bar graph, a chargeback report is generated for the specificbusiness entity and tier.
Note: If no price is set in OnCommand Insight, $1/TB is used.
Interpretation
This report provides you with cost information about commercial storage usage.
146 | OnCommand Insight Reporting Guide
Trending of Critical Applications reportThis report shows trending and comparison of allocated capacity for a set of applications over time.The information can be configured by business entity, application, and time period.
Accessing this report
To display this report, select Public Folders > Chargeback <version> > Reports > Trending ofCritical Applications or Public Folders > Capacity <version> > Storage Capacity <version> >Dashboards > Capacity Trending Reports > Trending of Critical Applications.
You can also generate this report from the Plan - Cost Accounting dashboard.
Report generation options
You can select the business entity, application name, and time period for the focus of this report.
Sample
Capacity and chargeback dashboards and reports | 147
Interpretation
The report includes the following information and displays values for Usable Capacity in terabytes.
Time Frame The interval selected to measure the data.
Application Name of the application in the data center.
Storage efficiency reportsThe storage efficiency reports provide efficiency ratings by storage name and technology.
NetApp Storage Capacity Efficiency Rating reportThis report allows you to measure and compare technologies, and over time compare vendors tomanage your environment. It provides efficiency measurements at the level of the data center and theindividual array to allow comparison of arrays, vendors and data centers, providing data sorted bytechnology.
Accessing this report
To display this report, select Public Folders > Storage Efficiency <version> > Reports > NetAppStorage Capacity Efficiency Rating.
Interpretation
This report shows the following:
• For disk failure protection, the calculation of potential loss totals up the losses of multiple disksper type.
• For deduplication gain, the potential gain is the sum of the non-deduplicated volumes multipliedby the average deduplication compression ratio of the deduplicated volumes. At least onededuplicated volume must exist.
• For Thin Provisioning, the potential gain is the total of the (volume size minus volume reserved)plus the total of the (snapshot size minus snapshot reserved).
By viewing the potential efficiency gain if storage efficiency technologies are in use for the entirearray, the report can help you know, for example, what the capacity gain would be if thinprovisioning is operating across all arrays or what the capacity gain would be if deduplication isturned on for the entire array.
Using this report lets you evaluate the current storage capacity efficiency of your environment anddevelop awareness of efficiency technologies that can enhance value and conserve resources.
Different storage technologies can yield increases (gains) or decreases (losses) to capacity. Thefollowing table describes some of these technologies and indicates whether a given technologyrepresents a gain or a loss to capacity.
148 | OnCommand Insight Reporting Guide
StorageTechnology
Gain orLoss
Explanation
Disk failureprotection
Loss Represents the amount of capacity that is used to protect disk groups byRAID level. Example: RAID-4 where a single disk that is using everdisk group for parity. Summing the size of the parity disk generatescapacity loss.
Deduplication Gain Represents data compression or saved capacity in a compression ratio.Example: In a 2:1 compression ratio, for every 1 GB compressedcapacity, there should be 2 GB of uncompressed capacity. This meansthat more space is needed to store the same data without deduplication.
Thinprovisioning
Gain Helps to eliminate over-provisioning by consuming capacity only fromthe capacity that is used by the volume.
Clones Gain The clone shares capacity with its source volume and consumes onlythe capacity that is not mutual to itself and the source volume.
Report columns
The report includes the following columns:
Data Center Location of the storage array.
Storage Type Storage resource manufacturer and family, for example, NetApp FAS.
Model NetApp array model identifier.
Storage Name The name of the NetApp array in your environment.
Raw Capacity GB Physical disk capacity of the resource.
Backend CapacityGB
Total capacity of backend LUNs. Relevant for virtual arrays only.
Storage Technology Storage efficiency technologies, such as thin provisioning, deduplication,and RAID.
If automatic storage tiering is in effect and NetApp Flash Pool technology isused, "Flash Pool" appears.
Gain GB The total capacity gained in this storage by using the specified technology,for example, 100 MB of redundant blocks saved by implementingdeduplication.
Gain % The capacity percentage gained in this storage by using the specifiedtechnology, for example, 10% gain saved by implementing deduplication.
Loss GB The total capacity lost in this storage due to the specified technology, forexample, 10 GB that was used as spare.
Capacity and chargeback dashboards and reports | 149
Loss % The capacity percentage lost due to the specified technology, for example,10% capacity loss.
Potential Gain GB The total capacity potentially gained in this storage if the specifiedtechnology is used to the full extent, for example, by enabling deduplicationin all volumes, a total of 300 MB can be saved.
Potential Gain % The capacity percentage potentially gained if the specified technology isused to the full extent possible.
Efficiency % Capacity improvement achieved using efficiency technologies. Theefficiency of storage is calculated by taking the total storage raw capacityand adding the gainers, then subtracting the consumers of capacity. Finally,divide the total by the total storage raw capacity.
Potential Efficiency(%)
The capacity improvement that could be achieved if the specifiedtechnology is used to the full extent possible.
150 | OnCommand Insight Reporting Guide
Performance reports for business decisions
Managers use the OnCommand Insight performance reports to make business-level decisions. Forexample, the Array Performance report allows a manager to see IOPS compared to capacity to revealstorage that is full, but not being used. The Orphaned Capacity report shows capacity or volumes thatare not being used.
This information allows managers to move or delete unused data and to reallocate capacity instead ofpurchasing new equipment.
Application Profiling by Tier reportYou can review application behavior per tier during a specified time range. You can detect usagepatterns, peaks, and under-use by selecting an application and a time range and viewing a graphicalrepresentation of IOPS and throughput for the application during the specified period.
Accessing this report
To display this report, select Public Folders > Performance <version> > Application VolumeHourly Performance <version> > Reports > Application Profiling by Tier.
Report generation option
To generate this report, you can select a start date and application.
Sample
151
Report interpretation
The report includes these sections: one for IOPS and another for throughput. A line appears for eachtier used by the application and another line for "All Tiers" sums the values from all tiers.
The report includes this data:
Max IOPS Maximum rate at which input and output operations occurred for the volumefor the specified time. I/O operations per second.
Max Throughput Maximum rate at which data was transferred to or from the volume for thespecified time.
Array Performance reportUse this report to see a summary of usage per application, hosts, and storage systems. This reportalso provides information on capacity for orphaned volumes (volumes that have not been accessedduring the period).
Accessing this report
To display this report, select Public Folders > Performance <version> > Volume DailyPerformance <version> > Reports > Array Performance.
Report generation options
You can review data from last week, last month, last quarter, or last year. You can also select toreview IOPS over a specific threshold.
Sample
152 | OnCommand Insight Reporting Guide
Report information
This report could include any of the following sections that apply to your environment:
• Orphaned Summary: The total amount of raw orphaned capacity and total allocated orphanedcapacity among all volumes that have not been accessed throughout the report period.
• Storage Summary: The total orphaned capacity (allocated and raw allocated) per storagecontainer, including maximum observed IOPS, and total IOPS. Only storages with orphanedcapacity are listed. Each line in the report includes storage name, storage model, orphaned rawallocated capacity in GB, orphaned allocated capacity in GB, max IOPS, total IOPS (sum for allvolumes of average of read+write IOPS for each volume) for reporting period.
• Host Summary: The total orphaned capacity (allocated and raw allocated) per host, includingmaximum observed IOPS, and total IOPS. Only hosts with orphaned capacity are listed.
• Orphaned Volumes: Every volume that is orphaned for the report period.
Performance reports for business decisions | 153
• Volumes by IOPS: Every volume that has a total IOPS less or greater than (depending onoperation) than the specified IOPS threshold.
Report columns
The sections in your report might include these columns:
Storage Name of the storage array.
Model Device manufacturer's model.
Raw OrphanedCapacity
The physical capacity of a disk or array; for a volume, the physical storagespace consumed by a volume, including RAID and volume overhead. Anorphaned volume is a volume that has not been accessed for the given time.
AllocatedOrphanedCapacity
The storage space consumed by a volume excluding RAID and volumeoverhead.
OrphanedCapacity
Volume capacity that has been masked, but has not been accessed within agiven time period.
Raw Capacity The physical capacity of a disk or array; for a volume, the physical storagespace consumed by a volume, including RAID and volume overhead.
AllocatedCapacity
Capacity available for use, if known.
Max Total IOPS Maximum rate at which input and output operations occurred for the volumefor the specified time. I/O operations per second.
Total IOPS The sum of average read and write IOPS for the volume for the specifiedtime. For hosts, this is the sum of the average total IOPS for volumes accessedby the host.
Orphaned Capacity reportUse this report to determine the capacity or volumes that are not in use by one application during aspecific time range. The report is based on whether the volume has been accessed. An orphanedvolume is a volume that has not been accessed for the given time.
Accessing this report
To display this report, select Public Folders > Performance <version> > Volume DailyPerformance <version> > Reports > Orphaned Capacity.
154 | OnCommand Insight Reporting Guide
Report generation options
You select data from last week, last month, last quarter, or last year. This report also includes theoption to detect orphaned volumes based on values less than a specified IOPS threshold.
Sample
Report columns
The report includes these columns:
Business Unit Name of business unit.
Application Name of the application.
Tier Service level tier, for example, Gold tier.
Storage Name of the storage array.
Volume Name of the orphaned volume.
Allocated Capacity(current)
The volume capacity masked usage and/or designated for replicationstorage.
Raw Allocated Capacity(current)
The volume capacity masked usage and/or designated for replicationstorage, taking into account the use of technologies such as RAID-5,where some of the raw capacity is used for protection purposes.
Performance reports for business decisions | 155
Performance Accountability by BU and TierUse this report to review the performance and capacity parameters per application and tier usable forchargeback by application or business unit.
Accessing this report
To display this report, select Public Folders > Performance <version> > Application VolumeHourly Performance <version> > Reports > Performance Accountability by BU and Tier.
Report generation options
You can select data from last week, last month, last quarter, or last year. This report also includes theoption to detect orphaned volumes based on values less than a specified IOPS threshold.
Sample
Report columns
The report includes these columns:
Business Unit Name of business unit.
Application Name Name of the application.
156 | OnCommand Insight Reporting Guide
Tier Name Service level tier, for example, Gold tier.
Allocated Capacity(current)
The volume capacity masked usage and/or designated for replicationstorage.
Average Total IOPS Average rate at which input and output operations occurred for thevolume for the specified tier for the specified time. I/O operations persecond.
Average TotalThroughput
Average rate at which data was transferred to or from the volume forthe specified tier for the specified time.
Tiers Overuse reportUse this report to pinpoint for a specific tier all the applications that represent over-uses of that tier.You can determine every application for which maximum IOPS, maximum throughput, or maximumresponse time for its volumes exceeds specified values within the reporting period.
Accessing this report
To display this report, select Public Folders > Performance <version> > Volume DailyPerformance <version> > Reports > Tiers Overuse.
Report generation options
You can select data from last week, last month, last quarter, or last year.
Sample
Performance reports for business decisions | 157
Report columns
The report includes these columns:
Business Unit Name of business unit.
Application Name Name of the application running on the business unit's overused tiers.
Max Total ResponseTime
The maximum time it takes from the moment a request for information issent until the information starts arriving. Response time can be measured indifferent locations in the network. In OnCommand Insight, response timesare measured from within the storage array. This value is measured inmilliseconds (ms).
Max TotalThroughput
Maximum rate at which data was transferred to or from the volume for thespecified time.
Max Total IOPS Maximum rate at which input and output operations occurred for thevolume for the specified time, as I/O operations per second.
Tiers Underuse reportUse this report to pinpoint all the applications that represent under-use of a specific tier. You candetermine every application for which maximum IOPS or maximum throughput for its volumes fallsbelow specified values within the reporting time period.
Accessing this report
To display this report, select Public Folders > Performance <version> > Volume DailyPerformance <version> > Reports > Tiers Underuse.
Report generation options
You can select data from last week, last month, last quarter, or last year.
Sample
158 | OnCommand Insight Reporting Guide
Report columns
The report includes these columns:
Business Unit Name of business unit that is not making full use of its assigned tiers.
Application Name Name of the application running on the tier.
Max Total Throughput Maximum rate at which data was transferred to or from the volume forthe specified time.
Max Total IOPS Maximum rate at which input and output operations occurred for thevolume for the specified time, in I/O operations per second.
No part of this document covered by copyright may be reproduced in any form or by any means—graphic, electronic, or mechanical, including photocopying, recording, taping, or storage in anelectronic retrieval system—without prior written permission of the copyright owner.
Software derived from copyrighted NetApp material is subject to the following license anddisclaimer:
THIS SOFTWARE IS PROVIDED BY NETAPP "AS IS" AND WITHOUT ANY EXPRESS ORIMPLIED WARRANTIES, INCLUDING, BUT NOT LIMITED TO, THE IMPLIEDWARRANTIES OF MERCHANTABILITY AND FITNESS FOR A PARTICULAR PURPOSE,WHICH ARE HEREBY DISCLAIMED. IN NO EVENT SHALL NETAPP BE LIABLE FOR ANYDIRECT, INDIRECT, INCIDENTAL, SPECIAL, EXEMPLARY, OR CONSEQUENTIALDAMAGES (INCLUDING, BUT NOT LIMITED TO, PROCUREMENT OF SUBSTITUTEGOODS OR SERVICES; LOSS OF USE, DATA, OR PROFITS; OR BUSINESSINTERRUPTION) HOWEVER CAUSED AND ON ANY THEORY OF LIABILITY, WHETHERIN CONTRACT, STRICT LIABILITY, OR TORT (INCLUDING NEGLIGENCE OROTHERWISE) ARISING IN ANY WAY OUT OF THE USE OF THIS SOFTWARE, EVEN IFADVISED OF THE POSSIBILITY OF SUCH DAMAGE.
NetApp reserves the right to change any products described herein at any time, and without notice.NetApp assumes no responsibility or liability arising from the use of products described herein,except as expressly agreed to in writing by NetApp. The use or purchase of this product does notconvey a license under any patent rights, trademark rights, or any other intellectual property rights ofNetApp.
The product described in this manual may be protected by one or more U.S. patents, foreign patents,or pending applications.
RESTRICTED RIGHTS LEGEND: Use, duplication, or disclosure by the government is subject torestrictions as set forth in subparagraph (c)(1)(ii) of the Rights in Technical Data and ComputerSoftware clause at DFARS 252.277-7103 (October 1988) and FAR 52-227-19 (June 1987).
160 | OnCommand Insight Reporting Guide
Trademark information
NetApp, the NetApp logo, Network Appliance, the Network Appliance logo, Akorri,ApplianceWatch, ASUP, AutoSupport, BalancePoint, BalancePoint Predictor, Bycast, CampaignExpress, ComplianceClock, Cryptainer, CryptoShred, Data ONTAP, DataFabric, DataFort, Decru,Decru DataFort, DenseStak, Engenio, Engenio logo, E-Stack, FAServer, FastStak, FilerView,FlexCache, FlexClone, FlexPod, FlexScale, FlexShare, FlexSuite, FlexVol, FPolicy, GetSuccessful,gFiler, Go further, faster, Imagine Virtually Anything, Lifetime Key Management, LockVault,Manage ONTAP, MetroCluster, MultiStore, NearStore, NetCache, NOW (NetApp on the Web),Onaro, OnCommand, ONTAPI, OpenKey, PerformanceStak, RAID-DP, ReplicatorX, SANscreen,SANshare, SANtricity, SecureAdmin, SecureShare, Select, Service Builder, Shadow Tape,Simplicity, Simulate ONTAP, SnapCopy, SnapDirector, SnapDrive, SnapFilter, SnapLock,SnapManager, SnapMigrator, SnapMirror, SnapMover, SnapProtect, SnapRestore, Snapshot,SnapSuite, SnapValidator, SnapVault, StorageGRID, StoreVault, the StoreVault logo, SyncMirror,Tech OnTap, The evolution of storage, Topio, vFiler, VFM, Virtual File Manager, VPolicy, WAFL,Web Filer, and XBB are trademarks or registered trademarks of NetApp, Inc. in the United States,other countries, or both.
IBM, the IBM logo, and ibm.com are trademarks or registered trademarks of International BusinessMachines Corporation in the United States, other countries, or both. A complete and current list ofother IBM trademarks is available on the web at www.ibm.com/legal/copytrade.shtml.
Apple is a registered trademark and QuickTime is a trademark of Apple, Inc. in the United Statesand/or other countries. Microsoft is a registered trademark and Windows Media is a trademark ofMicrosoft Corporation in the United States and/or other countries. RealAudio, RealNetworks,RealPlayer, RealSystem, RealText, and RealVideo are registered trademarks and RealMedia,RealProxy, and SureStream are trademarks of RealNetworks, Inc. in the United States and/or othercountries.
All other brands or products are trademarks or registered trademarks of their respective holders andshould be treated as such.
NetApp, Inc. is a licensee of the CompactFlash and CF Logo trademarks.
NetApp, Inc. NetCache is certified RealSystem compatible.
You can help us to improve the quality of our documentation by sending us your feedback.
Your feedback is important in helping us to provide the most accurate and high-quality information.If you have suggestions for improving this document, send us your comments by email to [email protected]. To help us direct your comments to the correct division, include in thesubject line the product name, version, and operating system.
You can also contact us in the following ways:
• NetApp, Inc., 495 East Java Drive, Sunnyvale, CA 94089 U.S.• Telephone: +1 (408) 822-6000• Fax: +1 (408) 822-4501• Support telephone: +1 (888) 463-8277
Ports by Data Center and Vendor report 83, 84Ports by Data Center, Vendor and Port Speed report 84,
85product documentation
list of 11properties
reports 17
Q
Qtree report 49Qtree with Configuration Problems report 50, 51
R
Replicas report 51, 52
164 | OnCommand Insight Reporting Guide
reportsaccessing 14accessing capacity 70accessing inventory 33assisting business decisions 151capacity 65chargeback 121common questions answered 9creating your own 20detailed 30filtering data before generating 16finding pre-defined 10formatting and scheduling 17IBM documentation 15inventory 26, 33licenses control data 8locating pre-defined 15pre-defined 8setting properties 17types 14
resourcesaverage cost report 71
Risk Index for Over Provisioned Business Entitiesreport 87, 88
Risk Index for Over Provisioned Data Centers report 89,90
Risk Index for Over Provisioned Storage Pools report91, 92
Risk Index for Over Provisioned Tiers report 93, 94ROI Model report 94, 95
S
SAN Path Violations report 52, 53SAN Summary report 54selecting output format
Storage Pools report 56, 57Storage Summary report 58Storage Utilization by Application then Host Report
103, 104Storage Virtualization Report 105, 106Switch Connectivity report 59, 60Switch Port Capacity by Data Center Report 106, 107Switch Port Capacity Planning by Timeframe report
108, 109switch ports
fabric summary 39, 40switches
host connectivity 45
TTier Trends for Applications report 140, 141Tier Trends for Business Entities report 109, 110Tier Trends for Storage Devices report 110, 111Tier Usage by Applications report 141, 142Tier Usage by Business Entity report 142, 143Tier Usage Trends report 112tiers