One- and two-dimensional, differential, reflective fiberdisplacement sensors
Mark Johnson and Gabriel Goodman
A family of differentially connected, multimode fiber reflectometers is described, which detects absolute po-sition of a specularly or diffusely reflecting linear or point target. Low noise-equivalent displacement (0.026nm/AVHz) and bipolar output make this sensor type ideal for use with feedback controlled mechanical stageswith submicron precision. Several algorithms for estimating the location of the target point from reflectedintensities are investigated and compared through high-resolution error surface plotting.
1. Introduction
Optical fiber sensors are currently being widely in-vestigated as detectors of physical parameters, offeringhigh sensitivity through exotic effects, and use in dif-ficult measurement environments.' Just as important,though not today so topical, are more conventionalsensors of object positions and motions in the industrialsetting.2- Examples of such sensors include linear androtary position encoders for metrology, testing, andmechanical feedback control. Here too, optics andoptical fibers offer great advantages in the constructionof rugged low-cost high-precision sensors.3 The sensorfamily to be described delivers a high-resolution one-and two-axis measure of a target's position and is usefulprimarily in robotics and micromechanics.
II. One-Dimensional Sensor
The 1-D differential fiber reflectometer is shown inFig. 1. Light from a high brightness 0.8 3-Mm wave-length light emitting diode (LED) is coupled into a long,50-Mm core, 125-Am diameter, 0.2-numerical aperture(N.A.) graded-index communications fiber. Light fromthe polished end of this fiber illuminates a mask orsubstrate carrying a lithographically formed line re-flector. A small percentage of the light diffusely scat-tered or specularly reflected from the line is recoupledinto two receiving fibers placed in contact with andparallel to the transmitting fiber. Each receiving guide
The authors are with IBM T. J. Watson Research Center, P.O. Box218, Yorktown Heights, New York 10598.
(100-Mrm core, 140-Mm diameter, 0.3 N.A.) is terminatedin a low-noise photodetector and amplifier, shownschematically in the figure. As the mask is scannedtransversely in the X direction past the fiber array, eachreceiver detects an intensity pulse. Due to the sepa-ration of receiving fibers, the two detected signals arenot perfectly superimposed, and so their difference isnot zero, showing in fact the S-shaped responses (A -B)AI, (A - B)c. of the figure. The exact shape of thisresponse is a complex function of reflector linewidth,reflectivity, and fiber far-field pattern. The two curvesof the figure were formed with a specularly reflectingaluminum line (A - B)A1 and an oxidized copper line (A- B)cu, both of -100-Mm width.
For each differential fiber response symmetry guar-antees a null in the difference signal (A - B) directlyover the reflecting line. This null, together with thehigh signal-to-noise (S/N) of the total measurementsystem, suggests useful application in closed-loopservo-controlled positioning systems. An active mag-netic bearing using two such sensors has already beendescribed.4 The copper line of the (A - B)cu responseis typical of circuit traces in modern high density,printed wiring boards, making the differential fiberprobe useful for robotic trace following and probing.However, most of our studies have been directed towardmicropositioning systems where both the moving objectand also its mask are under the control of our optimi-zation. This optimization will be described now.
Ill. Linewidth OptimizationThe differential response measured above is a func-
tion of the reflector linewidth chosen. Figure 2 showsthis response measured as a function of tranverse po-sition for a range of linewidths from 25 to 200 Am (theline is effectively infinite in the Y direction). In eachcase, the Z-axis probe-mask separation was adjusted formaximum peak output signal. It is seen that for line-
Fig. 1. One-dimensional differential fiber reflectometer. A maskwith linear reflector recouples light from a central to two neighboringoptical fibers. Scanning the mask transversely along the X axisproduces the S-shaped responses (A - B), which are different for
specular aluminum and diffusely reflecting copper lines.
widths near 125-150 Am, the peak-to-peak signal leveland also the central linearity are optimized. At bothsmaller and larger linewidths, the two individual re-ceiving fiber signals overlap with degraded linearity.This optimum can of course be changed through choiceof fiber dimensions and through image-relaying opticalsystems. For the 150-Mm line, the central responseregion is -56 ,m wide and deviates from linearity by'1%.
IV. Focus Optimization
A second optimization parameter of the differentialfiber sensor is its depth of field. Figure 3 shows the150-Mtm line of the previous measurement, measured ata range of probe-mask separations. The peak sensi-tivity occurs at a separation of 440 Am. At closer sep-arations, degradation of sensitivity is rapid, it beingreduced to 10% of the peak value in -270-Mm move-ment. At larger separations, the same degradation isonly reached at +2320 gim. Hence, very usabletransverse detection sensitivity is available even at a fewmillimeters separation. This is also convenient inrobotic applications where coarse motions at nonopti-mum but safely large separations may be necessary.
V. Signal-To-Noise
The accuracy of any closed-loop positioning systemwhich uses such a sensor as a reference is determinedby its signal-to-noise. The edge emitting AlGaAs LEDsused in our experiments couple -100 MW into eachsmall-core fiber. Of this, only 1.2-MW peak is receivedby each collection fiber. Using individual LF356 FEToperational amplifiers (0.01-pA/\/Hz current noisespectral density) in the transimpedance mode, inex-pensive, large area photodiodes (50-nA dark current),and 2-MQ feedback resistors, the noise contributionsof dark current and thermal noise are approximatelyequal. We measure a total noise density -0.3 MV//Hzor a S/N -90 dB in 10-kHz bandwidth. Using the150-Mum aluminum reflecting line, the sensor gain in thecentral region was 0.012 V/Mm. Hence the noiseequivalent displacement for this sensor was 0.026
Fig. 2. Differential output A - B plotted as a function of transversedisplacement and also of the reflecting linewidth.
Peak ResponsPeak Response Differential Output
Fig. 3. Differential output plotted as a function of transverse dis-placement and also of the axial position of the sensor. From the peakresponse at 440-gm separation, the response degrades rapidly moving
toward the mask and more slowly at larger separations.
nm//Hz at midaudio frequencies. This agrees wellwith calculated levels. Below 40 Hz, some excess flickernoise was present.
Substitution of very low dark current photodetectors(e.g., United Detector PIN-040A photodiodes; 600-pAmaximum dark current) and larger feedback resistancescan easily improve this minimum resolvable displace-ment by an order of magnitude, although stability ofthis level will require much better mechanical design.
The S/N could also be improved through applicationof a higher-power source such as a semiconductor laser.However, a large part of the gain is offset in this case bycoherent interference effects due to its narrow opticalbandwidth, and by amplitude instability. SuperradiantLEDs, highly multimode lasers, and/or more complexcoupling arrangements would effect some improve-ment.
VI. Two-Dimensional Sensor
A 2-D version of the differential fiber reflectometeris shown in Fig. 4. To aid construction, identical fibersare used, compressed into a close packed array. Thefibers used are 100-Mm core, 14 0-Mm o.d., 0.3-N.A.graded-index communications fibers. As before, thecentral fiber is coupled to a LED source, while each re-ceiving fiber has its own detector and amplifier. Thesensor views a 175-Mm diam circular, evaporated alu-minum dot. As in the 1-D device, the fibers are pottedin epoxy inside a glass tube, the whole being protectedby a 2.5-mm steel ferrule. For certain environments the
Mask[Fig. 4. Two-dimensional fiber reflectometer. A packed array ofseven fibers illuminates and receives reflected light from a circular
reflecting dot.
array is protected by a 50-um thick sapphire cover plate,but the measurements to be shown are for a simplypolished sensor.
VII. Position Estimation
The first difficulty in position (ad) estimation of thetrue reflector position (X,Y) from the six intensities Ii,where Ii is the received power of fiber i, is the hexagonalsymmetry of the fiber array. One solution is to forceCartesian symmetry from the sensor by opticallysumming the outputs of two pairs of fibers: (I2 +3) - (5 + I6); I '- I - 4 While this connection re-
quires only four detectors, it was felt preferable tomaintain the sensor's symmetry through detection ofeach Is and to compute (,¢ in software. Given an at-tached microprocessor carrying this out, further oper-ations such as signal channel gain equalization andoffset compensation become trivial. The redundancyalso improves the accuracy, especially vis-a-vis algo-rithms for linearization of the sensor output, the seconddifficulty.
This second problem is the choice of mapping of theIi to estimated positions ,. An infinite number ofthese mappings exist. The simplest algorithm (Fig. 5)is based on the observed linearity of the central regionoutput of the 1-D sensors and the assumption that thedifferential output from a pair of opposing fibers, IiIi+3,is independent of real position of the reflector perpen-dicular to the (i,i + 3) diameter. Thus the projectedposition of the reflector on the (i,i + 3) diameter is as-sumed proportional to the differential output. Theestimate tv is then located at the intersection of thestraight line position loci determined by two pairs ofopposing fibers.
To determine the validity of this simple, linear algo-rithm, a uniform raster of real-space points X, Y wasprobed, and the six received intensities recorded. Foreach point, the estimate (,was calculated. Two of thethree fiber pairs led to a , Figure 5 shows this 30 X30 raster of measurements processed using this algo-rithm. Vertical and horizontal grid lines have beendrawn between points to allow easy visualization of thesensor's distortion; this is equivalent to a convergencetest of pincushion/barrel distortion in TV parlance.Grid points are separated in real space by 4 Mm. It isseen that, in the central region of 15 X 15 points, themapping XY - t is tolerable. Further from thesensor's nominal center, the distortion becomes ex-
. .. . . . . . . . . . . . . .CV
-48 -32 -16 0 18 32 48Calculated X Displacement (im)
Fig. 5. Raster of 30 X 30 measurements of four of the six fiber in-tensities. The intensities have been mapped to an estimated (,¢position using the linear algorithm shown in the insert, where theradial distance to the foot of the perpendicular is the differential signal
of the corresponding fiber pair.
a)
True Dialacement
AO0o
L48 -32 -18 0 18 32 48
Calculated X Displacement (im)
Fig. 6. Mapping of the previous figure with the three individualposition estimates averaged.
treme, estimated points collapse to the origin, and thesensor no longer sees the reflecting dot.
A better position estimate , is obtained by averagingthe estimates from the three possible combinations offiber pairs. This is shown in Fig. 6. Here the symmetryof the fiber array, shown in the insert, is more clearlyvisible.
To better visualize the quantitative nature of thisdistortion, but not its qualitative type, it is useful tocompute the vectorial distance of the estimated position#, from the true position X,Y. The Y < 0 half-spaceof this error surface is shown plotted in Fig. 7. Awayfrom the origin, the error rises approximately linearlyto --'30 Am, after which it increases more rapidly.This is to be expected qualitatively from the 1-D re-flectometer traces of Figs. 2 and 3.
Fig. 7. Error surface of the data of Fig. 6. Vector distances of truereflector position from estimated position are plotted vertically as a
function of the X,Y position.
5'
54
0
0
-40 -30 -20 -10 0 10 20 30 40
X Position (m)
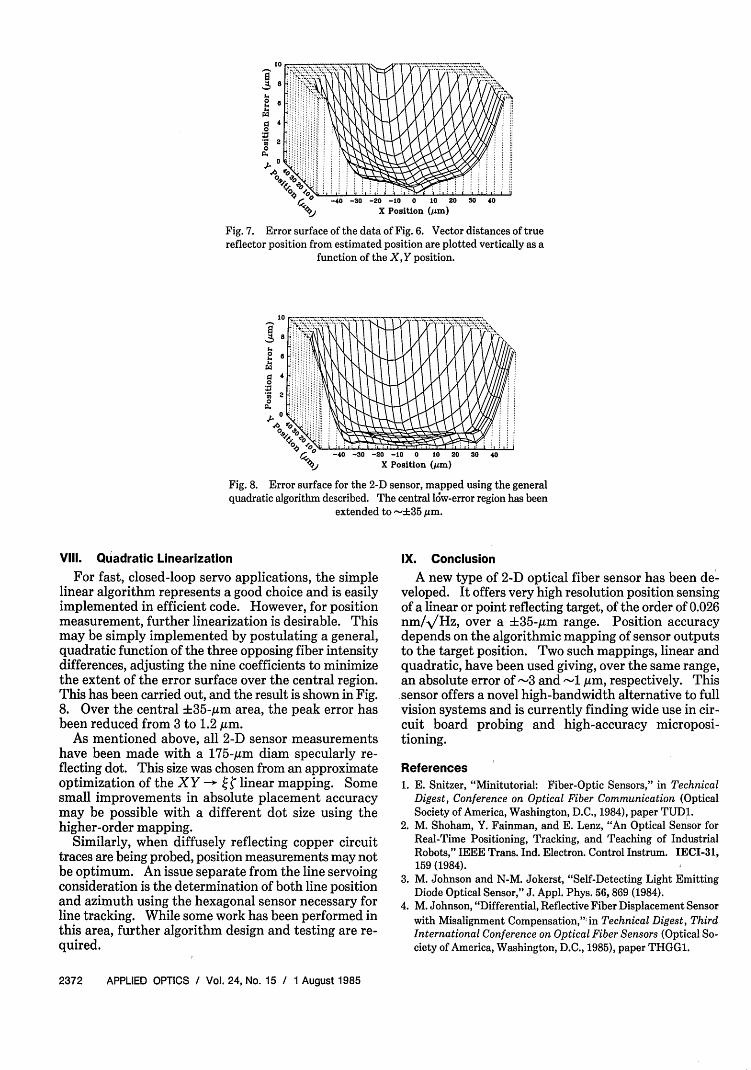
Fig. 8. Error surface for the 2-D sensor, mapped using the generalquadratic algorithm described. The central low-error region has been
extended to -+35 im.
Vil. Quadratic Linearization
For fast, closed-loop servo applications, the simplelinear algorithm represents a good choice and is easilyimplemented in efficient code. However, for positionmeasurement, further linearization is desirable. Thismay be simply implemented by postulating a general,quadratic function of the three opposing fiber intensitydifferences, adjusting the nine coefficients to minimizethe extent of the error surface over the central region.This has been carried out, and the result is shown in Fig.8. Over the central +35-Mm area, the peak error hasbeen reduced from 3 to 1.2 Mm.
As mentioned above, all 2-D sensor measurementshave been made with a 175-Mm diam specularly re-flecting dot. This size was chosen from an approximateoptimization of the XY - > linear mapping. Somesmall improvements in absolute placement accuracymay be possible with a different dot size using thehigher-order mapping.
Similarly, when diffusely reflecting copper circuittraces are being probed, position measurements may notbe optimum. An issue separate from the line servoingconsideration is the determination of both line positionand azimuth using the hexagonal sensor necessary forline tracking. While some work has been performed inthis area, further algorithm design and testing are re-quired.
IX. Conclusion
A new type of 2-D optical fiber sensor has been de-veloped. It offers very high resolution position sensingof a linear or point reflecting target, of the order of 0.026nm//Hz, over a +35-Mm range. Position accuracydepends on the algorithmic mapping of sensor outputsto the target position. Two such mappings, linear andquadratic, have been used giving, over the same range,an absolute error of -3 and -1 Mm, respectively. Thissensor offers a novel high-bandwidth alternative to fullvision systems and is currently finding wide use in cir-cuit board probing and high-accuracy microposi-tioning.
References1. E. Snitzer, "Minitutorial: Fiber-Optic Sensors," in Technical
Digest, Conference on Optical Fiber Communication (OpticalSociety of America, Washington, D.C., 1984), paper TUD1.
2. M. Shoham, Y. Fainman, and E. Lenz, "An Optical Sensor forReal-Time Positioning, Tracking, and Teaching of IndustrialRobots," IEEE Trans. Ind. Electron. Control Instrum. IECI-31,159 (1984).
3. M. Johnson and N-M. Jokerst, "Self-Detecting Light EmittingDiode Optical Sensor," J. Appl. Phys. 56, 869 (1984).
4. M. Johnson, "Differential, Reflective Fiber Displacement Sensorwith Misalignment Compensation," in Technical Digest, ThirdInternational Conference on Optical Fiber Sensors (Optical So-ciety of America, Washington, D.C., 1985), paper THGG1.