2/12/14, 6:57 PM c04 Page 1 of 31 http://www.boomer.org/c/p4/c04/c04.html PHAR 7633 Chapter 4 One Compartment IV Bolus IV Bolus One Compartment Model Student Objectives for this Chapter After completing the material in this chapter each student should:- understand the separate assumptions associated with the one compartment model, rapid IV bolus dosing and linear elimination understand the properties of first order kinetics, linear models be able to write the differential equations for a simple pharmacokinetic model be able to define, use, and calculate the parameters: kel (elimination rate constant) V (apparent volume of distribution) t 1/2 (half-life) AUC (area under the concentration versus time curve) CL (clearance) as they apply to a one compartment linear model be able to use the integrated equations for a one compartment linear model to perform various dose and dosing regimen calculations Definition: Pharmacokinetics is the study of drug and/or metabolite kinetics in the body. It deals with a mathematical description of the rates of drug movement into, within and exit from the body. It also includes the study of drug metabolism or biotransformation rates. The body is a very complex system and a drug undergoes many steps as it is being absorbed, distributed through the body, metabolized or excreted (ADME). Figure 5.1.1 Drug Disposition The drug also interacts with receptors and causes therapeutic and/or toxic responses. Although the details of drug kinetics are complicated it is fortunate that we can often approximate drug kinetic processes using "simple" mathematical models.
Transcript
2/12/14, 6:57 PMc04
Page 1 of 31http://www.boomer.org/c/p4/c04/c04.html
PHAR 7633 Chapter 4
One Compartment IV Bolus
IV Bolus One Compartment Model
Student Objectives for this Chapter
After completing the material in this chapter each student should:-
understand the separate assumptions associated with the one compartment model, rapid IV bolus dosing andlinear eliminationunderstand the properties of first order kinetics, linear modelsbe able to write the differential equations for a simple pharmacokinetic modelbe able to define, use, and calculate the parameters:
kel (elimination rate constant)V (apparent volume of distribution)t1/2 (half-life)AUC (area under the concentration versus time curve)CL (clearance)
as they apply to a one compartment linear modelbe able to use the integrated equations for a one compartment linear model to perform various dose anddosing regimen calculations
Definition: Pharmacokinetics is the study of drug and/or metabolite kinetics in the body. It deals with amathematical description of the rates of drug movement into, within and exit from the body. It also includes thestudy of drug metabolism or biotransformation rates. The body is a very complex system and a drug undergoesmany steps as it is being absorbed, distributed through the body, metabolized or excreted (ADME).
Figure 5.1.1 Drug Disposition
The drug also interacts with receptors and causes therapeutic and/or toxic responses. Although the details of drugkinetics are complicated it is fortunate that we can often approximate drug kinetic processes using "simple"mathematical models.
2/12/14, 6:57 PMc04
Page 2 of 31http://www.boomer.org/c/p4/c04/c04.html
This page was last modified: Wednesday 25 Jan 2012 at 09:48 AM
Material on this website should be used for Educational or Self-Study Purposes Only
Page 3 of 31http://www.boomer.org/c/p4/c04/c04.html
PHAR 7633 Chapter 4
One Compartment IV Bolus
AssumptionsWe will start the course with a one compartment - linear model. Also, we will first consider drug kinetics after arapid intravenous injection, an IV bolus injection. According to this model we will consider the body to behave as asingle well-mixed container. To use this model mathematically we need to make a number of assumptions.
1. One compartment
The drug in the blood is in rapid equilibrium with drug in the extravascular tissues. The drug concentration may notbe equal in each tissue or fluid however we will assume that they are proportional to the concentration of drug in theblood at all times. This is not an exact representation however it is useful for a number of drugs to a reasonableapproximation.
2. Rapid Mixing
We also need to assume that the drug is mixed instantaneously in blood or plasma. The actual time taken for mixingis usually very short, within a few of minutes, and in comparison with normal sampling times it is insignificant. Weusually don't sample fast enough to see drug mixing in the blood.
3. Linear Model
We will assume that drug elimination follows first order kinetics. First order kinetics means that the rate of changeof drug concentration by any process is directly proportional to the drug concentration remaining to undertake thatprocess. Remember first order kinetics is an assumption of a linear model not a one compartment model. If we havea linear if we double the dose, the concentration will double at each time point.
Figure 4.2.1 Scheme for a One Compartment Model, Intravenous (IV) Bolus Administration
This page was last modified: Thursday 24 Jan 2013 at 12:21 PM
Material on this website should be used for Educational or Self-Study Purposes Only
Page 4 of 31http://www.boomer.org/c/p4/c04/c04.html
PHAR 7633 Chapter 4
One Compartment IV Bolus
Linear Model - First Order KineticsFirst-order kinetics
To illustrate first order kinetics we might consider what would happen if we were to give a drug by iv bolusinjection, collect blood samples at various times and measure the plasma concentrations of the drug. We might see asteady decrease in concentration as the drug is eliminated, as shown in Figure 4.3.1.
Figure 4.3.1. Concentration versus time
2/12/14, 6:57 PMc04
Page 5 of 31http://www.boomer.org/c/p4/c04/c04.html
Rate versus Cp
If we measure the slope of this curve at a number of times we are actually measuring the rate of change ofconcentration at each time point, ΔCp/Δt, represented by the straight line tangents in Figure 4.3.2.
Figure 4.3.2 Same as Figure 4.3.1 with Tangents shown
Now if we plot this rate of change versus the plasma concentration, for each data point, we will get a straight linewhen first order kinetics are obeyed. This is shown in Figure 4.3.3.
Figure 4.3.3 Plot of ΔCp/Δt versus Cp for first order process
2/12/14, 6:57 PMc04
Page 6 of 31http://www.boomer.org/c/p4/c04/c04.html
This behavior can be expressed mathematically as:-
Equation 4.3.1
This page was last modified: Tuesday 25 May 2010 at 09:02 PM
Material on this website should be used for Educational or Self-Study Purposes Only
Page 7 of 31http://www.boomer.org/c/p4/c04/c04.html
PHAR 7633 Chapter 4
One Compartment IV Bolus
One Compartment Model
Scheme or Diagram describing the ModelThe one compartment pharmacokinetic model can be represented schematically as:-
Figure 4.4.1 Scheme for a One Compartment Model, Intravenous (IV) Bolus Administration
Developing the Differential Equation
From the previous page on Figure 4.3.2 we estimated the slope of the Cp versus time line at various times. PlottingΔCp/Δ (the slope) versus Cp produced a straight line plot (Figure 4.3.3). Thus the rate of change of Cp versus timeis proportional to the concentration remaining to be eliminated, Cp. The slope of this line. The proportionalityconstant can be defined as kel, the elimination rate constant. If we measure the slope over very small time intervalswe are calculating the tangent to the line. We can now say that the rate of change of Cp versus time is the differentialof the concentration with respect to time as Δt approaches 0; ΔCp/Δt approaches dCp/dt which gives:
Equation 4.4.1 Rate of Change of Concentration versus Concentration
Equation 4.4.1 is a differential equation for the one-compartment model after an IV bolus administration. Bytaking very small time steps we are going from the gross or large time interval term ΔCp/Δt to the continuouslyvarying dCp/dt term. Note, the negative sign in front of the kel term. The slope or tangent is decreasing or negativefor positive concentration values.
Equation 4.4.1 relates the rate of change of Cp versus time. We can also relate the rate of elimination to theconcentration remaining. Previously, we developed the required differential equations by looking at the arrowsleaving or entering a component of the model. In Figure 4.4.1 there is one arrow leaving one component. Thus wecould write the differential equation for the model shown above as Equation 4.4.1.
This page was last modified: Thursday 12 Apr 2012 at 11:57 AM
Material on this website should be used for Educational or Self-Study Purposes Only
Page 8 of 31http://www.boomer.org/c/p4/c04/c04.html
PHAR 7633 Chapter 4
One Compartment IV Bolus
Integrated EquationsThe differential equations developed on the previous page provide concise descriptions of the rate of change of drugconcentration (dCp/dt) or the elimination rate (dX/dt). However, they can be difficult to use when trying todetermine kel or CL. Measuring the tangent of the Cp versus time plot can not be determined accurately. Later in theChapter dealing with the Analysis of Urine Data we will describe measuring the rate of excretion directly from thedata. However, integrated forms of Equation 4.5.1 (Eqn 4.4.1) are generally more useful.
Laplace transforms or other methods can be used to integrate Equation 4.5.1.
Equation 4.5.1 Rate of Change of Concentration versus Concentration
to give
Equation 4.5.2 Integrated Equation for Cp versus Time
This equation describes the single exponential decline in drug concentration as a function of time. This fall inplasma concentration is called mono-exponential decay. If we know kel and Cp0 we could calculate Cp at any timeafter a single IV bolus dose. However, it still isn't very convenient for estimating a value of kel from concentrationversus time data. We could use a non linear regression program such as Boomer however for estimation purposesusing graph paper we would prefer a straight line equation. A straight line equation can be achieved by taking thenatural logarithm of both side of Equation 4.5.2
Equation 4.5.3 Ln(Cp) versus Time
This integrated (logarithmic) form of the equation for Cp represents a straight line equation, that is an equation ofthe form: y = a - m • t with a = intercept and m = slope.
Page 9 of 31http://www.boomer.org/c/p4/c04/c04.html
Plotting ln(Cp) versus t should give a straight line with a slope of - kel and an intercept of ln(Cp0).
Figure 4.5.1 Linear plot of ln(Cp) versus time
NOTICE, there are no UNITS for ln(Cp) in Figure 4.5.1. There are units of hour for time (X axis) so the slope hasunits of time-1 e.g. min-1, hr-1.
Now we can measure kel by determining Cp versus time and plotting ln(Cp) versus time.
Alternately we could use semi-log graph paper. As mentioned earlier the scale on the y-axis are proportional to thelog of the number, not the number itself. This plot allows us to calculate the slope and thus kel given Cp versus timedata.
Figure 4.5.2. Semi-log plot of Cp versus time
Click on the figure to view the interactive graph Use the links below for Internet Explorer
Page 11 of 31http://www.boomer.org/c/p4/c04/c04.html
PHAR 7633 Chapter 4
One Compartment IV Bolus
Apparent volume of distribution, V
Figure 4.6.1 Concentration as a function of Time
We can use Equation 4.6.1 to calculate the plasma concentration at any time when we know kel and Cp0. However,usually we don't know Cp0 ahead of time, but we do know the dose. A dose in mass units, maybe in mg. Tocalculate Cp0 we need to know the volume that the drug is distributed into. That is, the apparent volume of themixing container, the body. This apparent volume of distribution is not a physiological volume. It won't be lowerthan blood or plasma volume but for some drugs it can be much larger than body volume. It is a mathematical'fudge' factor relating the amount of drug in the body and the concentration of drug in the measured compartment,usually plasma.
Defining Equations:
Equation 4.6.2 Definition for Apparent Volume of Distribution
Equation 4.6.3 Relationship between Amount and Concentration
Immediately after the intravenous dose is administered the amount of drug in the body is the IV dose. Thus:
Equation 4.6.4 Volume calculated from Dose and Cp0
or
Equation 4.6.5 Initial Concentration calculated from Dose and V
Combining Equation 4.6.4 and Equation 4.6.1 we are able to derive an equation for drug concentration as a functionof time given values of Dose, V, and kel.
2/12/14, 6:57 PMc04
Page 12 of 31http://www.boomer.org/c/p4/c04/c04.html
Equation 4.6.6 Concentration as a function of Time
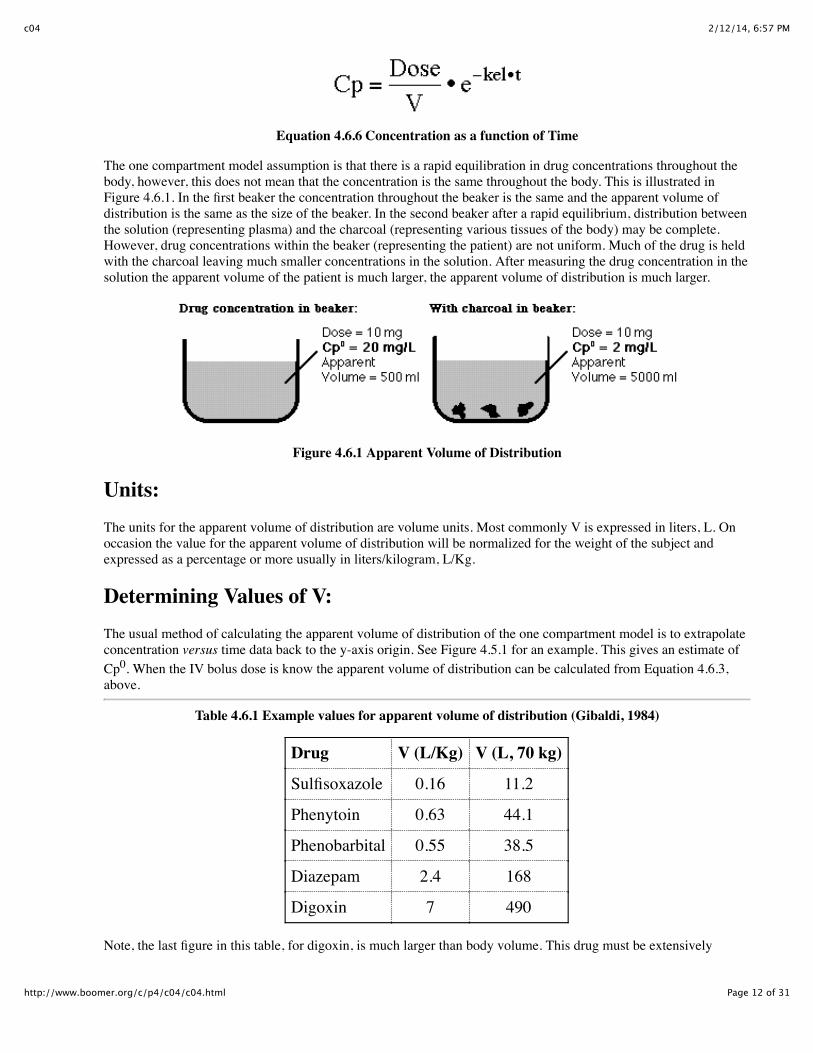
The one compartment model assumption is that there is a rapid equilibration in drug concentrations throughout thebody, however, this does not mean that the concentration is the same throughout the body. This is illustrated inFigure 4.6.1. In the first beaker the concentration throughout the beaker is the same and the apparent volume ofdistribution is the same as the size of the beaker. In the second beaker after a rapid equilibrium, distribution betweenthe solution (representing plasma) and the charcoal (representing various tissues of the body) may be complete.However, drug concentrations within the beaker (representing the patient) are not uniform. Much of the drug is heldwith the charcoal leaving much smaller concentrations in the solution. After measuring the drug concentration in thesolution the apparent volume of the patient is much larger, the apparent volume of distribution is much larger.
Figure 4.6.1 Apparent Volume of Distribution
Units:The units for the apparent volume of distribution are volume units. Most commonly V is expressed in liters, L. Onoccasion the value for the apparent volume of distribution will be normalized for the weight of the subject andexpressed as a percentage or more usually in liters/kilogram, L/Kg.
Determining Values of V:The usual method of calculating the apparent volume of distribution of the one compartment model is to extrapolateconcentration versus time data back to the y-axis origin. See Figure 4.5.1 for an example. This gives an estimate ofCp0. When the IV bolus dose is know the apparent volume of distribution can be calculated from Equation 4.6.3,above.
Table 4.6.1 Example values for apparent volume of distribution (Gibaldi, 1984)
Drug V (L/Kg) V (L, 70 kg)
Sulfisoxazole 0.16 11.2
Phenytoin 0.63 44.1
Phenobarbital 0.55 38.5
Diazepam 2.4 168
Digoxin 7 490
Note, the last figure in this table, for digoxin, is much larger than body volume. This drug must be extensively
Page 13 of 31http://www.boomer.org/c/p4/c04/c04.html
distributed into tissues, leaving low concentrations in the plasma, thus the body as a whole appears to have a verylarge volume of distribution. Remember, this is not a physiological volume.
The line in the figure below, Figure 4.6.2, was calculated with a dose of 450 mg, apparent volume of distribution of15 L and elimination rate constant of 0.20 hr-1. Calculate the curve with other parameter values using the interactivegraph.
Figure 4.6.2. Concentration versus time
Click on the figure to view the interactive graph Use the links below for Internet Explorer
Linear - kel/V Semi-log - kel/V
Linear - CL/V Semi-log - CL/V
References
Gibaldi, M. 1984 "Biopharmaceutics and Clinical Pharmacokinetics", 3rd ed., Lea & Febiger, Chapter 12,page 214Activated carbon at WikipediaVolume has been discussed on the PharmPK listserv
This page was last modified: Tuesday 08 Jan 2013 at 02:20 PM
Material on this website should be used for Educational or Self-Study Purposes Only
Page 14 of 31http://www.boomer.org/c/p4/c04/c04.html
PHAR 7633 Chapter 4
One Compartment IV Bolus
Area under the plasma concentration time curve, AUCThe area under the plasma (serum, or blood) concentration versus time curve (AUC) has an number of importantuses in toxicology, biopharmaceutics and pharmacokinetics.
Toxicology AUC can be used as a measure of drug exposure. It is derived from drug concentration and time so itgives a measure how much - how long a drug stays in a body. A long, low concentration exposure may be asimportant as shorter but higher concentration. Some drugs are dosed using AUC to quantitate the maximumtolerated exposure (AUC Dosing).
Biopharmaceutics The AUC measured after administration of a drug product is an important parameter in thecomparison of drug products. Studies can be performed whereby different drug products may be given to a panel ofsubject on separate equations. These bioequivalency or bioavailability studies can be analysed by comparing AUCvalues.
Pharmacokinetics Drug AUC values can be used to determine other pharmacokinetic parameters, such as clearanceor bioavailability, F. Similar techniques can be used to calculate area under the first moment curve (AUMC) and thusmean resident times (MRT).
The area under the plasma concentration versus time curve (AUC) has units of concentration times time. Forexample, mg.hr/L or mg.hr.L-1. AUC is used extensively in the calculation drug product performance, that is dosageform bioavailability. This is covered more extensively in Chapter 9. AUC has also been used to quantitate drugexposure (concentration times time) to limit drug exposure or toxicology assessment. AUC and other areacalculations are also used in non-compartmental pharmacokinetic parameter estimation as described in Chapter 20and Clearance described on the next page.
The calculation of AUC using the trapezoidal rule was previously described in Chapter 2.
References
AUC has been discussed on the PharmPK listserv.
This page was last modified: Tuesday 08 Jan 2013 at 02:22 PM
Material on this website should be used for Educational or Self-Study Purposes Only
Page 15 of 31http://www.boomer.org/c/p4/c04/c04.html
PHAR 7633 Chapter 4
One Compartment IV Bolus
Total Body Clearance, CLTotal body clearance or clearance is an important pharmacokinetic parameter that describes how quickly a drug iseliminated from the body. It is often defined as the volume of blood or plasma completely cleared of the drug pertime. However, it may be easier to view it as the proportionality constant relating the rate of elimination and drugconcentration. The rate of elimination of a drug can be described by Equation 4.8.1.
Equation 4.8.1 Rate of Elimination versus Concentration
In Equation 4.8.1 the elimination rate, dX/dt, is related to the concentration of drug remaining. The proportionalityconstant for this relationship is Clearance. The symbol for clearance is CL and the units are volume per time such asml/min, L/hr.
Equation 4.8.1 can be rearranged to solve for clearance.
Equation 4.8.2 Clearance calculated from Rate and Concentration
Clearance can be calculated from this equation by measuring the amount of drug eliminated during some timeinterval and the drug concentration at the midpoint of this collection interval. The clearance of the endogenousmaterial, creatinine, is measured by this method as described in Chapter 16 to provide a measure of renal function.The renal clearance of other compounds can be calculated in a similar fashion.
Clearance can also be calculated using the integral of Equation 4.8.2. Integrating dX/dt and Cp with respect to timegive Dose and AUC, respectively. The total amount that can be eliminated is the total amount administered, that is,the dose. Thus clearance can be calculated from the dose and the calculated area under the concentration versus timecurve, AUC.
Equation 4.8.3 Clearance calculated from Dose and AUC
Page 16 of 31http://www.boomer.org/c/p4/c04/c04.html
In the case of the one compartment model with an IV bolus dose the rate of elimination can be expressed as:
thus a value for Total Body Clearance, CL, can be estimated from kel and V for the one compartment model.
Equation 4.8.4 Clearance calculated from kel and V
The clearance of a drug can be used to understand the processes involved in drug elimination, distribution andmetabolism. Relating clearance to a patient renal or hepatic function can be used in the determination of suitabledrug dosage regimens.
Although clearance may be calculated using Equation 4.8.4 a more fundamental calculation may be thedetermination of kel and half-life from CL and V.
AND
Equation 4.8.5 kel and half-life as a function of V and CL
Figure 4.8.1. Concentration versus time
Click on the figure to view the interactive graph Use the links below for Internet Explorer
Page 17 of 31http://www.boomer.org/c/p4/c04/c04.html
Semi-log - CL/V
This applet was compiled with a newer version of Java. Please let me know if your older Java doesn't work withthese applets but does work with the the applet below. Thank you. [email protected]
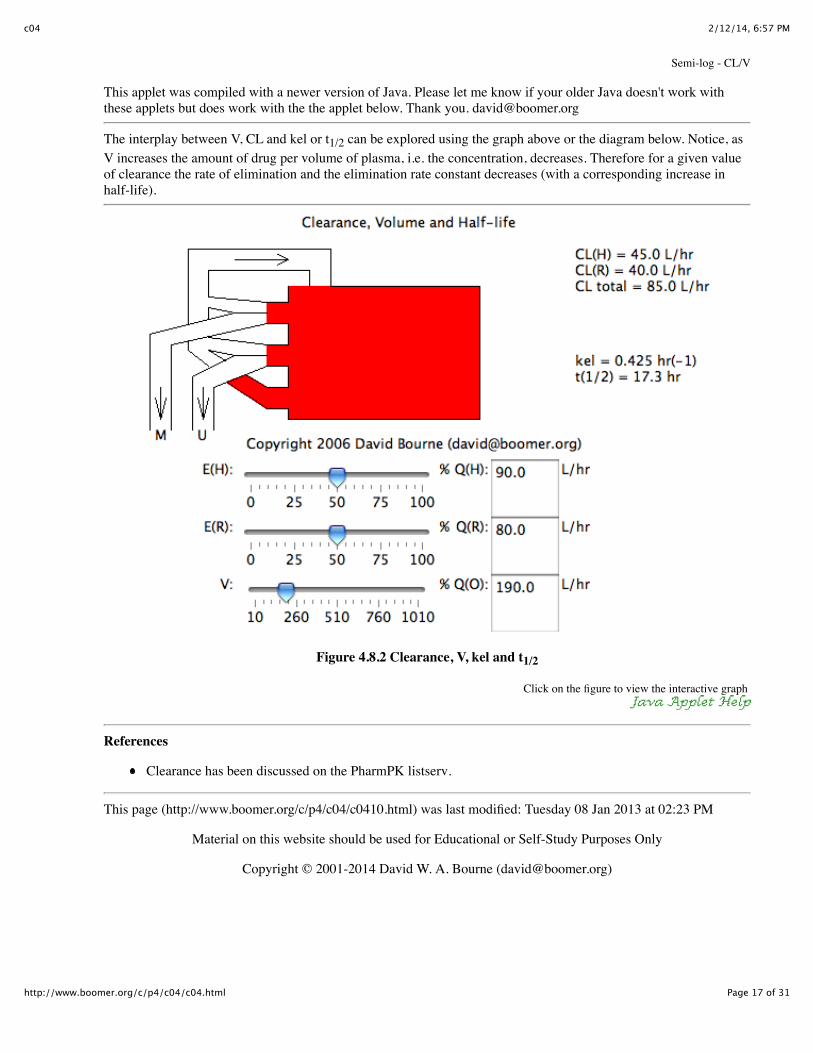
The interplay between V, CL and kel or t1/2 can be explored using the graph above or the diagram below. Notice, asV increases the amount of drug per volume of plasma, i.e. the concentration, decreases. Therefore for a given valueof clearance the rate of elimination and the elimination rate constant decreases (with a corresponding increase inhalf-life).
Figure 4.8.2 Clearance, V, kel and t1/2
Click on the figure to view the interactive graph
References
Clearance has been discussed on the PharmPK listserv.
This page (http://www.boomer.org/c/p4/c04/c0410.html) was last modified: Tuesday 08 Jan 2013 at 02:23 PM
Material on this website should be used for Educational or Self-Study Purposes Only
Page 18 of 31http://www.boomer.org/c/p4/c04/c04.html
PHAR 7633 Chapter 4
One Compartment IV Bolus
Elimination Rate Constant, kelThe elimination rate constant (abbreviated as kel, k10, and sometimes ke) is the first order rate constant describingdrug elimination from the body. This is an overall elimination rate constant describing removal of the drug by allelimination processes including excretion and metabolism. Metabolites are different chemical entities and have theirown elimination rate constant.
The elimination rate constant is the proportionality constant relating the rate of change drug concentration andconcentration OR the rate of elimination of the drug and the amount of drug remaining to be eliminated.
Defining Equations:Table 4.9.1 Equations Defining kel
Equation 4.9.1 Rate of Change of Cpversus Cp
Equation 4.9.2 Elimination Rate versus AmountRemaining, X
Units:
By inspection of Equations 4.9.1. or 4.9.2 it can be seen that the units for kel are time-1, for example hr-1, min-1, orday-1. In both equations the rate expression is divided by Cp or X, respectively to provide units for kel. Thus:
Table 4.9.2 Units for kel
Units for kel from Equation 4.9.1 Units for kel from Equation 4.9.2
Determining Values of kel:From the integrated equation presented on the previous page:
Equation 4.9.3 Ln(Cp) versus time
2/12/14, 6:57 PMc04
Page 19 of 31http://www.boomer.org/c/p4/c04/c04.html
Plotting ln(Cp) values versus t, time should result in a straight line with a slope equal to -kel, thus kel can becalculated as:
Equation 4.9.4 kel from -slope
Thus with two value for Cp and time data a value for kel can be determined. With more than two Cp - time datapoints it is possible to plot the data on semi-log graph paper and draw a 'best-fit' line through the data points. Thisplot is shown on the previous page. The best answer for kel can be calculated by taking points at either end of the'best-fit' line. This approach has been covered in more detail earlier in Chapter 2.
Note: It is important to distinguish between the elimination rate and the elimination rate constant. The rate (tangentor slope, dCp/dt) changes as the concentration changes, however, for a linear model the rate constant (kel) isconstant, it does not change.
Table 4.9.3. Example Values for Elimination Rate Constant (Ritschel, 1992)
Drug kel, hr-1
Acetaminophen 0.277
Diazepam 0.021
Digoxin 0.0161
Gentamicin 0.347
Lidocaine 0.39
Theophylline 0.126
References
Ritschel, W.A. 1992 Handbook of Basic Pharmacokinetics, 4th ed., Drug Intelligence Publications, p 533-549Elimination rate constant has been discussed on the PharmPK listserv.
This page was last modified: Thursday 24 Jan 2013 at 09:31 AM
Material on this website should be used for Educational or Self-Study Purposes Only
Page 20 of 31http://www.boomer.org/c/p4/c04/c04.html
PHAR 7633 Chapter 4
One Compartment IV Bolus
Half-life of Elimination, t1/2
Another important property of first order kinetics is the half-life of elimination, t1/2.
Defining EquationThe half-life is the time taken for the plasma concentration to fall to half its original value. Units for this parameterare units of time such as hour, minute, or day. Thus if Cp is the concentration at time one, Cp/2 is the concentrationat time one half-life later:-
Equation 4.10.1
Equation 4.10.2
Equation 4.10.3
Equation 4.10.4
Equation 4.10.5
OR
Equation 4.10.6
Note: Independent of concentration. This a property of first order processes
These equations can be used as an approximate method of calculating kel. If we look at a plot of Cp versus time onsemi-log graph paper.
2/12/14, 6:57 PMc04
Page 21 of 31http://www.boomer.org/c/p4/c04/c04.html
Figure 4.10.1 Semi-log Plot of Cp versus Time Illustrating t1/2 Calculation
The steps to take are:
1. Draw a line through the points (this tends to average the data)2. Pick any Cp and t1 on the line3. Determine Cp/2 and t2 using the line4. Calculate t1/2 as (t2 - t1)
And finally kel = 0.693/t1/2 (Equation 4.10.5)
You might also consider determining Cp/4 or Cp/8 after two half-lives or three half-lives, respectively. This shouldprovide a more accurate answer as the differences in Cp and t will be larger.
The line smooths out the bumps. There may be less accurate data points, so by putting in a line you average the data.The half-life is the same whether going from 40 to 20 or from 10 to 5 mg/L. This is a property of the first orderprocess.
Note:
Go from:
Cp - > Cp/2 in 1 half-life i.e. 50.0 % lost 50.0 %Cp - > Cp/4 in 2 half-lives i.e. 25.0 % lost 75.0 %Cp - > Cp/8 in 3 half-lives i.e. 12.5 % lost 87.5 %Cp - > Cp/16 in 4 half-lives i.e. 6.25 % lost 93.75 %Cp - > Cp/32 in 5 half-lives i.e. 3.125 % lost 96.875 %Cp - > Cp/64 in 6 half-lives i.e. 1.563 % lost 98.438 %Cp - > Cp/128 in 7 half-lives i.e. 0.781 % lost 99.219 %
Thus over 95 % is lost or eliminated after 5 half-lives. Typically, with pharmacokinetic processes, this is consideredthe completion (my definition unless told otherwise) of the process [Although in theory it takes an infinite time].Others may wish to wait 7 half-lives where over 99% of the process is complete. Others have suggested that threehalf-lives are sufficient.
2/12/14, 6:57 PMc04
Page 22 of 31http://www.boomer.org/c/p4/c04/c04.html
Table 4.10.1. Example Values for Elimination Half-life (Ritschel and Kearns, 2004)
Drug t1/2, hr
Acetaminophen 2.5
Diazepam 33
Digoxin 43
Gentamicin 2
Lidocaine 1.8
Theophylline 5.5
The half-life describes the time it takes for a drug concentration (or other process) to fall to half the original value.For first order processes (as described and derived as above) this time is independent of concentration. When thekinetics are described by non-linear (non first order) kinetics, for example Michaelis-Menten kinetics, the half-life atone concentration may be quite different from the half-life at another concentration.
In the pharmacokinetic area of study the half-life of a drug usually refers to the biological or terminal half-life.These terms have different meaning for some people. I tend to view them both as referring to half-life measured forthe terminal or slowest slope on the semi-log drug concentration versus time plot. At low concentration moreprocesses tend to follow first order kinetics. However, at later times with lower concentrations assay sensitivity canbe a serious problem. Also, if absorption is very slow the slowest slope may refer to the absorption process insteadof drug disposition.
References
Ritschel, W.A. and Kearns, G.L. 2004 Handbook of Basic Pharmacokinetics ... including ClinicalApplications, 6th ed., American Pharmaceutical Association, Washington, DC ISBN 1-58212-054-4 pp 369-401Half-life has been discussed on the PharmPK listserv.Other Pharmacokinetic textbooks
This page was last modified: Thursday 24 Jan 2013 at 09:20 AM
Material on this website should be used for Educational or Self-Study Purposes Only
Page 23 of 31http://www.boomer.org/c/p4/c04/c04.html
PHAR 7633 Chapter 4
One Compartment IV Bolus
IV Bolus - Example 1Question: What is the concentration of drug 0, 2 and 4 hours after a dose of 500 mg. Known pharmacokineticparameters are apparent volume of distribution, V is 30 liter and the elimination rate constant, kel is 0.2 hr-1
Answer: Use Equation 4.11.1 to calculate the required concentrations
Equation 4.11.1 Concentration as a Function of Time
Thus:
Try your own calculation
Calculator 4.11.1 Calculate Cpt after an IV Bolus
IV Bolus Dose: 500
Apparent Volume of Distribution: 30 Cannot be zero
Elimination Rate Constant: 0.2
Time since IV Dose: 2
Calculate (using JavaScript)
The answer Cpt is:
If you get the Error Message Value is not a numeric literal or NaN this probably means that one of the requiredparameter fields is empty or a value is inappropriate.
This page (http://www.boomer.org/c/p4/c04/c0411.html) was last modified: Sunday 13 Jan 2013 at 03:33 PM
2/12/14, 6:57 PMc04
Page 24 of 31http://www.boomer.org/c/p4/c04/c04.html
Material on this website should be used for Educational or Self-Study Purposes Only
Page 25 of 31http://www.boomer.org/c/p4/c04/c04.html
PHAR 7633 Chapter 4
One Compartment IV Bolus
IV Bolus - Example 2We can also calculate the pharmacokinetic parameters kel and V if we know the dose given and the plasmaconcentrations at two (or more) times after an IV bolus administration. This time we will use Equation 4.12.1
Equation 4.12.1 Kel calculated from Two Concentration Values
Question: If Cp2 hours is 4.5 mg/liter and Cp6 hours is 3.7 mg/liter after a 400 mg IV bolus dose what are the valuesof kel and V.
Now using either the 2 hour or the 6 hour data point calculate the concentration at time zero.
And now
Equation 4.12.2 V from Dose and Cp0
and
2/12/14, 6:57 PMc04
Page 26 of 31http://www.boomer.org/c/p4/c04/c04.html
Equation 4.12.3 Clearance from kel and V
Try your own calculation
Calculator 4.12.1 Calculate Parameter Values from Two Data Points Collected after an IV Bolus
IV Bolus Dose: 400
First concentration: 4.5
Time of first Cp value: 2
Second concentration: 3.7
Time of second Cp value: 6
Calculate (using JavaScript)
kel is:
t1/2 is:
Cp0 is:
V is:
and Clearance is:
If you get the Error Message Value is not a numeric literal or NaN this probably means that one of the requiredparameter fields is empty or a value is inappropriate.
Another example. A 45 yr, 74 kg male patient with severe nafcillin-resistent Staph. aureus infection is started on anew drug. He is given 1000 mg as a loading dose over 60 minutes (however, we will assume this is an IV bolus).This patient has poor renal function so we sample his blood at 2 and 12 hours to determine the pharmacokinetics ofthis drug in this patient. The concentrations were 18.6 and 13.1 mg/L, respectively. If the minimum effectiveconcentration is 10 mg/L calculate the when the next dose should given AND the dose required to increase theconcentration back close to the maximum therapeutic concentration or 25 mg/L. HINT: Calculate kel, Cp0,t(10mg/L), V, and next dose.
Page 27 of 31http://www.boomer.org/c/p4/c04/c04.html
PHAR 7633 Chapter 4
One Compartment IV Bolus
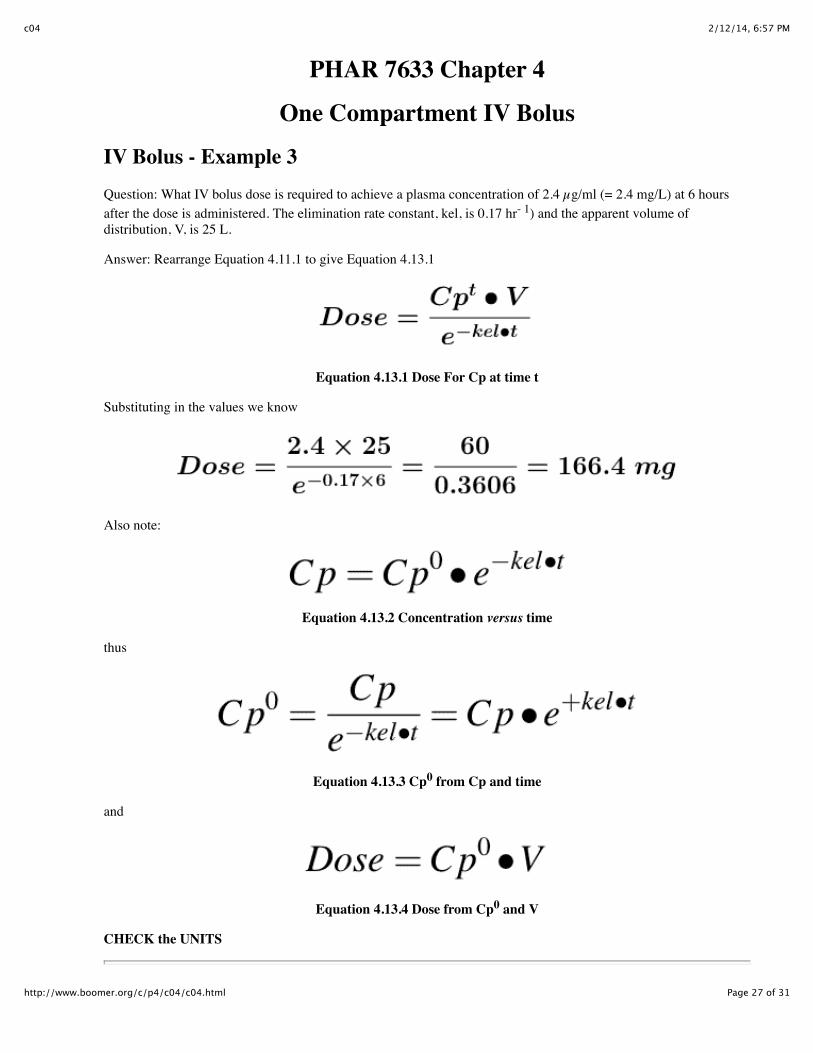
IV Bolus - Example 3Question: What IV bolus dose is required to achieve a plasma concentration of 2.4 µg/ml (= 2.4 mg/L) at 6 hoursafter the dose is administered. The elimination rate constant, kel, is 0.17 hr- 1) and the apparent volume ofdistribution, V, is 25 L.
Answer: Rearrange Equation 4.11.1 to give Equation 4.13.1
Equation 4.13.1 Dose For Cp at time t
Substituting in the values we know
Also note:
Equation 4.13.2 Concentration versus time
thus
Equation 4.13.3 Cp0 from Cp and time
and
Equation 4.13.4 Dose from Cp0 and V
CHECK the UNITS
2/12/14, 6:57 PMc04
Page 28 of 31http://www.boomer.org/c/p4/c04/c04.html
Try your own calculation
Calculator 4.13.1 Calculate the Required IV Bolus Dose
Elimination rate constant: 0.17
Apparent Volume of Distribution: 25 Cannot be zero
Keep Cp above: 2.4
for how long: 6
Calculate (using JavaScript)
Cp0 is:
and the required Dose is:
If you get the Error Message Value is not a numeric literal or NaN this probably means that one of the requiredparameter fields is empty or a value is inappropriate.
This page (http://www.boomer.org/c/p4/c04/c0413.html) was last modified: Sunday 13 Jan 2013 at 03:34 PM
Material on this website should be used for Educational or Self-Study Purposes Only
Page 29 of 31http://www.boomer.org/c/p4/c04/c04.html
PHAR 7633 Chapter 4
One Compartment IV Bolus
IV Bolus - Example 4Question: After an I.V. bolus dose of 500 mg the data collected in Table 4.14.1 were collected. Calculate kel and V.
Table 4.14.1 Concentration versus Time Data
Time (hr) 1 2 3 4 6 8 10
Cp (mcg/ml) 72 51 33 20 14 9 4
Plot the data on semi-log graph paper (Figure 4.14.1) and determine Cp1, Cp2, t1 and t2.
Figure 4.14.1 Plot of Cp versus Time on Semi-log Graph Paper After an I.V. Bolus Dose of 500 mg.
and
2/12/14, 6:57 PMc04
Page 30 of 31http://www.boomer.org/c/p4/c04/c04.html
Figure 4.14.2 V from dose and Cp0
and
Equation 4.12.3 Clearance from kel and V
Try your own calculation
Calculator 4.14.1 Calculate Parameter Values from Two Data Points from a Line drawn through DataCollected after an IV Bolus
IV Bolus Dose: 500
First concentration: 87.1
Time of first Cp value: 0
Second concentration: 4.17
Time of second Cp value: 10
Calculate
kel is:
t1/2 is:
Cp0 is:
V is:
and Total Body Clearance is:
If you get the Error Message Value is not a numeric literal or NaN this probably means that one of the requiredparameter fields is empty or a value is inappropriate.
For practice you can plot these data collected after an IV bolus dose and estimate pharmacokinetic parameters.
Student Objectives for this ChapterThis page (http://www.boomer.org/c/p4/c04/c0414.html) was last modified: Tuesday 25 May 2010 at 09:02 PM