1 One-Dimensional Response of Sandwich Plates to Underwater Blast: Fluid-Structure Interaction Experiments and Simulations A. Schiffer * and V.L. Tagarielli Department of Aeronautics, Imperial College London, SW7 2AZ, UK Abstract Fluid-structure interaction (FSI) experiments and finite element (FE) calculations are performed in order to examine the one-dimensional response of water-backed and air-backed sandwich plates subject to blast loading in either deep or shallow water. The sandwich plates comprise rigid face sheets and low-density foam cores. Experiments are conducted in a transparent shock tube, allowing measurements of both structural response and cavitation processes in the fluid. Measurements are found in good agreement with predictions and allow concluding that the advantages of using the sandwich construction over the monolithic are maximised for the case of water-backed sandwich plates in deep water. Keywords: shock waves, foam material, impact testing, finite elements, cavitation Submitted to International Journal of Impact Engineering, Dec 2013 * Corresponding author: Tel.: +44 (0)2075 945129, E-mail address: [email protected]
Transcript
1
One-Dimensional Response of Sandwich Plates to Underwater Blast:
Fluid-Structure Interaction Experiments and Simulations
A. Schiffer* and V.L. Tagarielli
Department of Aeronautics, Imperial College London, SW7 2AZ, UK
Abstract
Fluid-structure interaction (FSI) experiments and finite element (FE) calculations are
performed in order to examine the one-dimensional response of water-backed and air-backed
sandwich plates subject to blast loading in either deep or shallow water. The sandwich plates
comprise rigid face sheets and low-density foam cores. Experiments are conducted in a
transparent shock tube, allowing measurements of both structural response and cavitation
processes in the fluid. Measurements are found in good agreement with predictions and allow
concluding that the advantages of using the sandwich construction over the monolithic are
maximised for the case of water-backed sandwich plates in deep water.
Underwater explosions give rise to spherical shock waves, travelling in water at
approximately sonic speed [1] and impinging on surrounding structures. At sufficient distance
from the point of detonation, such waves can be taken as planar and their shape can be
described by an exponentially decaying pressure versus time pulse, with peak pressure and
decay time depending on the mass and type of explosive as well as on the distance from the
detonation point [2].
In order to design structural components against underwater blast, fluid-structure
interaction (FSI) needs to be thoroughly understood. First studies on FSI date back to World
War II; Taylor [3] theoretically investigated the response of a free-standing rigid plate loaded
by an underwater shock wave and found that the momentum transmitted to the plate is
decreased by reducing its mass, with the reductions attributed to the occurrence of cavitation
at the fluid-structure interface.
Kennard [4] theoretically examined the one-dimensional phenomena consequent to
shock-wave induced cavitation in elastic liquids. He found that when the pressure drops
below the cavitation limit at a point in the fluid, two ‘breaking fronts’ emerge from this point
and propagate in opposite directions, defining an expanding pool of cavitated liquid.
Subsequently such breaking fronts may arrest, invert their motion and become ‘closing
fronts’, forcing contraction of the cavitation zone. The evolution of the cavitation process
depends on the problem geometry, the structural response, the characteristics of the blast
wave and on the hydrostatic pressure in the fluid prior to the blast event.
During the last decade extensive research was conducted to assess the advantage of
replacing monolithic structures by sandwich panels of equivalent mass. Several numerical and
theoretical studies have shown that sandwich constructions can outperform monolithic
designs of equal mass for a large range of core topologies [5-9]. These studies concluded that
upon loading a sandwich plate with an exponentially decaying pulse, cavitation initiates at a
finite distance from the fluid-structure interface, as a consequence of the support offered by
the sandwich core to the front face sheet.
Deshpande and Fleck [10] and Hutchinson and Xue [11] developed analytical models
for the 1D response of sandwich plates subject to blast in shallow water and treated FSI
subsequent to first cavitation by conjecturing the existence, as a consequence of FSI, of an
attached layer of water to the front face sheet, increasing the momentum transmitted to the
sandwich plate. Later, Liang et al. [5] and McMeeking et al. [12] provided more detailed
3
analytical models for FSI in underwater blast loading of sandwich structures; in particular, the
models of McMeeking et al. [12] assumed that the cavitated fluid, initially appearing at a
finite distance from the fluid-structure interface and expanding by propagation of two
breaking fronts, reaches the front face sheet of the sandwich, thus causing the interface
pressure to vanish and giving rise to a reconstitution wave (closing front) which propagates
away from the structure and creates a layer of attached water, hence providing additional
momentum to the front face sheet. However, the latter analysis did not explicitly account for
the interaction between pressure waves reflected from the advancing breaking front and the
structural interface and neglected the effect of a non-vanishing initial hydrostatic fluid
pressure on the structural and fluid response.
Recent theoretical work by Schiffer et al. [13] analysed such effects for the case of
underwater blast loading of a rigid plate supported by a linear spring, concluding that FSI is
extremely sensitive to initial pressure in the fluid. These models capture propagation of
breaking fronts and closing fronts as well as their interactions with the structure in a blast
event and their predictions were found to be in excellent agreement with dynamic FE
calculations.
Early experimental work in underwater blast loading was carried out during Second
World War and an extensive part of this research is found in [14]. Several studies focused on
dynamic deformation and failure modes of real-size naval structures consequent to blast
loading in explosive test facilities [15-17]. In order to minimise the time and cost required for
large-scale tests, experimental methods at laboratory scale have been developed. Deshpande
et al. [18] designed an experimental apparatus able to simulate 1D underwater blast loading in
a water-filled steel shock tube. The apparatus was employed to measure the momentum
transmitted to foam-cored sandwich plates. The momentum transmitted to the sandwich plates
was found to be substantially lower than that transmitted to monolithic plates of equal mass,
consistent with the findings of previous theoretical and numerical studies [5-9]. This
underwater shock simulator [18] was then employed by McShane et al. [19] who probed the
blast performance of free-standing sandwich plates with metallic lattice cores via measuring
transmitted momentum and permanent core compression.
Espinosa et al. [20] followed a similar approach and designed a divergent shock tube
to investigate dynamic deformation of circular clamped monolithic plates subject to
underwater blast loading and used scaling rules to mimic the response of naval structures of
realistic dimensions. Plate deformation histories were measured by observing shadow Moiré
fringes with a high-speed camera. Subsequently, other authors [21-23] employed this
4
experimental method [20] to study damage mechanisms and failure modes exhibited by
monolithic plates and sandwich panels consequent to blast loading and provided further
experimental evidence for the benefits of sandwich construction in terms of blast resistance.
LeBlanc and Shukla [24] also used a water-filled conical shock tube to examine underwater
blast loading of clamped composite plates but with the shock wave generated via internal
detonation of an explosive charge. Wadley et al. [25] designed an underwater explosive test
rig comprising a water-filled cardboard cylinder placed on a steel plate machined with a
recess in which the sandwich specimen was located. Shock waves were generated in the water
cylinder by detonation of an explosive sheet and the loads transmitted to the supports were
deduced from load-cell measurements.
The experimental methods quoted above do not allow observation of cavitation fronts
and of the effects of an initially applied static pressure in the fluid prior to blast loading.
Recently, Schiffer and Tagarielli [26] developed an experimental probe capable of
reproducing blast loading in initially pressurised water, in order to mimic blast in deep water.
The apparatus consists of a shock tube made from a transparent material, which allows
observing the structural response as well as cavitation processes in the fluid.
The studies above did not provide a complete understanding of the blast resistance of
sandwich panels:
- They only considered blast loading of sandwich structures in contact with water on one
side and with air on the opposite side (air-backed), but did not examine the case of
sandwich plates wetted by water on both sides (water-backed); the latter is relevant to the
response of fin-like structures exposed to the threat of underwater blast, and we shall
examine it in this paper.
- They did not consider the effect of an initial hydrostatic pressure in the fluid, and are
therefore only relevant to blast loading of surface vessels; the apparatus developed by
Schiffer and Tagarielli [26] allows subjecting the fluid to an initial pressure superimposed
to the blast wave and it will be used in this study to investigate the 1D response to blast in
deep and shallow water, i.e. at high and low (atmospheric) initial static pressure.
- They reported measurements of the structural response but not of the response of the
fluid. Theoretical models, consequently, had to rely on simplifying assumptions on the
response of the fluid; the technique we are reporting in this study, allowing visualisation
of cavitation fronts, will permit us to correct some of these assumptions and to provide
experimental evidence for the findings of previous theoretical studies [5, 10, 11].
5
A combination of dynamic pressure measurements and analysis of high-speed photographs is
employed in this study to deduce the sensitivity of the imparted impulse to all governing
parameters. The outline of this paper is as follows: in Sections 2 and 3 we describe the
experimental techniques, while details of the FE calculations are provided in Section 4.
Results are presented in Section 5 and discussed in Section 6.
2. SPECIMEN DESIGN AND MANUFACTURE Dimensional analysis dictates that the problem under investigation is governed by the
following set of independent non-dimensional parameters
*
0
; ; ; ; ; ,fw w st c cf st c D
c c
mc p Em p Em m p
ρ θ sψ s εs s
= = = = = (1)
where ,w wcρ are density and speed of sound in water (respectively), stp is the initial
hydrostatic pressure in the fluid, 0 ,p θ are the peak pressure and the decay time constant of
the exponentially decaying blast wave, , ,c c DEs ε are collapse stress, elastic modulus and
densification strain of the core material, while ,fm m represent the areal masses of a single
face sheet and the entire sandwich panel, respectively. While the choice of these non-
dimensional parameters is not unique, in this study we shall employ the set defined in eq. (1),
as this was adopted in previous investigations.
Assuming that the relevant properties of the materials employed are independent of
size, the problem under investigation is scale-independent. This assumption is in line with that
of other authors, and justified by the fact that the relevant length-scales associated with the
response of cellular solids and water are at the micron scale and below. It follows that the
response to blast of large naval structures can be measured at laboratory scale by adopting a
scaled-down experimental setup, with a set of non-dimensional parameters (1) identical to that
of full-size structures. In the case of military vessels such as warships and submarines, highly
exposed to the risk of blast loading, typical ranges of the non-dimensional parameters (1) are
*1 7; 0.5; 1; 1f st cm pψ s< < ≈ < < (2) In this study, the choice of specimen geometry and loading parameters will be such to
thoroughly explore these ranges.
The sandwich specimens under investigation are composed of metallic face sheets and
low-density foam cores (polymeric and metallic foams). In order to probe the effect of core
strength on the underwater blast performance of a sandwich plate, five different types of
6
specimens are considered, all of which with different compressive strength cs and
approximately equal face sheet and total masses, so that cs can be varied without varying the
remaining parameters. Details of these specimens are given in Table 1, while their quasi-
static compressive response is presented in Fig. 1.
Circular cylindrical sandwich cores were machined from either aluminium foam
(Alporas) or polymer foam (Rohacell) to diameter cd and thickness c; the core diameter cd
was adjusted such to obtain a wide range of effective compressive strength of the sandwich
specimens (compressive collapse force related to the cross-sectional area of the tube) while
the core thickness c was chosen to obtain sandwich cores of equal weight 1.3gcM ≅ (areal
mass 22.3kgmcm −≅ ). The foam cores were bonded to the face sheets using an epoxy-based
adhesive. All specimens had aluminium face sheets of diameter 27 mmfd ≅ and thickness
8mmfh ≅ ; the face sheets diameters were chosen to fit with no interference the diameter of
the shock-tube, schematically illustrated in Fig. 2a. Two circular grooves were included in
each face sheet and fitted with O-rings to allow sealing, as illustrated in Fig. 2b. For
experiments conducted in air-backed configuration these grooves were absent in the back face
sheet, however the back face sheet thickness was chosen to achieve equal mass of front and
back face sheets, 12.5gfM ≅ (areal mass 221.8kgmfm −≅ ).
Each type of specimen was loaded in through-thickness compression in a screw-driven
machine, at a velocity such to impose a strain rate of 4 -110 s− in the foam cores. The through
thickness compressive force was measured by a resistive load cell and a laser extensometer
was used to measure the core strain. Figure 1a shows the quasi-static stress-strain response of
specimens 1 and 2, with cores made from Alporas foam (compressive stress here is defined as
the ratio of the compressive force and the cross-sectional area of the shock tube, 2 / 4fdπ ,
rather than the actual cross-section of the sandwich core, 2 / 4cdπ ). Specimen 2 ( 23mmcd = ,
14mmc = ) reached a stress plateau at 0.85MPacs = and started to strain-harden at a
compressive strain 0.4ε = , until full densification was reached at 0.65Dε = , arbitrarily
defined as the point on the curve such that ( ) 10D cs ε s= . In contrast, for specimen 1
( 26mmcd = , 10 mmc = ) both a decreased densification strain ( 0.56Dε = ) and a higher
collapse stress ( )2MPacs = was measured. Note that the increase in collapse stress of
Specimen 1 compared to Specimen 2 is higher than what would be expected from the
7
different cross-sectional areas; this can be justified by size effects in the compressive response
of foam materials when the foam’s thickness is on the order of its cell size, as reported in
Chen and Fleck [27].
Figure 1b shows similar information for Rohacell foam-cored sandwich plates
(specimens 3, 4 and 5 in Table 1). Upon yielding, the stress-strain curves of all specimens
exhibit a slight drop but, subsequently, quickly approach the level of the plateau stress. In all
cases strain-hardening commences at approximately 0.6ε = . Numerical values of cs , Dε and
cE (compressive Young’s modulus) were deduced from the measurements and are included
in Table 1 for each type of specimen. It merits comment that in all compression tests the
transverse plastic strain 22pε was negligible compared to the longitudinal plastic strain 11
pε and
thus the plastic Poisson’s ratio 22 11p p
pν ε ε= − can be taken as approximately zero.
3. EXPERIMENTAL TECHNIQUE
3.1 Laboratory setup and instrumentation
In this study, the shock tube apparatus developed by Schiffer and Tagarielli [26] was
employed to perform underwater blast experiments on the sandwich specimens listed in
Table 1. The experimental apparatus, as sketched in Fig. 2a, consists of a transparent water
shock tube machined to inner diameter 27 mmd = and length 2mL = from an acrylic rod of
density 31190 kgmρ −= and Young’s modulus 3.3GPaE = . The length of the tube was
sufficient to ensure that the structural response had finished before pressure waves reflected at
the tube’s ends could reach the specimen and the bore was honed to provide clear observation
of the specimen’s response as well as visualisation of cavitation processes in the fluid by
using a high-speed camera and flash-light illumination. Experiments were conducted with two
different specimen configurations, as described below.
(i) water-backed configuration:
As shown in Fig. 2a, the specimen was located in the centre of the shock tube, separating
the bore into two sections. Both front and back sections were filled with filtered tap water
(in vertical position) and the tube ends were capped with sealing nylon pistons; bleed
valves were included in the pistons to evacuate air-bubbles trapped in the water columns
prior to the dynamic experiment. In order to mimic blast loading in deep water, a
8
hydrostatic pressure field is induced in the water by loading the sliding back piston with a
compressive force F; such force was applied by using a screw-driven loading fixture
fitted with a resistive load cell to measure the amount of static pressure induced in the
fluid, stp . The front piston was in contact with an anvil on its dry face to avoid being
ejected when the water was pressurised. For experiments with water at atmospheric
condition (i.e. with 0.1MPastp ≈ ), pre-pressurisation was omitted.
(ii) air-backed configuration:
Specimens were located in the shock tube approximately 200 mm from the distal end.
The tube was then filled, in vertical position, with filtered tap water and closed by a
sealing nylon piston at the opposite end, as described above. All experiments in air-
backed specimen configuration were performed under atmospheric conditions (i.e.
), without pre-pressurisation of the water column. Note that if the back
face of the sandwich specimen is in contact with air, motion of the back face sheet
induces an increase in back pressure proportional to the velocity of the plate; this velocity
was small in our tests (< 10 ms-1) and therefore such pressure increase was negligible
compared to the initial static pressure, stp , and to the dynamic peak pressure induced by
the shock wave, 0p .
The pressure transient in the shock tube was measured using piezoelectric pressure sensors
(PCB Piezoelectronics Inc., type 113B23) mounted on the shock tube flush to the surface of
the bore; one such sensor was located at a distance of 120 mm from the front end (see Fig. 2a)
in order to measure the incident pressure versus time pulse. A second transducer of same type
was placed at a distance of 120 mm from the centre of the tube (on the distal side) in order to
measure, for the case of experiments in water-backed configuration, pressure waves emanated
from the specimen’s back face sheet during the dynamic experiments.
3.2 Generation and propagation of blast waves in the shock tube
Upon detonation of an explosive charge in deep water at initial pressure stp , an exponentially
decaying pressure wave is generated [1]. At sufficient distance from the detonation point, the
pressure versus time history associated with the passage of the blast wave in the fluid can be
described by
0.1MPastp ≈
9
( ) /0
tstp t p p e θ−= + (3)
where the peak over-pressure 0p and the decay time θ depend upon the mass and type of
explosive material as well as on the distance from the point of detonation [2].
Such pressure history (eq. (3)) was generated by impacting the nylon piston placed at
the front end of the shock tube with a compound projectile comprising of a low-density foam
cylinder encased between two metallic skins, as sketched in Fig. 3c. The reasons for using a
sandwich-like projectile are explained below.
Prior to projectile impact, the front water piston (mass PM ) is subject to a static
pressure stp on the wet face and this action is equilibrated by the reaction force exerted by the
anvil in contact with the piston’s dry face, see Fig. 3a. Now consider the inelastic impact of a
cylindrical steel striker of mass SM and velocity Sv on the nylon piston; treating both piston
and striker as rigid bodies and employing the acoustic approximation for the response of
water, dynamic equilibrium of the combined striker-piston system dictates
,S P st w wm v p c vρ= − − (4)
where ,S Pm is the total mass of the striker-piston system divided by the cross section of the
piston PA , ( ), /S P S P Pm M M A= + , v is the system velocity, wρ and wc are the density and
speed of sound of water, respectively. The initial velocity 0v of the striker-piston system is
governed by conservation of linear momentum, hence ( )0 /S S S Pv M v M M= + .
Equation (4) can be solved with the initial condition ( ) 00v t v= = and this solution
permits writing the interface pressure, ( ) ( )st w wp t p c v tρ= + , as
( ) ( ) /0
tstp t p p e θ−= + (5)
where the peak pressure 0p and the decay time θ are given by
,
0 0 , .S Pw w
w w
mp c v
cρ θ
ρ= = (6)
It can be seen from eq. (5) that impact of the water piston by a rigid projectile generates a
pressure pulse whose amplitude decays exponentially to zero, rather than to a finite value stp
as desired and given by eq. (3), owing to the fact that the piston loses contact with the
supporting anvil (Fig. 3a), which causes a pressure wave of magnitude stp− to emerge from
the wet face and propagating into the fluid column. To overcome this problem, it is necessary
10
to apply an additional constant pressure stp to the dry face of the piston during the impact
event.
A way of providing such additional constant pressure is to employ the compound
striker sketched in Fig. 3b, made from steel and polymeric foam, which allows generation of
the desired pressure pulse (eq. (3)) in the water column. A cylindrical steel projectile is placed
in series with a foam cylinder, followed by a foam crusher. Impact of the steel projectile
produces an exponentially decaying pressure pulse in water while the plastic collapse of the
foam exerts the necessary constant force on the piston; the plastic collapse process is driven
by the kinetic energy of the ‘foam crusher’. Note that the geometry of this compound striker
induces a delay between the application of the exponentially decaying pressure pulse and that
of the constant pressure associated with the plastic collapse of the foam; however, such delay
is of the order of nanoseconds and therefore negligible compared to the decay time of the
exponential pulse ( 0.12ms 0.2msθ≤ ≤ in this study).
Rohacell foams of different densities were employed to construct the compound
strikers sketched in Fig. 2c and their cross-section FA was chosen to guarantee a contact
pressure at the foam-piston interface equal to the desired stp , i.e. ( )/F P st cA A p s= , where
cs is the plastic collapse stress of the foam employed. Such collapse stress relates to the
quasi-static yield stress of the foam Ys and to the impact velocity Sv as 2 /c Y F S Dvs s ρ ε= +
[10]. In the experiments presented herein impact velocities were low ( 115msSv −< ), thus
c Ys s≈ . Numerical values of cs for each foam material used in the strikers were taken from
Table 1 and the strain rate sensitivity of the foam was neglected, as reported by Arezoo et al.
[28].
For the case of experiments at atmospheric pressure, i.e. 0.1MPastp = , the loading
pulses were generated in the water column by impacting the nylon piston by a simple
cylindrical steel projectile, as in Deshpande et al. [18].
The speed at which the generated pressure wave propagates in the water column depends
on density, geometry and elastic stiffness of the shock tube. For the case of a rigid, water-
filled tube, waves propagate in the fluid at the speed of sound of water ( 11498wc ms−≈ ). In
contrast, the relatively high compliance of the polymeric tube allows for significant hoop
deformation to occur when a pressure pulse passes through the tube. Coupling between the
ensuing radial tube deformation and the fluid motion causes pressure pulses to propagate at
11
lower speeds than the speed of sound in open water; in addition, the pressure pulses
progressively attenuate and distort as they propagate in the tube [29]. Measurements of the
wave speed by using the two pressure sensors fitted on the tube (at a relative distance of 1 m,
see Fig. 2a) provided an average of 11053mswc −= , significantly lower than sonic speed in
water and in agreement with the predictions of Korteweg [29]. Moreover, the observed
attenuation of the pressure pulse amplitude was approximately 5%, the initial rise time of the
pressure pulse was also observed to increase by around 5% and the decay time of the
exponential pulse increased by approximately 15%.
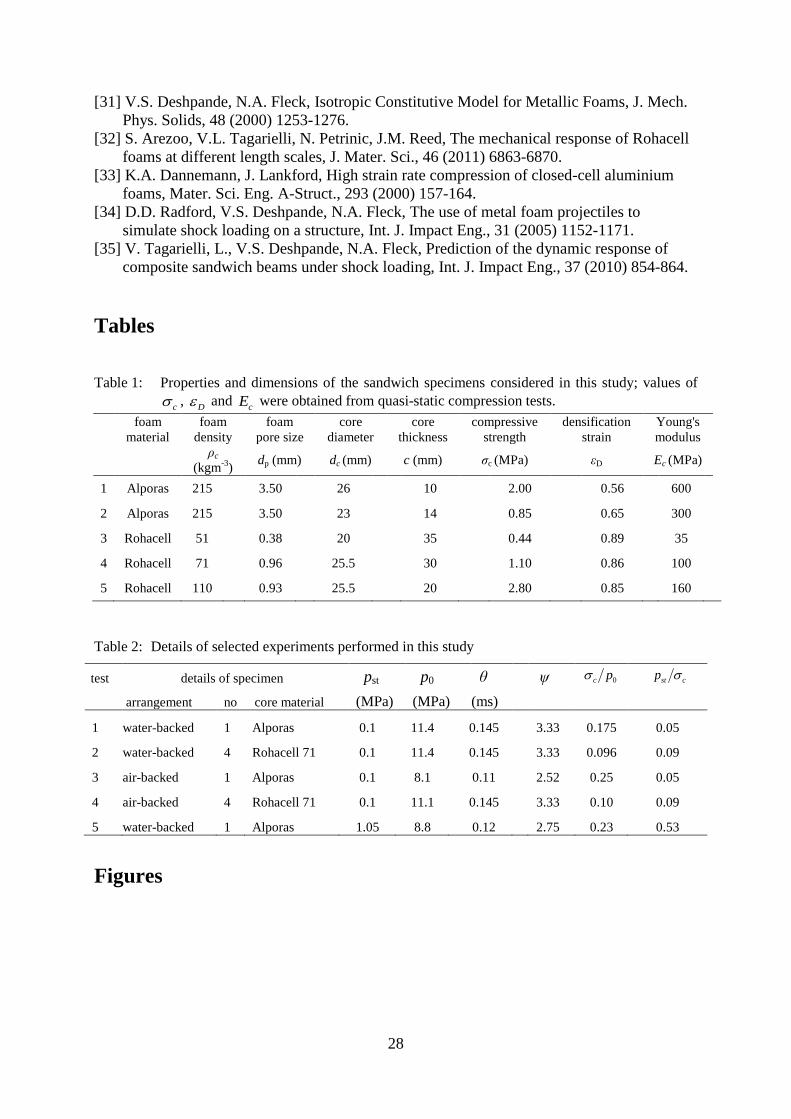
4. FINITE ELEMENT MODELS Dynamic FE simulations were performed in ABAQUS/Explicit [30] to develop further
understanding of the specimen and fluid response, and to compare with measurements. A
schematic of the FE model is shown in Fig. 3, for the case of a sandwich plate of core
thickness c encased between two face sheets of thickness fh and in contact with water
columns on both sides. The water columns were chosen sufficiently long to guarantee that the
FSI phase had finished before pressure wave reflections at the free ends of the fluid columns
reached the structure. Four-noded, 2D quadrilateral elements with reduced integration (type
CPE4R in ABAQUS) were used to discretise the fluid columns and the structure and tie
constraints were used to connect the nodes at fluid-structure interfaces. FE models for air-
backed sandwich plates follow a similar scheme with the back fluid column absent. To reduce
artificial energy dissipation associated to the large volumetric strains during foam
compression, both the linear and quadratic bulk viscosity coefficients in ABAQUS were set to
zero.
The constitutive response of water was modelled using a Mie-Gruneisen equation of
state with a linear Hugoniot relation such to give a linear-elastic relationship between fluid
pressure and compressive volumetric strain. Neglecting the vapour pressure of water,
cavitation was modelled by introducing a cut-off at a tensile failure [30] of zero, i.e. 0cp = .
Density of water was taken as -31000kgmwρ = and the shear modulus was assumed to be
zero. Note that, in the experiments, mechanical coupling between the tube and the water
column reduces the speed at which pressure pulses propagate in the fluid, as discussed in
Section 3.2; such coupling also affects the values of peak pressure 0p and decay time θ of
the generated pressure pulse (eq. (6)). For this reason all calculations in this study were
12
performed by using the measured wave speed 11053mswc −= , see Section 3.2. For the water
column the element size in the direction of wave propagation was set to 0.1 mm, while one
single element was used to discretise the water columns along the width.
The aluminium face sheets were modelled as linear elastic solids with density -32700kgm ,fρ = Young’s modulus 69GPafE = and Poisson’s ratio 0.1fν = ; an element
size of 0.3 mm was used along the through-thickness direction of the face sheets. Note
however that the stiffness of aluminium is one order of magnitude greater than that of water,
and to most practical effects the face sheets could be considered to respond as rigid bodies.
The constitutive description of the foam materials is as follows. The elastic response
of the foams was taken to be isotropic with density cρ , Young’s modulus cE , Poisson’s ratio
0.1.cν = The compressive plastic collapse of the foam was modelled using the ‘crushable
foam’ plasticity model with isotropic hardening [31] available in ABAQUS [30]. Upon
assuming normality of plastic flow to the yield surface, the yield ratio 0 0Y c ck ps= (with 0
cs
the initial yield stress in uniaxial compression and 0cp the yield stress in hydrostatic
compression) can be written in terms of the plastic Poisson’s ratio pν
( )3 1 2 .Y pk ν= − (7)
For the foam materials considered herein, 0pν = , thus 3Yk = . Note that the strain
hardening curves were specified according to the stress-strain curves obtained from the quasi-
static compression tests and reported in Fig. 1.
The strain rate dependency of the foam materials is modelled as follows. Dynamic
experiments on Rohacell and Alporas foams [28, 32, 33] revealed that the dependence of the
yield stress upon the strain rate can be neglected for these foams. However, when a foam
material is subject to intense shock loading, the compressive dynamic response entails
propagation of a plastic shock wave leading to additional energy dissipation in the core. As in
e.g. Radford et al. [34] and Tagarielli et al. [35], we introduce linear strain rate dependency in
the constitutive model by employing an overstress visco-plastic model
ˆpl c cs sεη
−=
(8)
where cs is the static compression yield stress, ˆcs is the yield stress at nonzero strain rate
and η is the viscosity. Following Radford et al. [34]
13
s c
D
l vρηεD
= (9)
with sl the width of the plastic shock wave, cρ and Dε density and densification strain of the
foam material, respectively, and vD the velocity jump across the plastic shock. The shock
width sl is assumed to be on the order of the foam's pore size (Table 1) and the velocity jump
vD is taken as the maximum front face velocity ,maxfv . Experimental measurements (see
Section 5.2) revealed that ,maxfv can be approximated by the velocity imparted to a free-
standing rigid plate of equal mass subject to the same loading case, ,0fv . According to Taylor
[3], such velocity can be expressed as
( )1
0,0
2 f f
ff
f
pv
m
ψ ψθψ −
= (10)
where fψ is a non-dimensional parameter related to the areal mass of the front face sheet fm
and is defined as
.w wf
f f
cm m
ρ θ ψψ = = (11)
In order to implement this constitutive relationship in the FE model, the Cowper-Symonds
overstress power-law available in ABAQUS [30] was used
ˆ
1 .pl c
c
Dl
sεs
= −
(12)
Upon setting 1l = in eq.(12) and combining eqs.(8) and (12), the multiplier D can be written
as
.cD sη
= (13)
To ensure accurate resolution of the stress and strain gradients across the plastic shock wave,
an element size of /12sl was chosen to discretise the foam core in through-thickness
direction.
The transverse displacements of all nodes were constrained to zero (see Fig. 3) and the
presence of initial hydrostatic pressure was modelled by defining initial stress fields for all
fluid elements, x y z stps s s= = = − , as well as for the structural elements, x stps = − . The
incident shock wave was generated by imposing a pressure boundary condition according to
14
eq. (5) at the free end of the front water column while a constant compressive stress stp was
applied on the free end of the back fluid column in order to equilibrate the fluid-structure
system prior to shock loading.
5. RESULTS AND DISCUSSION
5.1 Fluid response In this section we present high-speed photographic sequences obtained from selected
experiments and describe the cavitation phenomena taking place in the fluid consequent to
blast loading. We employ the high-speed photographs to measure trajectories of closing fronts
(CFs) and breaking fronts (BFs) and we compare these measurements with predictions
obtained from detailed FE simulations.
Details of core type, specimen arrangement, characteristics of the generated pressure
pulses as well as the initial static pressure used in selected experiments are listed in Table 2,
along with the numerical values of the normalised core strength 0c c ps s= , the normalised
static pressure st st cp p s∗ = and the FSI parameter ψ .
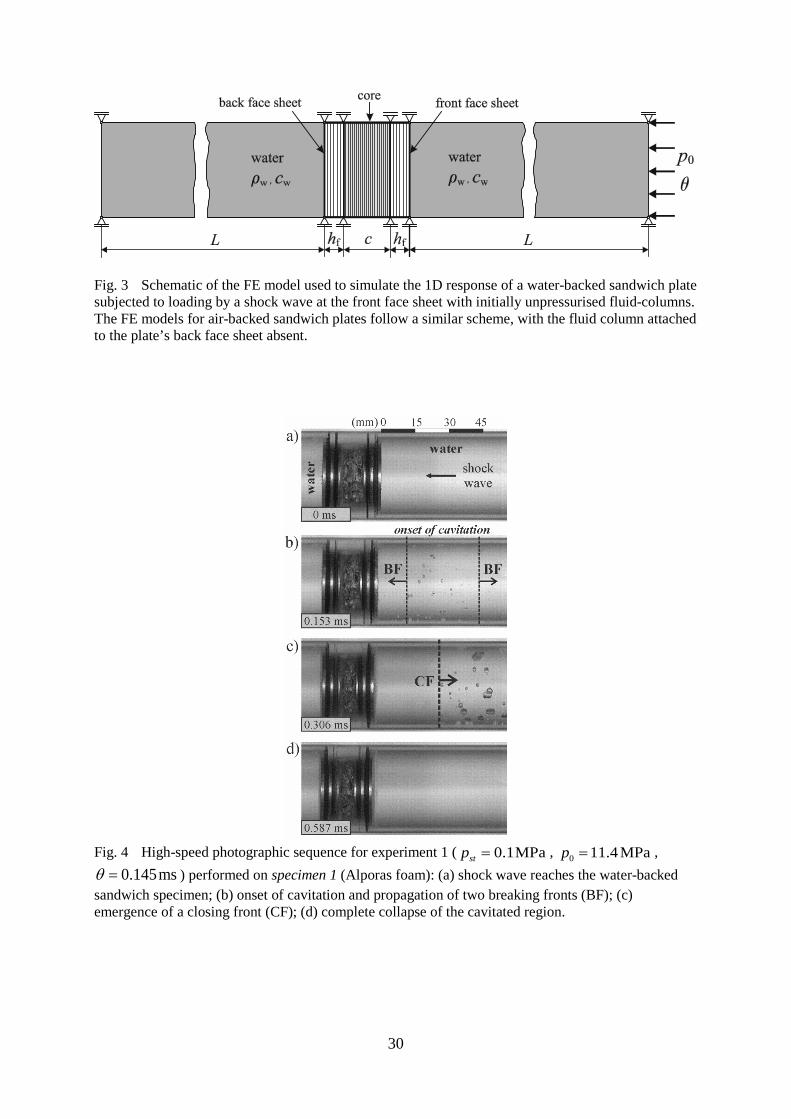
5.1.1 Water-backed sandwich plates Figure 4 shows a sequence of high-speed photographs obtained from experiment 1 performed
on a water-backed sandwich specimen with an Alporas foam core of collapse strength
2MPacs = (specimen 1, Table 1). The experiment was conducted with 0 11.4MPap = and
0.145msθ = without pre-pressurisation, thus 0.1MPastp = . In Fig. 4a the incident shock
wave, travelling from the right to the left in this figure, reaches the specimen. Subsequently,
the front face sheet of the sandwich plate is set in motion and bubbles emerge in the water
column at a finite distance from the fluid-structure interface, as shown in Fig. 4b, and two BFs
start propagating into opposite directions with supersonic speed, rapidly opening a pool of
cavitated water, as expected [4]. The BF travelling away from the specimen continues
propagating and leaves the field of observation while the BF travelling towards the sandwich
specimen approaches the fluid-structure interface and inverts its motion to become a CF
before the interface is reached. We also note that the bubbles increase in size as time elapses
owing to an increase in strain of the cavitated fluid consequent to continued displacement of
15
the front face sheet. The CF continues propagating and leaves the field of observation, see
Fig. 4d.
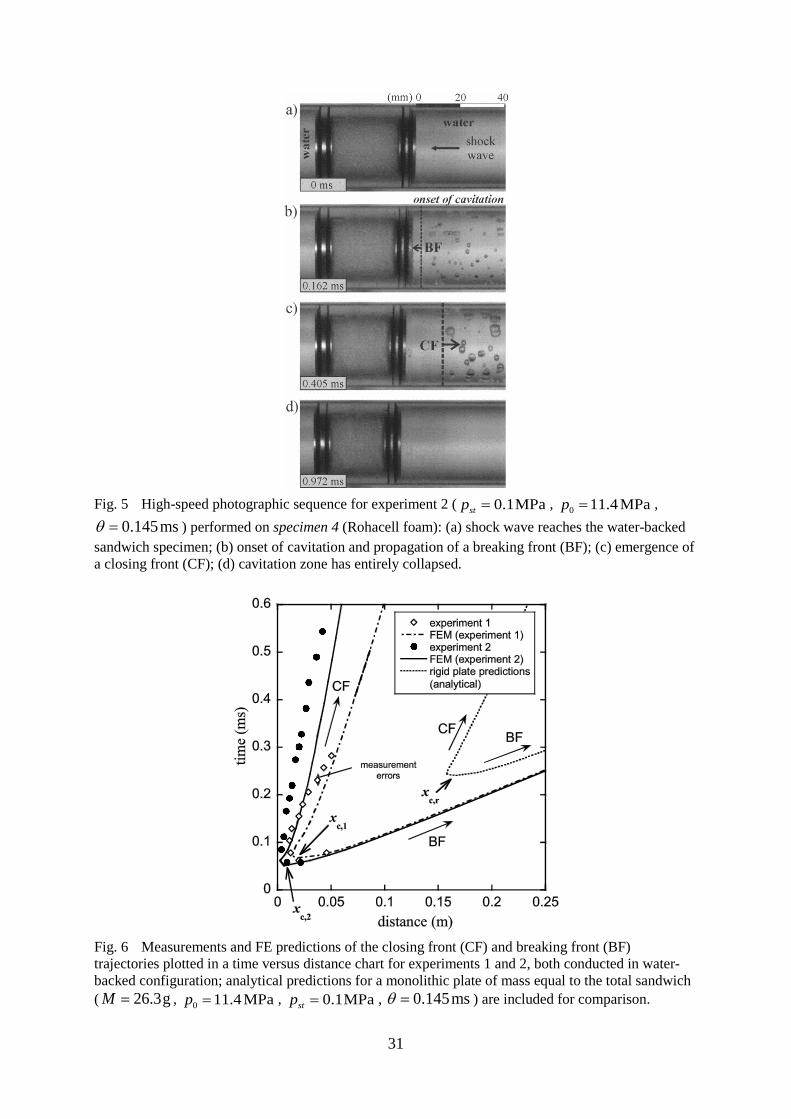
Experiment 2 ( 0 11.4MPap = , 0.145msθ = , 0.1MPastp = ) was performed on a
water-backed sandwich specimen comprising a Rohacell foam core of compressive strength
1.1MPacs = (specimen 4, Table 1); test parameters are the same as in experiment 1 but the
foam core has a lower collapse stress. High-speed photographs recorded in this experiment
are illustrated in Fig. 5 for four selected instants. Figure 5a shows the specimen and the fluid
columns at the instant when the incident shock wave reaches the front face sheet. The impact
of the pressure wave on the sandwich specimen leads to rapid acceleration of the front face
sheet. Subsequently, cavitation bubbles emerge in the water very close to the fluid-structure
interface and this cavitation zone expands by propagation of two BFs, as seen in Fig. 5b. It
merits comment that the BF travelling away from the plate could not be captured in this
photographic sequence owing to the limited temporal resolution of the high-speed camera
used in this experiment. The BF approaching the structure reaches the fluid-structure
interface, inverts its motion and becomes a CF immediately thereafter due to front face sheet
deceleration induced by plastic core compression, as shown in Fig. 5c. While the core is
further compressed, the CF continues propagating and leaves the field of observation, as seen
in Fig. 5d. Now compare Figs. 4c and 5c: the degree of core compression cε is significantly
larger in Fig. 5c, owing to the relatively small compressive strength of the sandwich specimen
used in this experiment, 1.1MPacs = .
The high-speed photographs, such as presented in Figs. 4 and 5, allow measuring
trajectories of BFs and CFs. We now proceed to present such measurements together with
predictions obtained from detailed FE simulations. To perform this comparison it is
instructive to plot the measured and predicted cavitation front trajectories in a distance versus
time chart ( 0t = corresponds to the loading shock wave reaching the sandwich structure), as
shown in Fig. 6 for experiments 1 and 2. In the experiments, the positions of the cavitation
fronts were determined by measuring the distance between the fluid-structure interface and
the edge of the first bubble visible in the cavitated region. Note that the CF and BF velocities,
denoted as CFc and BFc , respectively, are inversely proportional to the slopes of the
trajectories shown in Fig. 6.
The limited spatial and temporal resolution of the high-speed camera used in the
experiments (interframe time 27μsitD = and pixel size 300μmixD = ) introduces finite errors
in the time and distance measurements; the degree of this uncertainty is indicated by the grey
16
ellipse in Fig. 6. However, it can be seen that the experimental measurements are captured
with sufficient accuracy. For both experiments 1 and 2, the measured and predicted
trajectories show that the points of first cavitation are located at a finite distance from the
fluid-structure interface, as indicated in Fig. 6 by ,1cx and ,2cx , respectively. Moreover,
,1 ,2c cx x> and ,1 ,2CF CFc c> .
In addition, we include in Fig. 6 analytical predictions [13] of cavitation front
trajectories for the case of a water-backed rigid plate of mass equal to the total sandwich, with
loading conditions identical to experiments 1 and 2. Now compare the rigid plate and
sandwich trajectories: the effect of sandwich construction is to substantially decrease the
distance and time of first cavitation ( ,1 ,c c rx x, ,2 ,c c rx x
), reflecting in a less severe loading
history in the case of sandwich structures, compared to equivalent monolithic structures. This
will be examined in Section 5.5. The effect of the relatively stronger core of specimen 1 is to
delay the onset of cavitation in time, to increase the distance from the fluid-structure interface
at which first cavitation occurs, and to cause the breaking front to invert its direction (and turn
into a CF) before the fluid-structure interface is reached.
5.1.2 Air-backed sandwich plates
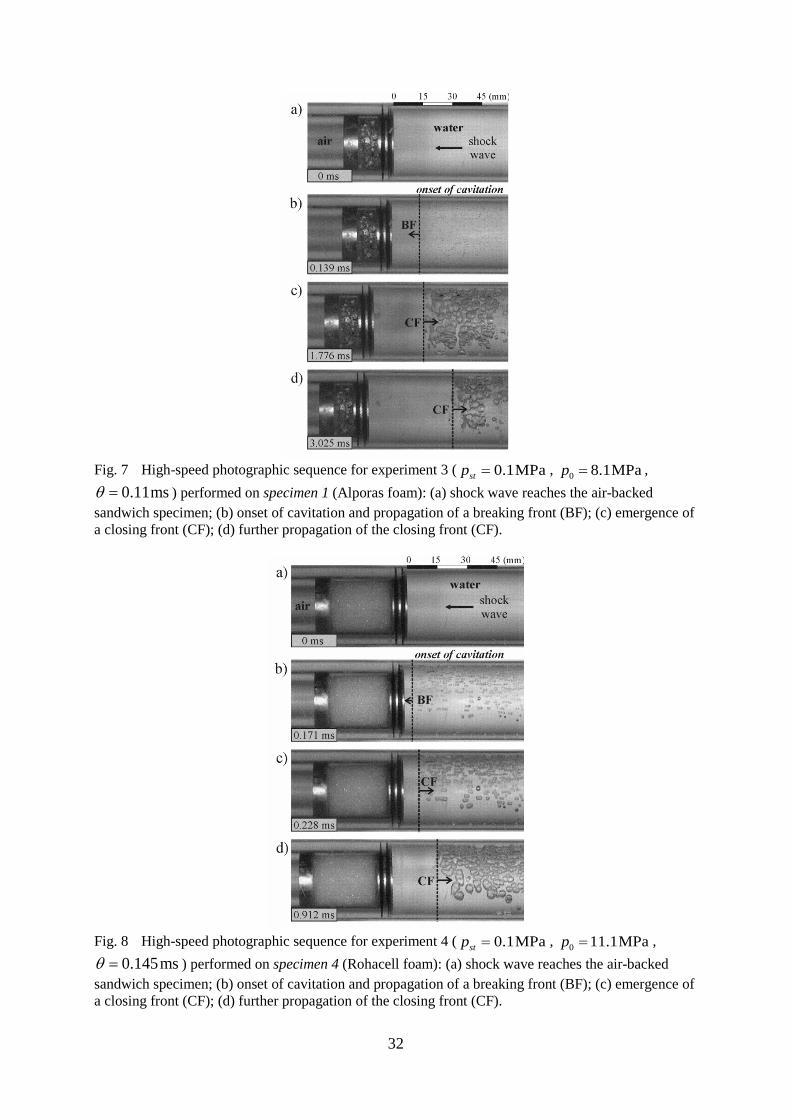
In Fig. 7 we present high-speed photographs for experiment 3 performed on an air-backed
sandwich plate with an Alporas foam core of compressive strength 2.0MPacs =
(specimen 1, Table 1). Water was initially at atmospheric pressure, 0.1MPastp = . In Fig. 7a,
the generated shock wave ( 0 8.1MPap = , 0.11msθ = ) reaches the front face of the specimen.
The ensuing cavitation process is similar to what observed for the experiment performed on a
similar specimen in contact with water on both sides (see Fig. 4): the cavitation process
initiates again at a finite distance from the front face sheet and the cavitation zone spreads by
propagation of two BFs. The BF arrests before reaching the front face sheet, as shown in Fig.
7b, and becomes a CF, propagating away from the structure into the cavitated region, at
relatively low speed, as seen in Figs. 7c and 7d.
In Fig. 8 we show similar information for experiment 4 ( 0.1MPastp = ,
0 11.1MPap = , 0.145msθ = ) performed on an air-backed sandwich specimen comprising a
Rohacell foam core of 1.1MPacs = (specimen 4, Table 1). It can be seen that the sequence of
cavitation phenomena is similar to what observed in experiment 3 and described above.
17
However, the cavitation onset is at decreased distance from the fluid-structure interface,
which can be attributed to the reduced compressive strength cs (or reduced 0/c c ps s= in
non-dimensional terms) of the specimen used in experiment 4.
Measurements and FE predictions of closing front and breaking front trajectories for
experiments 3 and 4 are plotted in Fig. 9. The measured trajectories show that the cavitation
zone did not reach the fluid-structure interface in both experiments and the FE predictions
confirm this. The measurements also show that the closing fronts propagated with constant
velocities, ,3CFc and ,4CFc , respectively. The FE models predict much larger velocities ,3CFc
and ,4CFc at the points where the BFs invert their motion, on the other hand the agreement
between calculations and measurements is satisfactory for 0.04x > .
In addition, we include in Fig. 9 CF and BF trajectories obtained from analytical
predictions [13] performed for an air-backed rigid plate of equivalent mass to the sandwich
plate and identical loading conditions to experiments 3 and 4. Now compare the rigid plate
and sandwich predictions: the effect of sandwich construction is to locate the point of first
cavitation at increased distance from the fluid-structure interface, i.e. ,3 ,c c rx x> and
,4 ,c c rx x> , in line with previous theoretical studies [5, 10, 11]. This has a strong effect on
structural loading as it will be discussed below (Section 5.3). Figure 9 shows that the effect of
an increase the core strength for an air-backed sandwich plate is similar to what reported
above for the case of water-backed sandwich plates.
Direct observation of the cavitation sequence allows concluding that the BF travelling
towards the structure may not reach the fluid-structure interface before it inverts its motion
into a CF. Therefore the simplifying assumption made in previous theoretical studies [5, 12]
may not be accurate and more detailed theoretical models are necessary.
5.2 Face sheet motion and core compression The high-speed photographs, such as presented in Figs. 4, 5, 7 and 8, also allow measuring
time histories of core compression as well as face sheet displacements and velocities. We now
proceed to present such measurements obtained from selected experiments and we compare
the results with the predictions of dynamic FE simulations.
18
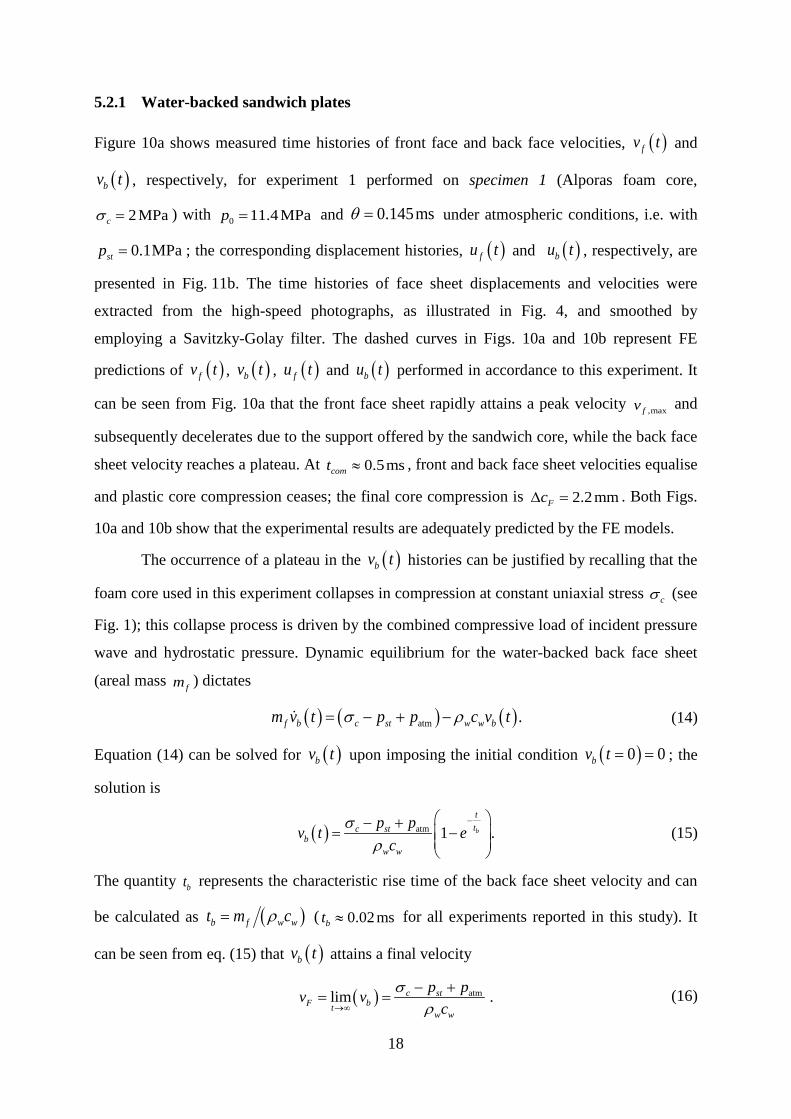
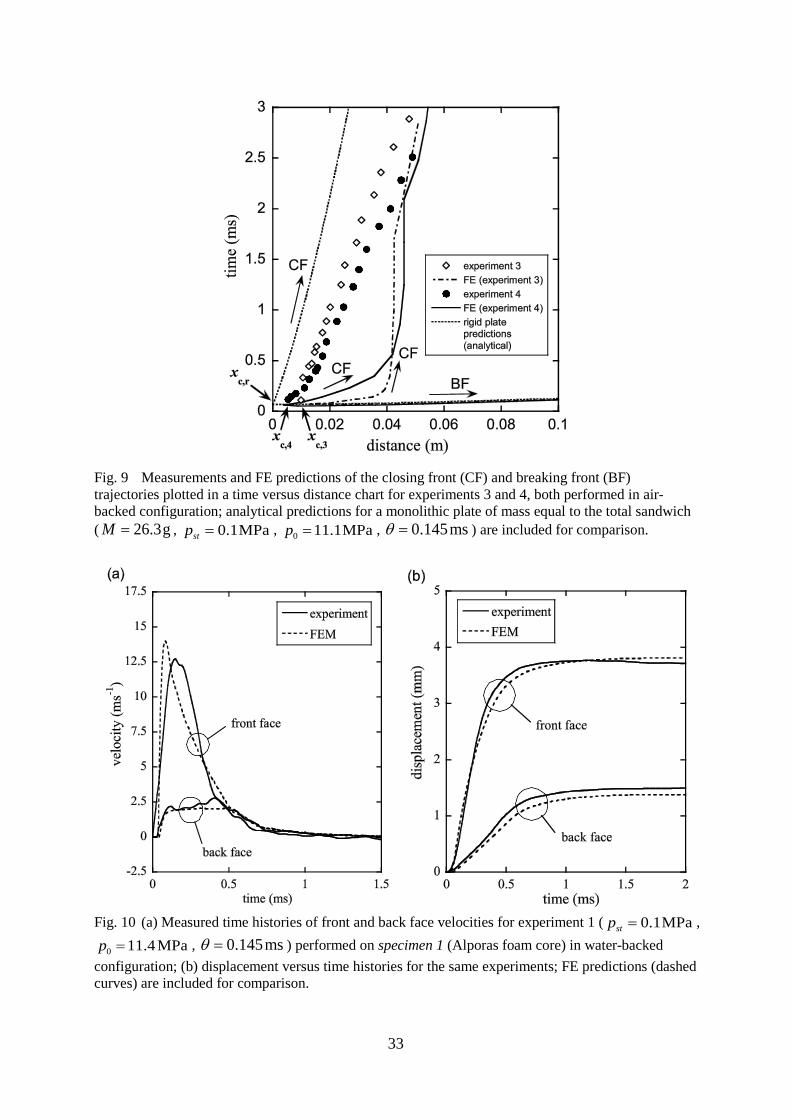
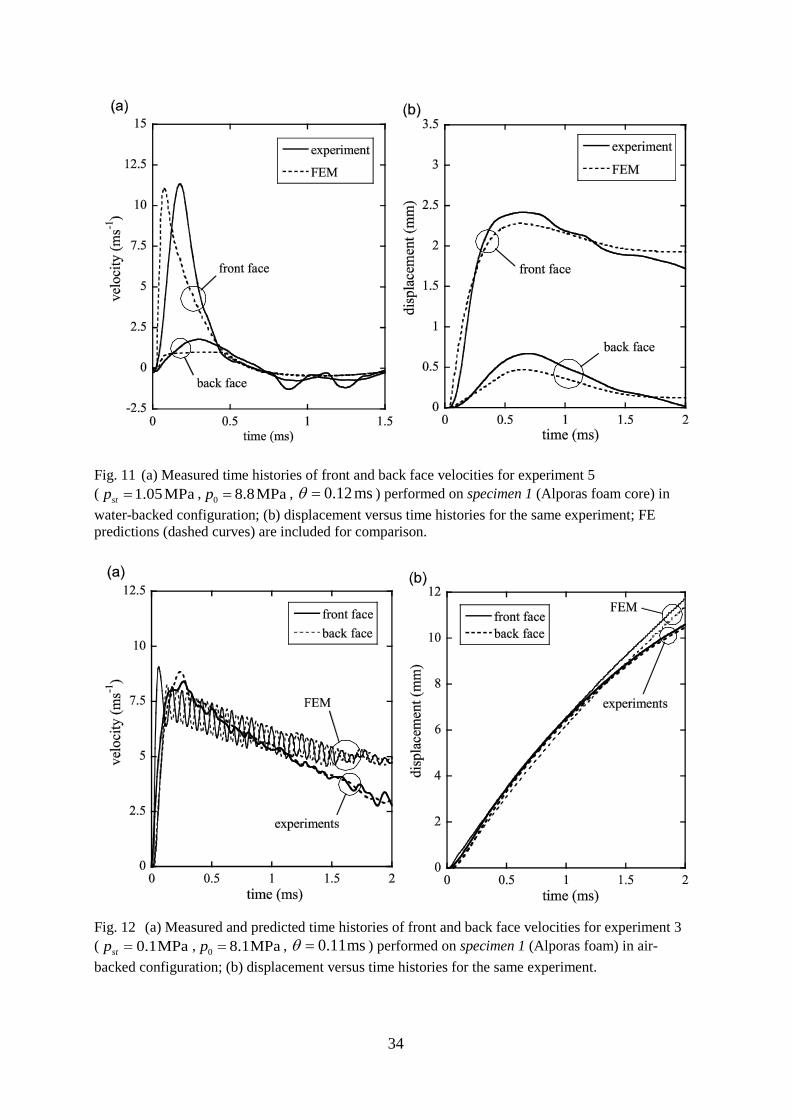
5.2.1 Water-backed sandwich plates Figure 10a shows measured time histories of front face and back face velocities, ( )fv t and
( )bv t , respectively, for experiment 1 performed on specimen 1 (Alporas foam core,
2MPacs = ) with 0 11.4MPap = and 0.145msθ = under atmospheric conditions, i.e. with
; the corresponding displacement histories, ( )fu t and ( )bu t , respectively, are
presented in Fig. 11b. The time histories of face sheet displacements and velocities were
extracted from the high-speed photographs, as illustrated in Fig. 4, and smoothed by
employing a Savitzky-Golay filter. The dashed curves in Figs. 10a and 10b represent FE
predictions of ( )fv t , ( )bv t , ( )fu t and ( )bu t performed in accordance to this experiment. It
can be seen from Fig. 10a that the front face sheet rapidly attains a peak velocity ,maxfv and
subsequently decelerates due to the support offered by the sandwich core, while the back face
sheet velocity reaches a plateau. At 0.5mscomt ≈ , front and back face sheet velocities equalise
and plastic core compression ceases; the final core compression is 2.2mmFcD = . Both Figs.
10a and 10b show that the experimental results are adequately predicted by the FE models.
The occurrence of a plateau in the ( )bv t histories can be justified by recalling that the
foam core used in this experiment collapses in compression at constant uniaxial stress cs (see
Fig. 1); this collapse process is driven by the combined compressive load of incident pressure
wave and hydrostatic pressure. Dynamic equilibrium for the water-backed back face sheet
(areal mass fm ) dictates
( ) ( ) ( )atm .f b c st w w bm v t p p c v ts ρ= − + − (14)
Equation (14) can be solved for ( )bv t upon imposing the initial condition ( )0 0bv t = = ; the
solution is
( ) atm 1 .b
ttc st
bw w
p pv t ec
sρ
− − += −
(15)
The quantity bt represents the characteristic rise time of the back face sheet velocity and can
be calculated as ( )b f w wt m cρ= ( 0.02msbt ≈ for all experiments reported in this study). It
can be seen from eq. (15) that ( )bv t attains a final velocity
( ) atmlim .c stF bt
w w
p pv vc
sρ→∞
− += = (16)
0.1MPastp =
19
after sufficient time has elapsed (typically after 5 bt t≈ ). For experiment 1, eq. (16) predicts
11.9msFv −= , in line with both measurements and FE predictions (see Fig. 10a).
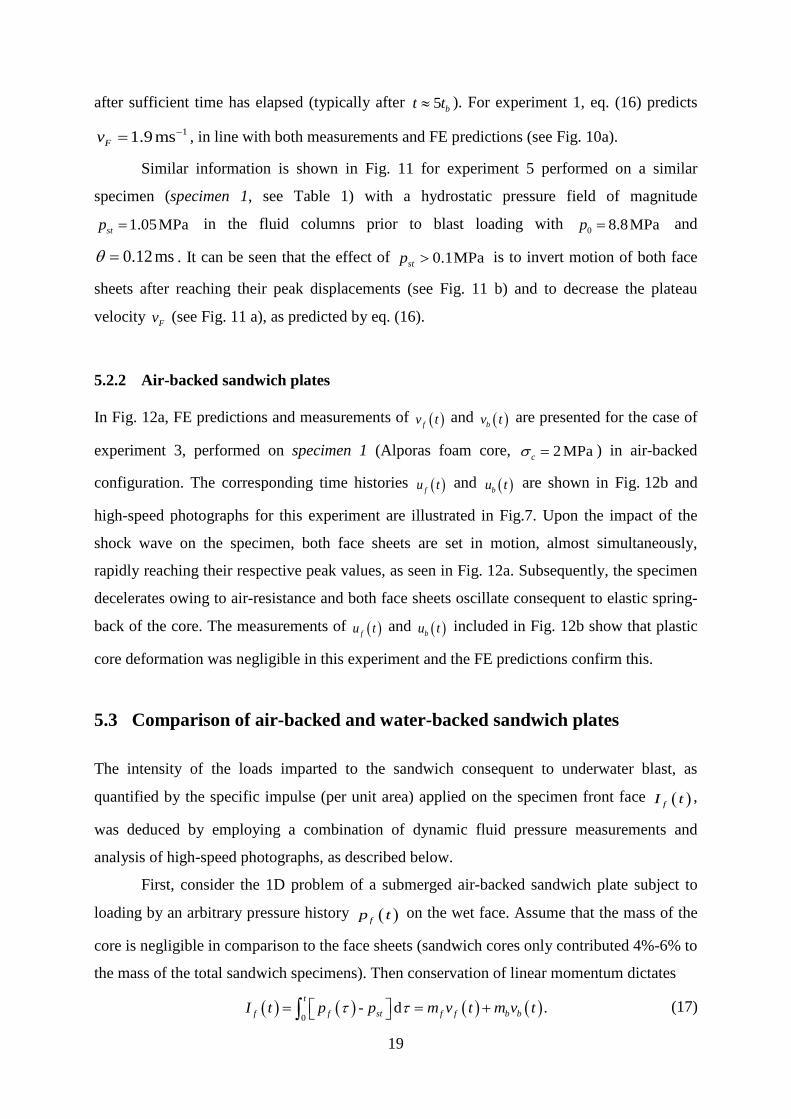
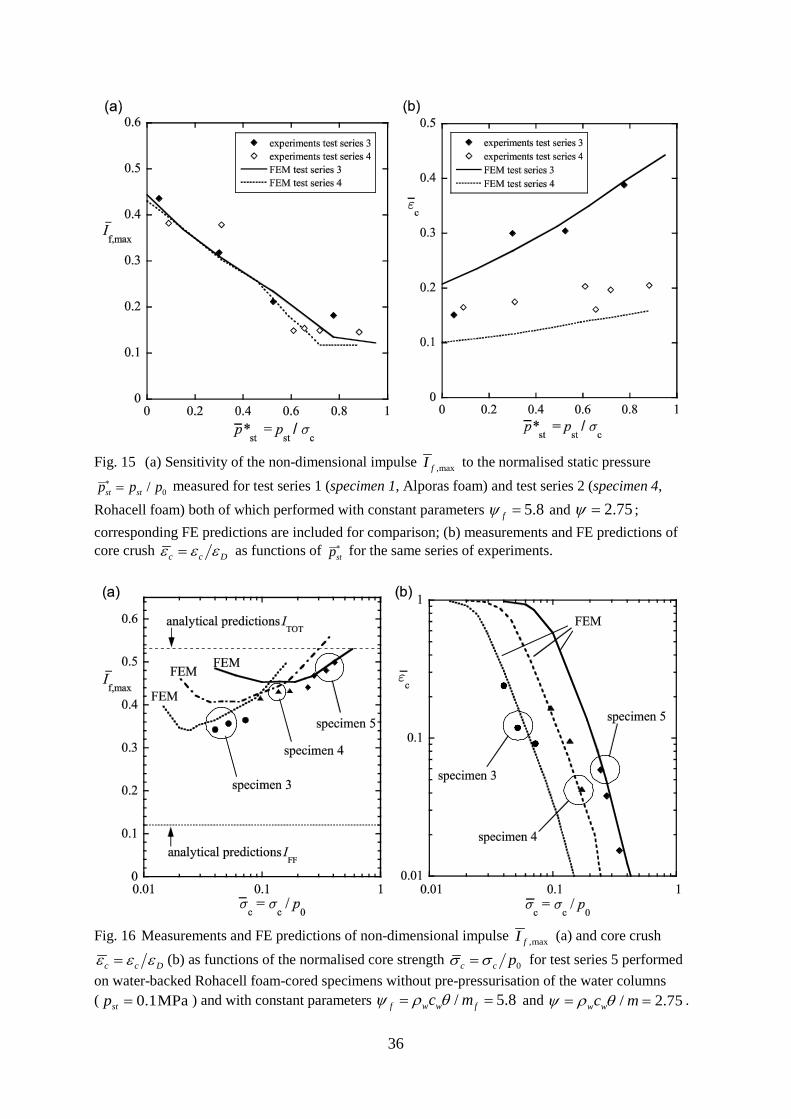
Similar information is shown in Fig. 11 for experiment 5 performed on a similar
specimen (specimen 1, see Table 1) with a hydrostatic pressure field of magnitude
1.05MPastp = in the fluid columns prior to blast loading with 0 8.8MPap = and
0.12msθ = . It can be seen that the effect of 0.1MPastp > is to invert motion of both face
sheets after reaching their peak displacements (see Fig. 11 b) and to decrease the plateau
velocity Fv (see Fig. 11 a), as predicted by eq. (16).
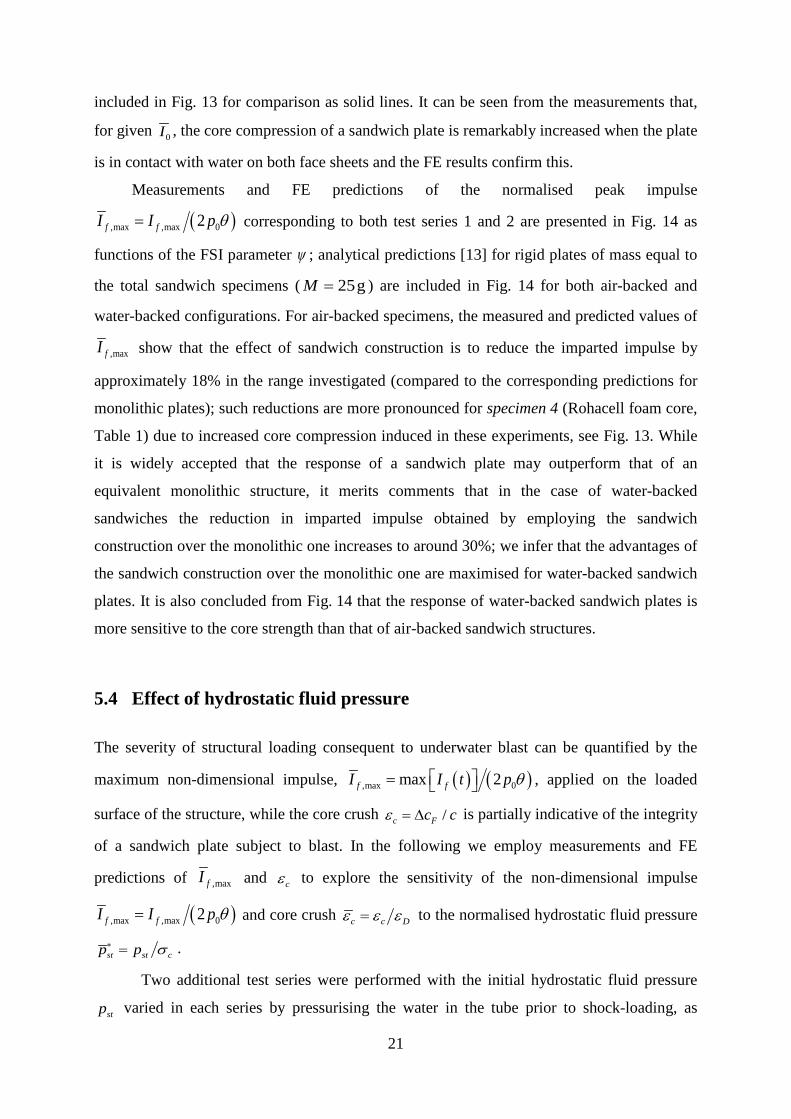
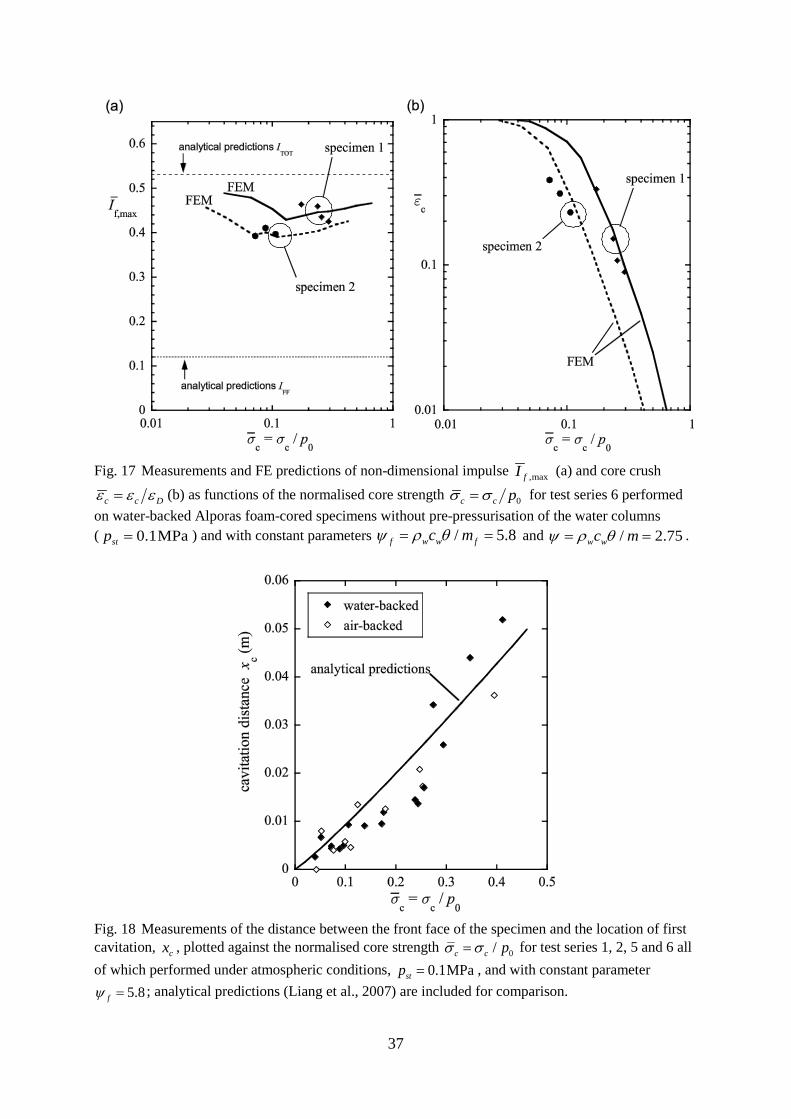
5.2.2 Air-backed sandwich plates In Fig. 12a, FE predictions and measurements of ( )fv t and ( )bv t are presented for the case of
experiment 3, performed on specimen 1 (Alporas foam core, 2MPacs = ) in air-backed
configuration. The corresponding time histories ( )fu t and ( )bu t are shown in Fig. 12b and
high-speed photographs for this experiment are illustrated in Fig.7. Upon the impact of the
shock wave on the specimen, both face sheets are set in motion, almost simultaneously,
rapidly reaching their respective peak values, as seen in Fig. 12a. Subsequently, the specimen
decelerates owing to air-resistance and both face sheets oscillate consequent to elastic spring-
back of the core. The measurements of ( )fu t and ( )bu t included in Fig. 12b show that plastic
core deformation was negligible in this experiment and the FE predictions confirm this.
5.3 Comparison of air-backed and water-backed sandwich plates The intensity of the loads imparted to the sandwich consequent to underwater blast, as
quantified by the specific impulse (per unit area) applied on the specimen front face ( )fI t ,
was deduced by employing a combination of dynamic fluid pressure measurements and
analysis of high-speed photographs, as described below.
First, consider the 1D problem of a submerged air-backed sandwich plate subject to
loading by an arbitrary pressure history ( )fp t on the wet face. Assume that the mass of the
core is negligible in comparison to the face sheets (sandwich cores only contributed 4%-6% to
the mass of the total sandwich specimens). Then conservation of linear momentum dictates
( ) ( ) ( ) ( )0
- d .t
f f st f f b bI t p p m v t m v tt t = = + ∫ (17)
20
The velocity histories ( )fv t and ( )bv t , such as shown in Fig. 12, are extracted from the high-
speed photographs and the impulse ( )fI t imparted to the air-backed plate immediately
follows from eq. (17).
For a sandwich plate in contact with water on both sides, a pressure wave ( )bp t∗ is
radiated into the water column from the specimen’s back face; then conservation of linear
momentum provides
( ) ( ) ( ) ( ) ( ) ( )
( ) ( ) ( ) ( )0 0
0.
t t
f f b b f st b f b
t
f f f b b b
m v t m v t p p p d I t p d
I t m v t m v t p d
t t t t t
t t
∗ ∗
∗
+ = − − = − ⇒
⇒ = + +
∫ ∫∫
(18)
In the experiments, the time histories ( )bp t∗ were measured using a piezoelectric pressure
gauge (see Fig. 2) while the time histories ( )fv t and ( )bv t were obtained from high-speed
photographs and the imparted impulse ( )fI t followed from evaluating eq. (18). Note that
friction between the O-rings and the tube wall is neglected in eqs. (17) and (18) (such
frictional forces were measured to be < 15 N).
We now proceed with a quantitative comparison of both core compression FcD
(quantified by the non-dimensional parameter ( )/F wc c θD ) and imparted peak impulse,
( ) ( ),max 0max 2f fI I t p θ = in non-dimensional form, between air-backed and water-backed
sandwich plates.
When a water-backed sandwich plate is subject to loading by a shock wave on the
front face the water in contact with the back face sheet significantly impedes motion of the
sandwich and promotes plastic compression of the sandwich core (see Figs. 4 and 5). In order
to quantify this effect, two test series were performed varying the shock impulse 0 02I p θ=
by adjusting peak pressure and decay time, and with 0.1MPastp = .
Test series 1 was performed in water-backed configuration on specimen 1 (Alporas
foam core, 2MPacs = , see Table 1) and was then repeated with specimen 4 (Rohacell foam
core, 1.1MPacs = , see Table 1) in order to compare the response of a softer core. In test
series 2 the same types of specimens were used and an air-backed setup was employed. In
Fig.13 measurements of non-dimensional core compression ( )/F wc c θD are plotted against
the normalised shock impulse, 0 02 / f c DI p m cθ s ε= , for test series 1 and 2. Finite element
simulations were performed in accordance to these experiments and their predictions are
21
included in Fig. 13 for comparison as solid lines. It can be seen from the measurements that,
for given 0I , the core compression of a sandwich plate is remarkably increased when the plate
is in contact with water on both face sheets and the FE results confirm this.
Measurements and FE predictions of the normalised peak impulse
( ),max ,max 02f fI I p θ= corresponding to both test series 1 and 2 are presented in Fig. 14 as
functions of the FSI parameter ψ ; analytical predictions [13] for rigid plates of mass equal to
the total sandwich specimens ( 25gM = ) are included in Fig. 14 for both air-backed and
water-backed configurations. For air-backed specimens, the measured and predicted values of
,maxfI show that the effect of sandwich construction is to reduce the imparted impulse by
approximately 18% in the range investigated (compared to the corresponding predictions for
monolithic plates); such reductions are more pronounced for specimen 4 (Rohacell foam core,
Table 1) due to increased core compression induced in these experiments, see Fig. 13. While
it is widely accepted that the response of a sandwich plate may outperform that of an
equivalent monolithic structure, it merits comments that in the case of water-backed
sandwiches the reduction in imparted impulse obtained by employing the sandwich
construction over the monolithic one increases to around 30%; we infer that the advantages of
the sandwich construction over the monolithic one are maximised for water-backed sandwich
plates. It is also concluded from Fig. 14 that the response of water-backed sandwich plates is
more sensitive to the core strength than that of air-backed sandwich structures.
5.4 Effect of hydrostatic fluid pressure The severity of structural loading consequent to underwater blast can be quantified by the
maximum non-dimensional impulse, ( ) ( ),max 0max 2f fI I t p θ = , applied on the loaded
surface of the structure, while the core crush /c Fc cε = D is partially indicative of the integrity
of a sandwich plate subject to blast. In the following we employ measurements and FE
predictions of ,maxfI and cε to explore the sensitivity of the non-dimensional impulse
( ),max ,max 02f fI I p θ= and core crush c c Dε ε ε= to the normalised hydrostatic fluid pressure
st st cp p s∗ = .
Two additional test series were performed with the initial hydrostatic fluid pressure
stp varied in each series by pressurising the water in the tube prior to shock-loading, as
22
described in Section 3.1, and with peak pressure 0p and decay time θ of the incident shock
wave held approximately constant, yielding constant parameters / 5.8f w w fc mψ ρ θ= = and
/ 2.75w wc mψ ρ θ= = for the experiments in these series. Test series 3 was performed using
specimen 1 ( 2MPacs = ) while specimen 4 ( 1.1MPacs = ) was employed to perform the
experiments for test series 4; in both these test series, specimens were loaded in water-backed
configuration.
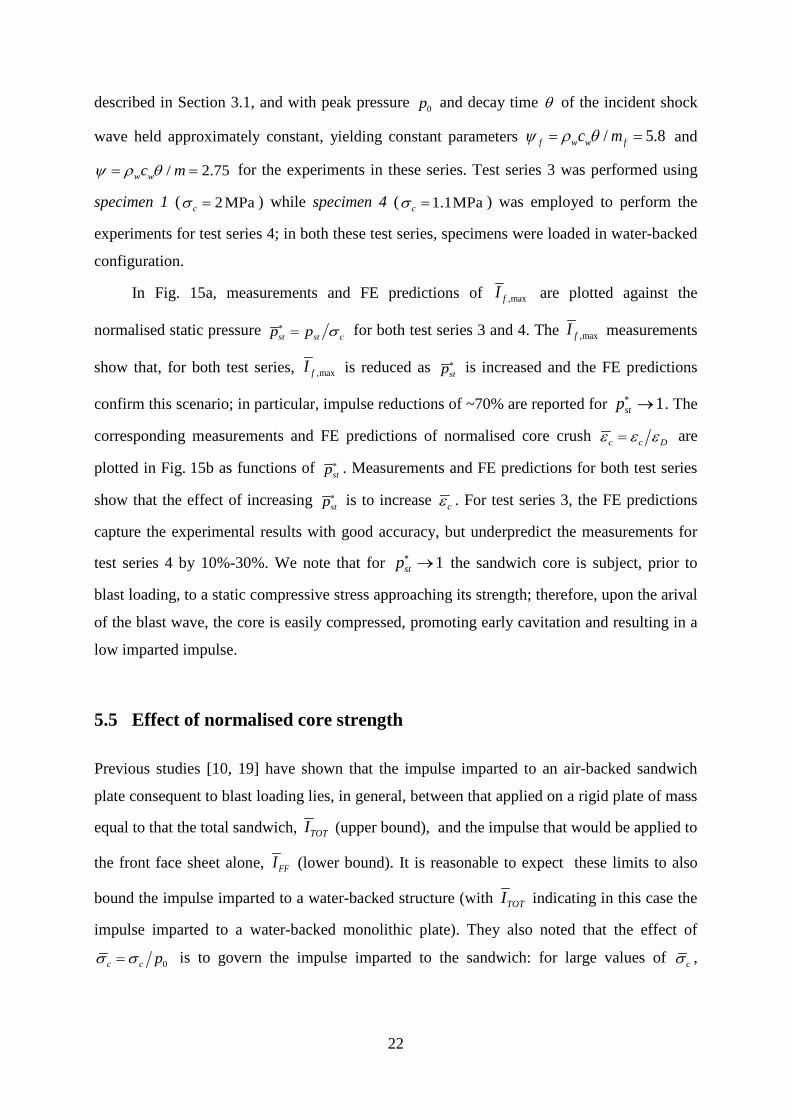
In Fig. 15a, measurements and FE predictions of ,maxfI are plotted against the
normalised static pressure st st cp p s∗ = for both test series 3 and 4. The ,maxfI measurements
show that, for both test series, ,maxfI is reduced as stp∗ is increased and the FE predictions
confirm this scenario; in particular, impulse reductions of ~70% are reported for 1stp∗ → . The
corresponding measurements and FE predictions of normalised core crush c c Dε ε ε= are
plotted in Fig. 15b as functions of stp∗ . Measurements and FE predictions for both test series
show that the effect of increasing stp∗ is to increase cε . For test series 3, the FE predictions
capture the experimental results with good accuracy, but underpredict the measurements for
test series 4 by 10%-30%. We note that for 1stp∗ → the sandwich core is subject, prior to
blast loading, to a static compressive stress approaching its strength; therefore, upon the arival
of the blast wave, the core is easily compressed, promoting early cavitation and resulting in a
low imparted impulse.
5.5 Effect of normalised core strength Previous studies [10, 19] have shown that the impulse imparted to an air-backed sandwich
plate consequent to blast loading lies, in general, between that applied on a rigid plate of mass
equal to that the total sandwich, TOTI (upper bound), and the impulse that would be applied to
the front face sheet alone, FFI (lower bound). It is reasonable to expect these limits to also
bound the impulse imparted to a water-backed structure (with TOTI indicating in this case the
impulse imparted to a water-backed monolithic plate). They also noted that the effect of
0c c ps s= is to govern the impulse imparted to the sandwich: for large values of cs ,
23
,maxf TOTI I→ , while ,maxf FFI I→ for sufficiently small values of cs . We shall show below
that this is not always the case.
Further water-backed experiments were performed, at 0.1MPastp = , keeping the FSI
parameter ψ constant and varying 0c c ps s= by adjusting both peak pressure 0p and
collapse strength of the sandwich, cs . Due to the relatively low Young’s modulus cE of
polymeric foams, the Rohacell foam-cored specimens give a more compliant elastic response
to blast loading; we expect this behaviour to be detrimental to the performance of the
sandwich (Schiffer et al. [13] concluded similarly for rigid spring-supported plates). In order
to quantify this effect, it is instructive to separate the results of Rohacell and Alporas foam-
cored specimens: in the following we denote as test series 5 the set of experiments performed
on specimens 3, 4 and 5, all of which comprising Rohacell foam cores, while the experiments
conducted with specimens 1 and 2 (Alporas foam cores) are referred to as test series 6 in the
following.
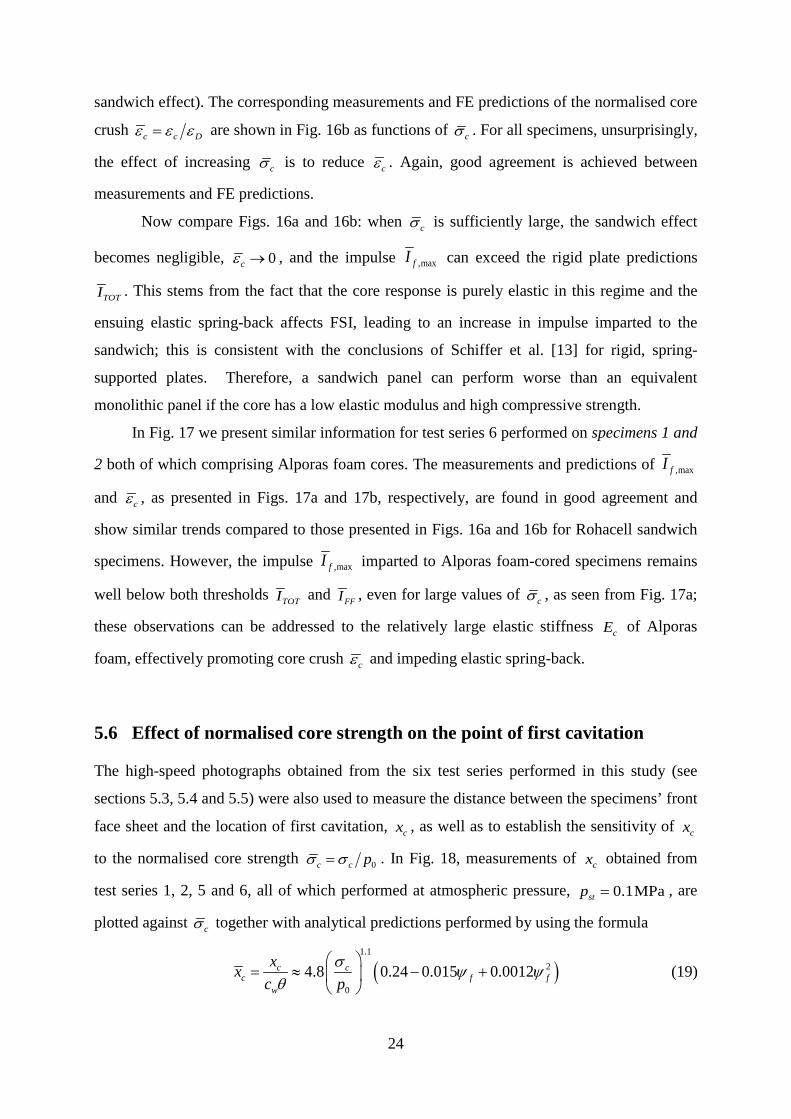
In Fig. 16a measurements of ,maxfI obtained from test series 5 (Rohacell cores) are
plotted against the normalised core strength 0c c ps s= together with FE predictions. Note
that the measurements only cover a limited range of cs owing to the fact that safe operation
of the acrylic shock tube can only be guaranteed up to an internal pressure of 20 MPa. In
addition, we include in Fig. 16a analytical predictions [13] of the imparted impulse associated
with blast loading on water-backed rigid plates of mass equal to the total sandwich, TOTI , and
to an air-backed face sheet alone, FFI . We recall that Schiffer et al. [13] showed that the
impulse imparted to a water-backed rigid plate tends to a limit value of 0.5 when ψ →∞ ,
while for air-backed rigid plates, ,max 0fI → when ψ →∞ (this can also be seen from Fig.
14). Therefore impulse reductions consequent to light-weight construction are less
pronounced when a rigid plate is in contact with water on both sides. The measurements, in
good agreement with the FE predictions, show that ,maxfI does not rise monotonically as cs
is increased, and that it can achieve values greater than TOTI . Upon increasing 0p , i.e.
decreasing 0c c ps s= , the impulse ,maxfI gradually reduces until a minimum is reached. The
location of this minimum on the cs -axis depends on the type of core employed. When cs is
decreased beyond this minimum, ,maxfI rises again; this is a consequence of sandwich core
locking due to full densification of the foam material when c Dε ε→ (leading to loss of the
24
sandwich effect). The corresponding measurements and FE predictions of the normalised core
crush c c Dε ε ε= are shown in Fig. 16b as functions of cs . For all specimens, unsurprisingly,
the effect of increasing cs is to reduce cε . Again, good agreement is achieved between
measurements and FE predictions.
Now compare Figs. 16a and 16b: when cs is sufficiently large, the sandwich effect
becomes negligible, 0cε → , and the impulse ,maxfI can exceed the rigid plate predictions
TOTI . This stems from the fact that the core response is purely elastic in this regime and the
ensuing elastic spring-back affects FSI, leading to an increase in impulse imparted to the
sandwich; this is consistent with the conclusions of Schiffer et al. [13] for rigid, spring-
supported plates. Therefore, a sandwich panel can perform worse than an equivalent
monolithic panel if the core has a low elastic modulus and high compressive strength.
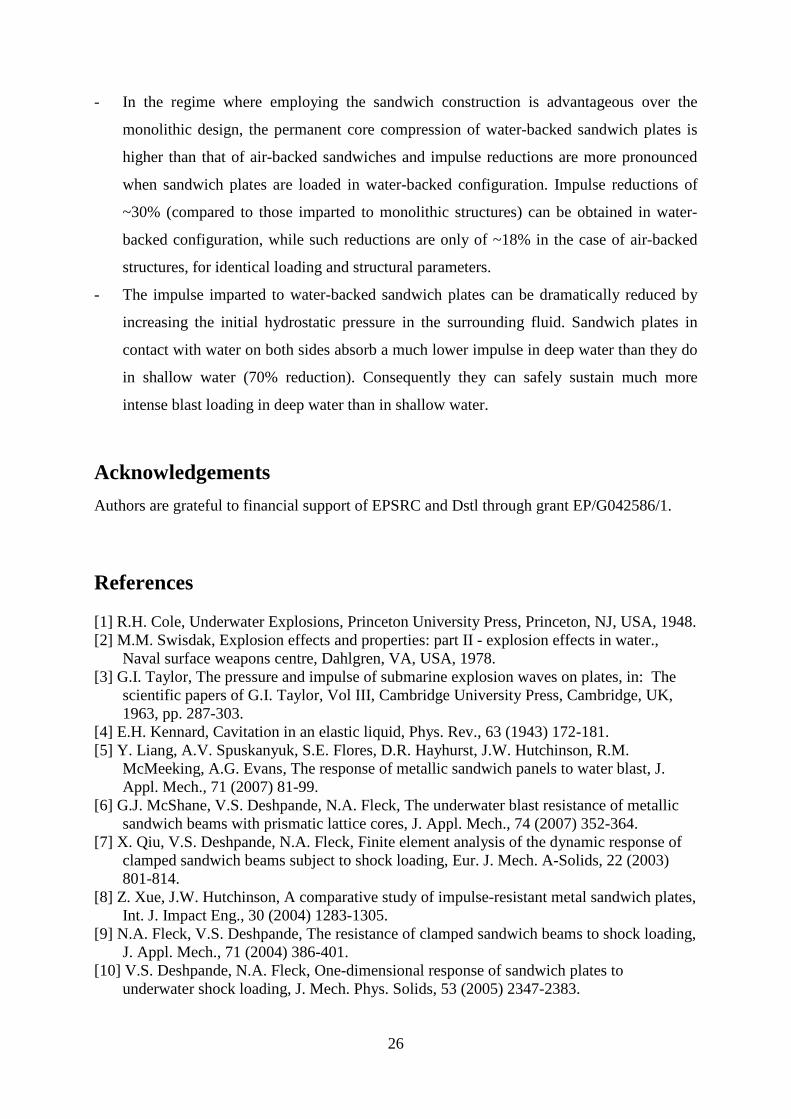
In Fig. 17 we present similar information for test series 6 performed on specimens 1 and
2 both of which comprising Alporas foam cores. The measurements and predictions of ,maxfI
and cε , as presented in Figs. 17a and 17b, respectively, are found in good agreement and
show similar trends compared to those presented in Figs. 16a and 16b for Rohacell sandwich
specimens. However, the impulse ,maxfI imparted to Alporas foam-cored specimens remains
well below both thresholds TOTI and FFI , even for large values of cs , as seen from Fig. 17a;
these observations can be addressed to the relatively large elastic stiffness cE of Alporas
foam, effectively promoting core crush cε and impeding elastic spring-back.
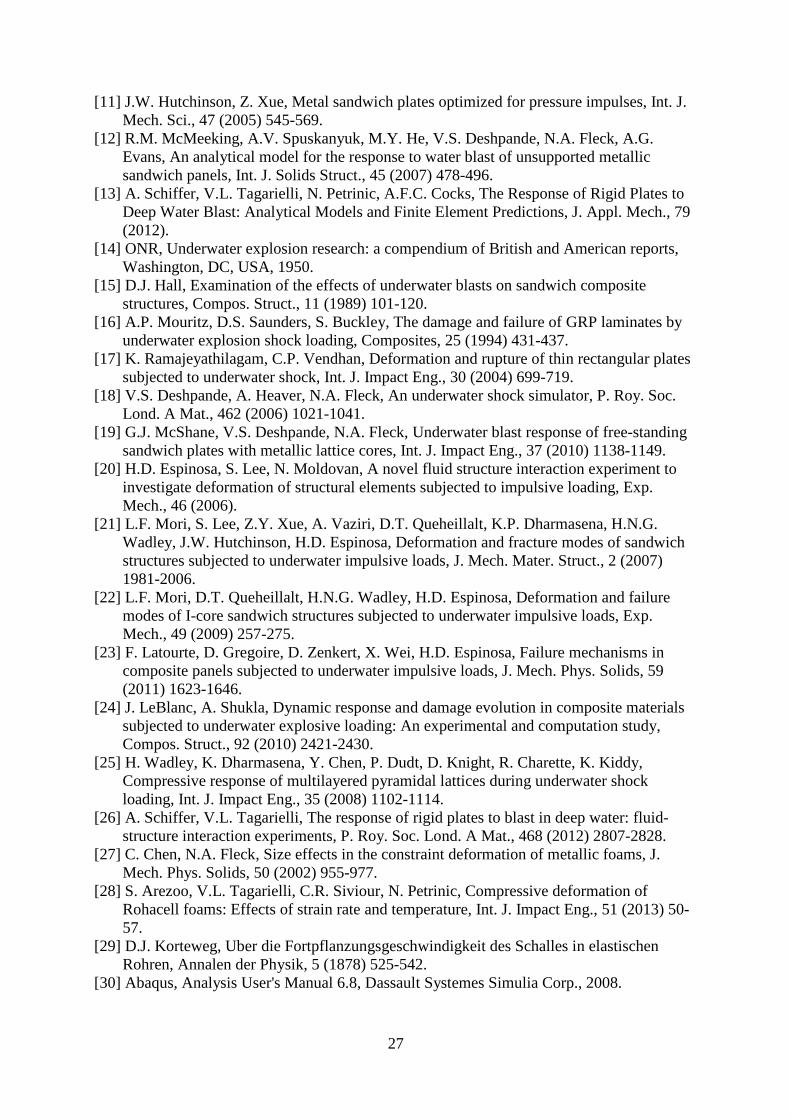
5.6 Effect of normalised core strength on the point of first cavitation The high-speed photographs obtained from the six test series performed in this study (see
sections 5.3, 5.4 and 5.5) were also used to measure the distance between the specimens’ front
face sheet and the location of first cavitation, cx , as well as to establish the sensitivity of cx
to the normalised core strength 0c c ps s= . In Fig. 18, measurements of cx obtained from
test series 1, 2, 5 and 6, all of which performed at atmospheric pressure, 0.1MPastp = , are
plotted against cs together with analytical predictions performed by using the formula
( )1.1
2
0
4.8 0.24 0.015 0.0012c cc f f
w
xxc p
s ψ ψθ
= ≈ − +
(19)
25
introduced by Liang et al. [5] for blast loading of air-backed sandwich plates with
00 0.35 and 0 8c fps ψ< < < < ; experimental results are only shown for experiments
conducted with 0.12msθ = , thus / 5.8f w w fc mψ ρ θ= = for all experiments in Fig. 18
( 221.8kgmfm −≅ , see Section 2). Predictions and measurements are found in good
agreement, indicating that the specimen’s arrangement, i.e. water-backed or air-backed, does
not notably affect the location of first cavitation.
6. CONCLUDING REMARKS In this study the response of air-backed and water-backed sandwich plates subject to blast
loading in deep and shallow water has been investigated. Underwater blast experiments were
performed on sandwich specimens comprising metallic face sheets and low-density foam
cores (metallic and polymeric) by using a shock tube developed in a previous study [26]. Face
sheet motion, core compression and cavitation processes subsequent to blast loading were
directly observed, for the first time, using high-speed photography. The main conclusions
from the study are as follows:
- The cavitation process associated to underwater blast loading of water-backed and air-
backed sandwich plates initiates at a finite distance cx from the fluid-structure interface,
giving rise to two breaking fronts emanating from this point and propagating in opposite
directions at supersonic speed; the breaking front approaching the structure may invert its
motion before reaching the fluid-structure interface; therefore the assumption that this BF
is reflected at the fluid-structure interface, adopted in previous theoretical studies, can be
inadequate and more detailed theoretical models are necessary. The details of water
cavitation strongly influence the pressure histories on the sandwich structures and the
imparted impulse is very sensitive to initial static pressure and strength of the foam core.
- Both air-backed and water-backed sandwich plates may or may not outperform rigid
plates of equal mass in terms of the impulse imparted to the structure in a blast event;
where core materials with low elastic modulus and relatively high strength are employed,
an elastic core response and a large spring-back are promoted: this can lead to an impulse
higher than that imparted to an equivalent monolithic structure.
26
- In the regime where employing the sandwich construction is advantageous over the
monolithic design, the permanent core compression of water-backed sandwich plates is
higher than that of air-backed sandwiches and impulse reductions are more pronounced
when sandwich plates are loaded in water-backed configuration. Impulse reductions of
~30% (compared to those imparted to monolithic structures) can be obtained in water-
backed configuration, while such reductions are only of ~18% in the case of air-backed
structures, for identical loading and structural parameters.
- The impulse imparted to water-backed sandwich plates can be dramatically reduced by
increasing the initial hydrostatic pressure in the surrounding fluid. Sandwich plates in
contact with water on both sides absorb a much lower impulse in deep water than they do
in shallow water (70% reduction). Consequently they can safely sustain much more
intense blast loading in deep water than in shallow water.
Acknowledgements Authors are grateful to financial support of EPSRC and Dstl through grant EP/G042586/1. References [1] R.H. Cole, Underwater Explosions, Princeton University Press, Princeton, NJ, USA, 1948. [2] M.M. Swisdak, Explosion effects and properties: part II - explosion effects in water.,
Naval surface weapons centre, Dahlgren, VA, USA, 1978. [3] G.I. Taylor, The pressure and impulse of submarine explosion waves on plates, in: The
scientific papers of G.I. Taylor, Vol III, Cambridge University Press, Cambridge, UK, 1963, pp. 287-303.
[4] E.H. Kennard, Cavitation in an elastic liquid, Phys. Rev., 63 (1943) 172-181. [5] Y. Liang, A.V. Spuskanyuk, S.E. Flores, D.R. Hayhurst, J.W. Hutchinson, R.M.
McMeeking, A.G. Evans, The response of metallic sandwich panels to water blast, J. Appl. Mech., 71 (2007) 81-99.
[6] G.J. McShane, V.S. Deshpande, N.A. Fleck, The underwater blast resistance of metallic sandwich beams with prismatic lattice cores, J. Appl. Mech., 74 (2007) 352-364.
[7] X. Qiu, V.S. Deshpande, N.A. Fleck, Finite element analysis of the dynamic response of clamped sandwich beams subject to shock loading, Eur. J. Mech. A-Solids, 22 (2003) 801-814.
[8] Z. Xue, J.W. Hutchinson, A comparative study of impulse-resistant metal sandwich plates, Int. J. Impact Eng., 30 (2004) 1283-1305.
[9] N.A. Fleck, V.S. Deshpande, The resistance of clamped sandwich beams to shock loading, J. Appl. Mech., 71 (2004) 386-401.
[10] V.S. Deshpande, N.A. Fleck, One-dimensional response of sandwich plates to underwater shock loading, J. Mech. Phys. Solids, 53 (2005) 2347-2383.
27
[11] J.W. Hutchinson, Z. Xue, Metal sandwich plates optimized for pressure impulses, Int. J. Mech. Sci., 47 (2005) 545-569.
[12] R.M. McMeeking, A.V. Spuskanyuk, M.Y. He, V.S. Deshpande, N.A. Fleck, A.G. Evans, An analytical model for the response to water blast of unsupported metallic sandwich panels, Int. J. Solids Struct., 45 (2007) 478-496.
[13] A. Schiffer, V.L. Tagarielli, N. Petrinic, A.F.C. Cocks, The Response of Rigid Plates to Deep Water Blast: Analytical Models and Finite Element Predictions, J. Appl. Mech., 79 (2012).
[14] ONR, Underwater explosion research: a compendium of British and American reports, Washington, DC, USA, 1950.
[15] D.J. Hall, Examination of the effects of underwater blasts on sandwich composite structures, Compos. Struct., 11 (1989) 101-120.
[16] A.P. Mouritz, D.S. Saunders, S. Buckley, The damage and failure of GRP laminates by underwater explosion shock loading, Composites, 25 (1994) 431-437.
[17] K. Ramajeyathilagam, C.P. Vendhan, Deformation and rupture of thin rectangular plates subjected to underwater shock, Int. J. Impact Eng., 30 (2004) 699-719.
[18] V.S. Deshpande, A. Heaver, N.A. Fleck, An underwater shock simulator, P. Roy. Soc. Lond. A Mat., 462 (2006) 1021-1041.
[19] G.J. McShane, V.S. Deshpande, N.A. Fleck, Underwater blast response of free-standing sandwich plates with metallic lattice cores, Int. J. Impact Eng., 37 (2010) 1138-1149.
[20] H.D. Espinosa, S. Lee, N. Moldovan, A novel fluid structure interaction experiment to investigate deformation of structural elements subjected to impulsive loading, Exp. Mech., 46 (2006).
[21] L.F. Mori, S. Lee, Z.Y. Xue, A. Vaziri, D.T. Queheillalt, K.P. Dharmasena, H.N.G. Wadley, J.W. Hutchinson, H.D. Espinosa, Deformation and fracture modes of sandwich structures subjected to underwater impulsive loads, J. Mech. Mater. Struct., 2 (2007) 1981-2006.
[22] L.F. Mori, D.T. Queheillalt, H.N.G. Wadley, H.D. Espinosa, Deformation and failure modes of I-core sandwich structures subjected to underwater impulsive loads, Exp. Mech., 49 (2009) 257-275.
[23] F. Latourte, D. Gregoire, D. Zenkert, X. Wei, H.D. Espinosa, Failure mechanisms in composite panels subjected to underwater impulsive loads, J. Mech. Phys. Solids, 59 (2011) 1623-1646.
[24] J. LeBlanc, A. Shukla, Dynamic response and damage evolution in composite materials subjected to underwater explosive loading: An experimental and computation study, Compos. Struct., 92 (2010) 2421-2430.
[25] H. Wadley, K. Dharmasena, Y. Chen, P. Dudt, D. Knight, R. Charette, K. Kiddy, Compressive response of multilayered pyramidal lattices during underwater shock loading, Int. J. Impact Eng., 35 (2008) 1102-1114.
[26] A. Schiffer, V.L. Tagarielli, The response of rigid plates to blast in deep water: fluid-structure interaction experiments, P. Roy. Soc. Lond. A Mat., 468 (2012) 2807-2828.
[27] C. Chen, N.A. Fleck, Size effects in the constraint deformation of metallic foams, J. Mech. Phys. Solids, 50 (2002) 955-977.
[28] S. Arezoo, V.L. Tagarielli, C.R. Siviour, N. Petrinic, Compressive deformation of Rohacell foams: Effects of strain rate and temperature, Int. J. Impact Eng., 51 (2013) 50-57.
[29] D.J. Korteweg, Uber die Fortpflanzungsgeschwindigkeit des Schalles in elastischen Rohren, Annalen der Physik, 5 (1878) 525-542.
[31] V.S. Deshpande, N.A. Fleck, Isotropic Constitutive Model for Metallic Foams, J. Mech. Phys. Solids, 48 (2000) 1253-1276.
[32] S. Arezoo, V.L. Tagarielli, N. Petrinic, J.M. Reed, The mechanical response of Rohacell foams at different length scales, J. Mater. Sci., 46 (2011) 6863-6870.
[33] K.A. Dannemann, J. Lankford, High strain rate compression of closed-cell aluminium foams, Mater. Sci. Eng. A-Struct., 293 (2000) 157-164.
[34] D.D. Radford, V.S. Deshpande, N.A. Fleck, The use of metal foam projectiles to simulate shock loading on a structure, Int. J. Impact Eng., 31 (2005) 1152-1171.
[35] V. Tagarielli, L., V.S. Deshpande, N.A. Fleck, Prediction of the dynamic response of composite sandwich beams under shock loading, Int. J. Impact Eng., 37 (2010) 854-864.
Tables Table 1: Properties and dimensions of the sandwich specimens considered in this study; values of
cs , Dε and cE were obtained from quasi-static compression tests. foam
material foam
density foam
pore size core
diameter core
thickness compressive
strength densification
strain Young's modulus
ρc
(kgm-3) dp (mm) dc (mm) c (mm) σc (MPa) εD Ec (MPa)
Fig. 1 Measurements of the nominal compressive stress versus strain response obtained from quasi-static compression tests with (a) specimens 1 and 2 (Alporas foam) and (b) specimens 3-5 (Rohacell foam).
Fig. 2 (a) Schematic of the laboratory setup used to perform underwater blast experiments on a water-backed sandwich specimen; (b) details of specimen geometry; (c) sketch of the compound striker used to generate blast wave in initially pressurised water.
30
Fig. 3 Schematic of the FE model used to simulate the 1D response of a water-backed sandwich plate subjected to loading by a shock wave at the front face sheet with initially unpressurised fluid-columns. The FE models for air-backed sandwich plates follow a similar scheme, with the fluid column attached to the plate’s back face sheet absent.
0.145msθ = ) performed on specimen 1 (Alporas foam): (a) shock wave reaches the water-backed sandwich specimen; (b) onset of cavitation and propagation of two breaking fronts (BF); (c) emergence of a closing front (CF); (d) complete collapse of the cavitated region.
0.145msθ = ) performed on specimen 4 (Rohacell foam): (a) shock wave reaches the water-backed sandwich specimen; (b) onset of cavitation and propagation of a breaking front (BF); (c) emergence of a closing front (CF); (d) cavitation zone has entirely collapsed.
Fig. 6 Measurements and FE predictions of the closing front (CF) and breaking front (BF) trajectories plotted in a time versus distance chart for experiments 1 and 2, both conducted in water-backed configuration; analytical predictions for a monolithic plate of mass equal to the total sandwich ( 26.3gM = , 0 11.4MPap = , 0.1MPastp = , 0.145msθ = ) are included for comparison.
0.11msθ = ) performed on specimen 1 (Alporas foam): (a) shock wave reaches the air-backed sandwich specimen; (b) onset of cavitation and propagation of a breaking front (BF); (c) emergence of a closing front (CF); (d) further propagation of the closing front (CF).
0.145msθ = ) performed on specimen 4 (Rohacell foam): (a) shock wave reaches the air-backed sandwich specimen; (b) onset of cavitation and propagation of a breaking front (BF); (c) emergence of a closing front (CF); (d) further propagation of the closing front (CF).
33
Fig. 9 Measurements and FE predictions of the closing front (CF) and breaking front (BF) trajectories plotted in a time versus distance chart for experiments 3 and 4, both performed in air-backed configuration; analytical predictions for a monolithic plate of mass equal to the total sandwich ( 26.3gM = , 0.1MPastp = , 0 11.1MPap = , 0.145msθ = ) are included for comparison.
Fig. 10 (a) Measured time histories of front and back face velocities for experiment 1 ( 0.1MPastp = ,
0 11.4MPap = , 0.145msθ = ) performed on specimen 1 (Alporas foam core) in water-backed configuration; (b) displacement versus time histories for the same experiments; FE predictions (dashed curves) are included for comparison.
34
Fig. 11 (a) Measured time histories of front and back face velocities for experiment 5 ( 1.05MPastp = , 0 8.8MPap = , 0.12msθ = ) performed on specimen 1 (Alporas foam core) in water-backed configuration; (b) displacement versus time histories for the same experiment; FE predictions (dashed curves) are included for comparison.
Fig. 12 (a) Measured and predicted time histories of front and back face velocities for experiment 3 ( 0.1MPastp = , 0 8.1MPap = , 0.11msθ = ) performed on specimen 1 (Alporas foam) in air-backed configuration; (b) displacement versus time histories for the same experiment.
35
Fig. 13 Measurements and FE predictions of normalised permanent core compression ( )/F wc c θDinduced in test series 1 (water-backed specimens) and test series 2 (air-backed specimens) as functions of the normalised shock impulse,
0 / f c DI m cs ε . For both test series two different specimens were used: results for specimen 1 (Alporas foam core) are indicated by the full diamonds and solid curves while the empty diamonds and dashed curves represent results for specimen 4 (Rohacell foam core).
Fig. 14 Experimental measurements and FE predictions of the non-dimensional impulse ,maxfI as functions of the parameter ψ for experiments of test series 1 (water-backed specimens) and test series 2 (air-backed specimens); for both test series two different specimens were used: results for specimen 1 (Alporas foam core) are indicated by the full diamonds and solid curves while the empty diamonds and dashed curves represent the results for specimen 4 (Rohacell foam core); analytical predictions for monolithic plates of mass equal to the total sandwich are included for comparison (dotted curves).
36
Fig. 15 (a) Sensitivity of the non-dimensional impulse ,maxfI to the normalised static pressure
0/st stp p p∗ = measured for test series 1 (specimen 1, Alporas foam) and test series 2 (specimen 4, Rohacell foam) both of which performed with constant parameters 5.8fψ = and 2.75ψ = ; corresponding FE predictions are included for comparison; (b) measurements and FE predictions of core crush c c Dε ε ε= as functions of stp∗ for the same series of experiments.
Fig. 16 Measurements and FE predictions of non-dimensional impulse ,maxfI (a) and core crush
c c Dε ε ε= (b) as functions of the normalised core strength 0c c ps s= for test series 5 performed on water-backed Rohacell foam-cored specimens without pre-pressurisation of the water columns ( 0.1MPastp = ) and with constant parameters / 5.8f w w fc mψ ρ θ= = and / 2.75w wc mψ ρ θ= = .
37
Fig. 17 Measurements and FE predictions of non-dimensional impulse ,maxfI (a) and core crush
c c Dε ε ε= (b) as functions of the normalised core strength 0c c ps s= for test series 6 performed on water-backed Alporas foam-cored specimens without pre-pressurisation of the water columns ( 0.1MPastp = ) and with constant parameters / 5.8f w w fc mψ ρ θ= = and / 2.75w wc mψ ρ θ= = .
Fig. 18 Measurements of the distance between the front face of the specimen and the location of first cavitation, cx , plotted against the normalised core strength 0/c c ps s= for test series 1, 2, 5 and 6 all of which performed under atmospheric conditions, 0.1MPastp = , and with constant parameter
5.8fψ = ; analytical predictions (Liang et al., 2007) are included for comparison.