25
1 ONE Future 2018 Methane Emission Intensities A Progress Report November 4, 2019
1
ONE Future 2018 Methane Emission Intensities
A Progress Report
November 4, 2019

2
ONE Future Member Companies
3
TABLE OF CONTENTS TABLE OF CONTENTS ................................................................................................................ 3 EXECUTIVE SUMMARY ............................................................................................................ 4
INTRODUCTION TO ONE FUTURE .......................................................................................... 7
ONE FUTURE EMISSIONS INTENSITY APPROACH ............................................................. 9
SECTOR SUMMARIES .............................................................................................................. 11
Production ................................................................................................................................. 11
Gathering and Boosting ............................................................................................................ 13
Processing ................................................................................................................................. 15
Transmission and Storage ......................................................................................................... 17
Distribution ............................................................................................................................... 19
CONCLUSIONS........................................................................................................................... 21
APPENDIX A ............................................................................................................................... 24
Future Considerations and Improvements for the Program ...................................................... 24
APPENDIX B ............................................................................................................................... 25
Year-to-Year Changes in the Emission Calculation Approach ................................................ 25
LIST OF TABLES TABLE 1: ONE FUTURE MEMBER COMPANIES .................................................................. 7
LIST OF FIGURES Figure 1. Illustration of ONE Future 2025 Target ........................................................................ 9
Figure 2. ONE Future’s Methane Emission for Production .........................................................11
Figure 3. ONE Future’s Methane Emissions for Gathering and Boosting...................................13
Figure 4. ONE Future’s Methane Emissions for Processing ....................................................... 15
Figure 5. ONE Future’s Methane Emissions for Transmission and Storage ...............................17
Figure 6. ONE Future’s Methane Emissions for Distribution .....................................................19
Figure 7. ONE Future 2018 Emission Intensity Results Compared to the
2025 ONE Future Target ............................................................................................ 21
Figure 8. ONE Future 2018 and 2017 Emission Intensity Results by Sector for
Two Years of Reporting.............................................................................................. 22
4
REPORT HIGHLIGHTS
ONE Future surpasses goal; 2018 methane intensity of member companiesrecorded at 0.326%, versus 2025 goal of 1.0%
2018 shows an improvement in methane intensity from 2017 intensity of0.552%. There were year-to-year decreases of varying magnitudes in all theONE Future segment intensities.
Overall methane intensity decreased by 41%, demonstrating that thenatural gas industry can minimize methane emissions and increaseproduction and throughput while supplying much needed energy to the U.S.and around the globe for years to come.
EXECUTIVE SUMMARY
Our Nation’s Energy Future (ONE Future) is a coalition of 20 natural gas companies representing the natural gas value chain focused on implementing an innovative, performance-based approach to the management of methane emissions directed toward a concrete goal of one percent (or less) of total produced natural gas by 2025. This is ONE Future’s second annual report, and based on 2018 emissions, ONE Future’s methane intensity is 0.326%. The 2018 ONE Future emissions intensity represents a reduction of 41% versus the intensity from the prior year. Both 2017 and 2018 results demonstrate that ONE Future is already significantly below its one percent methane emission intensity target by 2025.
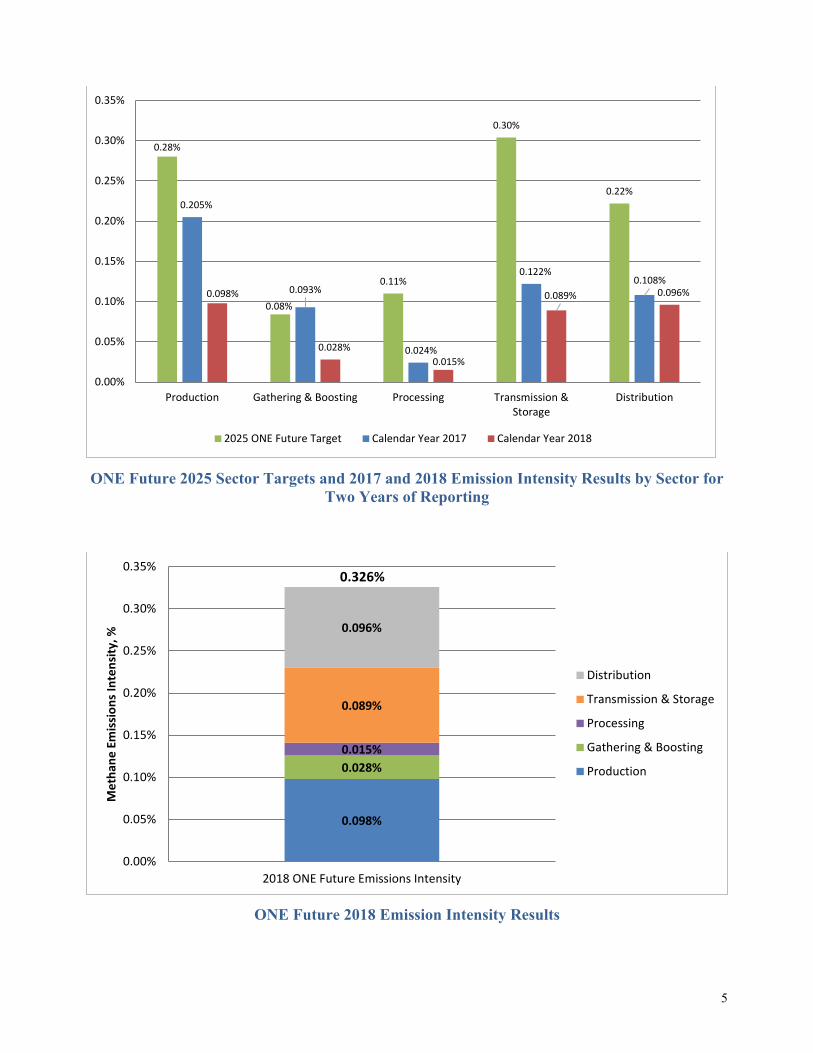
This is the second year of ONE Future reporting, and the two figures below show the sector intensity results compared between 2017 and 2018 and the 2018 industry total intensity results for the ONE Future Member Companies. There were significant reductions in intensities of two segments, as well as decreases in intensity for the remaining three segments.
5
ONE Future 2025 Sector Targets and 2017 and 2018 Emission Intensity Results by Sector for Two Years of Reporting
ONE Future 2018 Emission Intensity Results
0.28%
0.08%
0.11%
0.30%
0.22%0.205%
0.093%
0.024%
0.122%0.108%
0.098%
0.028%0.015%
0.089% 0.096%
0.00%
0.05%
0.10%
0.15%
0.20%
0.25%
0.30%
0.35%
Production Gathering & Boosting Processing Transmission &Storage
Distribution
2025 ONE Future Target Calendar Year 2017 Calendar Year 2018
0.098%
0.028%0.015%
0.089%
0.096%
0.00%
0.05%
0.10%
0.15%
0.20%
0.25%
0.30%
0.35%
2018 ONE Future Emissions Intensity
Met
hane
Em
issi
ons
Inte
nsity
, %
Distribution
Transmission & Storage
Processing
Gathering & Boosting
Production
0.326%
6
A more detailed description of how the reductions were achieved is discussed in each sector report, but a high-level summary of the changes shown in the figures above are listed here:
• In each sector there are new members who have been included in the sector intensity rate forthe 2018 report. Including these new members helped drive down the intensity rate becauseof the work that they have done in the years prior to joining ONE Future. In addition,existing members have reduced their intensities as well.
• ONE Future members in each of the sectors show the following cumulative results from2017 to 2018:
o Production: reduced intensity rate 52% while increasing throughput 18%.o Gathering & Boosting: reduced intensity rate 70% while throughput volumes
increased 262%.o Processing: reduced intensity rate 38% while increasing throughput 806%.o Transmission & Storage: reduced intensity rate 27% while increasing throughput
51%.o Distribution: reduced intensity rate 11% while increasing throughput 9%.
Due to the year-to-year changes in sectors, the net emissions intensity from ONE Future has decreased 41% from 2017, which aligns with our goal to show continual improvement. ONE Future’s overarching goal is to ensure the future of natural gas as a long-term sustainable fuel and that objective will be assured as additional players in the natural gas value chain continue to step up and embrace the benefits of reducing methane emissions. We understand that methane emission reduction, when implemented on a flexible performance-based approach selected by each company, is not just good for the environment, but is also good for the natural gas industry, its employees, customers, communities, and investors.
We strive for continuous improvement to ensure that natural gas remains the fuel of choice for all end-use sectors at all times: power – including natural gas delivered by local distribution companies for power generation; residential, commercial and industrial demand; and critical emerging markets like transportation and LNG exports.
We believe that ONE Future’s results demonstrate that industry can cost-effectively achieve an average emissions intensity rate of one percent or less. ONE Future believes that targeted investment in abatement technologies today can both yield significant improvements in environmental performance and supply chain efficiency.
7
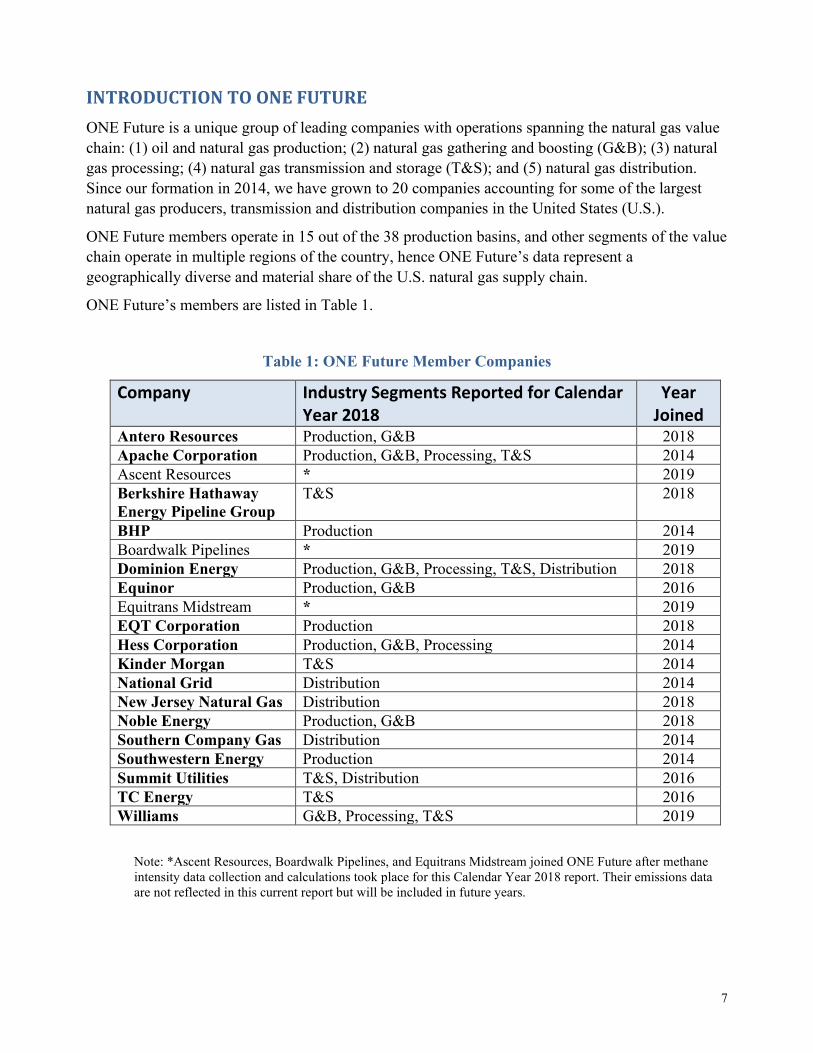
INTRODUCTION TO ONE FUTURE ONE Future is a unique group of leading companies with operations spanning the natural gas value chain: (1) oil and natural gas production; (2) natural gas gathering and boosting (G&B); (3) natural gas processing; (4) natural gas transmission and storage (T&S); and (5) natural gas distribution. Since our formation in 2014, we have grown to 20 companies accounting for some of the largest natural gas producers, transmission and distribution companies in the United States (U.S.).
ONE Future members operate in 15 out of the 38 production basins, and other segments of the value chain operate in multiple regions of the country, hence ONE Future’s data represent a geographically diverse and material share of the U.S. natural gas supply chain.
ONE Future’s members are listed in Table 1.
Table 1: ONE Future Member Companies
Company Industry Segments Reported for Calendar Year 2018
Year Joined
Antero Resources Production, G&B 2018 Apache Corporation Production, G&B, Processing, T&S 2014 Ascent Resources * 2019 Berkshire Hathaway Energy Pipeline Group
T&S 2018
BHP Production 2014 Boardwalk Pipelines * 2019 Dominion Energy Production, G&B, Processing, T&S, Distribution 2018 Equinor Production, G&B 2016 Equitrans Midstream * 2019 EQT Corporation Production 2018 Hess Corporation Production, G&B, Processing 2014 Kinder Morgan T&S 2014 National Grid Distribution 2014 New Jersey Natural Gas Distribution 2018 Noble Energy Production, G&B 2018 Southern Company Gas Distribution 2014 Southwestern Energy Production 2014 Summit Utilities T&S, Distribution 2016 TC Energy T&S 2016 Williams G&B, Processing, T&S 2019
Note: *Ascent Resources, Boardwalk Pipelines, and Equitrans Midstream joined ONE Future after methane intensity data collection and calculations took place for this Calendar Year 2018 report. Their emissions data are not reflected in this current report but will be included in future years.

8
Established as a non-profit 501(c)(6) trade group, ONE Future’s mission is to reduce methane (CH4) emissions across all segments of the natural gas value chain by means of innovative, cost-effective, and performance-based actions.
ONE Future’s approach is goal-oriented but flexible in that member companies can choose how they can cost-effectively and efficiently achieve their CH4 emissions intensity goal for their particular assets – whether that is by deploying an innovative technology, modifying a work practice, or in some cases replacing or retrofitting high emitting equipment. What is important is that each company demonstrates progress toward its target, which in turn allows the group as a whole to achieve ONE Future’s overall emission intensity target (total CH4 emissions divided by gross production) of one percent or less by 20251.
The original goal of one percent, established by the founding members of the ONE Future Coalition in 2014, was partially based on EPA’s 2012 National Greenhouse Gas Inventory2 (referred to as the GHGI) and its national methane emission intensity rate of 1.44%. ONE Future’s one percent goal was ambitious, but the members believed that it was feasible using existing technology and practices. Secondly, peer-reviewed analyses suggested that for natural gas to provide greenhouse gas (GHG) reduction benefits compared to any other fossil fuel in any other end use application, the natural gas industry would have to achieve a methane emission rate of one percent or less across the natural gas value chain3. Finally, by orienting our activities toward a specific and measurable outcome (a sustained low rate of CH4 emissions that is consistent with efficient operations), we focus on identifying the most cost-effective abatement opportunities.
1 The natural gas supply chain does not actually receive the “gross gas production”, as some of the gas is re-injected for re-pressuring before leaving the production site. A “net gas production” value can be calculated that more accurately reflects the gas that flows into the supply chain. This net gas value subtracts the DOE EIA “repressuring” gas from the gross gas production. 2 https://www.epa.gov/ghgemissions/inventory-us-greenhouse-gas-emissions-and-sinks-1990-2012 3 https://www.iea.org/publications/freepublications/publication/weo-2012---special-report---golden-rules-for-a-golden-age-of-gas.html

9
Figure 1 shows the emission intensity targets broken down by industry sector. ONE Future’s target is to cumulatively achieve the one percent (1.0%) methane emission intensity goal for the natural gas supply chain.
Figure 1. Illustration of ONE Future 2025 Target4
ONE Future reviews our targets periodically as we gain a better understanding of the methane intensity data collected each year and the areas that need continued improvement from a data and methane reduction perspective. No matter the actual base level national emissions intensity for the entire U.S., ONE Future members aim to continuously evaluate and implement voluntary actions to achieve an intensity that is below the one percent target.
ONE FUTURE EMISSIONS INTENSITY APPROACH Natural gas is primarily composed of methane, a clean fuel that emits few air pollutants when burned in stove tops, in power plants to generate electricity, or to power vehicle engines. However, when methane is emitted directly into the atmosphere (and not burned), it is a potent greenhouse gas. By reducing methane emissions across the natural gas supply chain, ONE Future members will deliver more value to our customers and shareholders, and increase safety while meaningfully reducing our greenhouse gas emissions.
Although the organization was formed in 2014, all ONE Future member companies have invested in methane mitigation technologies and work-practices for several decades. This report explains ONE
4 For the purposes of Figure 1, individual segment intensity targets were rounded to two significant digits.
0.28%
0.08%
0.11%
0.30%
0.22%
0.00%
0.20%
0.40%
0.60%
0.80%
1.00%
1.20%
2025 ONE Future Target Intensity Values
Met
hane
Em
issi
ons
Inte
nsity
, %
Distribution
Transmission & Storage
Processing
Gathering & Boosting
Production
1.0%
10
Future’s approach through 2018 for quantifying the methane emissions intensity for each Coalition industry sector and presents the resulting methane emission intensity values based on 2018 data.
To enable multiple companies involved in different sectors of the natural gas supply chain to report CH4 emissions in a manner that is both consistent and transparent, ONE Future has developed a Methane Emissions Estimation Protocol (ONE Future Protocol).5 The ONE Future Protocol defines both the annual emissions intensity calculation techniques, as well as the method by which annual results will be compared to the ONE Future sector and overall goals. By using a written protocol, ONE Future participants aim to benchmark performance according to a common and uniform set of emission calculations and measurements so that the results are transparent and verifiable.
ONE Future tracks company and program progress by calculating emission intensities at the national, segment, and participant levels. Segment and participant emission intensities are based on total methane emissions for the particular participant or for all ONE Future companies with operations in a particular segment divided by a segment-based throughput. The initial segment intensity values are not additive across different segments because they are referenced to different segment-specific throughput quantities in the denominator. However, individual segment intensities can be normalized to total national production rates so that the normalized segment intensities become additive. This normalization using national production rates is described in the protocol. ONE Future uses national gas production rates6 that are published annually by the U.S. Department of Energy’s Energy Information Administration (DOE EIA).
The ONE Future Protocol also provides the procedures that member companies will use to quantify and report their emissions and track their progress. The detailed procedures that companies use to compute their emissions largely follows the EPA’s Greenhouse Gas Reporting Program (referred to as the GHGRP)7 or the national GHGI prepared annually by EPA8. ONE Future members have included additional emission sources not required for reporting under the GHGRP and use the latest EPA approved emission factors in their reports.
Recognizing that each member company has unique objectives in addition to the overarching goal of the organization, ONE Future has identified sector-specific targets to benchmark company progress toward their methane reduction goals, as well as to facilitate comparisons among the ONE Future participant companies. The segment intensity values are based on segment emissions divided by segment throughput. Segment intensity targets will be used to track the progress of the participant companies and will also be used to scale participant emissions to the national level to track progress toward ONE Future’s overall emission intensity goal.
5.http://onefuture.us/wp-content/uploads/2018/11/ONE-Future-Methane-Intensity-Protocol_V2.3_27Aug18.docx ONEFuture reserves the right to update the contents of the ONE Future Protocol at any time to maintain alignment with EPAdefinitions and methodologies and reflect EPA’s most current GHG emissions data.6 For the purposes of the ONE Future calculation, natural gas from Alaskan production is not included as gas productionbecause currently it does not enter the natural gas value chain.7 https://www.epa.gov/ghgreporting8 https://www.epa.gov/ghgemissions/inventory-us-greenhouse-gas-emissions-and-sinks-1990-2016

11
SECTOR SUMMARIES Production - Methane Intensity of 0.098%
(Antero Resources, Apache Corporation, BHP, Dominion Energy, Equinor, EQT Corporation, Hess Corporation, Noble Energy, Southwestern Energy)
The Production sector consists of the exploration of natural gas, wells producing natural gas (including oil wells producing gas), and equipment located at the well site associated with natural gas production. Because wells often co-produce natural gas and crude/condensate, the ONE Future Protocol describes an emission allocation approach using the energy content of the various streams to allocate total emissions to those represented by natural gas production only. This allocation is necessary because the ONE Future emission intensity value is based on the gross production of natural gas (co-produced crude or condensate volumes are not included in the natural gas value chain).
ONE Future member companies represent approximately 13% of the total U.S. natural gas production in 2018. The current (2018) ONE Future methane emission intensity value for the production sector is 0.098%. Figure 2 shows the percent contribution by emission source type for the Production segment.
0.098%
0.028%
0.015%
0.089%
0.096%
0.00%
0.05%
0.10%
0.15%
0.20%
0.25%
0.30%
0.35%
2018 ONE Future Emissions Intensity
Met
hane
Em
issi
ons
Inte
nsity
, %
0.326%
68%
9%
7%
4%
3%2% 2%
5%
Pneumatic Devices
Equipment Leaks
Associated GasVenting and FlaringLiquids Unloading
Flare Stacks
Completions andWorkoversCombustion
Other
*Note, Other includes Reciprocating Compressors, Dehydrators, Storage Tanks, Pneumatic Pumps, Offshore Emissions, PRVs, Vessel Blowdowns, Well Drilling, and Well Testing
*
Figure 2: ONE Future's Methane Emissions for Production Figure 2: ONE Future's Methane Emissions for Production

12
ONE Future’s methane intensity value for Production reflects the implementation of some of the following types of methane reduction activities with production operations9:
• Replace or repair high emitting pneumatic devices with low or no-bleed devices10.• Switch natural gas-powered pneumatic devices to devices that use alternative power, where
applicable and/or feasible.• Replacement of natural gas-powered chemical injection pumps with pumps that use alternate
power.• Voluntary leak surveys and repair programs to identify and fix equipment leaks at aboveground
production sites, these surveys include production locations, pneumatics and tanks.• Addition of continuous emission monitors in some locations.• Reduce gas well liquids unloading emissions by installing physical systems to remove liquids
such as through the use of foaming agents, velocity strings, wellhead compression, plunger lifts,and vent-less restoration.
Although not part of the natural gas value chain, the co-production of crude and/or condensate with natural gas represents additional opportunities for methane emission reductions.
For transparency, if crude/condensate methane emissions from production operations were included in the ONE Future methane emission intensity calculation, the resulting production sector methane emissions intensity would be 0.110%, as opposed to the emission intensity value (0.098%) that is based on natural gas production operations only. The result of including emissions from crude/condensate production when calculating the overall emissions intensity across all sectors would be approximately 0.337%, or 3.6% higher than the ONE Future value which is based on natural gas production operations only (0.326%).
It is difficult to assess long-term trends since this is only the second year of ONE Future reporting. However, some short-term year-to-year observations can be made. Addition of new member companies as well as acquisitions and divestitures made by existing member companies help explain some of the year-to-year differences. The methane intensity went from 0.205% in 2017 to 0.098% in 2018, decreasing by 52% while throughput increased 18%. For the production sector, emissions from pneumatic devices remained the largest contributor to this sector’s total reported emissions and its contribution to the total emissions increased from Calendar Year 2017 (CY2017) to CY2018. Equipment leaks and associated gas venting and flaring are now the second and third highest contributors for CY2018 as opposed to liquids unloadings and equipment leaks, respectively, for CY2017.
9 These listed methane reduction activities are intended to represent examples of activities that some of the ONE Future companies have implemented in 2018, but each company has the flexibility to decide on the activities to implement based on what is most appropriate and feasible for their company. 10 Given that pneumatic emissions reported here are driven solely by EPA GHGRP emission factors and not by direct field measurements, this device replacement approach is the only way to affect the large emissions reported here. In the future, actual field measurements of pneumatics may be used which could reflect reductions from voluntary pneumatic device monitoring and repair programs.
13
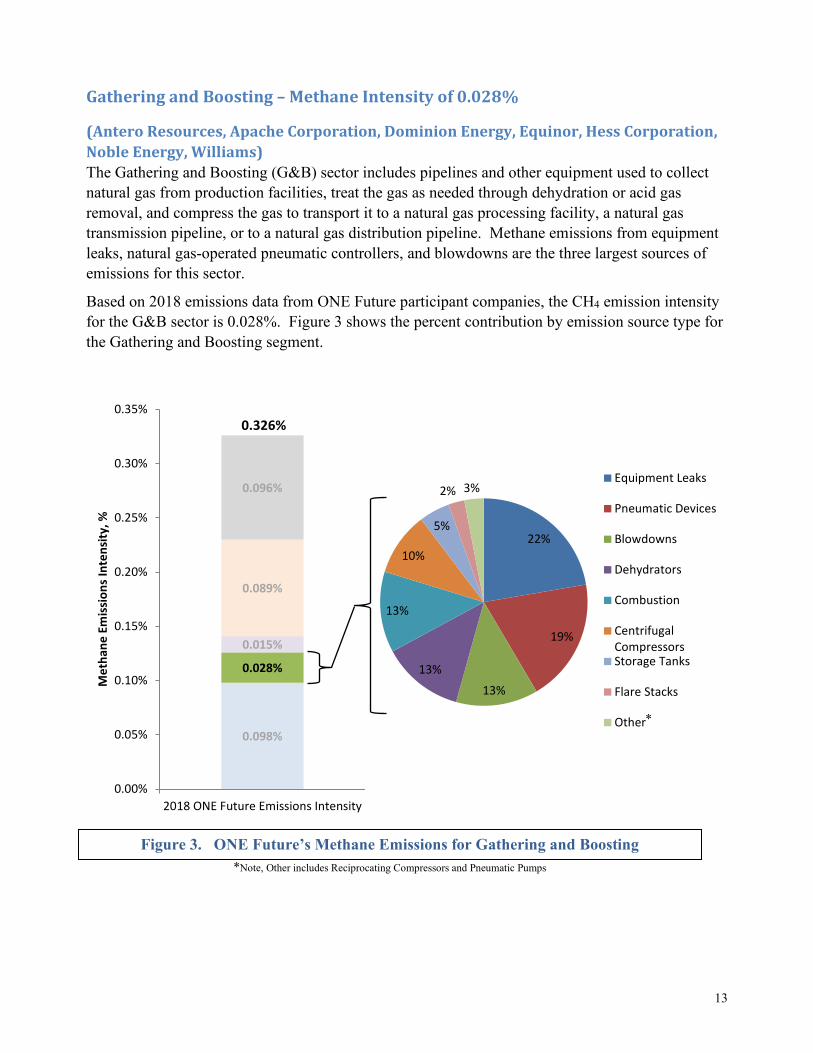
Gathering and Boosting – Methane Intensity of 0.028%
(Antero Resources, Apache Corporation, Dominion Energy, Equinor, Hess Corporation, Noble Energy, Williams) The Gathering and Boosting (G&B) sector includes pipelines and other equipment used to collect natural gas from production facilities, treat the gas as needed through dehydration or acid gas removal, and compress the gas to transport it to a natural gas processing facility, a natural gas transmission pipeline, or to a natural gas distribution pipeline. Methane emissions from equipment leaks, natural gas-operated pneumatic controllers, and blowdowns are the three largest sources of emissions for this sector.
Based on 2018 emissions data from ONE Future participant companies, the CH4 emission intensity for the G&B sector is 0.028%. Figure 3 shows the percent contribution by emission source type for the Gathering and Boosting segment.
22%
19%
13%
13%
13%
10%
5%
2% 3%Equipment Leaks
Pneumatic Devices
Blowdowns
Dehydrators
Combustion
CentrifugalCompressorsStorage Tanks
Flare Stacks
Other0.098%
0.028%
0.015%
0.089%
0.096%
0.00%
0.05%
0.10%
0.15%
0.20%
0.25%
0.30%
0.35%
2018 ONE Future Emissions Intensity
Met
hane
Em
issi
ons
Inte
nsity
, %
0.326%
*
Figure 3. ONE Future’s Methane Emissions for Gathering and Boosting *Note, Other includes Reciprocating Compressors and Pneumatic Pumps

14
ONE Future’s methane intensity value for G&B reflects the implementation of some of the following types of methane reduction activities by the ONE Future companies with G&B operations11:
• Voluntary leak surveys and repair programs to identify and fix equipment leaks at abovegroundG&B sites.
• Where possible, replace or repair high emitting pneumatic devices with low or no-bleed devices.• Including pneumatic controllers in existing Leak Detection and Repair (LDAR) surveys using
Optical Gas Imaging (OGI) cameras.• Install electrically operated glycol pumps to replace natural gas operated pumps.• Program compressor unit controls to reduce pressure prior to venting.• Maximize the utilization of compressors to optimize combustion performance and fuel
efficiency.• Performance-based maintenance program to determine the need for compressor rod packing
replacement. A performance-based program uses the measured leak rate of the rod packing toobjectively evaluate whether rod packing needs replacement.
• Continuously monitor operational parameters to quickly notify operators of performance issuesand operating conditions.
Like the Production sector, the Gathering and Boosting sector also handles both gas and liquid streams. Therefore, GHG emissions from gathering and boosting operations are allocated between gas streams and crude/condensate using the energy content of the natural gas relative to the total energy content of all streams. For transparency, if all methane emissions from gathering and boosting operations were included in the ONE Future methane emission intensity calculation, the resulting methane emissions intensity would be only slightly higher at a rate of 0.030%.
National data for the G&B sector are limited as U.S. GHGRP reporting for this sector only began in 2016. As a result, the methane emission intensity value for this sector is scaled nationally by gross gas production, just as for the Production sector. This is the same as combining the emissions from Production and G&B operations together.
It is difficult to assess long-term trends since this is only the second year of ONE Future reporting. However, some short-term year-to-year observations can be made. Addition of new member companies as well as acquisitions and divestitures made by existing member companies help explain some of the year-to-year differences. In 2017 the methane intensity was 0.093%, G&B realized a decrease of 70% while throughput increased 262%. In the gathering and boosting sector, emission contributions from equipment leaks and pneumatic devices decreased significantly from CY2017 to CY2018. However, equipment leaks and pneumatic devices remained the highest and second-highest contributors to the total emissions from this sector. Dehydrators and blowdowns were the fifth and sixth highest contributions in CY2017. For CY2018, blowdowns and dehydrators were the third and fourth highest contributors.
11 These listed methane reduction activities are intended to represent examples of activities that some of the ONE Future companies may have implemented in 2018, but each company has the flexibility to decide on the activities to implement based on what is most appropriate and feasible for their company.

15
Processing - Methane Intensity of 0.015%
(Apache Corporation, Dominion Energy, Hess Corporation, Williams) The Processing sector is made up of gas processing plants where hydrocarbons and fluids in produced natural gas are separated to result in natural gas that meets pipeline specifications. Equipment associated with the gas processing segment includes all equipment inside a gas processing plant, such as: absorption units or cryogenic expanders, fractionators, dehydrators, acid gas removal units, and compressors. Based on the EPA’s national greenhouse gas inventory (GHGI)12, equipment leaks and engine exhaust from uncombusted natural gas are the largest sources of CH4 emissions for the processing sector.
ONE Future companies reporting emissions for the Gas Processing segment make up approximately 9% of the total national volume of gas processed. The CH4 emission intensity for the processing sector is 0.015% on a net gas produced basis. Figure 4 shows the percent contribution by emission source type for the Processing segment.
12 U.S. EPA, Inventory of U.S. Greenhouse Gas Emissions and Sinks: 1990-2016, EPA 430-R-18-003, April 2018.
* 0.098%
0.028%
0.015%
0.089%
0.096%
0.00%
0.05%
0.10%
0.15%
0.20%
0.25%
0.30%
0.35%
2018 ONE Future Emissions Intensity
Met
hane
Em
issi
ons
Inte
nsity
, %
0.326%
36%
21%
16%
13%
7%
3%3%
1% ReciprocatingCompressorsCentrifugalCompressorsAcid gas removal
Flare Stacks
Blowdowns
Dehydrators
Equipment Leaks
Other
Figure 4. ONE Future’s Methane Emissions for Processing *Note, Other includes Combustion and Pneumatic Devices
16
ONE Future’s methane intensity value for Processing reflects the implementation of some of the following types of methane reduction activities by the ONE Future companies with processing operations13:
• Where possible, replace or repair high emitting pneumatic devices with low or no-bleeddevices.
• Perform leak surveys and repair programs to identify and fix equipment leaks.• Add vapor recovery controls on some dehydrators.• Add vapor recovery controls on some tanks.
Although, the Gas Processing sector also handles both gas and liquid streams, the volume of natural gas liquids (NGL) and the corresponding energy content is small compared to natural gas. Allocating methane emissions between natural gas and NGL on an energy basis has a small impact on the Gas Processing sector methane emissions intensity, changing the intensity value from 0.015% to 0.016%.
It is difficult to assess long-term trends since this is only the second year of ONE Future reporting. However, some short-term year-to-year observations can be made. Addition of new member companies as well as acquisitions and divestitures made by existing member companies help explain some of the year-to-year differences. The emission intensity for 2017 was 0.024%, resulting in an 38% drop in intensity while throughput increased by 806%. Emissions from reciprocating compressors continued to be the highest contributor to total emissions in the processing sector. The centrifugal compressors category roughly doubled its emission contribution and moved from third highest contributor in CY2017 to second highest contributor in CY2018. For CY2018, methane emissions from acid gas removal and uncombusted methane emissions from flare stacks became the third and fourth highest, respectively.
13 These listed methane reduction activities are intended to represent examples of activities that some of the ONE Future companies may have implemented in 2018, but each company has the flexibility to decide on the activities to implement based on what is most appropriate and feasible for their company.

17
Transmission and Storage – Methane Intensity of 0.089%
(Apache Corporation, Berkshire Hathaway Energy Pipeline Group, Dominion Energy, Kinder Morgan, Summit Utilities, TC Energy, Williams) The Transmission and Storage (T&S) sector is comprised of high pressure, large diameter pipelines that transport natural gas from production and processing to natural gas distribution systems or large- volume consumers such as power plants or chemical plants. This includes interstate and intrastate facilities. Storage facilities, such as underground storage in expended gas reservoirs are used by transmission companies to hold gas and allow for seasonal demand differences. EPA combines T&S into one segment since many of the storage facilities are owned and operated by transmission companies, and since, in some cases the surface facilities (compression at underground storage, for example) are similar to other transmission facilities. Compression of natural gas is a significant operation for the T&S sector, and therefore emissions from compressors, including fugitive components, components designed to vent gas, and compressor exhaust play a larger role in CH4 emissions.
Based on 2018 emissions data from ONE Future T&S companies, the CH4 emission intensity for the T&S sector is 0.089%. Figure 5 shows the percent contribution by emission source type for the Transmission and Storage segment.
0.098%
0.028%
0.015%
0.089%
0.096%
0.00%
0.05%
0.10%
0.15%
0.20%
0.25%
0.30%
0.35%
2018 ONE Future Emissions Intensity
Met
hane
Em
issi
ons
Inte
nsity
, %
0.326%
53%
16%
13%
10%
4%
2% 2% Blowdowns
Equipment Leaks
CentrifugalCompressors
ReciprocatingCompressors
PneumaticControllers
Tanks
Other
Figure 5. ONE Future’s Methane Emissions for Transmission and Storage * Note, Other includes Dehydration, Combustion, and Flare Stacks
*
18
ONE Future’s methane intensity value for T&S reflects the implementation of some of the following types of methane reduction activities by the ONE Future companies with T&S operations14:
• Voluntary leak surveys and repair programs to identify and fix equipment leaks at abovegroundT&S sites.
• Performance-based monitoring and replacement for reciprocating compressor rod packing.• Use of dry seals for centrifugal compressor installations.• Conversion of reciprocating engine and turbine gas starters to electric or air operated starters.• Reduction of maintenance blowdown emissions by operating practice changes (such as
increasing the length of pressurized hold times on compressors to reduce number of compressorunit blowdowns to atmosphere).
• Reduction of blowdown emissions by implementing pipeline pump-down techniques to lowerthe pipeline pressure prior to transmission pipeline blowdowns and conducting regulatoryrequired Emergency Shutdown tests (ESDs) utilizing “vents blocked” tests.
• Use of sleeves and composite wraps to repair pipelines, eliminating the need to blowdown thepipeline. Use of pipeline isolation systems and hot taps to make new connections, eliminatingthe need to blowdown the pipeline.
ONE Future member companies represent approximately 39% of the total U.S. natural gas transmission pipeline miles. Since the same natural gas can pass through multiple transmission pipelines before being delivered to downstream users, the total overall throughput volume reported to EIA for this sector exceeds the total volume of natural gas produced. Because the same gas can be recorded as throughput multiple times within this sector, ONE Future made an additional adjustment to total throughput in addition to being scaled to gross gas production as outlined in the ONE Future Protocol. This adjustment was intended to more closely represent the throughput solely within the ONE Future T&S companies by scaling nationally based on average gas volume per pipeline mile using data collected from the EIA.
It is difficult to assess long-term trends since this is only the second year of ONE Future reporting. However, some short-term year-to-year observations can be made. The emission intensity was reduced from 0.122% in 2017 to 0.089% in 2018 while throughput increased by 51%. Addition of new member companies as well as acquisitions and divestitures made by existing member companies help explain some of the year-to-year differences. For the transmission and storage sector, blowdowns remained the highest contributor from CY2017 to CY2018. Equipment leaks, centrifugal compressors, and reciprocating compressors all had relatively similar contributions and stayed fairly consistent from CY2017 to CY2018.
14 These listed methane reduction activities are intended to represent examples of activities that some of the ONE Future companies may have implemented in 2018, but each company has the flexibility to decide on the activities to implement based on what is most appropriate and feasible for their company.

19
Distribution – Methane Intensity of 0.096%
(Dominion Energy, National Grid, New Jersey Natural Gas, Southern Company Gas, Summit Utilities) The Distribution sector covers natural gas pipelines that take high-pressure gas from the transmission system, reduce the pressure, and distributes the gas through primarily underground mains and service lines to individual end users. This segment includes natural gas mains and services, metering and pressure regulating stations, and customer meters. The ONE Future member companies represent 15% of the total U.S. natural gas delivered by local distribution companies and 12% of the total national miles of distribution mains.
Figure 6 shows the percent contribution by emission source type for the Distribution segment. Fugitive emissions from distribution mains and services are the most significant source of CH4 emissions for the distribution sector and are a function of system age and pipeline materials. ONE Future members include companies with large inventories of aged infrastructure, including cast iron pipe and unprotected steel pipe. This is reflected in the 2018 CH4 emission intensity value of 0.096% (based on gross gas production) for the distribution sector.
As can be seen in Figure 6, the majority of emissions for the distribution sector come from distribution mains fugitives. Within this category, the highest contributor is fugitive emissions from unprotected steel mains. The second and third highest contributors are fugitive emissions from
34%
26%
24%
14%
2%Fugitive emissionsfrom DistributionmainsFugitive emissionsfrom meters
Fugitive emissionsfrom DistributionservicesBlowdowns anddig-ins
Other
0.098%
0.028%
0.015%
0.089%
0.096%
0.00%
0.05%
0.10%
0.15%
0.20%
0.25%
0.30%
0.35%
2018 ONE Future Emissions Intensity
Met
hane
Em
issi
ons
Inte
nsity
, %
0.326%
*
Figure 6. ONE Future’s Methane Emissions for Distribution *Note, Other includes Fugitive Emissions from Distribution Stations and PRV Releases

20
protected steel mains and cast iron mains, respectively. The lowest contributor is fugitive emissions from plastic mains, while plastic mains have the largest mileage reported of the four types of distribution mains.
ONE Future’s methane intensity value for Distribution reflects the implementation of some of the following types of methane reduction activities by the ONE Future companies with distribution operations15:
• Making significant progress in replacing leak-prone pipe and having ongoing initiatives that arereplacing pipelines to reduce CH4 emissions.
• Increasing leak survey frequency.• Voluntary leak surveys and repair programs to identify and fix equipment leaks at aboveground
surface facilities.• Using pipeline pumpdown procedures to minimize emissions when mains must be repaired.• Where possible, replacing or repairing high emitting pneumatic devices with low or no-bleed
devices.• Implementing damage prevention programs.
It is difficult to assess long-term trends since this is only the second year of ONE Future reporting. However, some short-term year-to-year observations can be made. This sector’s intensity decreased from 0.108% in 2017, to 0.096% in 2018, while throughput increased by 9%. Addition of new member companies as well as acquisitions and divestitures made by existing member companies help explain some of the year-to-year differences. In the distribution sector, all emissions sources remained in the same order of magnitude of emissions contribution for CY2017 and CY2018.
15 These listed methane reduction activities are intended to represent examples of activities that some of the ONE Future companies may have implemented in 2018, but each company has the flexibility to decide on the activities to implement based on what is most appropriate and feasible for their company.

21
CONCLUSIONS ONE Future is pleased to present the current consolidated progress of our member companies toward our collective goal of achieving an average rate of methane emissions across the entire natural gas value chain of one percent or less of the methane portion of gross natural gas produced. ONE Future member companies’ collective emissions intensity is already better than the 2025 goal, and we encourage other natural gas companies to join us in order to continue reducing the emissions intensity of the entire natural gas value chain.
Figure 7 shows ONE Future’s 2018 cumulative methane emission intensity by sector of 0.326% versus the ONE Future’s 2025 cumulative target of one percent.
Figure 7. ONE Future 2018 Emission Intensity Results Compared to the 2025 ONE Future Target
Although ONE Future’s 2018 data resulted in a methane emission intensity value well below the one percent target, ONE Future members are committed to continual improvements and ongoing methane emission reduction activities as well as openly and transparently sharing their best
0.28%
0.098%
0.08%
0.028%
0.11%
0.015%
0.30%
0.089%
0.22%
0.096%
0.00%
0.20%
0.40%
0.60%
0.80%
1.00%
1.20%
2025 ONE Future Target IntensityValues
2018 ONE Future EmissionsIntensity
Met
hane
Em
issi
ons
Inte
nsity
, %
Distribution
Transmission & Storage
Processing
Gathering & Boosting
Production
1.0%
0.326%

22
practices through technical reports and workshops to enable others across the industry to capture the key learnings from ONE Future’s successful initial results.
As this is the second year of ONE Future reporting, Figure 8 shows the 2025 sector intensity targets as well as the sector intensity results compared between 2017 and 2018 reporting. There were significant reductions in intensities of two segments, Production and Gathering & Boosting, as well as decreases in intensity for the remaining three segments.
Figure 8. ONE Future 2025 Sector Targets and 2017 and 2018 Emission Intensity Results by Sector for Two Years of Reporting
Some explanation of the changes shown in Figure 8 are listed here:
Production
• There was a change in the number of companies reporting, and two new companies wereadded. One production company doubled their production while holding methane emissionsnearly constant. Other members also sold some production assets, and some added offshoreproduction, which generally has lower reported emissions, and has a high allocation ofemissions to oil production.
Gathering & Boosting
• There was a change in the number of companies reporting, and some existing members havesold production assets. Two members have significant new G&B volumes gathered in 2018.
0.28%
0.08%
0.11%
0.30%
0.22%0.205%
0.093%
0.024%
0.122%0.108%
0.098%
0.028%0.015%
0.089% 0.096%
0.00%
0.05%
0.10%
0.15%
0.20%
0.25%
0.30%
0.35%
Production Gathering & Boosting Processing Transmission &Storage
Distribution
2025 ONE Future Target Calendar Year 2017 Calendar Year 2018

23
• There was a change in the number of companies reporting as we added a new member.
Transmission & Storage
• There was a change in the number of companies reporting as we added members, and theintensity dropped slightly from 2017.
Distribution
• A new member was added in 2018, but the change to the overall intensity was minimal.
Due to the year-to-year changes in sectors, the net emissions intensity from ONE Future has decreased 41% from 2017, which aligns with our goal to show continual improvement. ONE Future’s overarching goal is to ensure the future of natural gas as a long-term sustainable fuel and that objective will be assured as additional players in the natural gas value chain continue to step up and embrace the benefits of reducing methane emissions. Our responsibility to safely and reliably provide sustainable natural gas to our customers and communities is our core business, and reducing methane losses aligns with those goals. We understand methane emission reduction is not just good for the environment, but is also good for the natural gas industry, its employees, customers, communities, and investors.
Gas Processing

24
APPENDIX A Future Considerations and Improvements for the Program Considerations for ONE Future improvements between now and 2025 are expected to include the following:
• Addition of new member companies, expanding our representation and our flexible emissionreducing principles.
• Additional reductions, as companies continue to make improvements in data collectionefforts, emission estimates, and reducing methane emissions.
• Updates to the national emission intensity basis (as EPA makes updates to the methodology)and updates to GHGRP and GHGI emission factors.
• Addition of company measured data where it can rigorously supplant the emission factorsused. This may raise or lower net emissions from ONE Future companies. (This isespecially important for large categories like pneumatic controller emissions, which maynot be well represented by the simple emission factor approach currently used by the EPA).
• Annual review of the ONE Future Protocol to determine the need to incorporateimprovements as described in the above items.
• Periodic review of the methane intensity targets to determine whether adjustments to targetsare needed based on data collected and actual methane intensities reported by ONE Future.
25
APPENDIX B Year-to-Year Changes in the Emission Calculation Approach Since ONE Future members begin with their reported emissions to the EPA’s GHGRP, it is important to comment on any calculation approach changes that were adopted by the EPA for CY2018 as well as any changes or updates to ONE Future’s calculation methodology. Between CY2017 and CY2018, there were no changes to calculation methodology pertaining to EPA’s GHGRP.
A change to ONE Future’s methodology between CY2017 and CY2018 is the addition of offshore production facilities. These offshore production facilities were simply added to the onshore production facility calculations under the production segment.
Certain U.S. Energy Information Administration (EIA) values were not available at the time of the publication of this report. Specifically, the Repressuring and Natural Gas Processed values were both unavailable, but necessary to keep the ONE Future calculation basis consistent from CY2017 to CY2018. These two EIA values are approximately proportional to EIA’s Gross Withdrawals value, which was already available for CY2018 at the time of this report’s publication. To come up with a reasonable estimate of the CY2018 values for Repressuring and Natural Gas Processed, a ratio was averaged across the five years leading up to 2018 for the necessary value divided by the Gross Withdrawals. These averaged ratios were then multiplied by the CY2018 Gross Withdrawals value to produce approximations of the CY2018 Repressuring and Natural Gas Processed values.


