One hundred percent renewable energy generation in 2030 with the lowest cost commercially available power plants Manfred G. Kratzenberg 1 , Hans Helmut Zürn 2 , Ricardo Rüther 1 1 Fotovoltaica UFSC – Solar Energy Research Laboratory, Federal University of Santa Catarina, Florianópolis 88056-000, SC Brazil 2 Power System laboratory UFSC, Federal University of Santa Catarina, Campus Universitário Campus Universitário João David Ferreira Lima – Trindade 88040-900, Florianópolis, SC, Brasil. We hypothesize that the present expansion of energy generation by variable renewable energy (VRE) power plants, such as wind and photovoltaic power plants, leads to a 100% renewable energy supply in 2030 because of its inherent exponential growth function. This behavior is related to the exponential cost reduction of its generated energy and the nearly unconstrained available potential of its natural resources. The cost reduction results from the continuous improvements in development, research, manufacturing, and installation, also showing a growth of its installation power per power plant or aero generator. We prove that if the historic exponential growth is followed in the future, it is possible to decarbonize the world's electric energy systems' power supply in 2026. Furthermore, the global demand on primary energy can be supplied in 2030, which leads to the total suppression of CO2 emissions related to the energy need of humanity. Because of the related cost reduction, energy costs are not anymore relevant. Our extrapolation is based on the continuation of the historic growth functions of the globally installed PV and the wind power plants, and we also discuss the conditions necessary to enable a transition to such a 100% renewable energy production. Considering a non-constrained growth of VRE power plants' installation power, decarbonization related to energy generation and use can be accomplished in a much shorter time frame as previously scheduled. As a result, climate change mitigation, energy cost reduction, and high employment are attained much earlier than previously planned. 1. Introduction As a result of technological developments in semiconductor manufacturing, related technologies underlay exponential growth principles more than ever. Such a manufacturing results in the exponential increase of the computation capacity based on Moore's law. The related technologies are, e.g., the exponential proliferation of smartphones; the exponential growth of internet users and the exponential growth of the scanning ability of the human genome, in-between others, and they are all based on on the principle the exponential growth of the computational performance
Transcript
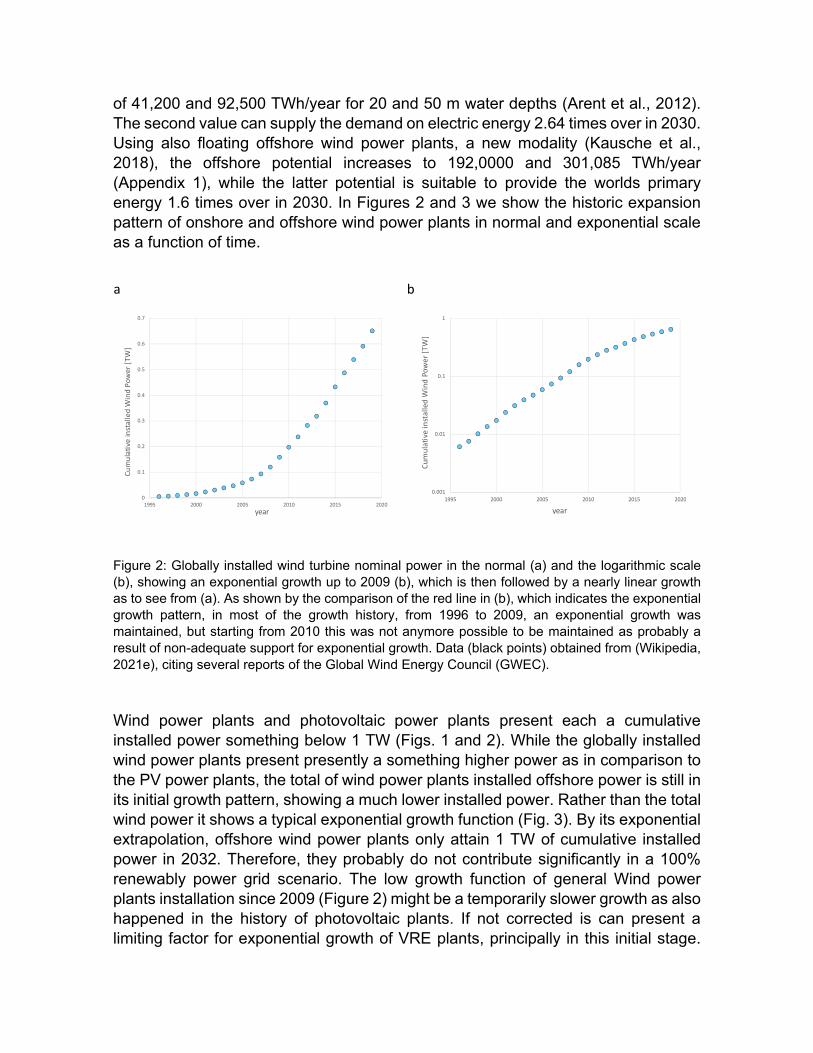
One hundred percent renewable energy generation in 2030 with the
lowest cost commercially available power plants
Manfred G. Kratzenberg1, Hans Helmut Zürn2, Ricardo Rüther1
1 Fotovoltaica UFSC – Solar Energy Research Laboratory, Federal University of Santa Catarina,
Florianópolis 88056-000, SC Brazil
2 Power System laboratory UFSC, Federal University of Santa Catarina, Campus Universitário
Campus Universitário João David Ferreira Lima – Trindade 88040-900, Florianópolis, SC, Brasil.
We hypothesize that the present expansion of energy generation by variable
renewable energy (VRE) power plants, such as wind and photovoltaic power plants,
leads to a 100% renewable energy supply in 2030 because of its inherent
exponential growth function. This behavior is related to the exponential cost
reduction of its generated energy and the nearly unconstrained available potential of
its natural resources. The cost reduction results from the continuous improvements
in development, research, manufacturing, and installation, also showing a growth of
its installation power per power plant or aero generator. We prove that if the historic
exponential growth is followed in the future, it is possible to decarbonize the world's
electric energy systems' power supply in 2026. Furthermore, the global demand on
primary energy can be supplied in 2030, which leads to the total suppression of CO2
emissions related to the energy need of humanity. Because of the related cost
reduction, energy costs are not anymore relevant. Our extrapolation is based on the
continuation of the historic growth functions of the globally installed PV and the wind
power plants, and we also discuss the conditions necessary to enable a transition to
such a 100% renewable energy production. Considering a non-constrained growth
of VRE power plants' installation power, decarbonization related to energy
generation and use can be accomplished in a much shorter time frame as previously
scheduled. As a result, climate change mitigation, energy cost reduction, and high
employment are attained much earlier than previously planned.
1. Introduction
As a result of technological developments in semiconductor manufacturing, related
technologies underlay exponential growth principles more than ever. Such a
manufacturing results in the exponential increase of the computation capacity based
on Moore's law. The related technologies are, e.g., the exponential proliferation of
smartphones; the exponential growth of internet users and the exponential growth
of the scanning ability of the human genome, in-between others, and they are all
based on on the principle the exponential growth of the computational performance
(Diamandis and Kotler, 2012). We think that this behavior of exponential growth is
also true for the non-constricted growth of photovoltaic and wind power plants' global
installation power, and therefore, its energy generation. As a result, net-zero CO2
emissions can be attained much earlier than expected and scheduled.
Consequently, uncertainties concerning climate change mitigation are reduced,
employment is created, and energy is produced at extra low cost as these renewable
power plants do have no fuel consumption. Such objectives are essential to hold
disaster losses related to climate change at low levels, as discussed in Appendix 1.
Furthermore, the expected employment losses because of the impending
developments in automatization and artificial intelligence (AI) are compensated. Our
proposal results in a rapid transition of the world's electric energy systems based on
the growth of the three most important commercially available renewable energy
power plants, saying photovoltaic, wind, and hydropower plants. We show that it is
possible to generate the world's total demand for electric energy in 2025, solely by
these three renewable sources, considering its non-constrained future growth. We
also show that the world's primary energy consumption can be generated in 2030,
at exceptionally low costs, far below US$10/MWh, by the expansion of such power
plants.
Global warming and climate change mitigation are the present most challenging task
of humanity. The known relationship to the industrial CO2 emissions, and the
unknown outcomes of future climate change, results in potentially existential
damage for society (Abdallah et al., 2013). As known, the natural radiative forcing of
the Earth's atmosphere provides the Earth's necessary heat energy, which increases
its surface temperature for being a habitable planet. However, presently, the Earth's
climate system is changing rapidly as a function of extra energy input. The additional
energy is a function of radiative forcing, which results in global warming and is a
function of the increased CO2 level in the atmosphere. First in-depth research related
to this radiative forcing was accomplished by (Hansen et al., 1997), with global
simulations of the Earth's thermodynamic system.
The generation of only one MWh of energy emits up to 1000 kg of transparent CO2
into the atmosphere. Even with the current exponential expansion of renewable
energy systems, global CO2 emissions are still growing exponentially (Lindsey,
2018). This growth leads to a nearly exponential increase of the CO2 in the
atmosphere (NOAA, 2021), resulting in additional radiative forcing, heat
accumulation, further temperature increases, which trigger even more significant
related climate changes. The resulting radiative forcing increase is currently the most
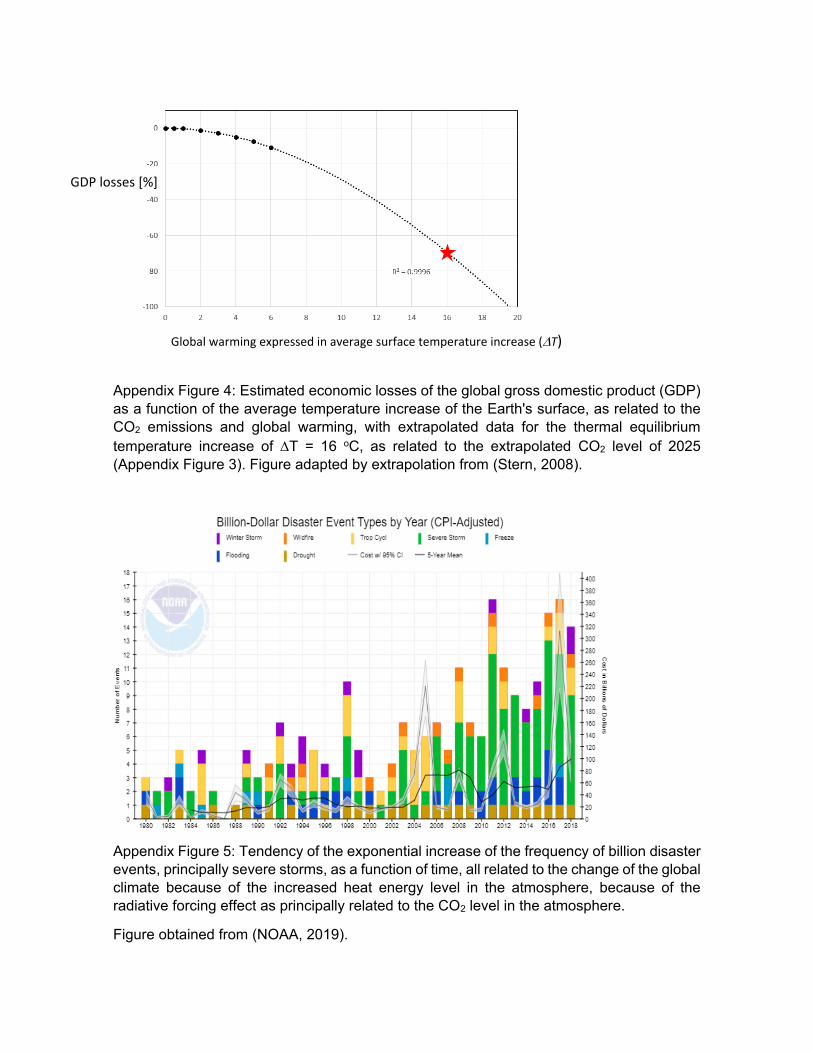
challenging existential threat (Shakoor et al., 2020). Models of related economic
losses show in (Stern, 2008) exponential losses of the global domestic product
(GDP), which appear as a function of the Earth's surface average temperature
increase (Appendix 2). Frist tendencies to the rise of such losses are already
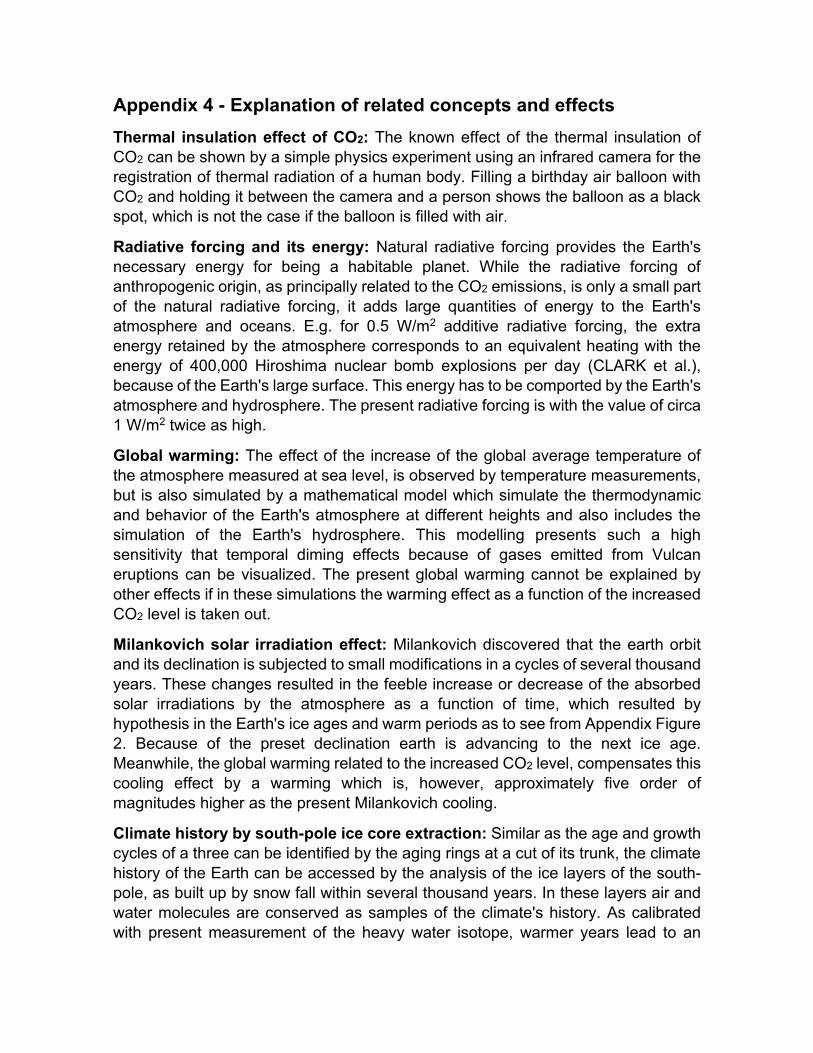
verifiable (Smith et al., 2019). Such losses are principally related to climate disasters,
and therefore, the emission of CO2 should be reduced as swiftly as possible.
Climate change is one of the most discussed items in the last decades in global
scientific and political communities. However, it is still not adequately addressed, as
the net-zero CO2 emissions are scheduled only for 2040 or 2055 (Masson-Delmotte
et al., 2018). However, it is essential to actualize schedules based on VRE plants'
technical and economic state-of-the-art feasibility to mitigate climate change earlier.
This feasibility changes rapidly because of the swift development of the related
technologies. E.g., the cost of wind and photovoltaic power plants decreased much
stronger in the last decades than previously expected (*). Therefore, energy policies
should also be actualized for swifter mitigation of climate change, based on the state-
of-the-art feasibly for this mitigation.
The concept of providing all energy with hydropower, wind, photovoltaic, solar
thermal, and geothermal power plants was first proposed by (Jacobson and
Delucchi, 2011) and (Delucchi and Jacobson, 2011), citing further references. The
authors' proposal is based on energy storage simulations in a 30 s interval, and they
discuss apart from the CO2 benefit also the health benefit because of the reduced
city pollution. Their work was followed by the results of (Jacobson, 2017; Jacobson
et al., 2015), in which simulations were expanded to several countries, and (Kroposki
et al., 2017), which discuss the details as related to the electrical power grid for a
100 % supply of the power grid with renewable and VRE power plants. In their
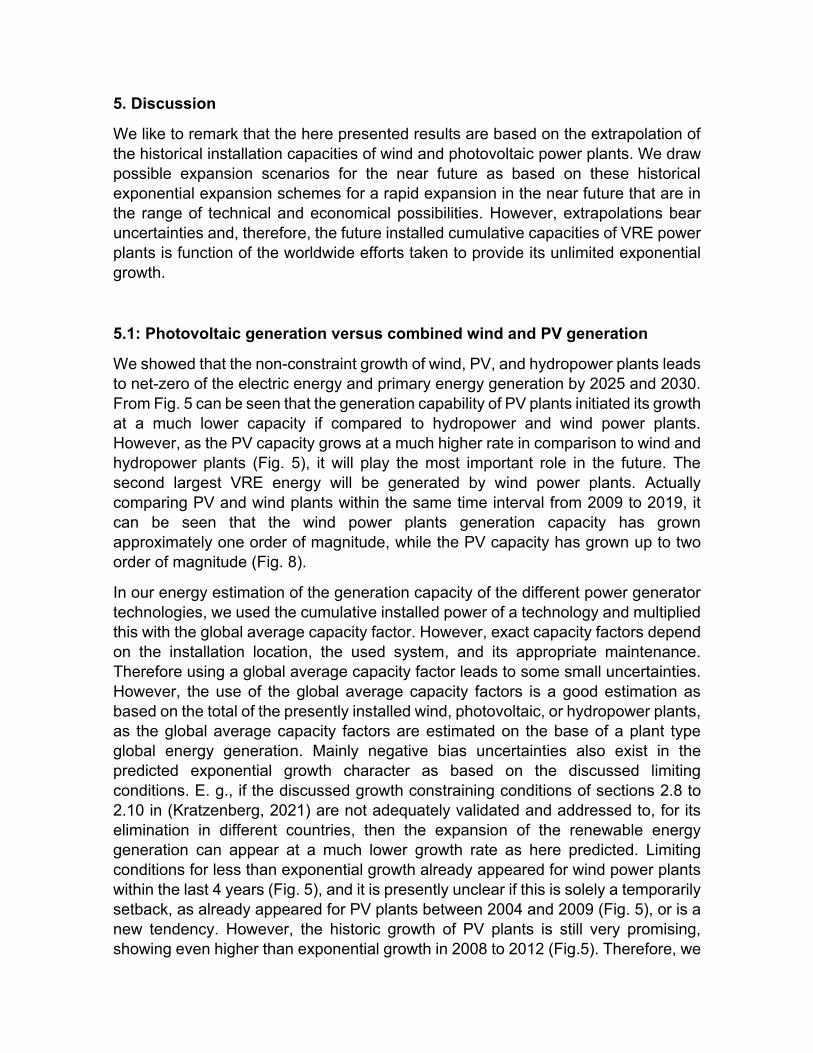
Figure 8: Swanson's learning curve, here expressing the Levelized of electric energy (LCOE) as a
function of the generation capacity of the cumulative installed capacity of (i) photovoltaic plants
(orange), and (ii) wind power plants (blue), in 2009 to 2019, and its extrapolation curve in the bi-
logarithmic scale. The vertical lines on the left side indicate threshold values of the total electric energy
consumption as predicted for 2026 and the word's primary energy consumption predicted for 2035.
Furthermore, on the abscissa we present generation capacity of the cumulative
installed PV systems in units of [TWh/year], instead of the cumulative shipped PV
module power. Such a presentation gives a clearer view of the end product saying
the generated energy and it also allows a comparison of development of further
technologies such as the wind power also shown in Fig. 8. The figure shows that as
a function of the installed generation capacity, PV systems present in the whole
diagram a lower cost as in comparison to wind power plants. This means the
historically higher costs of PV modules (Fig.7a), where only present because of its
lower generation capacity, if comparted to wind power plants at that time. However,
based on the crossing of the two lines in Fig. 8 we expect that wind power plants
generate energy at lower cost than PV power plants in the future. Therefore, it is
important that efforts are taken in the near future to grow the presently nearly linear
wind power expansion back to the typical exponential growth, enjoying the benefits
of a non-restricted exponential growth and its related exponential cost reduction.
5. Discussion
We like to remark that the here presented results are based on the extrapolation of
the historical installation capacities of wind and photovoltaic power plants. We draw
possible expansion scenarios for the near future as based on these historical
exponential expansion schemes for a rapid expansion in the near future that are in
the range of technical and economical possibilities. However, extrapolations bear
uncertainties and, therefore, the future installed cumulative capacities of VRE power
plants is function of the worldwide efforts taken to provide its unlimited exponential
growth.
5.1: Photovoltaic generation versus combined wind and PV generation
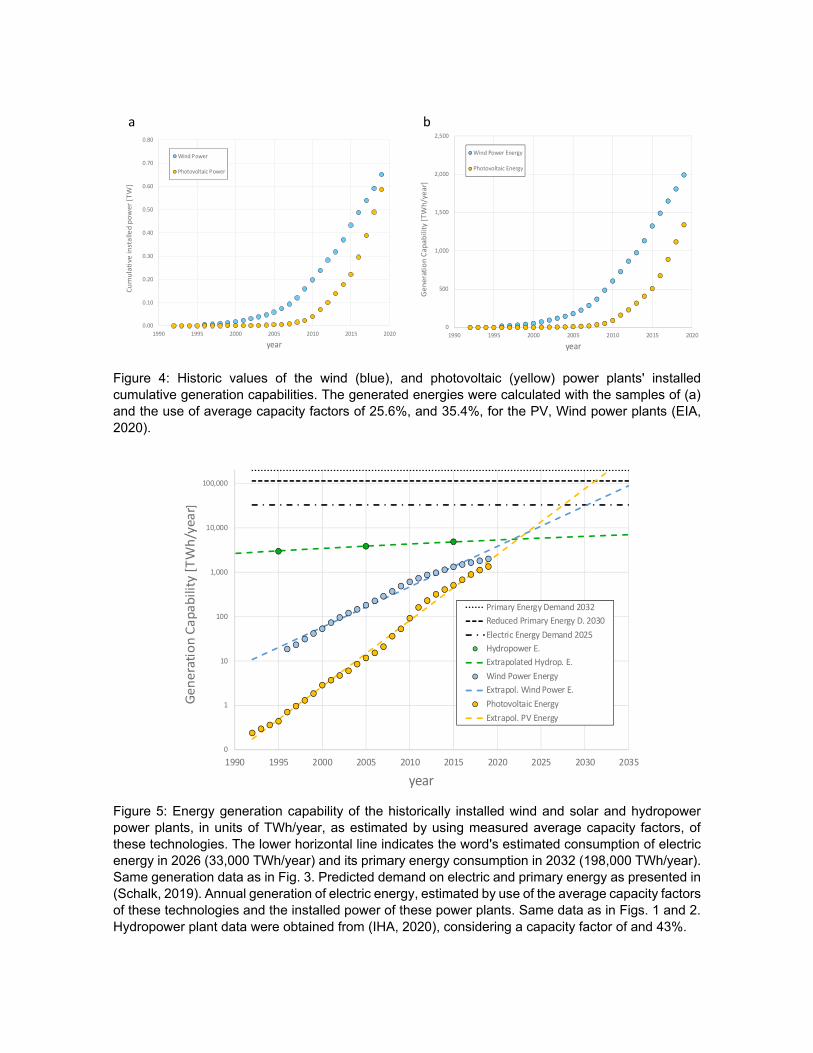
We showed that the non-constraint growth of wind, PV, and hydropower plants leads
to net-zero of the electric energy and primary energy generation by 2025 and 2030.
From Fig. 5 can be seen that the generation capability of PV plants initiated its growth
at a much lower capacity if compared to hydropower and wind power plants.
However, as the PV capacity grows at a much higher rate in comparison to wind and
hydropower plants (Fig. 5), it will play the most important role in the future. The
second largest VRE energy will be generated by wind power plants. Actually
comparing PV and wind plants within the same time interval from 2009 to 2019, it
can be seen that the wind power plants generation capacity has grown
approximately one order of magnitude, while the PV capacity has grown up to two
order of magnitude (Fig. 8).
In our energy estimation of the generation capacity of the different power generator
technologies, we used the cumulative installed power of a technology and multiplied
this with the global average capacity factor. However, exact capacity factors depend
on the installation location, the used system, and its appropriate maintenance.
Therefore using a global average capacity factor leads to some small uncertainties.
However, the use of the global average capacity factors is a good estimation as
based on the total of the presently installed wind, photovoltaic, or hydropower plants,
as the global average capacity factors are estimated on the base of a plant type
global energy generation. Mainly negative bias uncertainties also exist in the
predicted exponential growth character as based on the discussed limiting
conditions. E. g., if the discussed growth constraining conditions of sections 2.8 to
2.10 in (Kratzenberg, 2021) are not adequately validated and addressed to, for its
elimination in different countries, then the expansion of the renewable energy
generation can appear at a much lower growth rate as here predicted. Limiting
conditions for less than exponential growth already appeared for wind power plants
within the last 4 years (Fig. 5), and it is presently unclear if this is solely a temporarily
setback, as already appeared for PV plants between 2004 and 2009 (Fig. 5), or is a
new tendency. However, the historic growth of PV plants is still very promising,
showing even higher than exponential growth in 2008 to 2012 (Fig.5). Therefore, we
think that this technology will play the most important role in the decarbonization of
power grids and in the generation of the world's primary energy. However, because
of the typical knee curve as characteristic for exponential growth we expect in the
near future also setbacks as based on eventual constraining conditions for PV power
plants. This setback behavior demand for activities in energy policies, regulations,
and in the further development of the VRE power plants and its integration in the
power grid.
5.2 Cost and growth of PV and wind power plants
As to see from Fig. 4, the initial growth of the wind power generation capacity is
much higher in comparison to PV generation, but it slowed down since 2017 (Fig.
5), which should be a temporarily growth limitation, because of some presently acting
restraining conditions. E.g., the lower generation of PV plants can be explained as
in the 1990'er the energy generated by PV plants had a much higher cost in
comparison to wind power plants (Fig. 7), being still be present in 2009 (Fig. 8). Only
currently the LCOE of PV plants is very similar to that of wind plants (Figs. 7 and 8).
We have to note that the exponential reduction of the LCOE of wind and PV plants
is a clear function of its installed generation capacity. This is shown by the strong
point correlation to the regression lines in (Fig. 8). This means that if a non-
constrained growth of these VRE technologies can be guaranteed by international
efforts, then a very large cost decline will be the result, providing in 2030 energy by
these technologies at something above of 1 US$ / MWh, saying at nearly zero costs
(Figs. 7 and 8).
The historical higher generation cost of PV plants in comparison to wind power plants
is a result of the much lower installed generation capacity of PV power plants in
comparison to wind power plants (Figs. 5 and 8). However the generation capacity
of PV plants has grown at a much higher gradient than wind power plants, which
also lead to a much higher decline of its generation costs. We think that the higher
growth and therefore cost decline of PV plants comes available as PV plants can
virtually be installed everywhere and at any size, which is not the case for wind power
plants. Furthermore, PV plants are easier to be installed and maintained because of
its lower high and as most PV plants have no or little moving components.
Comparing the plant costs independently of time but as a function of the installed
generation capacity, the energy generated by PV power plants presented historically
always a lower cost as in comparison to wind power plants, which is a new insight
that can only be discovered by the proposed comparison of Fig. 8. The figure shows
also that the PV technology already arrived at the cost of wind power plants even
with a lower installed generation capacity. This means the PV technology is actually
the lower cost technology on a global scale and the cost of PV plants was only
higher, starting from the 1990er, because of the much lower installed generation
capacity. The today's similar energy generation cost of PV plants in comparison to
wind power plants is principally a function of the higher cost decline of PV in
comparison to wind power plants (Figs. 7 and 8). However, if wind power plants grow
exponentially then in the future very similar generation costs are expected, and wind
power plants can probably generate energy at a something lower cost (Figs. 7 and
8).
5.3 Exponential growth and lags in exponential growth
Presently wind power plants show a large time lag in its exponential growth of
approximately 3 years (Fig. 5). We think that this time lag appeared because of a
constraint growth behavior, as function of one or more of our listed restraining
conditions discussed in (Kratzenberg, 2021). E.g., the failing of sufficient energy
auctions that allow wind power projects to be installed. If these conditions are
adequately accounted to and corrected, we think that this grow function can be
corrected and its grow function be bend back to exponential growth, similarly as the
PV capacity was bend back after solving the restricting material supply. Differently,
photovoltaic systems can be installed without auctions in many residences, which
might be one of the reasons than there are no time lags presently in the growth of
the cumulatively installed PV power.
5.4 Single and combined expansions of VRE plants
Theoretically the world's demand on electrical and primary energy could be
generated solely by PV power plants in 2027 and the midst of 2036 (Fig. 5).
However, the most probable and useful scenario is a combined growth of wind,
photovoltaic and hydropower plants, as well as the growth of further renewable
power generators. Its complementary energy generation profile is especially useful
to reduce the demand on storage capacities because of the plants seasonal and
spatial generation complementary. Such an expansion figure considers, however,
that the tendency of linear growth within the last four years of the wind power
installations (Fig. 5) can be bend back to exponential growth by adequate research,
coordination and management efforts of the global, and country-wise, VRE
expansion.
5.5 Outcome of non-constrained growth of renewable power plants
A higher than exponential growth of offshore wind power plants could be a solution
to correct the present setback of the growth curve of the wind power generation. This
would need, however, government incentives for very large scale manufacturing of
the infrastructure necessary to install offshore wind power plants. Therefore, much
easier to accomplish is a non-constrained onshore generation capacity growth,
because the necessary infrastructure for the wind power installation is also used for
a series of further construction activities. However, the offshore wind turbines have
typically a larger size, which results to higher capacity factors, which facilitates the
offshore growth. We think that onshore size constraints can be overcome in
exponential growth scenario by near-power-plant manufacturing-units combined
with short distance air-transport of rotor blades.
Meanwhile, we expect that PV power plants will generate more energy than wind
power plants starting from 2024 as to see by the crossing of the straight lines of the
extrapolation curves of wind and PV plants in Fig. 5. Therefore, a lower than
exponential growth of the wind power plants would only present a minor setback.
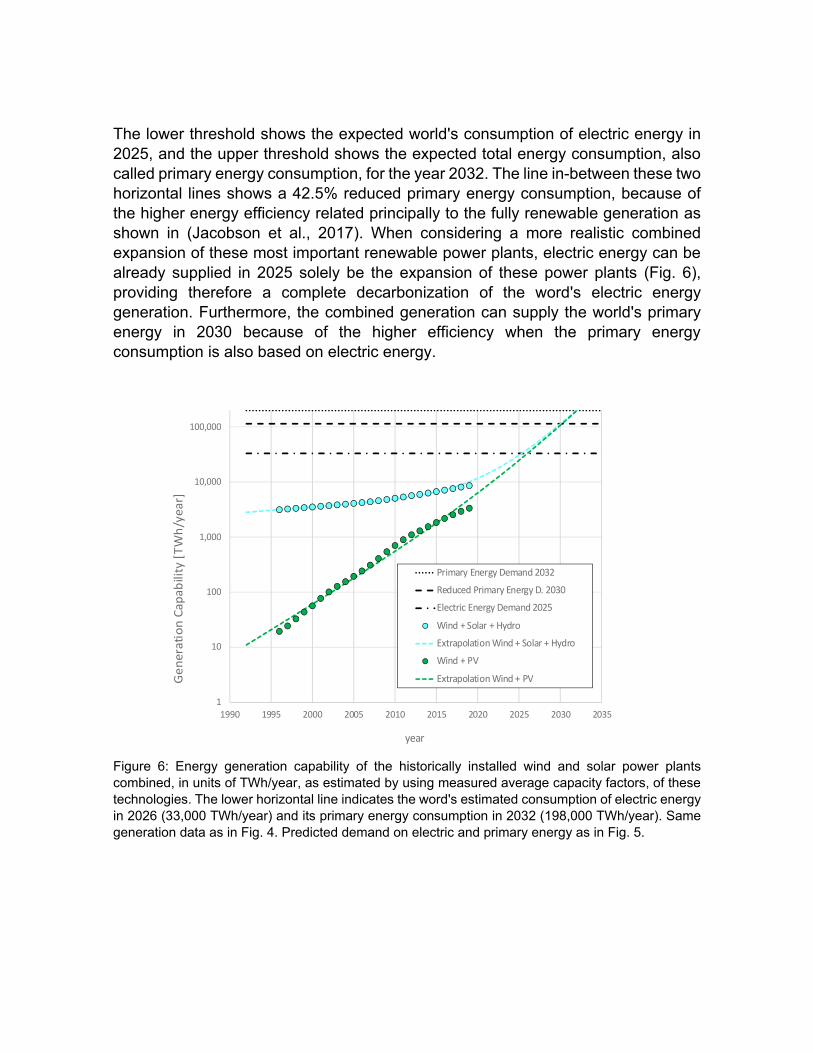
Meanwhile, a combined exponential growth of wind and PV plants alone could
theoretically supply the electric energy demand in 2026 (Figure 6). Accounting also
the expected hydropower plants growth, these three plant types are able to supply
the word's electric energy need in 2025 as to see from this figure. Considering a
further unconstrained growth of these renewable power plants, such an expansion
leads to a fully renewable primary energy matrix in 2030. In such a scenario the
inherent nearly zero cost of electrical energy (Figs 7 and 8) is used for industrial,
commercial, and residential heating and cooling; for any type of transport and for
any further energy use globally. If further renewable power sources are also
accounted to such a feat is accomplishable in some months earlier because of their
much lower historical expansion.
The continuous growth of the rotor blade lengths of wind turbines, not only to
increase its installation power per unit, but also to explore lower wind velocities for
offshore wind power plants. However, the power per unit of onshore wind power
plants is presently stagnant because as very long blades cannot be transported,
because of traffic infrastructure limitations. As the power of the wind turbine
installations grows exponentially, very large wind turbines should ideally also be
installed onshore. Therefore, in exponential growth scenarios we think that it will be
helpful to manufacturer not only the wind turbine towers (REVE, 2020), but also rotor
blades in locations close to the areas of high wind energy potential. In such a case
we think that short distance air transport of rotor blades can become economically
available. The air transport's higher costs will be less significant because of the short
distance and the strong cost decline of the generated energy in the mass production
scenario. Furthermore, the cost of the air transport with helicopters will be
outweighed by the higher efficiency and capacity factors of wind turbines with longer
blades that allows the exploitation of lower wind speeds. Such transport issues are
no present for large and very large photovoltaic power plants, as pre-assembled
mounting racks do not imply any space limitation for its transport, because of its
smaller size and its modularity.
6. Conclusions
We have shown that the extrapolation of the present exponential growth pattern, of
wind and photovoltaic power plant's power and generation capacity can supply the
global demand on electric energy in 2025, and primary energy in 2030. As a result
we have shown a net-zero CO2 emission scheme, as being an important part of the
mitigation of climate change, in a much shorter time frame as presently considered
in 2050, e.g. in (Huang and Erb), (Kusch-Brandt, 2019). This scheme is on the main
part based on the energy generated by VRE power plants, combined with extra low-
cost storage units. Because of the already low and the exponentially falling cost per
MWh, we think that the cumulative installation of PV and wind power plants may
even grow higher that on exponential behavior if, however, the constraint's limiting
factors as discussed in (Kratzenberg, 2021) are adequately addressed to. We show
the effectiveness of wind and photovoltaic power plant installation, in visualizing that
solely the wind or the PV plant's growth alone is able to supply the world's electric
and primary energy demand. Such a configuration would demand however at least
3 years more for a 100% renewable supply mainly by PV and to a lower extent by
hydro and wind power plants (Fig. 5). However, such a case would result in higher
costs for a 100% renewable energy supply because of the higher demand on storage
capacities to store energy at night and the presence of solely the spatially
complementary generation of PV plants, while the generator complementary is not
explored in this case. Furthermore, for very large shipping of wind power plants its
cost per generated MWh is expected to decrease below that of PV plants (Fig. 8).
Therefore, the exponential growth of wind power is important and the present time
lag in its exponential growth must be evaluated more thoroughly and corrected,
based on the discussed limiting criteria.
We think that if the constraints related to this criteria are eliminated adequately, its
present linear expansion is only of temporal character and exponential growth curve
of the cumulative installed power and generation capacity. The most probable case
for the future is the exponential growth by photovoltaic and wind power plants, which
are able to provide a complete reduction of the CO2 emissions as related to the
energy generation. We estimate that if the world's primary energy can be supplied
by the presented scheme in 2030, the global CO2 emissions would be reduced by
approximately 73 %, as the present energy generation is responsible for 73.2%
(Ghosh, 2020) of the carbon dioxide emissions. Therefore, a primary energy
generation without CO2 emission can significantly accelerate the mitigation of
climate change. Combined with adequate reforestation measures for CO2 capture
(Fawzy et al., 2020), CO2 emission could eventually be reduced to preindustrial
scale. This results to (i) the mitigation of climate change and its related risks, (ii)
generate additional income, from the generated low cost energy and wood, and (iii)
provide additional workplaces.
Principally because of (i) the present exponential growth of VRE plants, (ii) the
present and especially future economic figures, and (iii) the available resources,
saying generation potential, we think that its exponential growth is very attractive
and, therefore, not stoppable in the future. Such a behavior will be of large benefits
for a sustainable economic growth and the upscaling of employment. In the recent
past such an exponential growth is especially shown for PV and offshore wind power
plants. However, non-adequate energy policies, non-tuned regulations, and non-
adapted power grids could limit such an expansion, principally for high VRE
generation fractions. Therefore, we think that it is important that the international
society envisions favorable and normalized energy policies, technical standards, and
regulations that enable power grids to integrate large generation fractions of VRE
power plants. Furthermore, international technological and research cooperation's
should be established for the exchange of experiences and technology, especially
for the power grid adaption. As a result of these measures we think that exponential
growth restrictions for the expansion of wind and photovoltaic power plants can be
avoided. Adequately high carbon taxes that are appropriate for the compensation of
the present and future economic and environmental damage should also be
considered. As discussed in (Hansen et al., 2015), an internationally homologized
carbon tax should be established, and carbon taxed should also added to the import
of products in a proportion as weighed by the product price, the country's emitted
CO2 and its gross national product. Additionally, subsidies of thermal power plants,
and principally coal fueled thermal power plants, which produce the largest CO2 per
MWh generated, should be internationally abolished. The long term generation
commitments related these power plants should also be avoided, inclusively to avoid
economic losses.
Our exponential grow curves and the discussed growth constraints of the analyzed
VRE technologies (Kratzenberg, 2021) can be used as a guideline to validate if there
are limiting factors that reduce the exponential growth of VRE technologies in the
different countries. Furthermore, we expect that the nearly linear growth of the wind
power expansion in the past three years, can be bound back to its exponential
growth pattern if the essential requirement of adequate energy policies are
established. Such polices should act on the control and elimination of the discussed
limiting factors for exponential growth. The possible reasons of the bow from
originally exponential growth, back to linear growth in the last three years, should be
investigated in different countries and positive experiences should be communicated
and applied in an effective way allowing exponential growth in most of the countries.
We consider these measures as being effective for a rebound to the original
exponential growth pattern of the cumulative installation of the global wind generator
power. Together with the exponential growth of PV this results in the significant
reduction of future CO2 emissions, and its related radiative forcing effect in the
atmosphere, which enables the mitigation of severe outcomes of future climate
change (Appendix 2).
The generation cost (LCOE) of wind and photovoltaic systems will decrease at an
exponential scale furthermore, which is shown best by the clear cost decrease
tendency as a function of its manufacturing scale in Fig. 8. It is also shown by the
Swanson law, e.g., in (Diamandis and Kotler, 2012), showing an exponential price
decrease of the PV module cost as a function of the cumulative installed capacity.
However, Fig. 8 presents apparently a higher point correlation if comparted to the
Swanson's curve. The figure also shows that for exceptionally large generation
capacities the generation cost of wind and photovoltaic energy have with the
expected ~ 1 US$/MWh virtually near zero costs. In such scenarios the storage cost,
as well as the maintenance and control of the power grid will represent the main part
of the future electric energy costs. However, in the case of the adoption of a large
quantity of heat storages controlled by DR (section 2.6 in (Kratzenberg, 2021)),
which emulates an electrical storage, the cost of the electric energy for the final
consumers will decrease significantly, because of the ultra-low cost of storage and
generation of energy. This low cost structure also enables the economic generation
of hydrogen and methane not only to store excess electrical energy, but also for its
use in long distance transport, and for further industrial processes. Additionally, such
low costs allows the use of the excess energy in large desalinization plants, providing
additional drinking water and water for irrigation in the agriculture (Diamandis and
Kotler, 2012), and allows a further cost decrease because of the even higher mass
production of PV and wind power plants. From the extrapolation of the recent growth
pattern it can be seen that the expansion of photovoltaic power plants, will be able
to provide the main part of the world's primary energy in 2030 (Fig. 5). Therefore,
even if wind power plants do not grow on an exponential rate, a 100% primary energy
generation can be attained in-between 2030 (Fig. 6) and 2032 (Fig. 5). However, the
growth of wind power plants is important because of its complementary generation
in different time scales, which lowers the necessary storage capacity and its cost.
Such a relationship is easy to see, as without wind generation a large part of PV
generation would be necessary to be stored for its supply over-night and in periods
with low solar irradiance.
The storage of conventional and pumped hydropower plants will also play an
important role in a 100% renewable power supply. However, because of the limited
expansion potential of the global hydropower plants (Appendix 1) off-river
hydropower plants will be especially important in countries, which current energy
generation is mainly based on non-renewable power plants. Meanwhile, to minimize
the costs of the necessary storage, the much lower-cost thermal storages units, as
emulated by DR, should be implemented by market forces on the base of subsidies,
as this configuration will finally result in a much lower cost of the electric energy for
the energy consumers. Additionally, power girds should be enlarged and
interconnected to make use of different consumption profiles and generation profiles
of the VRE plants that also reduce the storage demand.
The most important use of lithium ion batteries is in Electric Vehicles and to attend
the demand on electric energy at charging stations in parking lots, at locations where
the power grid is not already actualized to accomplish this job, or in locations still
without power grid, where the battery is charged with a renewable power plant. Such
a concept not only enables the rapid implementation of an EV infrastructure, but also
results in the real demand on the necessary power grid infrastructure, allowing the
use of battery containers in several different parking lots within its lifetime, which
results in higher ROI (ROI). Batteries can also be important to provide auxiliary
functions to improve the power grid's quality via specific control functions (do
Nascimento and Rüther, 2020) or virtual synchronous machines.
Energy security was an argument in 2020 (Pinto, 2020) to mitigate possible problem
of a brownout in the Brazilian electricity grid by the installation of thermal power plant.
A brownout is a blackout by reason of insufficient generation capacity rather than by
reason of technical problem, such as a transmission supply breakage. However, in
the present case the energy generation cost of PV power plants is already below the
cost of thermal power plants. Furthermore, a correctly tuned power grid generates
more energy in dry periods, by the installed PV and wind power plants, as in periods
with average hydropower generation. This excess generation leads to lower use of
the hydropower generation capacity conserving therefore high water levels in the
hydropower lakes. In countries with low generation capacity dry periods are also not
a problem, because the used off-river-hydropower plants are only used for the
circulation of water between two lakes of different heights, and its evaporation can
be reduced by a floating covers in extreme cases, or even by floating PV power
plants.
Finally we like to remark than it is important that governments, industry and the area
of power grid research take actions to allow a non-restricted exponential growth of
the energy generation with VRE power plants. Otherwise, the combined benefit of a
future with ultra-low-cost-energy generation, the providence of labor places, and the
mitigation of climate change cannot be exploited in its full magnitude.
References
Abdallah, N.B., Mouhous-Voyneau, N., Denoeux, T., 2013. Using Dempster-Shafer Theory to model uncertainty in climate change and environmental impact assessments, Proceedings of the 16th International Conference on Information Fusion. IEEE, pp. 2117-2124.
Airbus, 2021. Airbus reveals new zero-emission concept aircraf. https://www.airbus.com/newsroom/press-releases/en/2020/09/airbus-reveals-new-zeroemission-concept-aircraft.html. (Accessed 30.01.2021.
Arent, D., Sullivan, P., Heimiller, D., Lopez, A., Eurek, K., Badger, J., Jorgensen, H.E., Kelly, M., Clarke, L., Luckow, P., 2012. Improved offshore wind resource assessment in global climate stabilization scenarios. National Renewable Energy Lab.(NREL), Golden, CO (United States).
BloombergNEF, A., 2019. Behind the Scenes Take on Lithium-ion Battery Prices. BP, 2020. BP-Statistical Review of World Energy June 2020. CLARK, P.U., DELWORTH, T.L., WEAVER, A.J., Posts Tagged 'Al Gore'. Delucchi, M.A., Jacobson, M.Z., 2011. Providing all global energy with wind, water, and solar
power, Part II: Reliability, system and transmission costs, and policies. Energy policy 39(3), 1170-1190. http://dx.doi.org/10.1016/j.enpol.2010.11.040.
Diamandis, P.H., Kotler, S., 2012. Abundance: The future is better than you think. Simon and Schuster.
do Nascimento, Á.D.J., Rüther, R., 2020. Evaluating distributed photovoltaic (PV) generation to foster the adoption of energy storage systems (ESS) in time-of-use frameworks. Solar Energy 208, 917-929.
Dudley, B., 2015. BP statistical review of world energy 2016. London, UK. EIA, 2020. Electric Power Monthly - Table 6.07.B. Capacity Factors for Utility Scale Generators
Primarily Using Non-Fossil Fuels. https://www.eia.gov/electricity/monthly/epm_table_grapher.php?t=epmt_6_07_b. (Accessed 18.03.2021 2021).
Fawzy, S., Osman, A.I., Doran, J., Rooney, D.W., 2020. Strategies for mitigation of climate change: a review. Environmental Chemistry Letters, 1-26.
Ghosh, I., 2020. Global greenhouse gas emissions by sector. https://www.visualcapitalist.com/a-global-breakdown-of-greenhouse-gas-emissions-by-sector/.
Glassman, J.A., 2009. The acquittal of carbon dioxide. Online: http://www. rocketscientistsjournal. com/2006/10/co2_acquittal. html.
Guilera, J., Morante, J.R., Andreu, T., 2018. Economic viability of SNG production from power and CO2. Energy Conversion and Management 162, 218-224.
Hansen, J., Sato, M., Hearty, P., Ruedy, R., Kelley, M., Masson-Delmotte, V., Russell, G., Tselioudis, G., Cao, J., Rignot, E., 2015. Ice melt, sea level rise and superstorms: evidence from paleoclimate data, climate modeling, and modern observations that 2° C global warming is highly dangerous. Atmospheric Chemistry & Physics Discussions 15(14).
Hansen, J., Sato, M., Ruedy, R., 1997. Radiative forcing and climate response. Journal of Geophysical Research: Atmospheres 102(D6), 6831-6864. http://dx.doi.org/10.1029/96JD03436.
Hashemi, S., Østergaard, J., 2016. Methods and strategies for overvoltage prevention in low voltage distribution systems with PV. IET Renewable power generation 11(2), 205-214.
Hirth, L., Ueckerdt, F., Edenhofer, O., 2015. Integration costs revisited–An economic framework for wind and solar variability. Renewable Energy 74, 925-939. http://dx.doi.org/10.1016/j.renene.2014.08.065.
Huang, J., Erb, T., THE 'SIGNALING'EFFECT OF THE PARIS AGREEMENT.
IHA, 2020. A brief history of hydropower - From its earliest beginnings to the modern era. https://www.hydropower.org/discover/history-of-hydropower. (Accessed 06.03.2021 2021).
Jacobson, M.Z., 2017. Roadmaps to transition countries to 100% clean, renewable energy for all purposes to curtail global warming, Air Pollution, and Energy Risk. Earth's Future 5(10), 948-952.
Jacobson, M.Z., Delucchi, M.A., 2011. Providing all global energy with wind, water, and solar power, Part I: Technologies, energy resources, quantities and areas of infrastructure, and materials. Energy policy 39(3), 1154-1169. http://dx.doi.org/10.1016/j.enpol.2010.11.040.
Jacobson, M.Z., Delucchi, M.A., Bauer, Z.A., Goodman, S.C., Chapman, W.E., Cameron, M.A., Bozonnat, C., Chobadi, L., Clonts, H.A., Enevoldsen, P., 2017. 100% clean and renewable wind, water, and sunlight all-sector energy roadmaps for 139 countries of the world. Joule 1(1), 108-121.
Jacobson, M.Z., Delucchi, M.A., Cameron, M.A., Frew, B.A., 2015. Low-cost solution to the grid reliability problem with 100% penetration of intermittent wind, water, and solar for all purposes. Proceedings of the National Academy of Sciences 112(49), 15060-15065. http://dx.doi.org/10.1073/pnas.1510028112.
Jagger, N., Foxon, T., Gouldson, A., 2013. Skills constraints and the low carbon transition. Climate policy 13(1), 43-57.
Kausche, M., Adam, F., Dahlhaus, F., Großmann, J., 2018. Floating offshore wind-Economic and ecological challenges of a TLP solution. Renewable Energy 126, 270-280.
Klose, A.K., Karle, V., Winkelmann, R., Donges, J.F., 2020. Emergence of cascading dynamics in interacting tipping elements of ecology and climate. Royal Society open science 7(6), 200599.
Koohi-Fayegh, S., Rosen, M., 2020. A review of energy storage types, applications and recent developments. Journal of Energy Storage 27, 101047.
Kovač, A., Paranos, M., Marciuš, D., 2021. Hydrogen in energy transition: A review. International Journal of Hydrogen Energy.
Kratzenberg, M., Georg; Rüther, Ricardo, 2021. A short review about the limiting factors which can hold back wind and photovoltaic power plants from its presently exponential growth. Solar Energy.
Kroposki, B., Johnson, B., Zhang, Y., Gevorgian, V., Denholm, P., Hodge, B.-M., Hannegan, B., 2017. Achieving a 100% renewable grid: Operating electric power systems with extremely high levels of variable renewable energy. IEEE Power and Energy Magazine 15(2), 61-73.
Kusch-Brandt, S., 2019. Urban Renewable Energy on the Upswing: A Spotlight on Renewable Energy in Cities in REN21's "Renewables 2019 Global Status Report". Multidisciplinary Digital Publishing Institute.
LAZARD, 2019. Levelized Cost of Energy and Levelized Cost of Storage 2019. https://www.lazard.com/perspective/lcoe2019. (Accessed 06.03.2021 2021).
Le Cozannet, G., Duvat, V., Salvat, B., Etienne, S., Terorotua, H., Garcin, M., Lecacheux, S., Montaggioni, L., 2018. Modelling the response of atoll reef islands to multi-millennial sea level rise from the last glacial maximum to the coming 10kyr: the case of mururoa atoll (tuamotu, french polynesia). Journal of Coastal Research(85), 511-515.
Lindsey, R., 2018. Climate change: atmospheric carbon dioxide. National Oceanographic and Atmospheric Administration, News & Features. August.
Lu, X., McElroy, M.B., Kiviluoma, J., 2009. Global potential for wind-generated electricity. Proceedings of the National Academy of Sciences 106(27), 10933-10938.
Lutsko, N.J., Seeley, J.T., Keith, D.W., 2020. Estimating Impacts and Trade‐offs in Solar Geoengineering Scenarios With a Moist Energy Balance Model. Geophysical Research Letters 47(9), e2020GL087290.
Mariusson, J., Thorsteinsson, L., 1997. Study on the importance of harnessing the hydropower resources of the world, Hydropower and Other Renewable Energies Study Committee "Hydren". XXIV Congress, Unipede.
Martínez, P.H., 2020. Lithium-ion battery energy storage systems: global market assessment and business model development in Spain.
Masson-Delmotte, T., Zhai, P., Pörtner, H., Roberts, D., Skea, J., Shukla, P., Pirani, A., Moufouma-Okia, W., Péan, C., Pidcock, R., 2018. IPCC, 2018: Summary for Policymakers. In: Global warming of 1.5 C. An IPCC Special Report on the impacts of global warming of 1.5 C above pre-industrial levels and related global greenhouse gas emission pathways, in the context of strengthening the global. World Meteorological Organization, Geneva, Tech. Rep.
MenkorAviation, 2021. Otto Aviation unveils the Celera 500L, an Aircraft that can Change Everything. https://www.menkoraviation.com/en/news/otto-aviation-unveils-the-celera-500l-an-aircraft-that-can-change-everything/. (Accessed 30.01.2018.
NOAA, 2019. Billion Dollar Disasters - Costly weather and climate disasters have increased. https://www.globalchange.gov/browse/indicators/billion-dollar-disasters.
NOAA, N.O.a.A.A., Global Monitoring Laboratory, 2021. Trends in Atmospheric Carbon Dioxide - Monthly Average Mauna Loa CO2. https://www.esrl.noaa.gov/gmd/ccgg/trends/weekly.html. (Accessed 23.01. 2021.
Paur, J., 2012. Boeing Freezes Design With Liquid Natural Gas-Powered Airliner. https://www.wired.com/2012/03/boeing-freezes-design-with-liquid-natural-gas-powerd-airliner/. (Accessed 30.01.2021.
Petit, J.-R., Jouzel, J., Raynaud, D., Barkov, N.I., Barnola, J.-M., Basile, I., Bender, M., Chappellaz, J., Davis, M., Delaygue, G., 1999. Climate and atmospheric history of the past 420,000 years from the Vostok ice core, Antarctica. Nature 399(6735), 429.
Pinto, T., 2020. O apagão energético de 2001. https://brasilescola.uol.com.br/historiab/apagao.htm. (Accessed 26.03. 2021).
Ray, D., 2019. Lazard's Levelized Cost of Energy Analysis—Version 13.0. Lazard: New York, NY, USA, 20.
Reichelstein, S.J., Sahoo, A., 2015. Cost-and price dynamics of solar PV modules. REVE, 2020. Nordex to build concrete tower factory for wind turbines for wind energy in Spain.
Schalk, C., 2019. An independent Global Energy Forecast to 2050, to compare with the IEA's WEO 2019. EnergyPost.eu.
Shakoor, A., Ashraf, F., Shakoor, S., Mustafa, A., Rehman, A., Altaf, M.M., 2020. Biogeochemical transformation of greenhouse gas emissions from terrestrial to atmospheric environment and potential feedback to climate forcing. Environmental Science and Pollution Research, 1-24.
Smith, A., Lott, N., Houston, T., Shein, K., Crouch, J., Enloe, J., 2019. US Billion-Dollar Weather & Climate Disasters 1980-2019. NOAA National Centers for Environmental Information,[Online], Available: https://www. ncdc. noaa. gov/billions/events. pdf.[Accessed April 18, 2018].
Statista, 2021. Global offshore wind energy capacity from 2009 to 2019 https://www.statista.com/statistics/476327/global-capacity-of-offshore-wind-energy/.
Statistics, O.E., 2008. Fuel and Energy Source Codes and Emission Coefficients. Energy Information Administration, Department of Energy, retrieved July 7, 2009.
Stern, N., 2008. The economics of climate change. American Economic Review 98(2), 1-37. Turner, M.G., Calder, W.J., Cumming, G.S., Hughes, T.P., Jentsch, A., LaDeau, S.L., Lenton, T.M.,
Shuman, B.N., Turetsky, M.R., Ratajczak, Z., 2020. Climate change, ecosystems and abrupt change: science priorities. Philosophical Transactions of the Royal Society B 375(1794), 20190105.
Webb, J., de Silva, H.N., Wilson, C., 2020. The future of coal and renewable power generation in Australia: A review of market trends. Economic Analysis and Policy.
Wheeling, K., 2020. How Long Was Venus Habitable? , Eos Science News by AGU. Journal of Geophysical Research: Planets.
Wikipedia, 2020. Solar Power - Table: Largest PV power stations as of February 2020 https://en.wikipedia.org/wiki/Solar_power. (Accessed 29.01.2021.