244
2011 ANNUAL REPORT

2011 ANNUAL REPORT

2 CHINA CONSTRUCTION BANK CORPORATION ANNUAL REPORT 2011
One of the world’s largest banks
Headquartered in Beijing, China Construction Bank Corporation has an operating history of over 50 years. The Bank was listed on Hong Kong Stock Exchange in October 2005 (stock code: 939) and listed on the Shanghai Stock Exchange in September 2007 (stock code: 601939). At the end of 2011, the market capitalisation of the Bank reached US$174.7 billion, ranking 2nd among listed banks in the world. At the end of 2011, the Bank had a network of 13,581 branches and sub-branches in Mainland China, maintained overseas branches in Hong Kong, Singapore, Frankfurt, Johannesburg, Tokyo, Seoul, New York, Ho Chi Minh City and Sydney, and representative offices in Taipei and Moscow, and owned multiple subsidiaries, such as CCB Asia, CCB Financial Leasing, CCB International, CCB Trust, Sino-German Bausparkasse, CCB London, CCB Principal Asset Management, and CCB Life. The Group provides comprehensive financial services to its customers.
Visit us at www.ccb.com

1CHINA CONSTRUCTION BANK CORPORATION ANNUAL REPORT 2011
Financial Highlights .............................................................................. 2
Corporate Information ........................................................................... 4
Chairman’s Statement ........................................................................... 12
President’s Report ................................................................................... 14
Management Discussion and Analysis .................................................. 20
Financial Review ........................................................................ 20
Business Review.......................................................................... 41
Risk Management ...................................................................... 62
Prospects ..................................................................................... 69
Corporate Social Responsibility ............................................................ 72
Changes in Share Capital and Particulars of Shareholders ................. 74
Corporate Governance Report .............................................................. 76
Profiles of Directors, Supervisors and Senior Management................. 88
Report of the Board of Directors............................................................ 105
Report of the Board of Supervisors ........................................................ 109
Major Issues ............................................................................................ 111
Independent Auditor’s Report ................................................................ 113
Financial Statements ............................................................................. 114
Unaudited Supplementary Financial Information ............................... 230
Organisational Structure ........................................................................ 233
Branches and Subsidiaries ..................................................................... 235
Definitions .............................................................................................. 240
NET ASSETS PER SHARE (RMB)
NET PROFIT (IN MILLIONS OF RMB)
BASIC AND DILUTED EARNINGS PER SHARE (RMB)

2 CHINA CONSTRUCTION BANK CORPORATION ANNUAL REPORT 2011
The financial information set forth in this annual report is prepared on a consolidated basis in accordance with the IFRS, and expressed in RMB unless otherwise stated.
(Expressed in millions of RMB unless otherwise stated)
2011 2010 Change (%) 2009 2008 2007
For the year
Net interest income 304,572 251,500 21.10 211,885 224,920 192,775
Net fee and commission income 86,994 66,132 31.55 48,059 38,446 31,313
Other operating income 7,837 8,148 (3.82) 9,370 6,381 (3,371)
Operating income 399,403 325,780 22.60 269,314 269,747 220,717
Operating expenses (144,537) (121,366) 19.09 (105,146) (99,193) (92,327)
Impairment losses (35,783) (29,292) 22.16 (25,460) (50,829) (27,595)
Profit before tax 219,107 175,156 25.09 138,725 119,741 100,816
Net profit 169,439 135,031 25.48 106,836 92,642 69,142
Net profit attributable to equity shareholders of the Bank 169,258 134,844 25.52 106,756 92,599 69,053
As at 31 December
Net loans and advances to customers 6,325,194 5,526,026 14.46 4,692,947 3,683,575 3,183,229
Total assets 12,281,834 10,810,317 13.61 9,623,355 7,555,452 6,598,177
Deposits from customers 9,987,450 9,075,369 10.05 8,001,323 6,375,915 5,329,507
Total liabilities 11,465,173 10,109,412 13.41 9,064,335 7,087,890 6,175,896
Total equity attributable to equity shareholders of the Bank 811,141 696,792 16.41 555,475 465,966 420,977
Share capital 250,011 250,011 – 233,689 233,689 233,689
Core capital 750,660 634,683 18.27 491,452 431,353 386,403
Supplementary capital 189,855 144,906 31.02 139,278 86,794 83,900
Net capital 924,506 762,449 21.25 608,233 510,416 463,182
Risk-weighted assets 6,760,117 6,015,329 12.38 5,197,545 4,196,493 3,683,123
Per share (In RMB)
Basic and diluted earnings per share 0.68 0.56 21.43 0.45 0.40 0.30
Interim cash dividend declared during the year – – NA – 0.1105 0.067
Final cash dividend proposed after the reporting period 0.2365 0.2122 11.45 0.202 0.0837 0.065
Special cash dividend declared during the year – – NA – – 0.072716
Net assets per share 3.27 2.80 16.79 2.39 2.00 1.81

3CHINA CONSTRUCTION BANK CORPORATION ANNUAL REPORT 2011
12,2
81,8
34
10,8
10,3
17
9,62
3,35
5
7,55
5,45
2
6,59
8,17
7
11,4
65,1
73
10,1
09,4
12
9,06
4,33
5
7,08
7,89
0
6,17
5,89
6
TOTAL ASSETS(IN MILLIONS OF RMB)
TOTAL LIABILITIES(IN MILLIONS OF RMB)
CORE CAPITALADEQUACY RATIO(%)
10.4
0
10.9
7
9.31
10.1
7
10.3
7
1110090807 1110090807 1110090807
Financial ratios (%)
2011 2010 Change +/(-) 2009 2008 2007
Profitability indicators
Return on average assets1 1.47 1.32 0.15 1.24 1.31 1.15
Return on average equity 22.51 22.61 (0.10) 20.87 20.68 19.50
Net interest spread 2.57 2.40 0.17 2.30 3.10 3.07
Net interest margin 2.70 2.49 0.21 2.41 3.24 3.18
Net fee and commission income to operating income 21.78 20.30 1.48 17.84 14.25 14.19
Cost-to-income ratio 36.19 37.25 (1.06) 39.04 36.77 41.83
Loan-to-deposit ratio 65.05 62.47 2.58 60.24 59.50 61.40
Capital adequacy indicators
Core capital adequacy ratio2 10.97 10.40 0.57 9.31 10.17 10.37
Capital adequacy ratio2 13.68 12.68 1.00 11.70 12.16 12.58
Total equity to total assets 6.65 6.48 0.17 5.81 6.19 6.40
Asset quality indicators
Non-performing loan ratio 1.09 1.14 (0.05) 1.50 2.21 2.60
Allowances to non-performing loans 241.44 221.14 20.30 175.77 131.58 104.41
Allowances to total loans 2.64 2.52 0.12 2.63 2.91 2.72
1. Calculated by dividing net profit by the average of total assets at the beginning and end of the year.2. Calculated in accordance with the guidelines issued by the CBRC.

4 CHINA CONSTRUCTION BANK CORPORATION ANNUAL REPORT 2011
Legal name and abbreviation in Chinese 中國建設銀行股份有限公司 (abbreviated as “中國建設銀行”)
Legal name and abbreviation in English China Construction Bank Corporation (abbreviated as “CCB”)
Legal representative Wang Hongzhang
Authorised representatives Zhang JianguoChan Mei Sheung
Secretary to the Board Chen Caihong
Representative of securities affairs Xu Manxia
Company secretary Chan Mei Sheung
Qualified accountant Yuen Yiu Leung
Registered address and postcode No. 25, Financial Street, Xicheng District, Beijing 100033
Internet website www.ccb.com
Email address [email protected]
Principal place of business in Hong Kong 12/F, AIA Central, 1 Connaught Road Central, Central, Hong Kong
Newspapers for information disclosure China Securities Journal and Shanghai Securities News
Website of the Shanghai Stock Exchange for publishing the annual report prepared in accordance with PRC GAAP
www.sse.com.cn
Website of Hong Kong Stock Exchange for publishing the annual report prepared in accordance with IFRS
www.hkex.com.hk
Place where copies of this annual report are kept Board of Directors Office of the Bank
Contact information Contact Address: No. 25, Financial Street, Xicheng District, BeijingTelephone: 86-10-66215533Facsimile: 86-10-66218888

5CHINA CONSTRUCTION BANK CORPORATION ANNUAL REPORT 2011
Listing stock exchanges, stock abbreviations and stock codes
A-share: Shanghai Stock Exchange Stock abbreviation: 建設銀行 Stock code: 601939
H-share: The Stock Exchange of Hong Kong Limited Stock abbreviation: CCB Stock code: 939
Date and place of registration change 13 February 2012State Administration for Industry & Commerce of the People’s Republic of China
Registration number of the corporate legal person business license
100000000039122
Organisation code 10000444-7
Financial license institution number B0004H111000001
Taxation registration number 京稅證字 110102100004447
Certified public accountants PricewaterhouseCoopers Zhong Tian CPAs Limited CompanyAddress: 11/F, PricewaterhouseCoopers Centre, 202 Hu Bin Road, ShanghaiPricewaterhouseCoopersAddress: 22/F, Prince’s Building, Central, Hong Kong
Legal advisor as to PRC laws Jun He Law OfficesAddress: China Resources Building, 20/F, 8 Jianguomenbei Avenue, Dongcheng District, Beijing
Legal advisor as to Hong Kong laws Clifford ChanceAddress: 28/F, Jardine House, One Connaught Place, Central, Hong Kong
A-share registrar China Securities Depository and Clearing Corporation Limited, Shanghai BranchAddress: 36/F, China Insurance Building, 166 East Lujiazui Road, Pudong New District, Shanghai
H-share registrar Computershare Hong Kong Investor Services LimitedAddress: Rooms 1712-1716, 17th Floor, Hopewell Centre, 183 Queen’s Road East, Wanchai, Hong Kong

6 CHINA CONSTRUCTION BANK CORPORATION ANNUAL REPORT 2011
CORPORATE INFORMATION
Euromoney
The Best Private Bank, China
Global Finance
Star of China – Best Corporate Governance Bank
World’s Best Trade Finance Bank, China
FinanceAsia
Best Bank in China
Ranked 7th in the “Best managed companies in China” Vote
Ranked 4th in the “Best Corporate Governance” Vote
Ranked 7th in the “Most Committed to a Strong Dividend Policy” Vote
International Data Group
Global Competitive Brands – Top 10 in China
The Banker
Ranked 10th in “Top 500 Banking Brands”
Ranked 3rd in “Top 10 Most Valuable Commercial Banking Brands”
Ranked 8th in “Top 1000 World Banks”
Financial Times
Ranked 24th in the “BrandZ Top 100”
Ranked 7th in the “FT Global 500”
Fortune
Ranked 108th in the “Fortune Global 500”
Ranked 9th in the “Fortune China 500”
Ranked 1st in the banking sector in the “China Corporate Social Responsibility Ranking”
Forbes
Ranked 17th in “Global 2000”
Financial Times Fortune
International Data Group
RANKINGS AND AWARDS

7CHINA CONSTRUCTION BANK CORPORATION ANNUAL REPORT 2011
AsiaRisk
House of the Year, China
The Asset
The Asset Corporate Governance Gold Award for Social Responsibility and Investor Relations
The Capital
Outstanding Retail Banking Corporation in China
The Asian Banker
Best SMEs Banking Products in China
Ranked 4th in “The Asian Banker 500 – Asia Pacific Largest Banks”
The 21st Century Business Herald
The Asian Bank with Best Prudent Operation
Best Service of the Year
China Business Journal
Stated-owned Commercial Bank with Best Competitiveness
People.com.cn
People’s Social Responsibility Award
The Chinese Banker
The Bank with Best Profitability
The Best Corporate Social Responsibility Award

8 CHINA CONSTRUCTION BANK CORPORATION ANNUAL REPORT 2011
CORPORATE INFORMATION
STOCK PRICESH-shares (HKD) A-shares (RMB)
Year end closing price
Maximum Price in the Year
Minimum Price in the Year
Year end closing price
Maximum Price in the Year
Minimum Price in the Year
2011 5.42 7.58 4.41 4.54 5.34 4.32
2010 6.97 8.30 5.77 4.59 6.21 4.51
2009 6.67 7.46 3.62 6.19 6.75 3.67
2008 4.25 7.29 2.50 3.83 10.21 3.46
2007 6.61 8.97 3.96 9.85 11.58 6.45
DIVIDEND RECORDSH-share Holders (RMB/Share) A-share Holders (RMB/Share)
Interim Dividend Final Dividend Special Dividend Interim Dividend Final Dividend Special Dividend
2011 – 0.2365 – – 0.2365 –
2010 – 0.2122 – – 0.2122 –
2009 – 0.202 – – 0.202 –
2008 0.1105 0.0837 – 0.1105 0.0837 –
2007 0.067 0.065 0.072716 – 0.065 –
Corporate Governance Asia
2nd Corporate Governance Asia Recognition Awards
Asian Corporate Director Recognition Awards, China
Best Investor Relations Website/Promotion
Best Investor Relations (China company)
China Enterprise Confed-eration
Ranked 8th in “Top 500 Chinese Corporations”
Financial News
Best Commercial Bank of the Year
China Business News
Bank of the Year
China Enterprise Confederation

9CHINA CONSTRUCTION BANK CORPORATION ANNUAL REPORT 2011
STOCK PRICE PERFORMANCE CHART
31 D
ecem
ber 2
010
14 J
anua
ry 2
011
28 J
anua
ry 2
011
11 F
ebru
ary
2011
25 F
ebru
ary
2011
11 M
arch
201
1
25 M
arch
201
1
8 A
pril
2011
22 A
pril
2011
6 M
ay 2
011
20 M
ay 2
011
3 Ju
ne 2
011
17 J
une
2011
1 Ju
ly 2
011
15 J
uly
2011
29 J
uly
2011
12 A
ugus
t 201
1
26 A
ugus
t 201
1
9 S
epte
mbe
r 201
1
23 S
epte
mbe
r 201
1
7 O
ctob
er 2
011
21 O
ctob
er 2
011
4 N
ovem
ber 2
011
18 N
ovem
ber 2
011
2 D
ecem
ber 2
011
16 D
ecem
ber 2
011
30 D
ecem
ber 2
011
Shanghai stock exchange composite index A-share stock price
Comparison between A-share stock price and Shanghai stock exchange composite index
Comparison between H-share stock price and Hang Seng Index
31 D
ecem
ber 2
010
14 J
anua
ry 2
011
28 J
anua
ry 2
011
11 F
ebru
ary
2011
25 F
ebru
ary
2011
11 M
arch
201
1
25 M
arch
201
1
8 A
pril
2011
22 A
pril
2011
6 M
ay 2
011
20 M
ay 2
011
3 Ju
ne 2
011
17 J
une
2011
1 Ju
ly 2
011
15 J
uly
2011
29 J
uly
2011
12 A
ugus
t 201
1
26 A
ugus
t 201
1
9 S
epte
mbe
r 201
1
23 S
epte
mbe
r 201
1
7 O
ctob
er 2
011
21 O
ctob
er 2
011
4 N
ovem
ber 2
011
18 N
ovem
ber 2
011
2 D
ecem
ber 2
011
16 D
ecem
ber 2
011
30 D
ecem
ber 2
011
Hang Seng Index H-share stock price

10 CHINA CONSTRUCTION BANK CORPORATION ANNUAL REPORT 201110 CHINA CONSTRUCTION BANK CORPORATIONCC ANNUAL REPORT 2011
In 2011, the Bank strengthened the management of service quality, product innovation and process optimisation, and the overall customer satisfaction was steadily improved.
13,581The number of operation outlets in the PRC
Provide better service to our customers
13 countries and regionsOverseas entities

11CHINA CONSTRUCTION BANK CORPORATION ANNUAL REPORT 2011 11CHINA CONSTRUCTION BANK CORPORATIONC ANNUAL REPORT 2011
45,645The number of ATMs
84.54mThe number of personal online banking customers

12 CHINA CONSTRUCTION BANK CORPORATION ANNUAL REPORT 2011
Dear shareholders,
In 2011, facing the complex and fast-changing economic environment, the Group stringently complied with the government’s macroeconomic control measures and regulatory requirements by continuing to promote structural adjustments and business transformation. Risk management and internal control were strengthened, and various businesses maintained a stable and rapid growth. Business results were excellent. With stable performance in the capital market, our comprehensive competitiveness and brand value rose substantially.
In 2011, the Group’s total assets exceeded RMB12 trillion, while net profit for the year rose to RMB169,439 million, up 25.48% year-on-year. The return on average assets and the return on average equity were 1.47% and 22.51% respectively. The net interest margin was 2.70% while the cost-to-income ratio was 36.19%. Our key financial indicators continued to lead the market. The Board has recommended a final cash dividend of RMB0.2365 per share.
We continued to improve credit structure with more stable credit grants. In 2011, facing the complex and fast-changing external operating environment, the Group maintained its proactive and prudent operational philosophy, imposed reasonable controls over credit amount, and further improved its credit structure. At the end of 2011, loans and advances to customers increased by RMB827,283 million over 2010 to RMB6,496,411 million. The total increase in loans, pace of lending and lending direction were in compliance with regulatory requirements. We continued to consolidate our traditional competitive advantages. Infrastructure loans were mainly granted to support ongoing or continued projects, and increased by RMB194,362 million, accounting for 41.42% of the increase in corporate loans. We continued to maintain the leading position in terms of loan balance and increase of residential mortgage loans, with best asset quality in the market. Loan grants to key livelihood sectors such as small and micro enterprises, agriculture-related and indemnificatory housing
construction, increased rapidly. In areas including government financing vehicles, real estate and industries with excess capacity, loan balances continued to either decrease or maintain a slower growth rate.
We continued to improve our income structure, with rapid development of strategic emerging businesses. Net fee and commission income for the year rose to RMB86,994 million, an increase of 31.55% over 2010. Net fee and commission income accounted for 21.78% of total operating income, representing an increase of 1.48 percentage points over the previous year. The cumulative number of our credit cards issued was 32.25 million, and we outperformed our peers in terms of multiple core business indicators, including the number of customers, credit card spending amount, and asset quality. The scale of our investment banking services continued to expand, with the underwriting of short-term commercial papers, private placement bonds and other businesses achieving first position in the market. In addition, we led the market in terms of wealth management income and profit margin. The wealth management and private banking business developed rapidly. Lastly, our electronic banking business achieved extraordinary expansion, with a number of indicators leading in the market, such as the total number of customers of online banking, mobile phone banking and SMS banking and the usage of products. The ratio of the number of transactions through electronic banking to that through front desk was 206.72%, up 65 percentage points over 2010.
We maintained steady progress in integrated operations, working toward the direction of becoming a multi-functional bank. In 2011, the total assets of our overseas entities reached RMB443,188 million, with decreases in both NPL and NPL ratio. Our Taipei and Moscow representative offices were opened in succession, while the work related to applications to open a branch in Toronto and subsidiary banks in Dubai and Brazil, and to upgrade Moscow and Taipei representative offices, progressed smoothly. CCB Life was also officially set up, becoming the pilot foray of domestic banks entering the insurance industry. Our subsidiaries, including investment bank, fund, trust, financial leasing and housing savings, all maintained
Wang HongzhangChairman

The goal of becoming a modern bank
13CHINA CONSTRUCTION BANK CORPORATION ANNUAL REPORT 2011
stable growth, further reinforcing the Group’s capability to provide comprehensive financial solutions to our customers.
We continued to tighten our risk controls and asset quality remained good. In 2011, the Group comprehensively promoted implementation of the New Basel Accord, and deepened the practical application of the related work results. It strengthened comprehensive risk management, including risk management of off-balance sheet items, overseas business, wealth management business and consolidation. At the end of 2011, the NPL ratio was 1.09%, a decrease of 0.05 percentage points from the previous year. The ratio of allowances for impairment losses to non-performing loans and that of allowances for impairment losses to gross loans were 241.44% and 2.64% respectively, higher than regulatory requirements.
The Group continued to promote public welfare, and proactively fulfil its corporate social responsibilities. In 2011, the Group continued to promote long-term public welfare projects such as “Programme for Impoverished High School Students”, “Sponsorship Programme for Impoverished Mothers of Heroes & Exemplary Workers”, “CCB Scholarships and Grants for College Students from Ethnic Minorities” and CCB Hope Primary Schools. In addition, we proactively explored innovative online channels to promote public welfare projects, and actively supported projects such as education, medical and health care, policy research, disaster relief work and environmental protection. In 2011, the Group won numerous honours for its social responsibility efforts including “Best Corporate Social Responsibility Institution Award” from China Banking Association, “Most Responsible Corporate Citizen” award from China Newsweek, the “People’s Social Responsibility Award” from people.com.cn, and “Best Corporate Social Responsibility Award” from The Chinese Banker magazine. In addition, in the “China Corporate Social Responsibility Ranking” published by Fortune China, the Bank ranked first in the banking sector.
In 2011, the Group delivered a satisfactory report card to our investors with outstanding results and stable capital market performance, and won wide recognition from the market and
community. We received accolades from over 50 domestic and foreign professional bodies, enhancing our international image and brand value. All these hard-earned achievements are attributable to the support of our customers, shareholders and the wide business community, and the concerted hard work of all our staff. To these people, I would like to express my sincere gratitude.
Looking ahead, the domestic and international economic and financial situation seems more complex with growing uncertainty in 2012, and market competition tends to be more intensive. The Group will adhere to our customer-focused and market-oriented policies, and proactively expand our customer base. We will focus on large industries, large systems, large cities and high net worth customers, while trying to attract more small and medium enterprises and ordinary customers. While we will continue to leverage on our traditional advantages in infrastructure finance, cost advisory services and residential mortgage finance, we will also proactively develop our emerging businesses such as retail business, small and micro enterprise business, electronic banking, consumer finance and pension business. Further efforts will be made in strengthening our infrastructure such as distribution channels, marketing and IT. Bearing in mind the requirements for a comprehensive and multi-functional bank that develops in an intensive manner, we will work hard towards the goal of becoming a modern bank that is “best domestically, and excellent internationally”, and owns global influence and competitiveness.
Wang HongzhangChairman
23 March 2012

14 CHINA CONSTRUCTION BANK CORPORATION ANNUAL REPORT 2011
Dear shareholders,
In 2011, the Group actively responded to the complex and fast-changing domestic and global economic environment by continuing to promote structural adjustments and business transformation. Traditional advantage businesses grew steadily, while emerging businesses achieved healthy and rapid growth. Good business results were attained with stable asset quality, continuous product innovation and improving customer service capabilities.
EXCELLENT BUSINESS PERFORMANCE AND STABLE ASSET QUALITYBusiness performance was good. In 2011, the Group achieved a net profit of RMB169,439 million, up 25.48% over 2010. Net interest income increased by 21.10%. Net fee and commission income increased by 31.55% to RMB86,994 million, accounting for 21.78% of the operating income, 1.48 percentage points higher than 2010, with improving income structure. The cost-to-income ratio was kept at a low level, and fell to 36.19% from 2010.
Assets and liabilities grew steadily. At the end of 2011, total assets rose by 13.61% to RMB12,281,834 million from 2010. Gross loans and advances to customers rose by 14.59% to RMB6,496,411 million, and deposits from customers increased by 10.05% to RMB9,987,450 million. The loan-to-deposit ratio was 65.05% with ample liquidity.
Asset quality remained stable. At the end of 2011, the Group’s non-performing loans increased by RMB6,203 million to RMB70,915 million, while the non-performing loan ratio dropped by 0.05 percentage points to 1.09% from 2010. The ratio of allowances for impairment losses to non-performing loans rose to 241.44%, while that of allowances for impairment losses to gross loans was 2.64%, representing stronger risk resistance ability.
FURTHER STRUCTURE ADJUSTMENTS AND STRONG DEVELOPMENT OF EMERGING BUSINESSESCorporate loans were granted in a sound manner with deepening structure adjustments. At the end of 2011, corporate loans and advances totalled RMB4,446,168 million, an increase of 11.80%. Loans to industries with excess capacity decreased by RMB1,607 million from 2010. The number and loan balance of government financing vehicles dropped by 158 and RMB112,160 million respectively. Property development loans increased only by 0.16%. On the other hand, infrastructure loans increased by RMB194,362 million over 2010, accounting for 41.42% of the increase in corporate loans. The Group is the market leader in internet merchant business with the loan balance up by 80.45%. The advances of domestic factoring business were RMB127,936 million, an increase of 89.54%. Agriculture-related loans increased by 27.71%. Loans to small enterprises increased by 24.60%, due to numerous innovative products and continuously improving service capability, which brought the Bank the “Best SMEs Banking Products in China” award from The Asian Banker magazine.
Zhang JianguoVice chairman, executive directorand president

15CHINA CONSTRUCTION BANK CORPORATION ANNUAL REPORT 2011
Personal loans grew rapidly while maintaining good asset quality. At the end of 2011, personal loans totalled RMB1,683,855 million, an increase of 23.02%. In this amount, personal residential mortgage loans were RMB1,317,444 million, an increase of 20.74%, ranking first in the market in terms of both loan balance and the increase. The Group continued to strengthen post-loan management, with asset quality maintaining its first position among its peers. At the end of 2011, the non-performing loan ratio for personal loans was 0.31% while that for residential mortgage loans was 0.20%.
Credit card business gained stronger market influence. At the end of 2011, the cumulative number of credit cards issued totalled 32.25 million, with loan balance of RMB97,553 million, and the spending amount in 2011 reached RMB588,901 million. The Bank maintained its leading position on key indicators such as the number of credit card users, average card spending and asset quality. The Bank’s installments business gained in market competitiveness, and car installments in particular, became a major attraction in the market. Brand influence continued to rise, with numerous compliments from competitions organised by mainstream media and professional organisations.
Institutional, custodial and pension businesses maintained good growth momentum. The Bank expanded on its “Minben Tongda” branded comprehensive financial services, with the launch of a sub-brand focusing on services for cultural sectors, which had won 3,037 customers in the sectors on a cumulative basis since the launch. In various areas, including the number of civil cards issued to budget units on public finance, the number of “Xincunguan” customers, income from the fund collection and payment agency service for trust plans, and the number of contracted customers of the Futures-Bank System (FBS), the Bank ranked first in the market. Assets under custody exceeded RMB2 trillion, an increase of 57.50%. As for the securities investment funds under custody, the Bank ranked first among its peers in terms of the increase in the number of funds, and second in terms of total amount. The amount and number of securities companies’ collective assets management plans under custody continued to rank first in the market. There was an increase of 5,484 in the number of contracted enterprise annuity clients, an increase of 1.38 million in the number of contracted personal accounts, and an increase of 37.93% in the amount of contracted assets under custody.
Financial market business led the market in multiple indicators. The Bank adhered to its prudent investment and trading philosophy in the financial market business, and reaped fast growth in operating revenue through proactive adjustments to operational strategies. The Bank achieved substantial increase in the yields of RMB-denominated debt securities investments, commanded the largest market share in book-entry treasury bonds underwriting for the third consecutive year, and ranked second in the over-the-counter trading volume of book-entry treasury bonds. The trading volume of precious metals increased by 759% over the previous year. CCB brand physical gold continued to command the largest market share. The foreign exchange trading business improved steadily.
Investment banking made greater profit contribution. With the support of its financial total solutions, the Group proactively promoted the establishment of comprehensive long-term business relationship with customers. The contribution from new financial advisory services such as M&A and restructuring, debt restructuring, listing and refinancing rose substantially. The accumulated underwriting volume of short-term commercial papers ranked first in the market for the sixth consecutive year. Wealth management business developed rapidly, bringing in an income of RMB7,907 million.
STRONGER CUSTOMER BASE AND BETTER CHANNEL DEPLOYMENTEfforts in customer expansion produced fruit and led to stronger customer base . Corporate and institutional customers increased by 265,000, leading to substantial increase in corporate settlement accounts. Small business credit customers totalled 72,091, representing an increase of 10,392. The number of personal customers with non-zero asset under management (AUM) increased by 18.17 million, and the number of high-end customers with more than RMB3 million of AUM increased by 25,000.
Specialised business structure made progress, and emerging distribution channels developed rapidly. At the end of 2011, 245 private banks and wealth management centres, and 240 small business operating centres in “Credit factory” model were in operation; 940 personal loan centres had been established. The application level of electronic banking channels was improved significantly. The ratio of the number of transactions through electronic banking to that through the front desk reached 206.72%, an increase of 65 percentage points over 2010.
UPGRADED FUNDAMENTAL MANAGEMENT AND STEADY IMPROVEMENT IN RISK MANAGEMENT CAPABILITYOverall risk management was enhanced . The Group strengthened risk control in key areas such as government financing vehicles, real estate, and industries with excess capacity. Fundamental risk management in areas including off-balance sheet items, overseas business, country risk, collaterals and consolidation was also strengthened. The economic capital, industry limits and credit approval management systems were enhanced, and the use of credit risk measurement tools was greatly promoted. The Bank adopted a proactive attitude in responding to the volatility in the global financial markets, by actively promoting the building of market risk measurement system and tools. Operational risk controls was strengthened through active identification of critical risk points, ensuring safe and stable operations. Steady progress was made in implementing the New Basel Capital Accord, including smooth progress in implementing the three pillars.

16 CHINA CONSTRUCTION BANK CORPORATION ANNUAL REPORT 2011
Capital management improved steadily . Capitalising on the implementation of Pillar II under the New Basel Capital Accord, the Bank optimised the capital measurement system, improved the related systems, and continuously refined capital management. Greater efforts were made on the management of off-balance sheet business and the capital occupation of off-balance sheet business continued to decline, leading to rising capital adequacy ratio.
Management of service quality, product innovation and process optimisation was strengthened. The Group continued to monitor the personal and corporate customer satisfaction, and the overall customer satisfaction steadily improved in 2011. It further developed its service quality management system, and established a service quality survey and evaluation system covering various channels, including branch outlets, wealth management centres and the 95533 telephone customer service centre. It finished 531 process optimisation projects with the Lean Six Sigma management approach, enhancing its capability of product operation, fundamental management and risk control. In 2011, the Group established four new product innovation laboratories, and completed 372 product innovations. The Group continued to work with Bank of America on various cooperative projects including site selection for bank outlet, post management and counterparty risk management.
Information technology (IT) tasks progressed steadily. The Bank finalised the implementation road map of the new generation core banking system for the next three years. It intensified application system development to support business and product innovation. The core and peripheral business systems for overseas branches were rolled out to support overseas business expansion. The Bank established and improved the production safety target and responsibility system, the technical code and standard system to strengthen its capability of system operation assurance. The contingency plans and risk factors for the information system were reviewed, and response strategies for different risks and severity were established to improve emergency response efficiency.
FURTHER INTEGRATED OPERATIONS AND CONTINUED OVERSEAS EXPANSIONIntegrated operations made significant progress. The Group actively and prudently promoted integrated operations, in order to enhance the core competitiveness of the Group as a whole. The Group became the first among the four state-owned banks to own controlling interests in a life insurance company, after its successful acquisition of a 51% stake in Pacific-Antai in June 2011, which was subsequently renamed as CCB Life. The Group actively promoted the new types of rural financial institutions, and 16 of its rural banks were in operation at the end of 2011.
Overseas network achieved steady expansion. The Taipei and Moscow representative offices were opened in May 2011, and the establishment of entities in other regions are also in progress.
OUTLOOK FOR 2012In 2012, against the expected complications of global economy coupled with slower domestic economic growth, China’s pace of economic structural adjustments and transformation of development patterns will be accelerated. Competition in the banking industry will become more intense, increasing the pressure on risk prevention and control. We will strengthen our research and judgement on policies and markets, support real economy in line with our five-year development plan, and try to achieve stable progress and comprehensive development.
consolidate market share and improve deposit structure.
infrastructure, livelihood areas, energy saving and emission reduction, emerging manufacturing and service industries. We will continue to provide good financial services to SMEs and micro-enterprises, and promote intensive operations.
business to enhance our market competitiveness.
improve customer structure, and try to increase the profit contribution per customer.
outlets, strengthen the development of the electronic banking channels, and promote the coordinated development of the various channels.
Facing the challenges, the Group will seize every growth opportunity with steadfast confidence, and will make full efforts to deliver excellent services and operating results to reward our customers and shareholders. Last but not least, I sincerely appreciate the support from our customers and I am indebted to the staff for their hard work and efforts.
Zhang JianguoVice chairman, executive director and president
23 March 2012

17CHINA CONSTRUCTION BANK CORPORATION ANNUAL REPORT 2011
Zhang FurongChairman of the board of supervisors
In 2011, pursuant to the provisions the Company Law and the Articles of Association of the Bank, the board of supervisors earnestly performed its duties, strengthened its efforts in internal risk control, finance supervision, and performance and due diligence supervision, made contributions proactively and safeguarded the interest of the shareholders and the Bank.
and overall importance. On matters regarding strategy planning and implementation, integrated operation, building of development capacity, and internal control and risk management, the board of supervisors provided opinions and suggestions actively, and thus pushed forward relevant work. Through holding surveys and seminars, onsite inspections and other means, the board of supervisors also developed in-depth understanding of the present operation and development situation of branches and outlets, urged relevant parties to study the bottom needs and promoted solutions to actual difficulties and problems.
business fields, listened to submissions regarding loan management of government financing vehicles, off-balance sheet business, overseas business, risk management, case prevention and control, operation and development of rural banks, etc. It also indicated relevant risks at proper time and presented opinions and suggestions. The board of supervisors conducted five specified surveys covering operation and management of banking outlets, implementation of internal control regulations, risk analysis of land mortgage loans, operation of overseas entities, and post-lending management of corporate business, during which it presented opinions and suggestions, and as a result prompted the improvement of relevant work.
board of supervisors revised and optimised Measures for Performance Supervision and Assessment of Board of Directors, Senior Management and their members by Board of Supervisors. Through attending meetings, reviewing analysis materials and performance report, holding interviews and seminars and making performance ratings, the board of supervisors strongly supervised the corporate governance practice of the Bank, material decision-making and implementation, and performance of directors and senior management members. They also seriously implemented the annual performance
assessment, presented annual performance assessment reports of the Board, senior management and their members with reporting and disclosing in accordance with relevant rules.
disclosure of regular reports, continuously conducted qualified finance supervision, timely analysed new regulations and new changes of accounting standards, strengthened the relationship with functional departments, regularly communicated with external auditors to follow up the audit development, report compilation and reviewing work and presented opinions and requirements. It also focused on matters affecting the authenticity and fairness of financial reports. It supervised the implementation of insider registration and management of insider information as well as fund raising and reviewed regular reports and profit distribution plan, and presented the opinions.
standard for internal control of the Bank, conducted specific survey in respect of the implementation of the basic standard for internal control, reviewed analysis materials, interviewed with departments, conducted onsite surveys in several branches and drafted specific survey report and presented opinions and suggestions. Through attending meetings, listening to submissions, the board of supervisors conducted supervision over the establishment of implementation of internal control and the internal control assessment by the board of directors of the Bank, reviewed the assessment report of the internal control of the Bank and presented opinions in compliance with regulatory requirements.
regulated the internal operation, created new working methods, enhanced communication and discussion, organised business training and dedicatedly improved the overall supervision level. All members of the board of supervisors performed their duties in a diligent, legitimate and compliant manner, attended sessions of the board of supervisors, participated in the research, review and voting regarding relevant motions and topics. They attended the meetings of the Board and the senior management and reviewed and analysed financial reports and operation materials, consistently focused on the reform and development of the Bank as well as the operation of corporate governance, participated in the various supervision work and surveys organised by the board of supervisors and diligently fulfilled the obligations.

18 CHINA CONSTRUCTION BANK CORPORATION ANNUAL REPORT 201118 CHINA CONSTRUCTION BANK CORPORATIONCC ANNUAL REPORT 2011
Create higher value to our shareholders
The Bank attaches great importance to the return of shareholders, and constantly pays cash dividends to the shareholders. The Board recommends a cash dividend for 2011 of RMB0.2365 per share (including tax).
RMB169,439mNet profit
1.47%Return on average assets

19CHINA CONSTRUCTION BANK CORPORATION ANNUAL REPORT 2011 19CHINA CONSTRUCTION BANK CORPORATIONC ANNUAL REPORT 2011
RMB 0.2365Final cash dividend proposed after the reporting period

20 CHINA CONSTRUCTION BANK CORPORATION ANNUAL REPORT 2011
In 2011, the instability and uncertainty over the global economy recovery continues to increase. Recovery in some of the developed economies stagnated with fiscal and financial risks alternately rising, leading to further instability and uncertainty in the economy. Growth has generally slowed down in emerging economies, with some countries facing the challenges of curbing inflation and preventing large inflows and outflows of short-term cross-border capital, hence increasing the difficulty of macro-controls. Against gloomy growth prospects, the major developed economies adopted or maintained loose monetary policies. To cope with new uncertainties in the global economic recovery, there have been divergences in macroeconomic policies at the major emerging economies. According to the International Monetary Fund’s report, the global economy grew at 3.8% in 2011, a drop of 1.2 percentage points year-on-year.
The global economic situation remains complex and capricious, with the deeper impact of the global financial crisis continuing to appear. The domestic economic development also faces numerous new situations, new changes and new challenges. However, the inherent power behind the steady growth of China’s economy continues to be strong, and there is high possibility that the macro-economy will continue to maintain steady and relatively fast growth. In 2011, China’s GDP was RMB47.1 trillion, up 9.2% over 2010, while the consumer price index rose by 5.4% over the previous year.
In 2011, China’s economy experienced an orderly transition from policy-driven growth to self-sustained growth. The effect of prudent monetary policies appeared gradually, while monetary credit growth returned to normal levels, compatible with the stable and relatively fast economic growth. The PBC employed a combination of monetary policy tools in order to optimise liquidity management in the banking system, guide the steady re-adjustment of monetary credit growth, maintain a reasonable social financing size, and guide financial institutions to optimise credit structure, including raising the
benchmark deposit and lending interest rates three times, raising the statutory deposit reserve ratio six times, and lowering the statutory deposit reserve ratio once. China’s financial market operated soundly. Money market transactions were active, with the overall interest rates higher over the previous year. The bond market index moved upward amid fluctuations, alongside a steady expanding bond issuance size. Share market indices fell with declining share trading turnover. Foreign exchange market transactions were active with greater flexibility in RMB exchange rates. Growth in the total money supply slowed down. At the end of 2011, the outstanding broad money M2 rose by 13.6% to RMB85.2 trillion, and the narrow money M1 increased by 7.9% to RMB29.0 trillion. Loans made in RMB increased by 15.8% to RMB54.8 trillion year-on-year.
In line with China’s macroeconomic policies and financial business development trend, the Group firmly adhered to its customer-focused operating philosophy, expedited its business transformation, and continued to enhance its core competitiveness and value creation capability.
Statement of Comprehensive Income AnalysisIn 2011, the Group recorded profit before tax of RMB219,107 million, up 25.09% over 2010. Net profit was RMB169,439 million, up 25.48% over 2010. The rapid growth of profit before tax and net profit were brought about mainly by the following reasons. First, the net interest margin rose steadily and interest-bearing assets expanded moderately, pushing up net interest income by RMB53,072 million, or 21.10%, year-on-year; second, we were actively engaged in service and product innovation, and as a result, net fee and commission income continued to rise, with an increase of RMB20,862 million, or 31.55%, over 2010; third, operating expenses were controlled at a reasonable level, with the cost-to-income ratio decreasing by 1.06 percentage points over 2010 to 36.19%.

21CHINA CONSTRUCTION BANK CORPORATION ANNUAL REPORT 2011
(In millions of RMB, except percentages)Year ended
31 December 2011Year ended
31 December 2010 Change (%)
Net interest income 304,572 251,500 21.10
Net fee and commission income 86,994 66,132 31.55
Other operating income 7,837 8,148 (3.82)
Operating income 399,403 325,780 22.60
Operating expenses (144,537) (121,366) 19.09
Impairment losses (35,783) (29,292) 22.16
Share of profits less losses of associates and jointly controlled entities 24 34 (29.41)
Profit before tax 219,107 175,156 25.09
Income tax expense (49,668) (40,125) 23.78
Net profit 169,439 135,031 25.48
Other comprehensive income for the year, net of tax (1,918) (7,500) (74.43)
Total comprehensive income for the year 167,521 127,531 31.36
3 1
2
2011
Operating income Interest income
Net interestincome76.26%
Net fee and commission
income21.78%
Other operating income1.96%
From loans and advances to customers72.06%
From investments in debt securities
18.60%
From depositswith central banks
6.49%
From financial asset held under
resale agreements1.64%
From deposits and placements with banks and
non-bank financial institutions1.21%
in
ositsbanks resale ag
1.61
2
34 5
2011

22 CHINA CONSTRUCTION BANK CORPORATION ANNUAL REPORT 2011
MANAGEMENT DISCUSSION AND ANALYSIS
Net interest incomeIn 2011, the Group’s net interest income was RMB304,572 million, an increase of RMB53,072 million, or 21.10%, over the previous year. The net interest income accounted for 76.26% of the operating income.
The following table shows the Group’s average balances of assets and liabilities, related interest income or expense, and average yields or costs during the respective periods.
Year ended 31 December 2011 Year ended 31 December 2010
(In millions of RMB, except percentages)Average balance
Interest income/expense
Average yield/
cost (%)Average balance
Interest income/expense
Average yield/
cost (%)
Assets
Gross loans and advances to customers 6,108,983 347,520 5.69 5,268,333 267,006 5.07
Investments in debt securities 2,745,520 89,716 3.27 2,798,062 79,317 2.83
Deposits with central banks 2,030,564 31,282 1.54 1,530,883 23,226 1.52
Deposits and placements with banks and non-bank financial institutions 212,038 5,841 2.75 125,514 1,810 1.44
Financial assets held under resale agreements 195,695 7,888 4.03 382,047 6,424 1.68
Total interest-earning assets 11,292,800 482,247 4.27 10,104,839 377,783 3.74
Total allowances for impairment losses (164,389) (144,792)
Non-interest-earning assets 383,077 246,530
Total assets 11,511,488 482,247 10,206,577 377,783
Liabilities
Deposits from customers 9,442,374 151,972 1.61 8,482,558 108,199 1.28
Deposits and placements from banks and non-bank financial institutions 870,192 20,464 2.35 840,950 14,367 1.71
Financial assets sold under repurchase agreements 21,724 1,233 5.68 9,676 176 1.82
Debt securities issued 116,807 3,987 3.41 93,425 3,526 3.77
Other interest-bearing liabilities 1,704 19 1.12 674 15 2.23
Total interest-bearing liabilities 10,452,801 177,675 1.70 9,427,283 126,283 1.34
Non-interest-bearing liabilities 282,713 159,658
Total liabilities 10,735,514 177,675 9,586,941 126,283
Net interest income 304,572 251,500
Net interest spread 2.57 2.40
Net interest margin 2.70 2.49

23CHINA CONSTRUCTION BANK CORPORATION ANNUAL REPORT 2011
(In millions of RMB) Volume factor1 Interest rate factor1Change in interest
income/expense
Assets
Gross loans and advances to customers 45,582 34,932 80,514
Investment in debt securities (1,534) 11,933 10,399
Deposits with central banks 7,744 312 8,056
Deposits and placements with banks and non-bank financial institutions 1,738 2,293 4,031
Financial assets held under resale agreements (4,264) 5,728 1,464
Change in interest income 49,266 55,198 104,464
Liabilities
Deposits from customers 13,352 30,421 43,773
Deposits and placements from banks and non-bank financial institutions 518 5,579 6,097
Financial assets sold under repurchase agreements 391 666 1,057
Debt securities issued 821 (360) 461
Other interest-bearing liabilities 14 (10) 4
Change in interest expenses 15,096 36,296 51,392
Change in net interest income 34,170 18,902 53,072
1. Change caused by both average balances and average interest rates was allocated to volume factor and interest rate factor respectively based on the respective proportions of absolute values of volume factor and interest rate factor.
In 2011, the Group’s net interest spread and net interest margin were 2.57% and 2.70%, up 17 and 21 basis points respectively, year-on-year.
In 2011, the Group’s net interest margin picked up every quarter, largely due to the following reasons. First, loan yields improved steadily, as the pricing level was driven up by the tightening credit resources and the existing loans were repriced based on higher benchmark rates. Second, the yields of discounted bills, placements and financial assets held under resale agreements increased significantly, prompted by a rapid rise in market interest rates over the previous year
against the backdrop of the tight market funding situation. Third, bond yields maintained a stable growth trend, through moderately extending bond investment duration and increasing the proportion of credit bonds. The cost of deposits from customers increased due to repricing of existing deposits and increased proportion of time deposits, partially offsetting the effects of the above factors.
The following table shows the effects of the movement of the average balances and average interest rates of the Group’s assets and liabilities on the change in interest income or expense for 2011 versus 2010.
Net interest income increased by RMB53,072 million over the previous year, in which an increase of RMB34,170 million was due to the movement of average balances of assets and liabilities, and an increase of RMB18,902 million was due to
the movement of average yields or costs. The proportion of contribution of volume factor and interest rate factor to the increase in net interest income was 64.38% and 35.62% respectively.

24 CHINA CONSTRUCTION BANK CORPORATION ANNUAL REPORT 2011
MANAGEMENT DISCUSSION AND ANALYSIS
Interest incomeThe Group’s interest income in 2011 was RMB482,247 million, an increase of RMB104,464 million, or 27.65%, over 2010. In this amount, the proportion of interest income
from loans and advances to customers, investments in debt securities, deposits with central banks, deposits and placements with banks and non-bank financial institutions, financial assets held under resale agreements was 72.06%, 18.60%, 6.49%, 1.21% and 1.64% respectively.
Interest income from loans and advances to customers
The table below shows the average balance, interest income and average yield of each component of the Group’s loans and advances to customers.
Year ended 31 December 2011 Year ended 31 December 2010
(In millions of RMB, except percentages)Average balance
Interest income
Average yield (%)
Average balance
Interest income
Average yield (%)
Corporate loans and advances 4,235,536 251,367 5.93 3,685,105 196,614 5.34
Short-term loans 1,324,473 76,765 5.80 1,073,523 53,226 4.96
Medium to long-term loans 2,911,063 174,602 6.00 2,611,582 143,388 5.49
Personal loans and advances 1,542,583 82,998 5.38 1,241,639 59,929 4.83
Discounted bills 103,349 7,500 7.26 191,771 6,491 3.38
Overseas operations 227,515 5,655 2.49 149,818 3,972 2.65
Gross loans and advances to customers 6,108,983 347,520 5.69 5,268,333 267,006 5.07
Interest income from loans and advances to customers rose by RMB80,514 million, or 30.15%, year-on-year to RMB347,520 million, mainly because the average balance increased steadily by 15.96%, and the average yield increased by 62 basis points over the previous year. The average yield increased largely because of the following reasons. First, from the second half of 2010, the PBC increased benchmark lending rates five times, and the existing loans were repriced based on higher rates, leading to the steady increase in the yields of major loan products. Second, the tight funding situation created positive environment for the improvement in loan pricing, and the Group continued to strengthen the loan pricing management, leading to higher weighted interest rates of newly granted loans. Third, due to various factors including the rising money market interest rates and credit resources scarcity, the average yield of discounted bills rose substantially.
Interest income from investments in debt securities
Interest income from investments in debt securities grew by RMB10,399 million, or 13.11%, to RMB89,716 million over 2010, largely because the Bank seized the favourable opportunity presented by the rising interest rates to improve the duration and structure of RMB-denominated debt securities investments, which resulted in the increase in the average yield of investments in debt securities.
Interest income from deposits with central banks
Interest income from deposits with central banks amounted to RMB31,282 million, a year-on-year increase of RMB8,056 million, or 34.69%. This was mainly because the average balance of deposits with central banks rose by 32.64%, in line with increases in the statutory deposit reserve ratio and deposits from customers.
Interest income from deposits and placements with banks and non-bank financial institutions
Interest income from deposits and placements with banks and non-bank financial institutions grew by RMB4,031 million to RMB5,841 million over 2010. This was primarily due to the increase of 1.31 percentage points in average yield of deposits and placements with banks and non-bank financial institutions over the previous year as a result of the tight situation of market funding, and the increase of 68.94% in average balance of deposits and placements with banks and non-bank financial institutions.
Interest income from financial assets held under resale agreements
Interest income from financial assets held under resale agreements increased by RMB1,464 million, or 22.79%, year-on-year to RMB7,888 million. This mainly resulted from the sharp increase of 2.35 percentage points in average yield of financial assets held under resale agreements due to the rising market rates, partially offset by the decrease in the average balance.

25CHINA CONSTRUCTION BANK CORPORATION ANNUAL REPORT 2011
Interest expenseIn 2011, the Group’s interest expense was RMB177,675 million, a year-on-year increase of RMB51,392 million, or 40.70%.
Interest expense on deposits from customers
The table below shows the average balance, interest expense and average cost of each component of the Group’s deposits from customers.
Year ended 31 December 2011 Year ended 31 December 2010
(In millions of RMB, except percentages)Average balance
Interest expense
Average cost (%)
Average balance
Interest expense
Average cost (%)
Corporate deposits 5,081,199 75,863 1.49 4,559,265 51,834 1.14
Demand deposits 3,302,701 26,317 0.80 3,059,899 19,380 0.63
Time deposits 1,778,498 49,546 2.79 1,499,366 32,454 2.16
Personal deposits 4,233,097 74,537 1.76 3,835,609 55,519 1.45
Demand deposits 1,725,956 8,508 0.49 1,532,189 5,693 0.37
Time deposits 2,507,141 66,029 2.63 2,303,420 49,826 2.16
Overseas operations 128,078 1,572 1.23 87,684 846 0.96
Total deposits from customers 9,442,374 151,972 1.61 8,482,558 108,199 1.28
Interest expense on deposits from customers stood at RMB151,972 million, an increase of RMB43,773 million, or 40.46%, over 2010. This resulted mainly from the 11.32% increase in the average balance and the increase of 33 basis points in the average cost over the previous year. The average cost increased largely due to the following reasons. First, from the second half of 2010, the PBC consecutively increased benchmark rates. In 2011, in particular, the interest rate of demand deposits was raised twice. Second, due to lowered expectation of interest hikes, the proportion of time deposits continued to rise.
Interest expense on deposits and placements from banks and non-bank financial institutions
Interest expense on deposits and placements from banks and non-bank financial institutions reached RMB20,464 million, an
increase of RMB6,097 million, or 42.44%, over 2010, largely because the average cost of deposits from banks and non-bank financial institutions increased due to the influence of rising market rates.
Interest expense on financial assets sold under repurchase agreements
Interest expense on financial assets sold under repurchase agreements increased by RMB1,057 million year-on-year to RMB1,233 million. This was primarily because of a sharp rise in both the average balance and average cost of financial assets sold under repurchase agreements.

26 CHINA CONSTRUCTION BANK CORPORATION ANNUAL REPORT 2011
MANAGEMENT DISCUSSION AND ANALYSIS
Net fee and commission income
(In millions of RMB, except percentages)Year ended
31 December 2011Year ended
31 December 2010 Change (%)
Fee and commission income 89,494 68,156 31.31
Consultancy and advisory fees 17,488 12,816 36.45
Bank card fees 14,910 12,344 20.79
Agency service fees 14,210 12,115 17.29
Settlement and clearing fees 13,484 9,614 40.25
Wealth management fees 7,907 5,611 40.92
Commission on trust and fiduciary activities 7,732 6,720 15.06
Electronic banking fees 4,246 2,879 47.48
Guarantee handling fees 2,495 1,857 34.36
Credit commitment fees 2,369 1,605 47.60
Others 4,653 2,595 79.31
Fee and commission expenses (2,500) (2,024) 23.52
Net fee and commission income 86,994 66,132 31.55
The Group’s net fee and commission income rose by 31.55% to RMB86,994 million over 2010, while the ratio of net fee and commission income to operating income rose by 1.48 percentage points to 21.78%.
Consultancy and advisory fees increased by 36.45% to RMB17,488 million, accounting for the largest share of the net fee and commission income. The Group put special emphasis on various product and customer-focused products such as financial advisory services for M&A and restructuring. Our traditionally advantageous cost advisory business also grew steadily.
Bank card fees grew by 20.79% to RMB14,910 million, which was mainly because fees from credit cards increased by nearly 30%. As the Group made greater efforts on widening the personal customer base and exploring business potential, the number of cards issued and consumer spending per card reaped fast growth.
Agency service fees rose by 17.29% to RMB14,210 million. Agency service fees from customer-driven precious metals transactions doubled as the Group leveraged on its sales channel strength and continuously improved its product functions. Entrusted loans and entrusted provident fund housing finance business maintained steady growth. However, fees from fund agency services and insurance agency services decreased partly due to the gloomy stock market.
Settlement and clearing fees rose by 40.25% to RMB13,484 million. This was largely because of a marked increase in income from RMB-denominated corporate settlements due to the proactive release and promotion of products including the cash management system, all-in-one corporate account, real time cash pool, domestic letter of credit, and corporate settlement card, coupled with product innovation and service upgrade.
Wealth management fees increased by 40.92% to RMB7,907 million. With the increasing wealth management awareness of the general public, the sales of the Group’s multiple products based on customers’ various risk appetites and preferences were robust.
Commission on trust and fiduciary business rose by 15.06% to RMB7,732 million, showing signs of slower growth. This was mainly because fees from our custodial services for securities investment funds decreased amid the gloomy stock market.
Electronic banking fees grew by 47.48% to RMB4,246 million. This was mainly due to the domestic promotion of mobile phone banking and financial services through SMS by the Group, and the proactive expansion of online banking services scope, including agency payment and medical banking services. Meanwhile, through encouraging customers to use electronic banking services, the number of electronic banking customers exceeded 80 million.

27CHINA CONSTRUCTION BANK CORPORATION ANNUAL REPORT 2011
Net gain on trading activitiesNet gain on trading activities decreased by RMB3,121 million, or 88.94%, to RMB388 million, chiefly because of the sharp decrease in the fair value of financial assets at fair value through profit or loss held by subsidiaries.
Net gain on investment securitiesThe Group realised a net gain on investment securities of RMB1,756 million, a decrease of RMB147 million, or 7.72%,
over the previous year. This was mainly due to decreased capital gains as the sales of available-for-sale financial assets declined.
Other net operating incomeIn 2011, the Group reaped other net operating income of RMB5,535 million, including a net foreign exchange gain of RMB1,451 million, a net gain of RMB489 million on disposals of fixed assets, a net gain of RMB172 million on disposals of repossessed assets, and other income of RMB3,423 million.
Operating expenses
(In millions of RMB, except percentages)Year ended
31 December 2011Year ended
31 December 2010
Staff costs 71,388 61,409
Premises and equipment expenses 20,397 18,530
Business taxes and surcharges 24,229 18,364
Others 28,523 23,063
Total operating expenses 144,537 121,366
Cost-to-income ratio 36.19% 37.25%
In 2011, the Group continued to strengthen cost management and improve cost structure. The total operating expenses increased by RMB23,171 million, or 19.09%, year-on-year to RMB144,537 million, while the cost-to-income ratio fell by 1.06 percentage points to 36.19% over 2010.
Staff costs rose by RMB9,979 million, or 16.25%, year-on-year to RMB71,388 million. Premises and equipment expenses rose by RMB1,867 mill ion, or 10.08%, to
RMB20,397 million. Business taxes and surcharges were RMB24,229 million, up RMB5,865 million, or 31.94%, in line with higher taxable income. The Group’s other operating expenses increased by RMB5,460 million, or 23.67%, to RMB28,523 million, mainly because the Group increased its marketing efforts to support business development with increased marketing expenses such as entertainment expenses and promotion expenses.

28 CHINA CONSTRUCTION BANK CORPORATION ANNUAL REPORT 2011
MANAGEMENT DISCUSSION AND ANALYSIS
Impairment losses
(In millions of RMB)Year ended
31 December 2011Year ended
31 December 2010
Loans and advances to customers 32,403 25,641
Investments 1,610 1,460
Available-for-sale financial assets 1,130 1,817
Held-to-maturity investments (15) (381)
Debt securities classified as receivables 495 24
Fixed assets 1 2
Others 1,769 2,189
Total impairment losses 35,783 29,292
In 2011, total impairment losses were RMB35,783 million, an increase of RMB6,491 million or 22.16%, over 2010. In this amount, impairment losses on loans and advances to customers were RMB32,403 million, an increase of RMB6,762 million. Impairment losses on investments were RMB1,610 million, mainly on certain available-for-sale debt securities. Other impairment losses were RMB1,769 million, mainly on certain off-balance sheet business items.
Income tax expenseIn 2011, the Group’s income tax expense reached RMB49,668 million, an increase of RMB9,543 million, or 23.78%, over 2010. The Group’s effective income tax rate
was 22.67%, lower than the 25% statutory rate, largely because the interest income from the PRC government bonds held by the Group was non-taxable in accordance with tax regulations. Income tax expense details are set out in the Note “Income Tax Expense” of the “Financial Statements” in this report.
Other comprehensive incomeIn 2011, the Group recorded a negative value of RMB1,918 million in other comprehensive income, mainly resulting from a fall in the fair value of available-for-sale equity instruments, partially offset by the rise in the fair value of available-for-sale debt securities.

29CHINA CONSTRUCTION BANK CORPORATION ANNUAL REPORT 2011
Statement of Financial Position AnalysisAssetsThe following table shows the composition of the Group’s total assets as at the dates indicated.
As at 31 December 2011 As at 31 December 2010
(In millions of RMB, except percentages) Amount % of total Amount % of total
Gross loans and advances to customers 6,496,411 5,669,128
Allowances for impairment losses on loans (171,217) (143,102)
Net loans and advances to customers 6,325,194 51.50 5,526,026 51.12
Investments1 2,741,750 22.32 2,904,997 26.87
Cash and deposits with central banks 2,379,809 19.38 1,848,029 17.09
Deposits and placements with banks and non-bank financial institutions 385,792 3.14 142,280 1.32
Financial assets held under resale agreements 200,045 1.63 181,075 1.68
Interest receivable 56,776 0.46 44,088 0.41
Other assets2 192,468 1.57 163,822 1.51
Total assets 12,281,834 100.00 10,810,317 100.00
1. These comprise financial assets at fair value through profit or loss, available-for-sale financial assets, held-to-maturity investments, and debt securities classified as receivables.2. These comprise precious metals, positive fair value of derivatives, investments in associate and jointly controlled entities, fixed assets, land use rights, intangible assets, goodwill, deferred
tax assets and other assets.
As at 31 December 2011, the Group’s total assets stood at RMB12,281,834 million, a rise of RMB1,471,517 million, or 13.61%, over 2010. This was mainly due to increases in loans and advances to customers, cash and deposits with central banks, and deposits and placements with banks and non-bank financial institutions. Net loans and advances to customers accounted for 51.50% of total assets, an increase of 0.38 percentage points over 2010. Cash and deposits with central
banks accounted for 19.38% of total assets, an increase of 2.29 percentage points over 2010. Deposits and placements with banks and non-bank financial institutions accounted for 3.14% of total assets, an increase of 1.82 percentage points. Investments decreased by 4.55 percentage points, accounting for 22.32% of total assets. Financial assets held under resale agreements decreased by 0.05 percentage points, accounting for 1.63% of total assets.

30 CHINA CONSTRUCTION BANK CORPORATION ANNUAL REPORT 2011
MANAGEMENT DISCUSSION AND ANALYSIS
Loans and advances to customers
As at 31 December 2011 As at 31 December 2010
(In millions of RMB, except percentages) Amount % of total Amount % of total
Corporate loans and advances 4,446,168 68.44 3,976,865 70.15
Short-term loans 1,384,456 21.31 1,160,747 20.47
Medium to long-term loans 3,061,712 47.13 2,816,118 49.68
Personal loans and advances 1,683,855 25.92 1,368,811 24.15
Residential mortgage loans 1,317,444 20.28 1,091,116 19.25
Personal consumer loans 76,788 1.18 78,881 1.39
Personal business loans 80,075 1.23 48,658 0.86
Other loans1 209,548 3.23 150,156 2.65
Discounted bills 111,271 1.71 142,835 2.52
Overseas operations 255,117 3.93 180,617 3.18
Gross loans and advances to customers 6,496,411 100.00 5,669,128 100.00
1. These comprise individual commercial property mortgage loans, home equity loans, credit card loans and education loans.
As at 31 December 2011, the Group’s gross loans and advances to customers rose by RMB827,283 million, or 14.59%, over 2010, to RMB6,496,411 million.
Domestic corporate loans reached RMB4,446,168 million, an increase of RMB469,303 million, or 11.80%, over 2010. In this amount, infrastructure loans rose by RMB194,362 million, or 10.98%, to RMB1,964,806 million, mainly targeting quality infrastructure projects. Small business loans increased by 24.60% to RMB913,758 million, 12.80 percentage points higher than corporate loan growth.
The Group continued to reinforce credit structure adjustment. In response to the latest changes to the real estate market, the Group took the initiative to control property development loans, which grew by only 0.16% year-on-year, much lower compared to the 11.80% corporate loan growth. In addition, the Group continued to improve its customer base, with new loans principally targeting prime customers with solid financial strengths and high business qualifications in regions where property prices were stable. The Group also focused on extending loans to state-backed residential projects including ordinary residential and affordable housing projects. The balance of corporate loans under the “exit” category decreased by RMB103,500 million over 2010.
Furthermore, loan balance of “6+1” industries with excess capacity dropped by RMB1,607 million, in line with the state’s macroeconomic control measures.
Domestic personal loans increased by RMB315,044 million, or 23.02%, over 2010, to RMB1,683,855 million, which accounted for 25.92% of the gross loans and advances to customers, up 1.77 percentage points. In this amount, residential mortgage loans rose by RMB226,328 million, or 20.74%, to RMB1,317,444 million, mainly to support the financing needs for self-occupied home purchases; personal consumer loans were RMB76,788 million, a slight decrease of 2.65% over 2010; personal business loans increased by RMB31,417 million, or 64.57%, to RMB80,075 million; other loans rose by RMB59,392 million, or 39.55%, mainly due to the rapid growth of credit card loans.
Discounted bil ls declined by RMB31,564 mil l ion to RMB111,271 million year-on-year, and were chiefly used to meet the short-term financing needs of targeted prime customers.
Loans and advances to overseas customers rose by RMB74,500 million, or 41.25%, over 2010, to RMB255,117 million, which was largely attributable to the rapid loan increase in Hong Kong and other regions.
31CHINA CONSTRUCTION BANK CORPORATION ANNUAL REPORT 2011
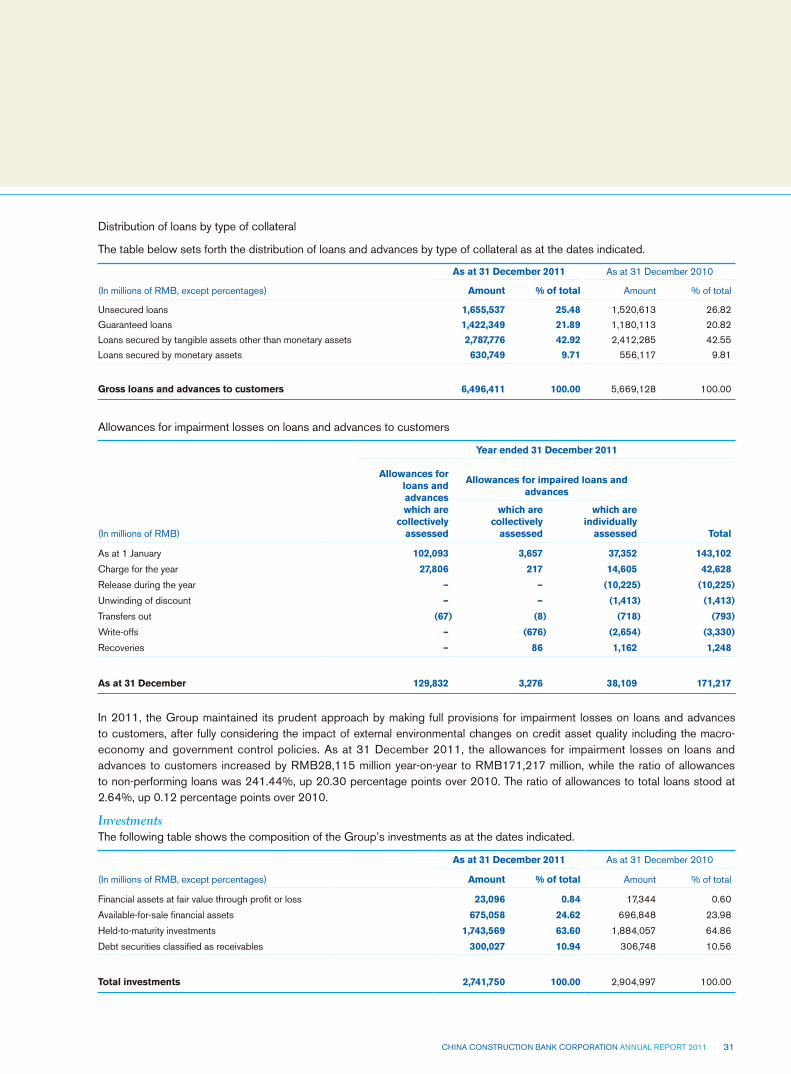
Distribution of loans by type of collateral
The table below sets forth the distribution of loans and advances by type of collateral as at the dates indicated.
As at 31 December 2011 As at 31 December 2010
(In millions of RMB, except percentages) Amount % of total Amount % of total
Unsecured loans 1,655,537 25.48 1,520,613 26.82
Guaranteed loans 1,422,349 21.89 1,180,113 20.82
Loans secured by tangible assets other than monetary assets 2,787,776 42.92 2,412,285 42.55
Loans secured by monetary assets 630,749 9.71 556,117 9.81
Gross loans and advances to customers 6,496,411 100.00 5,669,128 100.00
Allowances for impairment losses on loans and advances to customers
(In millions of RMB)
Year ended 31 December 2011
Allowances for loans and advances which are
collectively assessed
Allowances for impaired loans andadvances
Total
which are collectively
assessed
which are individually
assessed
As at 1 January 102,093 3,657 37,352 143,102
Charge for the year 27,806 217 14,605 42,628
Release during the year – – (10,225) (10,225)
Unwinding of discount – – (1,413) (1,413)
Transfers out (67) (8) (718) (793)
Write-offs – (676) (2,654) (3,330)
Recoveries – 86 1,162 1,248
As at 31 December 129,832 3,276 38,109 171,217
In 2011, the Group maintained its prudent approach by making full provisions for impairment losses on loans and advances to customers, after fully considering the impact of external environmental changes on credit asset quality including the macro-economy and government control policies. As at 31 December 2011, the allowances for impairment losses on loans and advances to customers increased by RMB28,115 million year-on-year to RMB171,217 million, while the ratio of allowances to non-performing loans was 241.44%, up 20.30 percentage points over 2010. The ratio of allowances to total loans stood at 2.64%, up 0.12 percentage points over 2010.
InvestmentsThe following table shows the composition of the Group’s investments as at the dates indicated.
As at 31 December 2011 As at 31 December 2010
(In millions of RMB, except percentages) Amount % of total Amount % of total
Financial assets at fair value through profit or loss 23,096 0.84 17,344 0.60
Available-for-sale financial assets 675,058 24.62 696,848 23.98
Held-to-maturity investments 1,743,569 63.60 1,884,057 64.86
Debt securities classified as receivables 300,027 10.94 306,748 10.56
Total investments 2,741,750 100.00 2,904,997 100.00

32 CHINA CONSTRUCTION BANK CORPORATION ANNUAL REPORT 2011
MANAGEMENT DISCUSSION AND ANALYSIS
As at 31 December 2011, total investments decreased by RMB163,247 million, or 5.62%, over 2010 to RMB2,741,750 million. In this amount, available-for-sale financial assets, held-to-maturity investments, and debt securities classified as receivables decreased by RMB21,790 million, RMB140,488 million and RMB6,721 million respectively.
The following table sets forth the composition of the Group’s investments by nature as at the dates indicated.
As at 31 December 2011 As at 31 December 2010
(In millions of RMB, except percentages) Amount % of total Amount % of total
Debt securities investments 2,719,007 99.17 2,875,505 98.98
Equity instruments 22,451 0.82 28,971 1.00
Funds 292 0.01 521 0.02
Total investments 2,741,750 100.00 2,904,997 100.00
Debt securities investments
The following table sets forth the composition of the Group’s debt securities investments by currency as at the dates indicated.
As at 31 December 2011 As at 31 December 2010
(In millions of RMB, except percentages) Amount % of total Amount % of total
RMB 2,667,800 98.12 2,814,711 97.89
USD 27,885 1.02 35,262 1.22
HKD 8,638 0.32 16,401 0.57
Other foreign currencies 14,684 0.54 9,131 0.32
Total debt securities investments 2,719,007 100.00 2,875,505 100.00
As at 31 December 2011, debt securities investments of the Group decreased by RMB156,498 or 5.44%, over 2010, to RMB2,719,007 million. In this amount, RMB-denominated debt securities investments were RMB2,667,800 million, a decrease of RMB146,911 million or 5.22% year-on-year, largely due to the proactive reduction of investment scale to maintain ample liquidity amid the backdrop of tightening monetary policy. The carrying amount of foreign currency debt securities investment portfolio totalled US$8,135 million (or RMB51,207 million), a decrease of US$1,091 million, or 11.83%, over 2010. This was mainly because the Group reduced the high-risk debt securities as appropriate in response to the changes of global financial market environment.
As at 31 December 2011, the carrying amount of US sub-prime mortgage loan backed securities held by the Group was US$87 million (or RMB546 million), accounting for 1.07% of
the foreign currency debt securities investment portfolio. The carrying amount of the Alt-A bonds held by the Group was US$173 million (or RMB1,088 million), accounting for 2.12% of the foreign currency debt securities investment portfolio.
As at 31 December 2011, the carrying amount of debt securities issued by Spanish government and institutions held by the Group was US$13 million (or RMB82 million), accounting for 0.16% of the foreign currency debt securities investment portfolio. The above debt securities matured at the end of January 2012. The Group does not hold any debt securities issued by the governments and institutions of Greece, Portugal and Italy.
As foreign currency debt securities represent only a very small proportion of the Group’s total assets, market value fluctuations for such debt securities will not have a significant effect on earnings.

33CHINA CONSTRUCTION BANK CORPORATION ANNUAL REPORT 2011
The following table sets forth the composition of the Group’s debt securities investments by issuer as at the dates indicated.
As at 31 December 2011 As at 31 December 2010
(In millions of RMB, except percentages) Amount % of total Amount % of total
Government 901,187 33.14 811,493 28.22
Central banks 435,726 16.02 954,800 33.20
Policy banks 285,767 10.51 183,904 6.40
Banks and non-bank financial institutions 712,053 26.19 542,664 18.87
Public sector entities 196 0.01 1,587 0.06
Cinda 131,761 4.85 206,261 7.17
Other enterprises 252,317 9.28 174,796 6.08
Total debt securities investments 2,719,007 100.00 2,875,505 100.00
The Group maintained its prudent investment and trading philosophy, and proactively adjusted its operational strategy by balancing risks and returns, and ensuring liquidity safety. As at 31 December 2011, government debt securities were RMB901,187 million, an increase of RMB89,694 million or 11.05%, over 2010. Debt securities issued by policy banks increased by RMB101,863 million, or 55.39%, over 2010 to RMB285,767 million. Debt securities issued by banks and non-bank financial institutions increased by RMB169,389 million or 31.21%, over 2010 to RMB712,053 million. Debt securities issued by central banks decreased by RMB519,074
million, or 54.36% over 2010 to RMB435,726 million. Cinda debt securities decreased by RMB74,500 million over 2010 to RMB131,761 million, as part of the principal was repaid to the Bank.
Interest receivableAs at 31 December 2011, the Group’s interest receivable was RMB56,776 million, an increase of RMB12,688 million, or 28.78%, over 2010. This was mainly due to the combination effect of the PBC’s three hikes of interest rates in 2011 and the loan growth.
LiabilitiesThe following table shows the composition of the Group’s total liabilities as at the dates indicated.
As at 31 December 2011 As at 31 December 2010
(In millions of RMB, except percentages) Amount % of total Amount % of total
Deposits from customers 9,987,450 87.11 9,075,369 89.77
Deposits and placements from banks and non-bank financial institutions 1,044,954 9.11 749,809 7.42
Financial assets sold under repurchase agreements 10,461 0.09 4,922 0.05
Debt securities issued 168,312 1.47 93,315 0.92
Others1 253,996 2.22 185,997 1.84
Total liabilities 11,465,173 100.00 10,109,412 100.00
1. These comprise borrowings from central banks, financial liabilities at fair value through profit or loss, negative fair value of derivatives, accrued staff costs, taxes payable, interest payable, provisions, deferred tax liabilities and other liabilities.
As at 31 December 2011, the Group’s total liabilities were RMB11,465,173 million, an increase of RMB1,355,761 million, or 13.41%, over 2010. In this amount, deposits from customers accounted for 87.11% of total liabilities, a decrease of 2.66 percentage points over 2010. Deposits and placements from banks and non-bank financial institutions increased by RMB295,145 million, or 39.36%, accounting
for 9.11% of total liabilities, representing an increase of 1.69 percentage points over 2010. Debt securities issued increased by RMB74,997 million over 2010, mainly because the Bank issued subordinated debt securities of RMB40 billion and the overseas branches and CCB Asia issued more certificates of deposit.

34 CHINA CONSTRUCTION BANK CORPORATION ANNUAL REPORT 2011
MANAGEMENT DISCUSSION AND ANALYSIS
Deposits from customersThe following table sets forth the Group’s deposits from customers by product type as at the dates indicated.
As at 31 December 2011 As at 31 December 2010
(In millions of RMB, except percentages) Amount % of total Amount % of total
Corporate deposits 5,415,019 54.22 4,948,152 54.52
Demand deposits 3,495,094 35.00 3,368,425 37.12
Time deposits 1,919,925 19.22 1,579,727 17.41
Personal deposits 4,419,398 44.25 4,022,813 44.33
Demand deposits 1,829,861 18.32 1,714,952 18.90
Time deposits 2,589,537 25.93 2,307,861 25.43
Overseas operations 153,033 1.53 104,404 1.15
Total deposits from customers 9,987,450 100.00 9,075,369 100.00
As at 31 December 2011, the Group’s total deposits from customers reached RMB9,987,450 million, an increase of RMB912,081 million, or 10.05%, year-on-year. Domestic time deposits increased by RMB621,874 million, or 16.00%,
higher than the 4.75% growth in demand deposits, and accounted for 45.15% of total deposits from customers, an increase of 2.31 percentage points over 2010.
Shareholders’ Equity
(In millions of RMB)As at
31 December 2011As at
31 December 2010
Share capital 250,011 250,011
Capital reserve 135,178 135,136
Investment revaluation reserve 6,383 6,706
Surplus reserve 67,576 50,681
General reserve 67,342 61,347
Retained earnings 289,266 195,950
Exchange reserve (4,615) (3,039)
Total equity attributable to equity shareholders of the Bank 811,141 696,792
Non-controlling interests 5,520 4,113
Total equity 816,661 700,905
As at 31 December 2011, the Group’s total equity reached RMB816,661 million, an increase of RMB115,756 million year-on-year. The ratio of total equity to total assets for the
Group was 6.65%, up 0.17 percentage points compared to 2010. The daily average loan-to-deposit ratio for 2011 was 64.70%, up 2.59 percentage points over 2010.

35CHINA CONSTRUCTION BANK CORPORATION ANNUAL REPORT 2011
Capital Adequacy RatioThe following table sets forth the information related to the Group’s capital adequacy ratio as at the dates indicated.
(In millions of RMB, except percentages)As at
31 December 2011As at
31 December 2010
Core capital adequacy ratio1 10.97% 10.40%
Capital adequacy ratio2 13.68% 12.68%
Components of capital base
Core capital:
Share capital 250,011 250,011
Capital reserve, investment revaluation reserve and exchange reserve4 130,562 127,536
Surplus reserve and general reserve 134,918 112,028
Retained earnings3, 4 229,649 140,995
Non-controlling interests 5,520 4,113
750,660 634,683
Supplementary capital:
General provision for doubtful debts 66,180 57,359
Positive changes in fair value of financial instruments at fair value through profit or loss 3,675 7,547
Subordinated bonds issued 120,000 80,000
189,855 144,906
Total capital base before deductions 940,515 779,589
Deductions:
Goodwill (1,662) (1,534)
Unconsolidated equity investments (12,402) (13,695)
Others5 (1,945) (1,911)
Net capital 924,506 762,449
Risk-weighted assets6 6,760,117 6,015,329
1. Core capital adequacy ratio is calculated by dividing the net amount of core capital, which is after deductions of 100% of goodwill and 50% of unconsolidated equity investments and other items, by risk-weighted assets.
2. Capital adequacy ratio is calculated by dividing the net capital by risk-weighted assets.3. The dividend proposed after the balance sheet date has been deducted from retained earnings.4. The investment revaluation reserve arising from the accumulated net positive changes in the fair value of available-for-sale financial assets is excluded from the core capital, and 50% of the
balance is included in the supplementary capital. In addition, the unrealised accumulated net positive changes in fair value of financial instruments at fair value through profit or loss, net of income tax, are excluded from the core capital and included in the supplementary capital.
5. Others mainly represent investments in those asset backed securities which required reduction as specified by the CBRC.6. The balance of risk-weighted assets includes an amount equal to 12.5 times the Group’s market risk capital.

36 CHINA CONSTRUCTION BANK CORPORATION ANNUAL REPORT 2011
MANAGEMENT DISCUSSION AND ANALYSIS
The Group calculates its capital adequacy ratio in accordance with the Administration Measures for Capital Adequacy Ratios of Commercial Banks and related regulations promulgated by the CBRC. As at 31 December 2011, the Group’s capital adequacy ratio was 13.68% and the core capital adequacy ratio was 10.97%, up 1.00 and 0.57 percentage points respectively over 2010, largely due to the following reasons. First, the increase in profits pushed the growth rate of core capital to outrun that of risk-weighted assets. Second, the proposed dividend payout ratio decreased from the previous year, and retained earnings increased as a result. Third, in November 2011, the issuance of RMB40 billion subordinated debt securities has consolidated the capital base. Fourth, the Group strengthened optimisation and adjustments to its business structure and management of its off-balance sheet businesses, leading to less use of capital.
Analysis of Off-Balance Sheet ItemsThe Group’s off-balance sheet items include derivatives, commitments and contingent liabilities. Derivatives include
interest rate contracts, exchange rate contracts, precious metal contracts, equity instrument contracts and credit risk mitigation contracts. Please refer to Note “Derivatives” in the “Financial Statements” of this annual report for details on the nominal amounts and fair value of derivatives. Commitments and contingent liabilities include credit commitments, operating lease commitments, capital commitments, underwr i t ing obl igat ions , redempt ion obl igat ions , outstanding litigation and disputes. Among these, credit commitments were the largest component, with an amount of RMB1,981,949 million as at 31 December 2011, a decrease of RMB53,871 million over 2010. Its credit risk-weighted amount was RMB929,681 million, a decrease of RMB25,025 million from the previous year, largely because the Group strengthened off-balance sheet business management, by imposing reasonable controls on the growth of off-balance sheet assets and clearing out ineffective risk assets. Please refer to Note “Commitments and Contingent Liabilities” in the “Financial Statements” of this annual report for details on commitments and contingent liabilities.
Loan Quality AnalysisDistribution of Loans by the Five-Category ClassificationThe following table sets forth, as at the dates indicated, the distribution of the Group’s loans by the five-category loan classification under which NPLs include substandard, doubtful and loss categories.
As at 31 December 2011 As at 31 December 2010
(In millions of RMB, except percentages) Amount % of total Amount % of total
Normal 6,227,770 95.87 5,405,694 95.35
Special mention 197,726 3.04 198,722 3.51
Substandard 38,974 0.60 28,718 0.51
Doubtful 23,075 0.35 28,923 0.51
Loss 8,866 0.14 7,071 0.12
Gross loans and advances to customers 6,496,411 100.00 5,669,128 100.00
Non-performing loans 70,915 64,712
Non-performing loan ratio 1.09 1.14
In 2011, the Group stepped up credit structure adjustments, strengthened comprehensive post-lending management and surveillance of potential risk areas to prevent and mitigate associated risks, and expedited NPL disposal. Credit asset quality continued to be stable. As at 31 December 2011,
the Group’s NPLs were RMB70,915 million, an increase of RMB6,203 million from 2010, while the NPL ratio dropped by 0.05 percentage points to 1.09%. The proportion of special mention loans slid to 3.04%, 0.47 percentage points lower from 2010.

37CHINA CONSTRUCTION BANK CORPORATION ANNUAL REPORT 2011
Distribution of Loans and NPLs by Product TypeThe following table sets forth loans and NPLs by product type as at the dates indicated.
As at 31 December 2011 As at 31 December 2010
(In millions of RMB, except percentages) Loans NPLs NPL ratio (%) Loans NPLs NPL ratio (%)
Corporate loans and advances 4,446,168 63,758 1.43 3,976,865 56,090 1.41
Short-term loans 1,384,456 24,969 1.80 1,160,747 22,373 1.93
Medium to long-term loans 3,061,712 38,789 1.27 2,816,118 33,717 1.20
Personal loans and advances 1,683,855 5,179 0.31 1,368,811 5,920 0.43
Residential mortgage loans 1,317,444 2,631 0.20 1,091,116 2,966 0.27
Personal consumer loans 76,788 797 1.04 78,881 962 1.22
Personal business loans 80,075 198 0.25 48,658 189 0.39
Other loans 209,548 1,553 0.74 150,156 1,803 1.20
Discounted bills 111,271 – – 142,835 – –
Overseas operations 255,117 1,978 0.78 180,617 2,702 1.50
Total 6,496,411 70,915 1.09 5,669,128 64,712 1.14
As at 31 December 2011, the NPL ratio for corporate loans increased by 0.02 percentage points year-on-year to 1.43%, and that for personal loans was 0.31%, 0.12 percentage points lower than in 2010. By launching a yearlong risk
management campaign for overseas business, the Group strengthened overseas risk management, and speeded up the mitigation of significant risk exposures, leading to lower NPLs at overseas operations.

38 CHINA CONSTRUCTION BANK CORPORATION ANNUAL REPORT 2011
MANAGEMENT DISCUSSION AND ANALYSIS
Distribution of Loans and NPLs by IndustryThe following table sets forth the loans and NPLs by industry as at the dates indicated.
As at 31 December 2011 As at 31 December 2010
(In millions of RMB, except percentages) Loans % of total NPLs NPL ratio (%) Loans % of total NPLs NPL ratio (%)
Corporate loans 4,446,168 68.44 63,758 1.43 3,976,865 70.15 56,090 1.41
Manufacturing 1,098,890 16.92 25,577 2.33 978,816 17.27 22,193 2.27
Transportation, storage and postal services 753,565 11.60 7,104 0.94 647,332 11.42 6,219 0.96
Production and supply of electric power, gas and water 579,127 8.91 3,929 0.68 518,327 9.14 4,424 0.85
Real estate 432,775 6.66 8,005 1.85 402,922 7.11 6,624 1.64
Leasing and commercial services 383,397 5.90 3,369 0.88 359,612 6.34 1,997 0.56
– Commercial services 373,145 5.74 3,347 0.90 353,326 6.23 1,979 0.56
Wholesale and retail trade 267,539 4.12 6,811 2.55 214,800 3.79 5,080 2.36
Water, environment and public utilities management 226,561 3.49 1,065 0.47 216,168 3.81 1,909 0.88
Construction 188,341 2.90 1,908 1.01 149,676 2.64 1,799 1.20
Mining 167,474 2.58 599 0.36 143,432 2.53 769 0.54
– Exploitation of petroleum and natural gas 15,400 0.24 39 0.25 13,422 0.24 41 0.31
Education 85,016 1.31 734 0.86 100,050 1.76 1,219 1.22
Telecommunications, computer services and software 21,621 0.33 783 3.62 25,686 0.45 795 3.10
– Telecommunications and other information transmission services 17,008 0.26 155 0.91 21,869 0.39 92 0.42
Others 241,862 3.72 3,874 1.60 220,044 3.89 3,062 1.39
Personal loans 1,683,855 25.92 5,179 0.31 1,368,811 24.15 5,920 0.43
Discounted bills 111,271 1.71 – – 142,835 2.52 – –
Overseas operations 255,117 3.93 1,978 0.78 180,617 3.18 2,702 1.50
Total 6,496,411 100.00 70,915 1.09 5,669,128 100.00 64,712 1.14
In 2011, in line with the 12th Five-Year Plan and changes in other external policies, the Group made timely adjustment to its credit policies and further improved its credit structural adjustment plan, and refined its risk criteria in customer selection. It adhered to the limit management for various industries, and steadily promoted credit structural adjustments. Based on the changes in macroeconomic situation, the Group took initiative to strengthen surveillance in key risk areas. The NPL ratios for industries such as manufacturing, wholesale and retail trade and real estate increased as affected by macroeconomic fluctuations, and the asset quality base was further consolidated through early detection of risks and early disposal.

39CHINA CONSTRUCTION BANK CORPORATION ANNUAL REPORT 2011
Rescheduled Loans and Advances to CustomersThe following table sets forth the Group’s rescheduled loans and advances to customers as at the dates indicated.
As at 31 December 2011 As at 31 December 2010
(In millions of RMB, except percentages) Amount% of gross loans
and advances Amount% of gross loans
and advances
Rescheduled loans and advances to customers 2,692 0.04 2,070 0.04
Overdue Loans and Advances to CustomersThe following table sets forth the Group’s overdue loans and advances to customers by overdue period as at the dates indicated.
As at 31 December 2011 As at 31 December 2010
(In millions of RMB, except percentages) Amount% of gross loans
and advances Amount% of gross loans
and advances
Overdue for no more than 3 months 21,815 0.34 18,607 0.33
Overdue for 3 months to 1 year 9,739 0.15 6,595 0.12
Overdue for 1 to 3 years 11,885 0.18 19,066 0.34
Overdue for over 3 years 13,553 0.21 11,987 0.20
Total overdue loans and advances to customers 56,992 0.88 56,255 0.99
Significant Accounting Estimates and JudgementsThe preparation of financial statements requires management to make judgements, estimates and assumptions that affect the application of accounting policies and the reported amounts of assets and liabilities, income and expenses. Actual results may differ from these estimates. The estimates and associated assumptions are reviewed on an ongoing basis. Revisions to accounting estimates are recognised in the period in which the estimates are revised and in any future periods affected. The major areas affected by the estimates and judgements include: impairment losses on loans and advances to customers, available-for-sale debt securities and held-to-maturity investments, impairment of available-for-
sale equity instruments, fair value of financial instruments, reclassification of held-to-maturity investments, and income taxes. Please refer to Note “Significant Accounting Policies and Estimates” in the “Financial Statements” of this annual report.
Differences between the Financial Statements Prepared under PRC GAAP and those Prepared under IFRSThere is no difference in the net profit for the year ended 31 December 2011 or total equity as at 31 December 2011 between the Group’s consolidated financial statements prepared under PRC GAAP and those prepared under IFRS.

40 CHINA CONSTRUCTION BANK CORPORATION ANNUAL REPORT 2011
MANAGEMENT DISCUSSION AND ANALYSIS
Profit before tax from corporate banking segment increased by 21.80% over the previous year to RMB111,041 million, accounting for 50.68% of the Group’s profit before tax as the Group’s primary profit source.

41CHINA CONSTRUCTION BANK CORPORATION ANNUAL REPORT 2011
The Group’s major business segments are corporate banking, personal banking, treasury business, and others including equity investments and overseas operations.
The following table sets forth, in the periods indicated, the profit before tax of each major business segment:
Year ended 31 December 2011 Year ended 31 December 2010
(In millions of RMB, except percentages) Amount % of total Amount % of total
Corporate banking 111,041 50.68 91,167 52.05
Personal banking 37,627 17.17 30,590 17.46
Treasury business 71,059 32.43 51,198 29.23
Others (620) (0.28) 2,201 1.26
Profit before tax 219,107 100.00 175,156 100.00

42 CHINA CONSTRUCTION BANK CORPORATION ANNUAL REPORT 2011
MANAGEMENT DISCUSSION AND ANALYSIS
Profit before tax from corporate banking segment increased by 21.80% over the previous year to RMB111,041 million, accounting for 50.68% of the Group’s profit before tax as the Group’s primary profit source. Operating income rose by RMB34,480 million over the previous year. In this amount, net interest income from corporate banking increased by RMB23,837 million over the previous year, as a result of the growth of corporate loans and the increase in net interest margin; net fee and commission income rose by RMB10,607 million, or 37.14%, benefiting from the rising income from products such as corporate settlement, domestic factoring
and international settlement. Operating expenses grew by 19.68%, due to fast business growth and greater marketing efforts. Impairment losses increased by 20.10% over the previous year, as a result of the corporate loan growth and more prudent provisioning policy adopted by the Group.
Corporate loans were granted in a sound manner with enhanced quality. The Group’s corporate loans and advances totalled RMB4,446,168 million, an increase of 11.80% over the previous year. Discounted bills totalled RMB111,271 million, a decrease of RMB31,564 million over the previous year. Differentiated credit policies were adopted, which
Corporate BankingThe following table sets forth the major operating information and changes related to corporate banking:
(In millions of RMB, except percentages)Year ended
31 December 2011Year ended
31 December 2010 Change (%)
Net interest income 159,396 135,559 17.58
Net fee and commission income 39,170 28,563 37.14
Other operating income 789 753 4.78
Operating income 199,355 164,875 20.91
Operating expenses (60,023) (50,151) 19.68
Impairment losses (28,291) (23,557) 20.10
Profit before tax 111,041 91,167 21.80
As at 31 December 2011
As at 31 December 2010
Segment assets 4,643,350 4,343,277 6.91
The ongoing Kunming City Light Trail project

43CHINA CONSTRUCTION BANK CORPORATION ANNUAL REPORT 2011
supported certain areas and controlled others, in compliance with the government’s macroeconomic control policies. The Group focused on meeting the needs of its strength areas and strategic businesses including infrastructure sectors, small enterprises, internet merchant business, domestic factoring, businesses related to “agriculture, farmers and rural areas”, and indemnificatory housing construction. In addition, the Group continued to strengthen internal control management, and the corporate loan quality remained stable with an NPL ratio of 1.43%.
Lending to industries with excess capacity and government financing vehicles were under effective control and scrutiny . Loans to the “6+1” industries with excess capacity, including iron and steel, cement, coal chemical industries, plate glass, wind power equipment, polysilicon as well as the shipbuilding sector, decreased by RMB1,607 mill ion from 2010. Regulatory requirements in respect of lending to government financing vehicles were stringently complied with, including greater efforts in rectifications of contracts, restructuring of collaterals, and supplementation of cash flows. In addition, credit approval of lending to government financing vehicles was restricted to the head office. Customer identification marks were also made in the IT system for continuous tracking and monitoring of customers of government financing vehicles. Customers with inadequate cash flows and fiscal support at lower level were included in the exit plan for the year. Lastly, capital constraints on the lending to government financing vehicles were tightened. At the end of 2011, loans to government financing vehicles were RMB429,764 million,
which decreased by RMB112,160 million from 2010, with full cash flow coverage accounting for 85.69% of such loans. The number of government financing vehicle customers dropped to 924, a decrease of 158 from 2010.
The growth of property development loans slowed with the increase being the lowest in recent five years . The Group strengthened market research, and conducted real estate loan business prudently in line with its analysis and projection. The Group also strengthened internal control and compliance management, strictly implemented the loan customer list management and put effective risk controls on customer access. Focus was placed on customers with high credit rating and qualification and related projects in large and medium-sized cities and major cities where the real estate market development has been relatively stable, housing prices relatively low and where sale restriction policies have not been implemented. Key support has been given to general residential projects and indemnificatory housing projects. At the end of 2011, the property development loans of the Bank totalled RMB419,160 million, up only 0.16%, or RMB650 million, which was the lowest increase in the past five years.
The Yunnan Nuozhadu powerplant project

44 CHINA CONSTRUCTION BANK CORPORATION ANNUAL REPORT 2011
MANAGEMENT DISCUSSION AND ANALYSIS
Traditional advantage businesses and emerging businesses both achieved rapid growth, with continuous expansion of services scope. Loans to infrastructure sectors increased by RMB194,362 million, accounting for 41.42% of the increase in corporate loans. The Group is the market leader in internet merchant business with the loan balance up by 80.45% to RMB34,747 million. The number of internet merchant customers grew to 9,416, an increase of 2,771 customers from the previous year. After attracting three e-commerce platforms, Tader Coal SCM, ChinaEC and CNCotton, the number of platforms the Bank cooperated with rose to nine. In terms of domestic factoring, the Group advanced RMB127,936 million, an increase of 89.54%; the NPL ratio was 0.14%, representing sound risk control on the whole. Agriculture-related loans increased by 27.71% to RMB1,049,912 million, in which the loans for supporting new countryside construction were RMB31,647 million. Loans for indemnificatory housing projects increased rapidly to RMB25,730 million. The growth of electronic negotiable instrument business was robust, with the accumulated discounting amount of electronic negotiable instruments reaching RMB31,549 million. Loans to small enterprises increased by 24.60% to RMB913,758 million, outpacing the corporate loan growth by 12.80 percentage points. The number of small enterprise customers grew to 72,091, an increase of 10,392 customers from the previous year; product innovation made remarkable progress with the four major product categories, including “Growing Path”, “Easy Loan”, “Easy Petty Loan”, “Loan on Credit”, which covered multiple risk mitigation measures such as mortgage, pledge, third-party guarantee and credit guarantee, continuously improving customer service capabilities. In addition, the NPL ratio for small enterprises continued to decline due to strict
risk controls. Lastly, the Bank won the award of “Best SMEs Banking Products in China” in the China Awards Programme 2011 held by The Asian Banker magazine.
Corporate deposits grew steadily. The Group attached great importance to the compliance of operations, with a steady increase in corporate deposits. Corporate deposits rose by RMB466,867 million from 2010 to RMB5,415,019 million. In this amount, time deposits increased by RMB340,198 million, accounting for 72.87% of the increase in corporate deposits; demand deposits increased by RMB126,669 million, accounting for 27.13% of the increase in corporate deposits. The foreign exchange deposits totalled US$25,850 million with deposit growth ranking first among peers.
Income from fee-based business in corporate banking grew fast . Net fee and commission income for the year rose by 37.14% to RMB39,170 million, accounting for 45.03% of the fee-based business income of the Group. Multiple key products made substantial contributions, including corporate RMB settlement income of RMB7,431 million, cost advisory services income of RMB5,474 million and domestic factoring income of RMB3,191 million.
Institutional business continued to develop rapidly, with its various products holding market-leading positions . The Bank expanded on its “Minben Tongda” brand, with the launch of a sub-brand focused on integrated financial services for cultural sectors. The Bank was ranked first in the comprehensive evaluation of the agency service of the central finance authorised payment. In addition, in terms of the number of budget units it served, the volume of agency disbursement, and related fee income, the Bank continued to be the market leader. The civil card business for the
The Tengfeiyuan project of Dalian Software Park

45CHINA CONSTRUCTION BANK CORPORATION ANNUAL REPORT 2011
budget units maintained strong development momentum, with the total number of cards issued reaching 2,892,800, ranking first in terms of market share. The Bank issued 4.58 million social security cards in total, expanding its social security product coverage. The third-party deposit custody service for securities settlement funds which is branded as “Xincunguan” had 21,252,200 customers, ranking first in terms of the number of customers in the market for the seventh year in a row. The “Safe Deal” custodial service for trading funds achieved a fee income of RMB2,316 million, up 31.14%. Income from the fund collection and payment agency service for funds trust plans totalled RMB1,645 million. The Bank continued to enjoy close to 50% market share in the provision of through-train banking services for futures in terms of the number of customers, maintaining leading position in the market. Lastly, the Bank set up fund settlement network or provided cash management services for a total of 106 finance companies, leading to fund settlement network coverage of more than 90%.
International business developed rapidly, actively meeting the global financial needs of corporate customers . International settlement volume reached US$842,076 million, an increase of 26.24%, and the related income increased by 47.85% from 2010 to RMB4,505 million. With the rapid growth of cross-border RMB business, the cross-border RMB settlement volume totalled RMB315,673 million, 6.54 times of that for the previous year. Trade financing recorded a 40.90% increase with on and off-balance sheet balance of RMB369,444 million. The international guarantee business continued its healthy growth, in which the “Overseas Financing Guarantee” branded financing guarantee business was well received by the market with its distinctive features. To enhance its comprehensive service in support of the global financial needs of its customers, the Bank actively expanded its range of services including the direct connection mode between the Bank and the enterprise for foreign exchange cash pooling, foreign currency clearing service for other banks and overseas fund-raising transferred loan-related business.
Asset custodial business made rapid progress, with rising market position . At the end of 2011, the Bank’s assets under custody increased by 57.50% to RMB2.06 trillion, generating a fee income of RMB1,911 million, an increase of 11.36%. Securities investment funds under custody totalled RMB495,229 million, commanding the second largest market share. The number of securities
investments funds under custody increased by 46, and the units of funds under custody increased by 50,200 million. Insurance assets under custody doubled to RMB270,848 million. The Bank continued to command the largest market share in terms of the number and amount of collective assets management plans under custody for securities companies. Enterprise annuity funds under custody grew steadily to RMB48,137 million, ranking second in the industry. Recognised by domestic and international professionals for its outstanding custodial ability, the Bank won the “Best Custodian Bank in China” award for 2011 by the Global Custodian.
Pension business experienced rapid growth. At the end of 2011, the Bank had 4.04 million contracted personal accounts of enterprise annuities, up by 1.38 million from 2010. The personal accounts in operation totalled 2.04 million, up by 360,000 from 2010. The contracted assets under custody amounted to RMB19,407 million, up 37.93% from 2010. The size of assets under custody in operation amounted to RMB16,575 million, up 38.90%. The Bank had a total of 9,966 contracted corporate customers of enterprise annuity, an increase of 5,484 from 2010. The asset size of “Yangyisifang” branded employee compensation deferred payment plan amounted to over RMB1 billion, providing more than 300 enterprises with comprehensive services including welfare plan consulting, account information management, fund management and fund preservation and appreciation.
Fund settlement business continued to maintain rapid growth. At the end of 2011, the Bank had 430,900 cash management customers, up by 202,900 year-on-year, with the RMB settlement business generating an income of RMB9,460 million, up 46.89%. The Bank launched various innovative products such as transaction information customisation, batch collection service, and custodial service for customers’ provisions at third-party payment agencies. Competitive advantages were achieved with the Bank’s corporate banking products including all-in-one corporate account, settlement card, multiple-mode cash pool and domestic letter of credit. The Bank’s excellent cash management services branded as “Yudao” were recognised with special awards on cash management from various media including FinanceAsia, CFO World and Treasury China.

46 CHINA CONSTRUCTION BANK CORPORATION ANNUAL REPORT 2011
MANAGEMENT DISCUSSION AND ANALYSIS

47CHINA CONSTRUCTION BANK CORPORATION ANNUAL REPORT 2011
Personal BankingPersonal banking segment achieved profit before tax of RMB37,627 million with a year-on-year increase of 23.00%, accounting for 17.17% of the Group’s profit before tax.
The following table sets forth the major operating information and changes related to personal banking:
(In millions of RMB, except percentages)Year ended
31 December 2011Year ended
31 December 2010 Change (%)
Net interest income 84,918 70,497 20.46
Net fee and commission income 29,061 23,919 21.50
Other operating income 976 628 55.41
Operating income 114,955 95,044 20.95
Operating expenses (73,361) (62,278) 17.80
Impairment losses (3,967) (2,176) 82.31
Profit before tax 37,627 30,590 23.00
As at 31 December 2011
As at 31 December 2010
Segment assets 1,662,434 1,361,904 22.07

48 CHINA CONSTRUCTION BANK CORPORATION ANNUAL REPORT 2011
MANAGEMENT DISCUSSION AND ANALYSIS
Personal banking segment achieved profit before tax of RMB37,627 million with a year-on-year increase of 23.00%, accounting for 17.17% of the Group’s profit before tax, at a level comparable to its contribution in 2010. Operating income rose by RMB19,911 million over the previous year. In this amount, net interest income increased by RMB14,421 million as a result of the rapid growth of personal loans and the increase in net interest margin; net fee and commission income increased by RMB5,142 million, benefiting from the growth of income from bank card and other services. Operating expenses increased by 17.80%, due to greater resources invested in the personal banking business. Impairment losses increased by RMB1,791 million, mainly as a result of the fast growth of personal loans, and more prudent provisioning policy adopted by the Group based on its judgement on the property market.
Personal deposits achieved stable growth. At the end of 2011, personal deposits rose to RMB4,419,398 million, an increase of RMB396,585 million, or 9.86% over 2010. Demand deposits accounted for 41.41% of the personal deposits, and time deposits accounted for 58.59%.
Personal loans grew rapidly with asset quality ranking first in the market . At the end of 2011, personal loans totalled RMB1,683,855 million, an increase of 23.02% from the previous year. Residential mortgage loans were primarily granted to support people to buy ordinary self-occupied apartments, and the loan balance rose by 20.74% to RMB1,317,444 million, ranking first in the market in terms of both loan balance and the increase. The brand image of the Bank’s housing finance
was heightened with the award of “Best Mortgage Loan Bank in China” from the Moneyweek magazine. The Bank’s “Happy Home” brand also won a golden influential brand award from Financial Money magazine. The Bank persisted in its standard of “quality customers + effective pledged assets” for personal business loans, with accelerated development in the direction of community finance and specialised markets, and achieved a rapid growth of 64.57% to RMB80,075 million. Personal agriculture-related loans focused on promoting pilot loans to the planting and breeding industry, up 47.40% to RMB5,424 million. The Bank continued to strengthen post-loan management, maintaining the best asset quality among its peers. Personal non-performing loans decreased to RMB5,179 million by RMB741 million from 2010, with an NPL ratio of 0.31%. For residential mortgage loans, the NPL ratio was 0.20%, a decrease of 0.07 percentage points from 2010.
The Bank continued to command the largest market share of the entrusted housing finance business. At the end of 2011, housing fund deposits were RMB506,955 million, up by RMB89,057 million from 2010, while personal provident housing loans were RMB616,207 million, up by RMB99,474 million from 2010. The Bank enhanced the research and development of technology, continuously improved products and services, and heavily promoted cooperation and contract signing with regard to co-branded provident fund cards, housing maintenance fund and housing finance technology services. The Bank enhanced products portfolio, and actively supported the housing financing needs of low and middle-income residents, by disbursing a total of RMB11,621 million worth
Ms. Ma Ya, private banking customer manager of CCB Beijing Branch is talking with a VIP customer

49CHINA CONSTRUCTION BANK CORPORATION ANNUAL REPORT 2011
of commercial and provident fund housing loans to 69,400 low income residents during the year. The indemnificatory individual housing loans totalled RMB38,194 million at the end of the year. The Bank actively supported the government’s indemnificatory housing construction, and earnestly promoted financial services for indemnificatory housing. It gained the commitments of qualification to provide services to all the 29 pilot cities under the first pilot programme, and granted entrusted provident fund loans of RMB18,876 million on an accumulative basis.
Credit card business maintained sustainable and healthy development, with further improvement of brand influence. At the end of 2011, the Bank recorded 32.25 million credit cards and the spending amount reached RMB588,901 million, an increase of 44.86% from the previous year. Loans rose by 75.96% to RMB97,553 million, with loan quality remaining good. The product range of credit cards became more complete. The “Excellent”, “€uro” and “Barbie” cards were well received by the market, and the number of department store cards, civil cards and auto cards issued all exceeded 2.70 million respectively. In order to meet customers’ differentiated consumption credit needs, the Bank introduced the “Long Card installment payment” product series with five categories covering car, home refurbishment, shopping at department stores, mail order and billing, providing multiple convenient consumption credit channels including the Bank’s outlets, POS at shopping malls, internet and telephone. The car installments, in particular, became a major attraction of the Bank, with 28 cars out of every 1000 family cars in China using its service in 2011. The Bank’s “Long” brand credit card has been conferred numerous honours by mainstream media and professional organisations. The Bank won the “Most influential brand marketing award in 2011” by the Organising Committee of the 21st Century AD International Summit. “My Love” credit card competition series of the Bank’s marketing campaign, won the “Best Marketing Award for Financial Brand in China” by The Chinese Banker magazine.
Debit cards and other fee-based businesses enjoyed good development . By the end of 2011, the Bank had issued a total of 364 million debit cards, an increase of 72.09 million cards from 2010. Spending via debit cards totalled RMB1,792,757 million, generating a fee income of RMB8,477 million. Innovative products, such as the Social Security IC Card with financial functions and Healthy Long Card, were
also launched. A total of 1.98 million express settlement cards targeted at individual industrial and commercial households had been issued, an increase of 1.39 million cards compared to 2010. Fees generated from the emerging investment and wealth management business increased considerably. Fees from fund agency sales (including collective plans) and personal physical gold sales amounting to RMB2,735 million and RMB673 million respectively, leading in the market; and fees from life insurance agency services were RMB2,730 million. Lastly, the Bank took the lead in the market to launch mobile payment services.
High-end customers were further expanded with diversified financial services . At the end of 2011, the number of customers with financial assets of more than RMB3 million under the Bank’s management recorded a 20.43% increase, while those with more than RMB10 million increased by 27.99%; the financial assets of high-end customers increased by 25.03%. The number of private banking cards and wealth management cards issued grew substantially. Based on the diverse needs of high-end customers, the Bank adopted a wide-angled and multi-dimensional reorganisation and innovation approach with regards to product services, related processes and pricing. For example, a large-sum term deposits service for its private banking customers, and innovative product projects such as cash management, consumption and community f inancial service, and comprehensive credit approval for private banking customers, were introduced. The Bank has accomplished a wealth transaction model, which enables private banking customers to perform transactions such as transfers, remittances, purchase of government bonds and wealth management products by directly calling their account managers with their orders being confirmed through pre-determined telephone passwords.

50 CHINA CONSTRUCTION BANK CORPORATION ANNUAL REPORT 2011
MANAGEMENT DISCUSSION AND ANALYSIS
Treasury Business The following table sets forth the major operating information and changes related to treasury business:
(In millions of RMB, except percentages)Year ended
31 December 2011Year ended
31 December 2010 Change (%)
Net interest income 59,298 42,675 38.95Net fee and commission income 16,841 11,898 41.54Net trading gain 2,047 1,940 5.52Net income arising from investment securities 824 504 63.49Other operating loss (524) (1,591) (67.06)
Operating income 78,486 55,426 41.61Operating expenses (4,309) (3,573) 20.60Impairment losses (3,118) (655) 376.03
Profit before tax 71,059 51,198 38.79
As at 31 December 2011
As at 31 December 2010
Segment assets 5,411,041 4,684,227 15.52

51CHINA CONSTRUCTION BANK CORPORATION ANNUAL REPORT 2011
Treasury business segment generated a profit before tax of RMB71,059 million, an increase of 38.79% over 2010, accounting for 32.43% of the Group’s profit before tax, which was 3.20 percentage points higher than its contribution in 2010. Operating income rose by RMB23,060 million, or 41.61% over the previous year. In this amount, net interest income rose by RMB16,623 million, or 38.95% with the rise of market interest rate; as a result of fast development of services such as financial advisory service, wealth management products, and customer-driven treasury business, net fee and commission income grew by RMB4,943 million, or 41.54% over the previous year. Impairment losses increased by RMB2,463 million, mainly as a result of large increase in the balance of wealth management products, and increased provisions for debt securities investments.
Trading floor of the Financial Market Department, CCB Headquarters

52 CHINA CONSTRUCTION BANK CORPORATION ANNUAL REPORT 2011
MANAGEMENT DISCUSSION AND ANALYSIS
Financial markets businessThe Group persisted with prudent investment and trading strategies, and sought an overall balance between risks and yields, leading to improved operating revenue and consolidated market position. With regards to the utilisation of RMB funds, the Bank managed to achieve substantial increase in the yields of RMB debt securities investments while maintaining safe liquidity, by seizing opportunities of interest rate trends and actively adjusting the investment portfolio. The Bank commanded the largest market share in book-entry treasury bonds underwriting for the third consecutive year, consolidating its market influence. The Bank actively carried out band operations in the trading book, strengthening its market making ability, leading to significantly higher trading bond yields than the benchmark index, and the Bank ranked second in terms of over-the-counter transaction volume of book-entry treasury bonds. In terms of foreign currency funds utilisation, the Bank supported the development of its overseas institutions, carried out interbank lending with prudent counterparty credit risk prevention measures. The Bank proactively responded to the Europe debt crisis by reducing its holdings of high risk bonds timely and optimising the country and industry structure of foreign currency debt securities investments.
The Bank focused on the innovation of precious metal products with diversified product lines, and introduced new products including account silver, platinum and customer-driven forward gold transactions. At the end of 2011, the Bank’s precious metal trading volume reached a total of 9,752.00 tonnes, representing an increase of 759% over the previous year. CCB brand physical gold continued to command the largest market share.
The foreign exchange trading business steadily improved. At the end of 2011, the volume of customer-driven foreign exchange trading reached US$388.4 billion, up 25.74% year-on-year. The Bank is also an active market maker in the onshore foreign exchange interbank market.
Investment bankingWith the support of its financial total solutions, the Group proactively promoted the establishment of comprehensive long-term business cooperation relationship with government institutions, enterprises and individual customers. In 2011, the revenue from investment banking amounted to RMB18,949 million, an increase of 36.26% over the previous year.
Income from financial advisory services was RMB10,400 million. In this amount, income from new financial advisory services such as M&A and restructuring, debt restructuring, listing and refinancing amounted to RMB5,248 million, an increase of 101.85% year-on-year. The Bank’s debt financing instrument underwriting business sustained its competitive advantage, achieving an income of RMB880 million. The underwriting amount of short-term commercial papers reached RMB121,410 million, ranking first among peers for the sixth consecutive year in terms of the accumulated underwriting volume. The underwriting amount of ultra-short-term commercial papers reached RMB46 billion, also leading the market.
In 2011, the Bank issued 4,036 batches of wealth management products, bringing an income of RMB7,570 million, up 39.62% year-on-year. The outstanding amount of products was RMB692,651 million, an increase of 112.34%. In light of changes in regulatory policies, the Bank strengthened its risk control over the wealth management business, adjusted the business development direction and
Mr. Yin Chenguang, treasury trader of CCB Headquarters, is working

53CHINA CONSTRUCTION BANK CORPORATION ANNUAL REPORT 2011
enhanced product innovation. In line with the government policy of “safeguarding people’s livelihood, and promoting harmony”, the Bank actively channelled funds from wealth management products to support national indemnificatory housing construction projects, help resolve the financing problems of SMEs, and meet the diverse financing needs of customers, while keeping risks under control.
Overseas Business and Domestic SubsidiariesOverseas businessThe Group adheres to a positive and steady international operation and overseas development strategy, leading to a steady expansion of its overseas network. The Taipei and Moscow representative offices were opened in May 2011 consecutively, and the establishment of entities in other regions are also in progress. At the end of 2011, the Group’s overseas entities covered 13 countries and regions, with nine overseas branches in Hong Kong, Singapore, Frankfurt, Johannesburg, Tokyo, Seoul, New York, Ho Chi Minh City and Sydney; two representative offices in Taipei and Moscow; two subsidiaries in Hong Kong, namely CCB Asia and CCB International, and CCB London in the UK. At the end of 2011, total assets of overseas entities were RMB443,188 million. In this amount, the total assets of overseas commercial banking entities (excluding CCB International and the overseas representative offices) were RMB421,212 million, up 67.74% from 2010; the profit before tax was RMB2,109 million, an increase of 64.00% year-on-year. Coordinated business operations continued to deepen, with coordinated assets being RMB125.9 billion, doubling that at the end of the previous year. The overseas entities continued to improve their asset structure, with the proportion of syndicated loans and debt securities in total assets decreasing to below 15%, and the non-performing loans and NPL ratio continued to fall. Lastly, the overseas core banking system was rolled out to the overseas branches and CCB London, providing strong support for the development of wholesale business overseas.
CCB AsiaChina Construction Bank (Asia) Corporation Limited, as one of the 23 licensed banks registered in Hong Kong, is the Group’s platform for retail and SME businesses in Hong Kong and Macau, with a total of 50 outlets in Hong Kong and Macau. CCB Asia has a long history of 100 years since 1912 and is the first Chinese-owned bank in Hong Kong. CCB Asia maintained positive development trend under stringent risk control. At the end of 2011, its total assets were RMB109,194 million, an increase of 25.62% from 2010. Loans to customers and deposits from customers were RMB81,429 million and RMB75,460 million, with an increase of 20.86% and 25.11% respectively. The NPL ratio was 0.22%. The net profit was RMB500 million.
CCB Asia’s localised operations progressed smoothly. At the end of 2011, the number of customers totalled 195,000, an increase of 55,000 customers over the previous year. The commercial loan structure continued to improve with strengthened coordination between the domestic and overseas members, and the loans granted to Chinese enterprises going overseas were RMB32,417 million. CCB Asia rapidly pushed forward its comprehensive RMB-related services, with its RMB deposits reaching RMB9,560 million, and the cross-border RMB settlement amount exceeding RMB30 billion at the end of 2011. CCB Asia became one of the first overseas banks approved by the PBC to invest in China’s domestic interbank bond market, and one of the first banks in Hong Kong to provide RMB stock trading services to retail customers, and successfully acted as a co-lead bank and book-keeping bank for RMB government bonds. For its efforts, CCB Asia won the “2011 Capital Excellent RMB Services Award” by the Hong Kong magazine Capital. Much progress was made in the credit card business with an increase of 70,000 credit card accounts, and consumer spending nearly reaching RMB4,052 million.
Offshore drilling platform ECA

54 CHINA CONSTRUCTION BANK CORPORATION ANNUAL REPORT 2011
MANAGEMENT DISCUSSION AND ANALYSIS
of Pacific-Antai, which was subsequently renamed as CCB Life Insurance Company Limited. The Group became the first among the four state-owned banks to own controlling interests in a life insurance company, besides its subsidiary financial institutions covering fund, trust, financial leasing, and investment banking. The Group actively promoted new types of rural financial institutions, and had initiated the establishment of 16 rural banks in Hunan Taojiang and many other places by the end of 2011. The Group is committed to providing multi-functional, integrated and one-stop comprehensive financial services to its wide base of customers, through resource sharing, cross-selling and business coordination, while realising the joint development of all members of the Group. Currently, the overall development of the domestic subsidiaries is in good shape with steady business expansion and improved company quality. At the end of 2011, total assets of the domestic subsidiaries reached RMB67,444 million, up 66.92% over the previous year, and net profit amounted to RMB725 million, a 52.95% increase year-on-year.
CCB Financial LeasingCCB Financial Leasing Corporation Limited was jointly established by the Bank and Bank of America. The corporation has a registered capital of RMB4.5 billion, of which 75.1% was contributed by the Bank and 24.9% by Bank of America. CCB Financial Leasing is one of the first innovative PRC financial leasing companies approved by the CBRC. It is mainly engaged in finance leasing, receiving security deposits from lessees, transferring rent receivables to commercial banks, issuing financial bonds, interbank lending, borrowing from financial institutions, and borrowing foreign exchange overseas.
The Company made steady progress in its leasing business, strengthened its fundamental management and internal risk control, and actively explored innovative leasing products. At the end of 2011, the total assets of CCB Financial Leasing amounted to RMB36,023 million, an increase of 48.07% over the previous year; net profit was RMB212 million, up 24.71% from the previous year.
CCB TrustCCB Trust Co., Limited was established by the Bank together with Hefei Xingtai Holding Group Corporation Limited and Hefei Municipal State-owned Assets Holding Corporation Limited. It has a registered capital of RMB1,527 million, of which the Bank contributed 67%, and the two other parties contributed 27.5% and 5.5% respectively. CCB Trust is mainly engaged in trust services for fund, movable and immovable property, and marketable securities; fund investment;
CCB InternationalCCB International (Holdings) Limited is a wholly-owned investment bank subsidiary of the Bank in Hong Kong. Its business scope includes sponsorship and underwriting for initial public offerings (IPO), financial advisory services, M&A and restructuring, refinancing arrangements for listed companies, direct investment, fund raising and sales, asset management and investment consultancy service, securities brokerage, market research, secondary issue and placement, investment consultancy service in the Mainland and industry investment funds.
In 2011, CCB International continued in its business transformation efforts, and expanded its traditional investment banking business including IPO. The number of IPO projects and executed M&A projects led in Chinese-funded investment banks. The securities brokerage business grew despite the adverse economic environment with significant increase in the number of institutional and non-institutional clients, leading to a net fee and commission income of RMB585 million. The securities brokerage service platform continued to improve. At the end of 2011, CCB International’s total assets were RMB17,398 million. However, due to the drastic fluctuations in the capital market, the value of the listed equity investments held for trading purpose fell sharply, leading to a net loss of RMB1,609 million.
CCB LondonChina Construction Bank (London) Limited is a wholly-owned subsidiary of the Bank registered in the UK. It is mainly engaged in corporate deposits and lending, international settlement and trade financing, British pound clearing, and treasury financial products.
CCB London proactively served the Chinese-funded institutions in the UK, British companies with investment in China, and corporate customers who focus on the Sino-British trade. It gradually became CCB’s British pound clearing centre, and built an offshore RMB and foreign exchange transaction platform for the Group during Europe daytime. At the end of 2011, the total assets of CCB London were RMB5,024 million, an increase of 1.76% over the previous year. The net profit of CCB London in 2011 amounted to RMB37 million.
Domestic subsidiariesThe integrated operations of the Group achieved significant progress. By June 2011, the Bank had completed the equity transfer procedures for ING’s 50% interests in Pacific-Antai, and completed those for China Pacific Insurance (Group) Co., Ltd’s 50% interests in Pacific-Antai with joint investors as well. As a result, the Bank became the controlling shareholder

55CHINA CONSTRUCTION BANK CORPORATION ANNUAL REPORT 2011
restructuring, M&A, project financing, corporate finance, and financial advisory services; securities underwriting; intermediary, consultancy, and credit investigation services; custody and safe deposit box services; and lending, investing and providing guarantees with equity funds.
In 2011, CCB Trust proactively pursued product innovation, and developed series of trust schemes including “Caifutong”, “Daixintong”, transfer of trust beneficiary rights and securities investment. At the end of 2011, the trust assets under management amounted to RMB190,726 million, up 188.91% from 2010. Net profit was RMB329 million, up 89.08% over 2010.
Sino-German BausparkasseSino-German Bausparkasse Co., Ltd. has a registered capital of RMB2 billion, with a 75.1% share held by the Bank and a 24.9% share held by Bausparkasse Schwaebisch Hall. Its business scope includes taking housing savings deposits, extending housing savings loans and residential mortgage loans, and extending development loans in support of the development and construction of economically affordable houses, low-rent houses, economically affordable rent houses and price-limited houses. This allowed it to establish itself as a full service commercial bank specialised in housing finance.
In 2011, Sino-German Bausparkasse’s residential mortgage loans business developed rapidly. It achieved remarkable housing savings product sales figures, and exhibited obvious advantage in indemnificatory housing loans. At the end of 2011, the total assets of Sino-German Bausparkasse were RMB13,542 million, an increase of 64.88% over the previous year; its net profit rose to RMB59 million, up 136.00% over 2010.
CCB Principal Asset ManagementCCB Principal Asset Management Co,. Ltd. has a registered capital of RMB200 million, of which the Bank contributed 65%, and two other parties, Principal Financial Services, Inc. and China Huadian Group Corporation, contributed 25% and 10% respectively. It is engaged in raising and sale of funds, asset management as well as other businesses permitted by the CSRC.
In 2011, CCB Principal Asset Management completed eight sessions of fundraising work, including the Jianxin Guaranteed Mixed Securities Investment Fund, and Jianxin Dual Income Strategy Grading Stock Investment Fund. All these funds operated smoothly. At the end of 2011, CCB Principal Asset Management managed 21 funds with a net asset value of RMB48,693 million. Its net profit was RMB113 million, up 11.88% over 2010.
CCB LifeCCB Life Insurance Company Limited has a registered capital of RMB1.18 billion, of which the Bank, China Life Insurance Co., Ltd. (Taiwan), China Jianyin Investment Limited, Shanghai Jin Jiang International Investment and Management Company Limited and Shanghai China-Sunlight Investment Co., Ltd contributed 51%, 19.9%, 19.35%, 4.9% and 4.85% respectively. Its business scope includes personal insurance such as life, health, accidental injury insurance, as well as reinsurance of the above-mentioned business.
In 2011, CCB Life adopted a balanced development strategy for its various distribution channels, each of which had a different focus. It expanded the bank insurance channel, actively developed group insurance channel, consolidated the development of its personal agency insurance business and actively expanded new distribution channels such as online and telephone sales. At the end of 2011, the total assets of the company rose to RMB5,459 million. Premium income amounted to RMB1,208 million, while the net profit for 2011 was RMB33 million.
Rural BanksBy the end of 2011, the Bank had sponsored the establishment of 16 rural banks in Hunan Taojiang and many other places. The registered capital of these rural banks totalled RMB1,540 million, of which RMB775 million was contributed by the Bank.
The rural banks introduced a wide range of measures supporting and benefiting farmers and rural area based on local economic characteristics while keeping an eye on risk control, and developed multiple credit products such as co-guaranteed loans and business loans for farmers. While providing efficient financial services for “agriculture, farmers and rural areas” and small and micro-enterprises in the counties, the rural banks achieved sound operating results as well. At the end of 2011, the assets of the 16 rural banks totalled RMB6,842 million, and deposits were RMB4,597 million. The loans totalled RMB4,128 million, of which agriculture-related loans accounted for 87.34%. The non-performing loans were kept at nil, due to effective controls on asset quality. The net profit for 2011 was RMB24 million.

56 CHINA CONSTRUCTION BANK CORPORATION ANNUAL REPORT 2011
MANAGEMENT DISCUSSION AND ANALYSIS
Analysed by Geographical SegmentThe following table sets forth the distribution of the Group’s profit before tax by geographical segment:
For the year ended 31 December 2011
For the year ended 31 December 2010
(In millions of RMB, except percentages) Amount % of total Amount % of total
Yangtze River Delta 41,116 18.77 33,226 18.97
Pearl River Delta 28,973 13.22 24,636 14.07
Bohai Rim 33,749 15.40 27,186 15.52
Central 29,872 13.63 22,293 12.73
Western 31,443 14.35 24,057 13.74
Northeastern 12,049 5.50 8,414 4.80
Head office 41,601 18.99 32,131 18.34
Overseas 304 0.14 3,213 1.83
Profit before tax 219,107 100.00 175,156 100.00
The following table sets forth the distribution of the Group’s loans and advances by geographical segment:
For the year ended 31 December 2011
For the year ended 31 December 2010
(In millions of RMB, except percentages) Amount % of total Amount % of total
Yangtze River Delta 1,476,118 22.72 1,321,708 23.31
Pearl River Delta 955,937 14.71 858,420 15.14
Bohai Rim 1,137,623 17.51 1,008,340 17.79
Central 1,051,837 16.19 922,185 16.27
Western 1,108,112 17.06 963,636 17.00
Northeastern 406,035 6.25 350,584 6.18
Head office 105,632 1.63 63,638 1.12
Overseas 255,117 3.93 180,617 3.19
Gross loans and advances to customers 6,496,411 100.00 5,669,128 100.00
The following table sets forth the distribution of the Group’s deposits by geographical segment:
For the year ended 31 December 2011
For the year ended 31 December 2010
(In millions of RMB, except percentages) Amount % of total Amount % of total
Yangtze River Delta 2,067,000 20.70 1,895,511 20.89
Pearl River Delta 1,539,667 15.42 1,435,742 15.82
Bohai Rim 1,825,388 18.28 1,662,231 18.32
Central 1,774,126 17.76 1,602,656 17.66
Western 1,873,139 18.75 1,645,659 18.13
Northeastern 733,876 7.35 668,217 7.36
Head office 21,221 0.21 60,949 0.67
Overseas 153,033 1.53 104,404 1.15
Deposits from customers 9,987,450 100.00 9,075,369 100.00

57CHINA CONSTRUCTION BANK CORPORATION ANNUAL REPORT 2011
The following table sets forth the geographical distribution of the Group’s assets, branches and staff:
As at 31 December 2011
Assets (In millions of
RMB) % of totalNumber of
branches % of totalNumber of
staff1 % of total
Yangtze River Delta 2,309,626 18.81 2,310 16.84 49,466 15.02
Pearl River Delta 1,773,562 14.44 1,708 12.45 39,357 11.95
Bohai Rim 2,241,298 18.25 2,215 16.15 55,812 16.94
Central 1,874,631 15.26 3,293 24.01 73,713 22.37
Western 1,982,662 16.14 2,749 20.05 65,899 20.00
Northeastern 769,288 6.26 1,366 9.96 35,796 10.87
Head office 5,140,899 41.86 3 0.02 8,874 2.69
Overseas 443,188 3.61 71 0.52 521 0.16
Deferred tax assets 21,410 0.17
Elimination (4,274,730) (34.80)
Total 12,281,834 100.00 13,715 100.00 329,438 100.00
1. This represents the number of the Bank’s staff.
Distribution ChannelsThe Bank has an extensive distribution network. Through branches, customer self-service equipment, specialised service entities across the country and electronic banking service platform, the Bank provides customers with convenient and high-quality banking services.
At the end of 2011, the Bank had a total of 13,581 operating outlets in the PRC, including the head office, 38 tier-one branches, 304 tier-two branches, 8,835 sub-branches, 4,402 entities under the sub-branches and a specialised credit card centre at the head office. The number of operating outlets increased by 166 over the previous year. The distribution of operating outlets was prioritised towards super large cities, major cities and key economic counties and towns. By the end of 2011, a total of 7,800 retail outlets had completed the second phase of retail outlet transformation, which wound up nicely. A total of 10,482 dedicated account managers work in transformed retail outlets, leading to remarkable improvement in service capability and customer satisfaction. The Bank also implemented a star rating system, and 181 outlets were rated as “five-star banking store”, 676 outlets as “four-star banking store” and 1,105 outlets as “three-star banking store”.
Self-service channel was the Bank’s largest banking transaction channel, with 45,645 ATMs in operation, an increase of 5,771 over the previous year. There were 10,681 self-service banks in operation, an increase of 1,004 over the previous year.
By the end of 2011, a total of 245 private banking centres and wealth management centres had opened business, 940 personal loan centres and 240 small business centres have been established. The network of specialised service entities covered all major cities and the top hundred counties.
The Bank’s electronic banking channel developed rapidly, with significant increase in usage level. At the end of 2011, the personal online banking customers increased by 48.19% to 84.54 million; corporate online banking customers reached 1.39 million, an increase of 49.46% over the previous year; mobile phone banking customers reached 46.95 million, an increase of 109.22%. The number of transactions for personal online banking customers was 4.04 billion, up 40.78% over the previous year; that for corporate online banking customers was 970 million, up 46.97%; that for mobile phone banking customers was 206 million, up 93.25% year-on-year. Telephone banking customers rose to 96.21 million, an increase of 33.77% over the previous year. The ratio of the number of transactions through electronic banking to that through the front desk reached 206.72%, an increase of 65 percentage points over the previous year. The Bank has introduced various new electronic banking services and products such as dynamic passwords through SMS, separately managed accounts, E-Shangmaotong, account silver, account platinum and medical banking services. Products such as electronic mobile terminal was further promoted for wider use, and 21 batches of exclusive wealth management products were introduced to online banking customers. Through the introduction of a personal loan board “House-E-Tong” at the Bank’s website, the electronic personal loan service channel was initially established. In addition, the Bank has established an interactive online customer service platform, and built a customer experience database and continuously strived to solve all issues. Lastly, the influence of CCB E-Route official microblog at Sina has also expanded.

58 CHINA CONSTRUCTION BANK CORPORATION ANNUAL REPORT 201158 CHINA CONSTRUCTION BANK CORPORATIONCC ANNUAL REPORT 2011
Build up broader career path for our associatesIn 2011, the Bank continued to deepen the reform of human resources management mechanism, increase its investment in training resources, and promote staff career development.
329,438The number of staff members
29,166The number of local and overseas training sessions

59CHINA CONSTRUCTION BANK CORPORATION ANNUAL REPORT 2011 59CHINA CONSTRUCTION BANK CORPORATIONC ANNUAL REPORT 2011
1.32mThe number of enrolment

60 CHINA CONSTRUCTION BANK CORPORATION ANNUAL REPORT 2011
MANAGEMENT DISCUSSION AND ANALYSIS
The composition of employees by age, academic qualifications and responsibilities is as follows:
Category ClassificationNumber of employees % of total
Age Below 30 79,353 24.09
31 to 40 103,045 31.28
41 to 50 114,845 34.86
51 to 59 32,065 9.73
Over 60 130 0.04
Academic qualification Doctor’s degree 359 0.11
Master’s degree 12,187 3.70
Bachelor’s degree 147,566 44.79
Associate degree 121,589 36.91
Post-secondary 24,526 7.44
High school and below 23,211 7.05
Responsibilities Corporate banking 49,959 15.17
Personal banking 158,772 48.20
Financial market business 324 0.10
Finance and accounting 26,558 8.06
Management 17,563 5.33
Risk management, internal audit, legal and compliance 11,697 3.55
Information technology 20,572 6.24
Others 43,993 13.35
Total 329,438 100.00
system, the technical code and standard system. The contingency plans and risk factors for the information system were reviewed, response strategies for different risks and severity were established, and emergency drill management was enhanced. The Bank reviewed and optimised the operating monitoring indicators, and accelerated the deployment of automated operation and maintenance tools, further improving the level of automated management. The Bank standardised the service support procedures, integrated resources, continued to promote the application system integration of branches and overseas entities, in order to simplify the application system environment for the whole bank. Despite the growth of the transaction volume, the Bank achieved the 99.99% availability target set for the key business systems.
Staff and Human Resources ManagementAt the end of 2011, the Bank had 329,438 staff members (besides, the Bank had 29,610 workers dispatched by labour leasing companies). The staff members with academic qualifications of bachelor’s degrees or above were 160,112, or 48.6%, and local employees in overseas branches and representative offices were 432. In addition, the Bank had to assume the expenses of 40,037 retired employees. The subsidiaries had 5,229 employees (besides, the subsidiaries had 141 workers dispatched by labour leasing companies).
Information TechnologyIn 2011, the Group intensified the implementation of appl icat ion systems, enhanced system-related r isk management capability, developed an IT basic architecture planning, and set the direction and objectives for IT infrastructure for the next five years.
Intensifying the implementation of application systems to support business development. The Bank actively cooperated with China UnionPay, China Mobile and Shanghai Gold Exchange to launch various systems such as the financial IC card, mobile payment, gold trading agency service, and E-Shangmaotong. Improvements were made in the system functions including telephone payment, personal foreign exchange purchase and sale, cash management and electronic banking. The system for the segregation between the front and back office was rolled out, effectively enhancing business processing efficiency while preventing operational risks. The overseas core and peripheral business systems were rolled out to the existing overseas institutions to support the expansion of overseas business.
Enhancing system-related risk management capability to ensure secure and stable operations. The Bank completed the review of risk points for key systems, established and improved the production safety target and responsibility

61CHINA CONSTRUCTION BANK CORPORATION ANNUAL REPORT 2011
In 2011, the Bank continued to deepen the reform of human resources management mechanism, and made great efforts to optimise the allocation of human resources, while exploring global best practices for post and performance management. The Bank actively attracted, cultivated and retained world-class talents, and strengthened the efforts to select talents through competition. It pushed forward team building for business management talents, professional and technical talents, and overseas business talents on a coordinated basis, in order to enhance the contribution of human capital value and promote staff career development.
Adhering to the philosophy of standardising the remuneration mechanism and harmonious remuneration relationship, the Bank continued to make innovative efforts in its remuneration management system, and optimised the incentive and disciplinary mechanisms by integrating its overall payroll pol icies, adopting the concept of target-orientated remuneration management mechanism, and strengthening the guidance to the remuneration policies for frontline employees and key positions. The Bank’s major allocation rules and other significant matters relating to staff remuneration need to be proposed to the Board for assessment and approval. The nomination and compensation committee under the Board is responsible for considering the proposals concerning of the Bank’s remuneration system and plans, the principle for
control on the total annual compensation amount, and the remuneration allocation plan, annual remuneration standards, performance appraisal plan and annual appraisal results for directors, supervisors and senior management. Material proposals relating to remuneration allocation shall be voted and approved by the shareholders’ general meeting, or reported to higher authority for approval and filing. The Bank implemented deferred payment for performance compensation of its directors, supervisors and senior management pursuant to relevant government policies. In addition, the Bank established a compensation deduction mechanism for staff who are facing disciplinary actions or other penalties due to violation of rules or breach of duty, and those who are subject to performance score deductions due to minor irregular acts.
The Bank continued to increase its investment in training resources, and delivered large-scale staff training. It not only provided general training programmes for all employees, but also organised specific training programmes for different groups of employees. Trainings for managerial staff were the major focus, and those for backup leaders were also strengthened. In 2011, the Bank conducted 29,166 local and overseas training sessions, with a total enrolment of 1,318,000.
Ms. Chen Wen, business manager of International Business Department of CCB Headquarters, is working.

62 CHINA CONSTRUCTION BANK CORPORATION ANNUAL REPORT 2011
MANAGEMENT DISCUSSION AND ANALYSIS
in 2011, in response to the changes in the macroeconomic environment, the Bank re-examined and optimised its credit policies, and strengthened its credit structure adjustments, leading to enhanced risk resistance ability of its credit portfolio. The risk management of key credit areas such as local government financing vehicles, real estate, industries with excess capacity was strengthened with continuous improvement of customer quality and credit structure. The Bank strengthened the fundamental risk management of areas including off-balance sheet activities, overseas business, country-specific risk, collaterals, and consolidation, raising the standard of comprehensive risk management. The optimisation and usage of risk management techniques and tools was promoted to support business development and innovation. The Bank strengthened market risk management by proactively responding to the volatility in the global financial markets. Operational risk controls were strengthened through special attention on critical risk points, ensuring safe and stable business operations.
In 2011, the Bank cont inued to push forward the implementation of the New Basel Capital Accord, with steady progress in implementing the three pillars. Great efforts were made to improve fundamentals including risk management mechanism, rules and processes, IT systems, data, and personnel, and a framework for comprehensive risk management required by the New Basel Capital Accord came into shape. The Bank started the implementation of the New Basel Capital Accord in overseas entities, and facilitated the on-site assessment by the CBRC assessment team. According to the assessment, the Bank has basically met the requirements to submit the application for implementing the New Basel Capital Accord.
Risk Management StructureThe risk management committee under the Board of the Bank is responsible for formulating the Bank’s risk strategy and risk management policies, supervising their implementation, and evaluating the overall risk profile on a regular basis.
The Bank has established a centralised and vertical risk management structure at the management level, with a vertical risk management line, consisting of “chief risk officer – risk supervisors – risk heads – risk managers”.
At the head office level, the chief risk officer is responsible for comprehensive risk management under the direct leadership of the president. The Risk Management Department, under the supervision of the chief risk officer, is responsible for formulating risk management policies, performing risk measurement and analysis and other issues. There are a market risk management department and a risk management team for overseas entities under the Risk Management Department. The Credit Management Department is responsible for credit approval and credit risk monitoring. Other departments at the head office perform their risk management duties within their respective scopes of duty.
At branch level, there are risk supervisors in tier-one branches, who report to the chief risk officer, and are responsible for organising risk management and credit approval within the branch. There are risk heads at tier-two branches and risk managers at sub-branches, responsible for risk management in their respective branch or sub-branch. The risk management personnel have two reporting lines: the first reporting line is to risk management officers at higher levels, and the second is to managers of their respective entities or business units. In 2011, the Bank introduced a risk supervisor at the Hong Kong branch as an exploration, and implemented the dual reporting line mechanism similar to the existing system at the domestic branches.
At subsidiary level, through the general meetings of shareholders and board of directors of each subsidiary, the Bank guides and supervises the subsidiaries in improving their risk management and internal control mechanism so as to control potential risks effectively. In addition, the Bank establishes an internal “firewall” system and a large exposure reporting system, and makes continuous improvements to them, in order to prevent the internal transmission of risks, and strengthen the Group’s overall risk controls.
Credit Risk ManagementCredit risk represents the potential loss that may arise from the failure of a debtor or counterparty to meet its obligation or commitment to the Group.
In 2011, the Bank focused on deepening the credit structure adjustments, and strengthened the risk management of key credit areas such as local government financing vehicles, real estate, and industries with excess capacity. The Bank strengthened the fundamental risk management of areas including off-balance sheet activities, overseas business, country-specific risk, collaterals and consolidation. The economic capital and industry limits systems were enhanced, and the usage of risk measurement techniques and tools was deepened. Monitoring methods and mechanism were improved, and the credit approval management system was optimised. All these led to the continuous improvement of the credit risk management standard.

63CHINA CONSTRUCTION BANK CORPORATION ANNUAL REPORT 2011
Timely re-examination of credit policies and intensified credit structure adjustments . The Bank refined its policy requirements of “promoting, securing, controlling, curtailing and exiting”, in order to guide the whole bank in intensifying the structure adjustments. With a close watch on the macroeconomic situation and market changes as well as the latest regulatory requirements, the Bank made timely re-examination to its credit policies for different industries and products to enhance the adaptability and market responsiveness of the policies.
Strengthening risk controls with respect to key business areas . The Bank carried out detailed risk investigation and evaluation of each government financial vehicle customer, and raised the cash flow coverage level with sound risk mitigation arrangements. With a close watch on the trend of changes in risks, the Bank conducted risk inspections on key areas such as property development loans, loans to industries with high energy consumption and excess capacity, and issued risk reminders for the purpose of early risk detection and disposal. The Bank fully complied with the counter-cyclical regulatory requirements by setting stringent risk classification standards, and proactively consolidating the credit asset quality base.
Strengthening fundamental management in areas including off-balance sheet activities, overseas business, country-specific risk, collaterals and consolidation . The Bank set the policy directions and relevant requirements for risk management of off-balance sheet activities, and established provisioning mechanism for off-balance sheet activities. It also enhanced the risk management structure of overseas entities, promoted the research and development of overseas business risk rating tools, and standardised post-lending risk monitoring of overseas entities. To strengthen country-specific risk management, the Bank started a country-specific risk management advisory project to explore the establishment of a country-specific risk rating system. The bottom line for collateral management policies was established, the collateral system was refined, and the collateral coverage level was raised, further strengthening the risk mitigation ability of the
Bank. The internal risk isolation controls and large exposure management of the Group was strengthened, and the major risk reporting mechanism at subsidiaries was standardised.
Optimising the credit approval management system . The Bank designed differentiated credit approval management processes based on the different characteristics of customers and products, in order to improve the efficiency of credit approval. In light of the credit characteristics of small enterprises, the Bank reviewed and revised credit approval documentation requirements specific to small enterprises, steadily promoting the collective credit approval method for small enterprises.
Promotion of the refinement, upgrade and application of risk management tools . Economic capital and industry limits management was refined, through the promotion of the use of risk-adjusted return on capital in the allocation of credit resources, the design of credit approval plans and product pricing. Rating management was standardised with the refinement of the customer rating model and customer evaluation scorecard. The Bank conducted stress tests in areas such as macroeconomic fluctuations and real estate industry, with its stress testing system completed and launched into operation. The third phase development of the system of allowances for impairment losses on loans and advances was actively promoted, and the system function for credit approval risk monitoring was refined.
Concentration of credit risksIn 2011, in line with regulatory requirements, the Group proactively adopted a series of measures to prevent large exposure concentration risk, including tightening lending criteria, adjusting business structure, controlling the granting pace, revitalising existing credit assets and innovating products.
At the end of 2011, the gross loans to the largest single borrower accounted for 3.30% of the net capital of the Group, while those to the ten largest customers accounted for 15.18% of the net capital.
Concentration of loans
Concentration indicatorRegulatory
standardAs at
31 December 2011As at
31 December 2010As at
31 December 2009
Ratio of loans to the largest single customer (%) ≤10 3.30 2.76 3.09Ratio of loans to the ten largest customers (%) 15.18 16.00 18.94
The Group’s ten largest single borrowers as at the date indicated are as follows:
As at 31 December 2011(In millions of RMB, except percentages) Industry Amount % of total loans
Customer A Railway transport 30,517 0.47Customer B Production and supply of electricity and heat 14,810 0.23Customer C Road transport 14,480 0.22Customer D Road transport 13,056 0.20Customer E Railway transport 11,950 0.18Customer F Road transport 11,880 0.18Customer G Public utility management 11,408 0.18Customer H Road transport 10,922 0.17Customer I Road transport 10,858 0.17Customer J Road transport 10,467 0.16
Total 140,348 2.16

64 CHINA CONSTRUCTION BANK CORPORATION ANNUAL REPORT 2011
MANAGEMENT DISCUSSION AND ANALYSIS
Liquidity Risk ManagementLiquidity risk is the type of risk that occurs when, despite its debt servicing ability, the Group cannot obtain sufficient funds in time, or at a reasonable cost, to meet the needs of asset growth or repay liabilities as they are due. The Group’s objective for liquidity management is to maintain a reasonable level of liquidity, and ensure the payment and settlement security in compliance with the regulatory requirements, while striving to enhance fund yields by deploying its funds in an effective and reasonable way.
In 2011, the PBC raised the statutory reserve ratio six times, and included margin deposit into the statutory reserve requirement. Although the ratio was lowered once in December 2011, the liquidity in the interbank market remained tight. As a result, the surplus reserve rate of the Group
declined. In response to its liquidity situation, the Group took timely measures, including actively attracting deposits, raising the frequency of adjustments to the liquidity risk limit, and making adjustments to products with close relation to liquidity, such as debt securities, financial assets held under resale agreements, and deposits with banks and non-bank financial institutions, to make appropriate arrangements according to its fund position. Through these effective measures, the Group continued to maintain a reasonable level of liquidity, and ensured safe payment and settlement. The Group conducted regular stress tests on liquidity risk, in order to gauge the Bank’s risk tolerance in extreme scenarios of low probability and other adverse circumstances. The results showed that under stress scenarios, although liquidity risk did increase, it stayed within a tolerable limit.
The analysis of the remaining maturity of the Group’s assets and liabilities as at the balance sheet date is set out below:
As at 31 December 2011
(In millions of RMB) IndefiniteRepayable
on demandWithin
one month
Between one and
three months
Between three months and one year
Between one and
five yearsMore than five years Total
AssetsCash and deposits with central banks 1,996,932 382,877 – – – – – 2,379,809Deposits and placements with banks and non-bank financial institutions – 32,603 151,071 95,405 98,454 8,183 76 385,792Financial assets held under resale agreements – – 185,613 13,353 1,079 – – 200,045Loans and advances to customers 33,363 104,292 236,117 456,647 1,647,945 1,674,416 2,172,414 6,325,194Investments 35,471 – 31,820 66,655 317,496 1,289,446 1,002,931 2,743,819Other assets 138,347 31,518 14,631 25,221 28,087 4,689 4,682 247,175
Total assets 2,204,113 551,290 619,252 657,281 2,093,061 2,976,734 3,180,103 12,281,834
LiabilitiesBorrowings from central banks – 2,220 – – – – – 2,220Deposits and placements from banks and non-bank financial institutions – 445,029 320,833 156,922 57,350 64,820 – 1,044,954Financial liabilities at fair value through profit or loss – 12,682 8,460 3,182 9,304 – 28 33,656Financial liabilities sold under repurchase agreements – – 2,469 7,074 918 – – 10,461Deposits from customers – 5,396,360 844,136 896,678 2,145,634 694,911 9,731 9,987,450Debt securities issued – – 7,258 10,842 20,518 31,123 98,571 168,312Other liabilities 358 134,242 11,632 14,833 40,171 12,495 4,389 218,120
Total Liabilities 358 5,990,533 1,194,788 1,089,531 2,273,895 803,349 112,719 11,465,173
Long/(short) position in 2011 2,203,755 (5,439,243) (575,536) (432,250) (180,834) 2,173,385 3,067,384 816,661
Long/(short) position in 2010 1,823,563 (5,374,529) (458,072) (15,972) (245,271) 2,041,271 2,929,915 700,905

65CHINA CONSTRUCTION BANK CORPORATION ANNUAL REPORT 2011
sensitivity analysis, scenario simulation analysis and stress testing to enhance daily monitoring and regular reporting of interest rate risk. CCB actively carried out interest rate liberalisation research, standardised the management of interest calculation and settlement, and consolidated the interest rate risk management fundamentals. In 2011, the PBC lifted the benchmark deposits and lending interest rates three times. In response to the changing market conditions, CCB adopted flexible pricing techniques to improve assets and liabilities management with enhanced loan pricing levels, adjusted the maturity structure of the investment portfolio with higher portfolio returns, and facilitated the balanced development of funding and use of funds. In 2011, the overall interest rate risk of the Group was kept within the set tolerable level.
The Group regularly monitors the gap between its assets and liabilities for various maturities in order to assess its liquidity risk for different periods. As at 31 December 2011, the accumulated gap of various maturities of the Group was RMB816,661 million, an increase of RMB115,756 million over 2010. Despite the negative gap for repayment on demand totalling RMB5,439,243 million, the Group is expected to enjoy a stable funding source and maintain stable liquidity in the future given its strong and expansive deposit customer base, relatively stable core demand deposits, and steady growth in deposits.
Market Risk ManagementMarket risk is the risk of loss in respect of the Group’s on- and off-balance sheet activities, arising from adverse movements in market rates, including interest rates, foreign exchange rates, commodity prices and stock prices.
In 2011, the Bank proactively responded to the volatility in the global financial markets, refined its market risk management rules and policies, strengthened the monitoring and reporting of market risk, and promoted the development of risk measurement system and tools, further enhancing its market risk management capability.
Improvement of the market risk management rules and policies. The Bank made timely review on the risk policy and limit scheme for its financial market business. An investment approval process and post-investment management mechanism was established for credit-related debt securities investments. The internal control rules and process in financial markets activities were also reviewed, in order to strengthen risk management controls on the whole process.
Strengthening the monitoring and reporting of market risk . The Bank continued to increase its on-site inspections, strengthened the daily monitoring and reporting of the financial market business, and kept close watch on the performance of credit approval, authorisation and risk limits. Early risk warning and reminders were improved, and an early warning feedback mechanism was established.
Promoting the development of market risk measurement system and tools. The Bank continued to employ its financial market business risk management information system to conduct daily risk measurement and management, and rolled out treasury operations trading management system in overseas branches. The analysis and practical application of risk measurement methods including duration, VaR and stress value at risk were enhanced to raise the sophistication of the bank-wide market risk management.
Value at Risk analysisThe Bank has separated all the on- and off-balance sheet activities into two major categories, trading book and banking book. The Bank performs VaR analysis on its trading book to measure and monitor potential losses on positions due to movements in market interest rates, exchange rates and prices. The Bank calculates the VaR of RMB and foreign currency trading book on a daily basis (with a 99% confidence level and a one-day holding period). The VaR analysis on the Bank’s trading book as at the balance sheet date and for the respective period is as follows:
2011 2010
(In millions of RMB)As at
31 December Average Maximum MinimumAs at
31 December Average Maximum Minimum
VaR of trading book 57 90 263 12 43 39 95 8
– Interest rate risk 18 25 67 7 10 17 47 2
– Exchange rate risk 49 84 260 8 44 36 97 4
Interest rate risk managementInterest rate risk is the risk of loss in the overall income and economic value of the banking book as a result of adverse movements in interest rates, term structure and other interest-related factors. Repricing risk and basis risk arising from mismatch of term structure and pricing basis of assets and liabilities are the primary sources of interest rate risk for the Group. The overall objective of the Group’s interest rate risk management is to maintain steady growth of net interest income, while keeping interest rate risk within a tolerable risk level in accordance with the risk appetite and risk management parameters.
In 2011, CCB comprehensively revised the interest rate risk measurement rules for its banking book. It used multiple tools such as interest rate sensitivity gap, net interest income

66 CHINA CONSTRUCTION BANK CORPORATION ANNUAL REPORT 2011
MANAGEMENT DISCUSSION AND ANALYSIS
Interest rate sensitivity gap analysisThe analysis of the next expected repricing dates or maturity dates (whichever are earlier) of the Group’s assets and liabilities as at the balance sheet date is set out below:
As at 31 December 2011
(In millions of RMB) TotalNon-interest-
bearingLess than
three months
Between three months and one year
Between one year and
five yearsMore than five years
Assets
Cash and deposits with central banks 2,379,809 197,288 2,182,521 – – –
Deposits and placements with banks and non-bank financial institutions 385,792 – 279,079 105,486 1,151 76
Financial assets held under resale agreements 200,045 – 198,966 1,079 – –
Loans and advances to customers 6,325,194 – 3,485,517 2,746,432 26,964 66,281
Investments 2,743,819 24,811 258,463 465,984 1,098,204 896,357
Other assets 247,175 247,175 – – – –
Total assets 12,281,834 469,274 6,404,546 3,318,981 1,126,319 962,714
Liabilities
Borrowings from central banks 2,220 – 2,220 – – –
Deposits and placements from banks and non-bank financial institutions 1,044,954 – 948,479 58,520 37,955 –
Financial liabilities at fair value through profit or loss 33,656 12,683 11,669 9,304 – –
Financial assets sold under repurchase agreements 10,461 – 9,543 918 – –
Deposits from customers 9,987,450 44,435 7,185,234 2,057,323 692,825 7,633
Debt securities issued 168,312 – 18,100 20,518 31,123 98,571
Other liabilities 218,120 218,120 – – – –
Total Liabilities 11,465,173 275,238 8,175,245 2,146,583 761,903 106,204
Interest rate sensitivity gap in 2011 816,661 194,036 (1,770,699) 1,172,398 364,416 856,510
Accumulated interest rate sensitivity gap in 2011 (1,770,699) (598,301) (233,885) 622,625
Interest rate sensitivity gap in 2010 700,905 89,594 (1,981,441) 1,381,678 475,411 735,663
Accumulated interest rate sensitivity gap in 2010 (1,981,441) (599,763) (124,352) 611,311
As at 31 December 2011, the repricing structure of the Group’s assets and liabilities remained stable. The accumulated negative gap for a period less than one year was RMB598,301 million, which narrowed by RMB1,462 million compared to 2010, and continued to be liabilities sensitive.
The Group’s positive gap for a period more than one year was RMB1,220,926 million, which widened by RMB9,852 million, mainly because of longer duration of investment portfolio in debt securities, but partially offset by the rapid growth of time deposits.

67CHINA CONSTRUCTION BANK CORPORATION ANNUAL REPORT 2011
Net interest income sensitivity analysisNet interest income sensitivity analysis is based on two scenarios. The first is to assume that all yield curves fall or rise by 100 basis points in a parallel way; the second is to assume that the yield curve for demand deposits stays constant, while the other yield curves fall or rise by 100 basis points in a parallel way. The interest rate sensitivity of the Group’s net interest income is set out below.
Change in net interest income
(In millions of RMB)Increase by
100 basis pointsDecrease by
100 basis points
Increase by 100 basis points
(demand deposit rates being constant)
Decrease by 100 basis points
(demand deposit rates being constant)
As at 31 December 2011 (37,516) 37,516 21,061 (21,061)
As at 31 December 2010 (34,771) 34,771 21,214 (21,214)
Foreign exchange risk managementForeign exchange rate risk is the risk of there being an impact on the Bank’s financial position arising from adverse movement in foreign exchange rates. The Bank is exposed to foreign exchange rate risks primarily because it holds loans, deposits, marketable securities and financial derivatives that are denominated in currencies other than RMB.
In 2011, CCB established the foreign exchange risk management policies for its banking book. The policies set the management objectives and principles, management techniques and methods, as well as risk identification, measurement, monitoring and control rules, covering major management components including risk limits, scenario analysis, stress testing, contingency planning and risk reporting. The foreign exchange risk management module of the asset and liability management system was optimised, and the data of overseas branches were included into the measurement system. This enabled the Bank to gain the initial capabilities for daily automated measurement, monitoring and reporting of foreign exchange risk exposures.
In the second half of 2011, the Group’s net exposure of the foreign exchange risk decreased sharply, down by RMB21,325 million over the previous year. This was mainly because with the approval of SAFE, the Bank settled foreign exchange-denominated proceeds of US$3,500 million from its A-share and H-share rights issue in 2010, to avoid the risk of RMB exchange rate fluctuation.
Operational and Reputation Risk Management and Consolidated ManagementOperational risk is the potential of losses resulting from inadequate or flawed internal processes, people and systems, or from external events.
In 2011, focusing on key elements in respect of people, processes, systems, and external events, the Bank strengthened its operational risk management. It promoted the use of tools such as self-assessment, key risk points and loss data, conducted intensive monitoring and inspections on key risk points, and carried forward its business continuity management to secure the safe and stable operation of various businesses. This led to a marked improvement in operational risk management.
Strengthening the use of operational risk management tools. The Bank focused on conducting self-assessment of operational risk in areas such as off-balance sheet activities. This helped improve and optimise the corresponding rules, processes and service standards. The management of key risk indicators was promoted, the comprehensiveness and accuracy of loss data collection was enhanced, further strengthening the monitoring and early warning of key risks.
Deepened monitoring and examination of key risk points. The Bank re-examined, adjusted and extended the scope and contents of monitoring and examination. Increased focus was placed on operational risk controls over key business areas and key positions.
Strengthening the management of incompatible positions. The Bank reviewed the rules for segregation of incompatible positions and responsibilities, optimised the checks and balances over different departments and positions, and strengthened the rigid constraints of position checks and balances.
Refined management of employee behaviour. The Bank strengthened the regulation and management of the restrictive trading acts for specific staff positions in order to prevent insider trading. In addition, it paid increased focus on staff training and quality improvement, in order to prevent operational risks resulting from human factors.
Steadily promoting business continuity management. The Bank further promoted the contingency drills at pilot branches, refined the contingency strategy and mechanism towards natural disasters and emergencies in sub-branches and outlets. It also regulated and improved the contingency response system and mechanism for the major production systems, to enhance the Bank’s response capability in case of sudden safety issues with regards to production systems.
Strengthening the reporting management of major risks and emergencies. The Bank regulated the monitoring, information collection and reporting related to major risks and emergencies to ensure the smooth information reporting channel and cultivate quick response capability.

68 CHINA CONSTRUCTION BANK CORPORATION ANNUAL REPORT 2011
MANAGEMENT DISCUSSION AND ANALYSIS
Commencement of the advanced operational risk measurement method project. The Bank set to establish an appropriate advanced measurement approach, in order to enhance the effectiveness and sensitivity of operational risk management through scientific measurement of operational risk.
Improving internal control and operational risk management evaluat ion system for t ier-one branches. The Bank strengthened the guiding role of appraisal and evaluation, in order to further improve the overall internal control and operational risk management.
Reporting and Monitoring of Non-complianceBy the end of 2011, four criminal offences committed by employees who attempted to encroach on the Bank’s or customers’ fund had been reported to the Bank’s head office, involving an amount of RMB7.11 million. Of these, two cases involved an amount of RMB1 million or above, totalling RMB5.36 million. After investigation by the police, all the amount involved has now been recovered.
Anti-money LaunderingIn 2011, CCB strengthened the building of anti-money laundering (AML) management rules and policies. The data collection programme in the AML system was optimised, and the rules for the filtering of suspicious transactions was refined, to improve the quality of anti-money laundering data. It developed an AML customer risk classification system, implemented money laundering risk classification for customers, and actively prevented money laundering risks. CCB also earnestly assisted relevant departments with AML investigations in combating money laundering and terrorist financing activities. In addition, it carried out AML audits and reinforced trainings and information-sharing. This helped enhance the compliance of business operations and raised the level of anti-money laundering operations.
Reputation Risk ManagementIn 2011, CCB attached great importance to reputation risk management. A bank-wide video conference was held to strengthen the reputation risk awareness among all levels of management and staff, and a specialist was invited to share the knowledge on reputation risks. CCB improved its reputation risk management policies, regulated the media crisis response procedures, clarified duties and requirements, and improved accountability management. It adhered to the press spokesman mechanism, and persisted in monitoring media coverage, so as to gain positive public perception. Efforts in reputation risk management for subsidiaries and overseas entities were also intensified. In addition, educational trainings and emergency response exercises were organised to enhance the reputation risk management capabilities.
Consolidated ManagementConso l i da ted managemen t r e fe r s to t he B ank ’ s comprehensive and continuous management over the Group’s capital, finance and risks, besides the Bank’s single legal person management, so as to identify, measure, monitor and assess the overall risks of the Group as a whole. The consolidated management covers capital adequacy, large exposure, internal transactions, liquidity risk, operational risk, market risk, reputation risk and cross-border risk.
In 2011, CCB further improved its group consolidated management system, carried out on-site inspections, strengthened consolidated risk management, and promoted the development of a consolidated information system, with the consolidated management capabilities greatly improved.
Refinement of group consolidated management system. CCB formulated rules to strengthen the large exposure management and internal risk isolation and control, laying ground for sound consolidated management.
Conducting consol idated management inspections and assessment. In 2011, after in-depth analysis on its consolidated management status and the regulatory requirements, CCB established a consolidated management plan, and carried out comprehensive assessment of its subsidiaries’ operations, and inspections of concurrent posts and related businesses. In addition, CCB assisted the CBRC with the consolidated management research and on-site inspections.
Reinforcement of the consolidated management of large exposure. CCB included its subsidiaries into the scope of large exposure management. It established an identification, monitoring, early warning and reporting system for large exposures, further strengthening the comprehensive management for large exposures.
Launch of a consolidated management information system project. CCB developed a information submission platform for its subsidiaries, in order to integrate the financial statements and the underlying data submitted by the subsidiaries, and enhance the completeness and accuracy of the data, which will provide strong IT support to raising the consolidated management standard.
Internal AuditIn order to promote the establishment of a sound and effective risk management mechanism, internal control system and corporate governance procedures, the Group’s internal audit department puts forward suggestions for improvement on the basis of its audit. The department evaluates the effectiveness of the internal controls and risk management, the effect of corporate governance procedures, the efficiency of business operations, and the economic responsibilities of key managers. The department works in a relatively independent manner, and is managed vertically. It is responsible to and reports to the Board and the audit committee, as well as reports to the board of supervisors and senior management. There is an audit department at the head office, and 39 audit offices are at tier-one branches, responsible for managing and conducting audit projects.
In 2011, the internal audit department focused on important areas while taking a comprehensive view, and launched targeted audit projects by adhering to the philosophy of “concentrating on key issues, considering the overall situation, promoting development and creating value”. In addition, great efforts were taken to enhance the quality of audit work and strengthen the internal audit capability.

69CHINA CONSTRUCTION BANK CORPORATION ANNUAL REPORT 2011
Launch of targeted audit projects. For compliance audit, focus was placed on important areas that drew regulators’ attention and the Bank’s key tasks. For evaluation audit, focus was placed on the refinement of responsibilities. For audit analysis and research, focus was placed on the key issues in operational management. For application of audit results, focus was placed on the effectiveness. The department launched a total of 25 categories of audit or audit investigation projects across the Group, including audits of certain off-balance sheet products, and the New Basel Capital Accord related issues, audit investigation of personal customer relationship management, and audits of corporate liabilities business, credit approvals for certain corporate clients, IT operations at the branches, operations and management at overseas branches and subsidiaries. Audit offices conducted selected audit projects based on the specific operation, management and risk characteristics of respective branches, further supplementing the coverage and depth of the audits. The Board, board of supervisors and senior management attached great importance to the audit findings, actively urged the rectifications, and pushed branches and departments in the head office to reinforce risk controls and optimise related rules, business processes, and IT systems.
Enhancement of internal audit standard. The internal audit department developed various rules and standards with regard to the quality of audit work, focusing on the overall requirements and specific standards for audit quality. A pilot internal assessment programme was implemented to promote work quality and ability of audit offices.
Strengthening the internal audit team. Adopting various flexible methods, the department advocated job rotation, recruited staff, and optimised the staff structure. It also implemented various types of trainings targeted at different groups in order to build a professional and high-quality audit team.
Further specialisation of the internal audit. With refined mechanisms and intensified professional research, the department continued to maintain and develop its fundamental audit programmes. It also facilitated experience-sharing and promoted application of research findings.
Optimisation of audit technology and methods. The department continued to expand the application of its off-site audit system, optimise its audit model, and improve the monitoring system. It enhanced the internal audit evaluation tools, and optimised the management process for audit of economic responsibility during the term of office.
in 2012, the global economic environment is expected to become more severe, and China’s economic development faces numerous challenges. With the influence of the weak global economic recovery and domestic economic restructuring, China’s economic growth momentum will slow down. The growth rate of investment demand will decline, the actual growth rate of consumer demand will be relatively flat, and the growth rate of foreign trade economy will slow down further. Social financing and credit extension will grow steadily, and the effect of real estate control measures will become more apparent. The domestic economy will be operating
steadily as a whole, but energy and environmental constraints are becoming increasingly severe. Commercial banks face various risks including possible bursting of the real estate bubble, increased risks involved in cross-border investment by enterprises, and operating difficulties of some enterprises. Meanwhile, the CBRC announced new requirements on bank supervision and reform in the regulatory work conference and large commercial bank supervision meetings in 2012. Reform of interest rate liberalisation is also progressing steadily. All these require commercial banks to enhance their capabilities in terms of risk control, pricing properly and service innovation.
For the Group, on one hand, the economic slowdown may affect the low-end export manufacturing enterprises, small real estate enterprises, and enterprises with high pollution, high energy consumption and excess capacity, increasing pressures on the risk control of the Group with relation to these industries. More stringent regulatory requirements including capital requirement and fiercer competition among peers will impose higher requirements on the Group’s management capability. On the other hand, there are tremendous opportunities to be explored from the rapid growth in informatisation, industrialisation, urbanisation and agricultural modernisation. With the influence of government industrial policies, it is expected that credit needs in areas such as emerging industries, modern service industry and new countryside construction will increase. In addition, benefiting from rising income and policies encouraging consumption, the demand for personal consumer loans is expected to increase, which is favourable for the Group to promote credit structure adjustments.
In 2012, in light of the government macroeconomic policies and the development trend of the financial industry, the Group will steadily promote business transformation, mitigate business risks, make progress while maintaining stability, and strive to attain intensive development toward the direction of comprehensive operations and multi-functions. First, the Group will steadily develop its deposit business, consolidate its existing market share and improve the deposit structure. Second, the Group will deepen the credit structure adjustments, consolidate its traditional advantages in areas such as resources and infrastructure construction, strengthen its advantageous position in residential mortgage loans, support the credit card business development, maintain its leading position in the internet merchant loans and livelihood sector loans, and expand the scope of pilot schemes for new countryside construction loans. The growth rate of RMB-denominated loans for 2012 is expected to be around 12%. Third, the Group will promote the full development of its fee-based business with the support of the key products, and further enhance its market competitiveness. Fourth, the Group will strengthen its customer base by promoting the growth of customers, improving customer structure, and enhancing after-sale services to retain customers. Fifth, the Group will strengthen the development of its distribution channels, and promote the electronic banking business, in order to extend its financial services reach while constantly improving customer experience. Last but not least, the Group will improve its overall risk management capability, reinforce internal control, and mitigate its credit risks in key areas including government financing vehicles in order to prevent the rebound of non-performing loans.

70 CHINA CONSTRUCTION BANK CORPORATION ANNUAL REPORT 201170 CHINA CONSTRUCTION BANK CORPORATIONCC ANNUAL REPORT 2011
Assume fullresponsibilities as a corporate citizen RMB
46.25mContribution to public welfare projects

71CHINA CONSTRUCTION BANK CORPORATION ANNUAL REPORT 2011 71CHINA CONSTRUCTION BANK CORPORATIONC ANNUAL REPORT 2011
64,000The number of impoverished high school students supported by CCB 7,238
The number of impoverished mother of heroes and exemplary workers supported by CCB
In 2011, the Bank upheld its social responsibility strategies of becoming “a bank that strives to serve the public, improve people’s life, stick to the principle of low carbon and environmental protection, and achieve sustainable development”, and proactively fulfilled its social responsibilities, demonstrating a good corporate citizen image.

72 CHINA CONSTRUCTION BANK CORPORATION ANNUAL REPORT 2011
In 2011, the Bank upheld its social responsibility strategies of becoming “a bank that strives to serve the public, improve people’s life, stick to the principle of low carbon and environmental protection, and achieve sustainable development”, and proactively fulfilled its social responsibilities, demonstrating a good corporate citizen image.
to deepen the “customer-focused” philosophy, and respond actively to the experience and requirements of its customers. There were continuous innovation and improvements in business processes to raise its customer service capability, leading to improved customer satisfaction.
that improves people’s life. National infrastructure and key investment projects were enthusiastically supported. Loans granted to livelihood sectors such as small enterprises, “agriculture, farmers and rural areas” businesses, and indemnificatory housing construction substantially increased. Great focus was placed on improving the financial services to small and micro-enterprises.
the principle of low carbon and environmental protection. It proactively fulfilled its environmental responsibilities, by supporting the development of emerging industries, and expanding the credit granted to green sectors such as energy saving and emission reduction, low-carbon economy, clean energy, green ecology and cyclic
economy, making unrelenting efforts towards environmental protection and ecological infrastructure.
With full attention on meeting the expectations of its stakeholders, it well balanced factors such as current and long-term goals, the relationship between part and the whole, and speed and quality. Its various businesses maintained healthy development, making new contributions to national economic and social development.
In 2011, the Group contributed a total of RMB46.25 million to 15 key public welfare projects.
Promoting long-term public welfare projects . The Group continued to promote long-term public welfare projects such as CCB Hope Primary Schools, “Passion to Tibet – Scholarships and Grants”, “Programme for Impoverished High School Students”, “Scholarships and Grants for College Students from Ethnic Minorities” and “Sponsorship Programme for Impoverished Mothers of Heroes & Exemplary Workers”. By the end of 2011, the Group had built and maintained a total of 38 CCB Hope Primary Schools, built 73 sports grounds and libraries, and sponsored training
A publicservingbank
A sustainabledevelopment
bank
A low-carbon,environmentally
friendly bank
A livelihoodpromoting
bank

73CHINA CONSTRUCTION BANK CORPORATION ANNUAL REPORT 2011
courses for 118 teachers on an accumulative basis. The “Passion to Tibet – CCB & Jianyin Scholarships and Grants” had extended financial support of RMB920,000 to 440 impoverished students in Tibet. “Programme for Impoverished High School Students” had granted RMB89 million to 64,000 impoverished high school students. Through the “CCB Scholarships and Grants for College Students from Ethnic Minorities”, the Group had granted RMB22 million to 7,833 impoverished ethnic minority college students on a cumulative basis. The Group also granted RMB20.17 million to 7,238 impoverished mothers of heroes and exemplary workers.
Implementing innovative public welfare projects. The Group initiated the implementation of the online public welfare campaign “The public welfare donation is up to you – CCB invites you to join the action” and contributed a total of RMB5 million to five public welfare organisations. This donation was used to start the entrepreneurial assistance programme for migrant workers, support the education and teaching costs of BN vocational school, provide treatment for blind children and orphans, help support treatment of autistic children, and help the orphans in disaster stricken areas such as Yushu, Qinghai province.
Fully committed to the disaster rescue and relief efforts and post-disaster reconstruction . To help the people in areas stricken by earthquakes, severe droughts, floods and other natural disasters, our staff demonstrated their concern by donating of their own accord, besides the full support of financial services. A total of RMB16.20 million was raised for disaster-stricken areas such as Yunnan and Guizhou provinces to help people there fight against earthquakes and severe droughts.
Actively involved in campaigns promoting environmental protection, energy saving and emission reduction. It supported the “Greening the Yangtze River – Chongqing Action”, a reforestation charity initiative to restore and preserve the ecological environment along the Yangtze River and Three Gorges reservoir. In 2011, the Bank organised all branches to participate in the global campaign of “Earth Hour”, in order to advocate the concept of low carbon life and raise the awareness of environmental protection among its employees.
Actively supporting public welfare causes including health care, policy research and academic exchange . The Group donated RMB7 million to China Women’s Development Foundation in support of the “Mothers’ Health Express – CCB Sponsorship Programme”. It also contributed RMB3 million to China Institute for Reform and Development to establish a “Fund for Doctoral and Post-Doctoral Studies in Economic and Social Reform”.
In 2011, the Bank won numerous honours for its social responsibil ity efforts including the “People’s Social Responsibility Award” by people.com.cn, “Most Responsible Corporate Citizen “award from China Newsweek, “Best Social Responsibility Institution Award” from China Banking Association, and “Best Corporate Social Responsibility Award” from The Chinese Banker magazine. The Bank ranked first in the banking sector in the “Top 100 China Corporate Social Responsibility” released by Fortune China.
A CCB Guangdong Branch’s associate and a student supported by CCB’s programme for impoverished high school students

74 CHINA CONSTRUCTION BANK CORPORATION ANNUAL REPORT 2011
Changes in SharesUnit: share
1 January 2011 Increase/(Decrease) during the reporting period 31 December 2011
Number of shares Percentage (%)
Issuance of
additional shares Bonus issue
Shares
converted from
capital reserve Others Sub-total Number of shares Percentage (%)
I. Shares subject to selling restrictions
1. State-owned shares – – – – – – – – –
2. Shares held by state-owned legal persons – – – – – – – – –
3. Shares held by foreign investors1 25,580,153,370 10.23 – – – (25,580,153,370) (25,580,153,370) – –
II. Shares not subject to selling restrictions
1. RMB ordinary shares 9,593,657,606 3.84 – – – – – 9,593,657,606 3.84
2. Overseas listed foreign investment shares 65,070,889,129 26.03 – – – 26,034,540,370 26,034,540,370 91,105,429,499 36.44
3. Others2 149,766,277,381 59.90 – – – (454,387,000) (454,387,000) 149,311,890,381 59.72
III. Total number of shares 250,010,977,486 100.00 – – – – – 250,010,977,486 100.00
1. H-shares of the Bank held by Bank of America.2. H-shares of the Bank free from selling restrictions held by the promoters of the Bank, i.e. Huijin, Baosteel Group, State Grid, and Yangtze Power.
Changes in Shares Subject to Selling RestrictionsUnit: share
Name of shareholder
Number of
shares subject to
restrictions at
the beginning of the year
Number of
shares released
from restrictions
during the year
Number of
new shares subject
to restrictions
in the year
Number of
shares subject to
restrictions at
the end of the year Reason for restrictions
Date of release from
restrictions
Bank of America 25,580,153,370 25,580,153,370 – – The 25,580,153,370 H-shares acquired by Bank
of America through exercise of the call options in
2008 shall not be transferred without the Bank’s
written consent before 29 August 2011 unless
under exceptional circumstances.
29 August 2011
Details of Securities Issuance and ListingPursuant to resolutions in the annual general meeting of 2009, the first A shareholders class meeting of 2010 and the first H shareholders class meeting of 2010, upon approvals by domestic and overseas regulatory bodies, the Bank implemented the rights issue plan of A-shares and H-shares in year 2010 and allotted the rights shares to A shareholders and H shareholders on the basis of 0.7 rights shares for every 10 existing shares. The Bank issued 593,657,606 A rights shares and 15,728,235,880 H rights shares at a price of RMB3.77 per share and HK$4.38 per share respectively, the dealings of which commenced on 19 November 2010 and 16 December 2010 respectively. After the completion of the rights issue, the total shares of the Bank increased to
250,010,977,486 shares, including 9,593,657,606 A-shares and 240,417,319,880 H-shares. The net proceeds raised from the rights issue are equivalent to RMB61,159 million, all of which are used to strengthen the capital base of the Bank.
Pursuant to the resolution of the first extraordinary general meeting of 2011, upon approvals of the CBRC and PBC, in November 2011, the Bank issued subordinated bonds of RMB40 billion in the national interbank bond market, with a term of 15 years and a fixed coupon rate of 5.70%. At the end of the tenth year, the issuer has an option to redeem the bonds with conditions. The proceeds from the issuance of subordinated bonds had been transferred to the account of the Bank, which are used to replenish the supplementary capital of the Bank.

75CHINA CONSTRUCTION BANK CORPORATION ANNUAL REPORT 2011
Number of Shareholders and Particulars of ShareholdingsAt the end of the reporting period, the Bank had a total of 887,132 shareholders, of which 54,876 were holders of H-shares and 832,256 were holders of A-shares. At the end of February 2012, the Bank had a total of 875,700 shareholders, of which 54,595 were holders of H-shares and 821,105 were holders of A-shares.
Unit: share
Total number of shareholders 887,132 (Total number of registered holders of A-shares and H-shares as at 31 December 2011)
Particulars of shareholdings of the top ten shareholders
Name of shareholder Nature of shareholder
Shareholding
percentage (%) Total number of shares held
Number of
shares subject to
selling restrictions
Number of
shares pledged
or frozen
Huijin1 State-owned 57.03 142,590,494,651 (H-shares) None None
State-owned 0.10 245,375,672 (A-shares) None None
HKSCC Nominees Limited2 Foreign legal person 24.88 62,204,935,507 (H-shares) None Unknown
Temasek2 Foreign legal person 9.06 22,655,348,797(H-shares) None None
Baosteel Group State-owned 1.12 2,810,000,000 (H-shares) None None
State-owned 0.13 318,860,498 (A-shares) None None
State Grid2, 3 State-owned 1.16 2,895,782,730 (H-shares) None None
Best Investment Corporation2, 4 State-owned 1.10 2,760,000,000 (H-shares) None None
Bank of America Foreign legal person 0.80 2,000,000,000 (H-shares) None None
China Ping An Life Insurance Company Limited – Traditional
– Ordinary insurance products Domestic non-state-owned legal person 0.55 1,371,290,467 (A-shares) None None
Yangtze Power2 State-owned 0.41 1,015,613,000 (H-shares) None None
Reca Investment Limited Foreign legal person 0.34 856,000,000 (H-shares) None None
1. Huijin is a wholly state-owned company, which is wholly owned by CIC. Huijin makes equity investment in key state-owned financial institutions as authorized by the State Council, and exercises the contributor’s rights and obligations in the Bank up to its contribution on behalf of the state.
2. In November 2011, Temasek declared interests on the website of the Hong Kong Stock Exchange. It disclosed that it held the interests of 22,655,348,797 H-shares of the Bank. As at 31 December 2011, State Grid, Best Investment Corporation, and Yangtze Power held 2,895,782,730 H-shares, 2,760,000,000 H-shares and 1,015,613,000 H-shares of the Bank respectively, all of which were held under the name of HKSCC Nominees Limited. Besides the H-shares of the Bank held by Temasek, State Grid, Best Investment Corporation, and Yangtze Power, another 62,204,935,507 H-shares of the Bank were held under the name of HKSCC Nominees Limited.
3. As at 31 December 2011, the holding of H-shares of the Bank by State Grid through its wholly-owned subsidiaries was as follows: Yingda International Holdings Group Co. Ltd. held 856,000,000 shares, State Grid International Development Limited held 1,315,282,730 shares, Shandong Luneng Group Co., Ltd. held 374,500,000 shares and State Grid International Development Co., Ltd. held 350,000,000 shares.
4. Best Investment Corporation is a subsidiary engaged in overseas investment, which is indirectly held by CIC through CIC International.
Substantial Shareholders of the BankAt the end of the reporting period, Huijin held 57.13% of the shares of the Bank. Huijin is the controlling shareholder of the Bank. Huijin is a wholly state-owned investment company established in accordance with the Company Law on 16 December 2003 with the approval of the State Council. Its registered capital and paid-in capital are both RMB828,209 million. Its legal representative is Mr. Lou Jiwei. Huijin makes equity investment in key state-owned financial institutions as authorized by the State Council, and exercises the contributor’s rights and obligations in the Bank up to its
contribution on behalf of the state to achieve preservation and appreciation of state-owned financial assets.
Please refer to the Announcement on Matters related to the Incorporation of China Investment Corporation published by the Bank on 9 October 2007 for details of CIC.
At the end of the reporting period, there were no other institutional shareholders holding 10% or more of shares of the Bank (excluding HKSCC Nominees Limited). There were no internal staff shares.

76 CHINA CONSTRUCTION BANK CORPORATION ANNUAL REPORT 2011
The Bank is committed to maintaining high-level corporate governance practice. In strict compliance with China’s Company Law, Law on Commercial Banks and other laws and regulations, as well as the listing rules of the relevant stock exchanges, the Bank optimised its corporate governance structure and improved related rules based on its corporate governance practices. During the reporting period, the Bank elected new non-executive directors and a shareholder representative supervisor, and formulated the Internal Control Implementation Work Plan and Measures on Accountability of Major Mistakes in Disclosure of Annual Report Information.
The Bank has complied with the code provisions of the Code on Corporate Governance Practices as set out in Appendix 14 of the Listing Rules of Hong Kong Stock Exchange. The Bank has also substantially complied with the recommended best practices therein. During the reporting period, the Bank recorded and registered information of relevant insiders, and neither illegal insider trading nor abnormal movement of stock price caused by leaks of insider information was found.
SHAREHOLDERS’ GENERAL MEETINGPowers of shareholders’ general meetingThe shareholders’ general meeting is the authoritative body of the Bank and mainly exercises the following powers:
of the Bank;
employee representative supervisors), and determining the remuneration of relevant directors and supervisors;
budgets, final accounts, profit distribution plans and loss recovery plans;
of registered capital, and merger, split, dissolution and liquidation of the Bank;
corporate bonds or other marketable securities;
repurchase of the Bank’s shares;
certified public accountants;
corporate governance documents of the Bank.
Details of shareholders’ general meetings convenedOn 9 June 2011, the Bank held the 2010 annual general meeting, which considered and approved the 2010 report of the board of directors, report of the board of supervisors, final financial accounts, profit distribution plan, 2011 fixed assets investment budget, appointment of auditors of the Bank for 2011, purchase of a business processing centre for the head office and election of directors. The executive directors Mr. Guo Shuqing, Mr. Zhang Jianguo, Mr. Chen Zuofu and
Mr. Zhu Xiaohuang, the non-executive directors Mr. Wang Yong, Ms. Wang Shumin, Mr. Zhu Zhenmin, Ms. Li Xiaoling, Ms. Sue Yang, Mr. Lu Xiaoma and Ms. Chen Yuanling, and the independent non-executive directors Lord Peter Levene, Mr. Yam Chi Kwong, Joseph, Rt Hon Dame Jenny Shipley, Ms. Elaine La Roche, Mr. Zhao Xijun and Mr. Wong Kai-Man attended the 2010 annual general meeting. The attendance rate of directors was 100%. The domestic and international auditors of the Bank also attended the meeting.
On 18 August 2011, the Bank held the first extraordinary general meeting of 2011, which considered and approved the issuance of RMB-denominated subordinated bonds and the election of a shareholder representative supervisor. The executive directors Mr. Guo Shuqing, Mr. Zhang Jianguo, Mr. Chen Zuofu and Mr. Zhu Xiaohuang, the non-executive directors Mr. Wang Yong, Mr. Zhu Zhenmin, Ms. Li Xiaoling, Mr. Lu Xiaoma and Ms. Chen Yuanling, and the independent non-executive directors Mr. Yam Chi Kwong, Joseph, Rt Hon Dame Jenny Shipley, Mr. Zhao Xijun and Mr. Wong Kai-Man attended the first extraordinary general meeting of 2011.
The above shareholders’ general meetings were held in compliance with relevant legal procedures, the resolutions of which were published on the websites of the stock exchanges, and on the China Securities Journal and Shanghai Securities News.
BOARD OF DIRECTORSResponsibilities of the BoardThe Board is the executive body of the shareholders’ general meeting, which is responsible to the general meeting of shareholders, and performs the following duties in accordance with relevant laws:
reporting to the general meeting of shareholders;
shareholders;
supervising the implementation of the development strategy;
capital allocation plans of the Bank;
plans, profit distribution plans and loss recovery plans;
registered capital, the issuance and listing of convertible bonds, subordinated bonds, corporate bonds or other marketable securities; and plans related to merger, split, dissolution and liquidation of the Bank;
repurchase of the Bank’s shares;
of the Bank and authorised by the general meeting of shareholders.

77CHINA CONSTRUCTION BANK CORPORATION ANNUAL REPORT 2011
The Board’s implementation of resolutions of the general meeting of shareholdersIn 2011, the Board strictly implemented the resolutions of shareholders’ general meeting and matters authorised by the shareholders’ general meeting to the Board, earnestly implementing the proposals approved by the shareholders’ general meeting, including the profit distribution plan for 2010, appointment of annual auditors for 2011, and the issuance of RMB-denominated subordinated bonds.
Composition of the BoardCurrently the Board comprises 15 directors, including four executive directors, namely, Mr. Wang Hongzhang, Mr. Zhang Jianguo, Mr. Chen Zuofu and Mr. Zhu Xiaohuang; six non-executive directors, namely, Mr. Wang Yong, Mr. Zhu Zhenmin, Ms. Li Xiaoling, Mr. Lu Xiaoma, Ms. Chen Yuanling and Mr. Dong Shi; and five independent non-executive directors, namely, Lord Peter Levene, Mr. Yam Chi Kwong, Joseph, Rt Hon Dame Jenny Shipley, Mr. Zhao Xijun and Mr. Wong Kai-Man.
Chairman and presidentMr. Wang Hongzhang is the chairman of the Board and the legal representative of the Bank, and is responsible for the business strategy and overall development of the Bank.
Mr. Zhang Jianguo is the president of the Bank, and is responsible for the daily management of the Bank’s business operations. The president is appointed by the Board, responsible to the Board, and performs his duties in accordance with provisions of the Articles of Association and authorisation of the Board.
The roles of the chairman of the Board and the president are separate, each with clearly defined duties.
Appointment and re-election of directorsThe term of office of directors of the Bank is three years (ending on the date of the annual general meeting of the final year in their term of office), and directors may be re-elected upon expiration of their term of office.
Upon election at the Bank’s first extraordinary general meeting and Board meeting in 2012 and the approval of the CBRC, Mr. Wang Hongzhang commenced his position as chairman and executive director of the Bank from January 2012.
Upon election at the Bank’s 2010 annual general meeting and approval of the CBRC, Mr. Dong Shi commenced his position as non-executive director of the Bank from September 2011.
Operation of the BoardThe Board convenes regular meetings, generally no less than four times a year; extraordinary meetings are convened if and when necessary. Board meetings may be convened by means of on-site conference or written resolutions. The agenda for regular board meetings are scheduled upon consultation with each director. Board meeting documents and relevant materials are usually circulated to all directors and supervisors 14 days in advance of board meetings.
All directors keep contact with the secretary to the Board and the company secretary, to ensure compliance with board procedures and all applicable rules and regulations. Detailed minutes of board meetings are kept, and minutes are circulated to all attending directors for review after the meeting. Directors will provide revising suggestions after receiving the minutes. After the minutes are finalised, the secretary to the Board will circulate the minutes to all directors as soon as possible. Minutes of the board meetings are kept by the secretary to the Board, and are available for review by directors at any time.
Communication and reporting mechanism has been established between the Board, directors and senior management. The president reports his work to the Board on a regular basis, and is supervised by the Board. Relevant senior executives are invited to attend board meetings from time to time to provide explanations or reply to enquiries.
At board meetings, directors can put forward their opinions freely, and major decisions shall only be made after deliberate discussions. Directors may also engage external advisers following certain procedures, at the Bank’s expense, to provide independent professional advice if they deem necessary. If any director has material interests in a proposal to be considered by the Board, the director to whom it concerns must abstain from the discussion and voting of the relevant proposal, and will not counted in the quorum of the relevant proposal.
Induction programmes are organised to provide new directors with basic information of the Bank, and relevant rules and regulations which the directors shall abide by in performing their functions and duties, and to assist them getting familiar with the management, operations and governance practices. The Bank also periodically organises trainings for all directors, and encourages them to participate in professional development seminars and courses organised by professional institutions, in order to help them understand the latest development of or changes to the laws and regulations relevant to performing their duties.
The Bank effected directors’ liability insurance policy for all directors in 2011.
Compliance with Model Code for Securities Transactions by DirectorsThe Bank has adopted a code of practice in relation to securities transactions by directors and supervisors as set out in the Model Code for Securities Transactions by Directors of Listed Issuers in Appendix 10 of the Listing Rules of Hong Kong Stock Exchange. All directors and supervisors had complied with the provisions of this code in the year ended 31 December 2011.

78 CHINA CONSTRUCTION BANK CORPORATION ANNUAL REPORT 2011
CORPORATE GOVERNANCE REPORT
Board meetingsIn 2011, the Board convened eight meetings in total on 25 March, 28 April, 16 May, 10 June, 19 August, 28 October, 29 November and 16 December respectively, all of which were convened by means of on-site conference. Major resolutions approved by the board meetings included the Bank’s operational plan, fixed assets investment budget, financial reports, profit distribution, election of director candidates and appointment of senior management personnel, etc. Relevant information was disclosed pursuant to the provisions in relevant laws, regulations and listing rules of the listing venues. Individual attendance records of the directors in board meetings in 2011 are set out as follows:
Board members
Number of meetings attended in person/Number of meetings during
term of office
Number of meetings attended
by proxy/Number of meetings during
term of office Attendance rate (%)
Executive directorsMr. Wang Hongzhang – – –Mr. Zhang Jianguo 8/8 0/8 100Mr. Chen Zuofu 8/8 0/8 100Mr. Zhu Xiaohuang 6/8 2/8 100
Non-executive directorsMr. Wang Yong 8/8 0/8 100Mr. Zhu Zhenmin 8/8 0/8 100Ms. Li Xiaoling 8/8 0/8 100Mr. Lu Xiaoma 7/8 1/8 100Ms. Chen Yuanling 8/8 0/8 100Mr. Dong Shi 3/3 0/3 100
Independent non-executive directorsLord Peter Levene 3/8 4/8 87.5Mr. Yam Chi Kwong, Joseph 6/8 2/8 100Rt Hon Dame Jenny Shipley 6/8 2/8 100Mr. Zhao Xijun 8/8 0/8 100Mr. Wong Kai-Man 8/8 0/8 100
Resigned directorsMr. Guo Shuqing 6/6 0/6 100Ms. Wang Shumin 2/3 1/3 100Ms. Sue Yang 4/5 1/5 100Ms. Elaine La Roche 3/3 0/3 100
Performance of duties by independent directorsCurrently the Bank has five independent non-executive directors, representing one third of the total number of directors of the Bank, which is in compliance with the provisions of relevant laws, regulations and Articles of Association of the Bank. The independent non-executive directors of the Bank do not have any business or financial interests in the Bank and its subsidiaries, neither do they assume any management positions in the Bank, both of which effectively ensure their independence. The independence of non-executive directors of the Bank was in compliance with the relevant regulatory requirements.
Currently, the audit committee, risk management committee, nomination and compensation committee and related party
transactions committee under the Board are all chaired by independent non-executive directors. In 2011, the independent non-executive directors actively attend the board meetings and relevant special committees. During the session of meetings, our independent non-executive directors enhanced their understanding about business development of branches and subsidiaries by means of on-site investigation and informal discussion. The independent non-executive directors of the Bank gave their opinions actively on board meetings, and provided suggestions on the business development and significant decisions of the Bank, which promoted the scientific decision-making of the Board. During the reporting period, the Bank’s independent non-executive directors did not raise any objections to the relevant matters reviewed by the Board.

79CHINA CONSTRUCTION BANK CORPORATION ANNUAL REPORT 2011
Special statement and independent opinion given by the independent directors regarding the external guarantees provided by the BankPursuant to the relevant provisions and requirements under the circular of Zheng Jian Fa [2003] No. 56 issued by the CSRC, the independent directors of the Bank, including Lord Peter Levene, Mr. Yam Chi Kwong, Joseph, Rt Hon Dame Jenny Shipley, Mr. Zhao Xijun and Mr. Wong Kai-Man made the following statements on external guarantees provided by the Bank based on the principles of fairness, justice, and objectiveness.
The external guarantee business provided by the Bank has been approved by the PBC and the CBRC, and is part of the ordinary business of the Bank. With regard to the risks arising from guarantee business, the Bank formulated specific management measures, operational processes and approval procedures, and carried out the business accordingly. The guarantee business of the Bank is mainly in the form of letter of guarantees. As at 31 December 2011, the balance of letter of guarantees issued by the Group was approximately RMB628,600 million.
Delegation by the BoardThe division of power between the Board and senior management is implemented in strict compliance with the Articles of Association of the Bank and other corporate governance documents. By virtue of the authorization conferred by the Articles of Association and the Board, the president makes decisions within his scope of authority on operations, management and other issues to be decided, including:
and initiating the implementation of board resolutions;
the Bank to the Board and implementing the proposals upon approval of the Board;
management departments;
vice presidents and other senior management officers (excluding the chief audit officer and the secretary to the Board);
Association of the Bank and the Board.
Accountability of the directors in relation to the financial reportThe directors are responsible for overseeing the preparation of the financial report for each financial period to give a true and fair view of the Group’s state of affairs, performance results and cash flow for that period. In preparing the financial report for the year ended 31 December 2011, the directors
have selected appropriate accounting policies, applied them consistently, and made judgements and estimates that are prudent and reasonable.
During the reporting period, in accordance with the provisions of relevant laws, regulations and listing rules, the Bank has released 2010 annual report, the report for the first quarter of 2011, half-year report 2011, and the report for the third quarter of 2011 on time.
Independent operating capability of the BankThe Bank is independent from its controlling shareholder Huij in with respect to business, personnel, assets, organisations and finance. The Bank has independent and complete operating assets, independent operating capability and the ability to survive in the market on its own strength.
Internal transactionsThe internal transactions of the Bank cover credit and guarantees, asset transfer, receivables and payables, service charges, and agency transactions between the Bank and subsidiaries as well as between the subsidiaries. The internal transactions of the Bank were in line with regulatory requirements, and did not bring about the negative impact upon the Group’s sound operation.
Please refer to Note “the relationship among related parties and the transactions” – “the Trading between the Bank and the Subsidiaries” in the “Financial Statements” of this annual report for details of the internal transactions as defined by domestic laws and regulations.
Impact of restructuring, reorganization and others on peer competition and related party transactionDuring its restructuring, the former China Construction Bank was split into the Bank and Jianyin. Jianyin is positioned as a company for investment and disposal of financial assets, which has no conflict with the positioning of the Bank and would not lead to the problem of peer competition.
In July 2009, Jianyin transferred all of its shares of the Bank to Huijin. According to provisions of the Rules Governing the Listing of Stocks on Shanghai Stock Exchange, transactions between Jianyin and the Bank would not be regarded as related party transactions.
The Bank had no issues of peer competition or related party transactions caused by character of the industry, state policies, or mergers and acquisitions.
Internal controlThe Board is responsible for establishing and maintaining an adequate internal control system for financial reports. The internal control of financial reports aims to assure the truthfulness, completeness and reliability of financial reports, and to prevent significant misreporting risk. The Board has evaluated the internal control relating to financial reports pursuant to the Basic Standard for Enterprises Internal Control, and deemed that it was effective on 31 December 2011.

80 CHINA CONSTRUCTION BANK CORPORATION ANNUAL REPORT 2011
CORPORATE GOVERNANCE REPORT
In the process of the internal control evaluation, the Bank has not found material and important internal control defects in areas that are not related to financial reports. And the matters that need to be improved did not constitute material impact on the Bank’s operations and management. The Bank has paid keen attention to such matters and will take further action for continuing improvement.
According to the regulatory requirements, the Bank thoroughly implemented the Basic Standard for Enterprises Internal Control and the guidelines ancillary thereto issued by five ministries/commissions including the Ministry of Finance. With the direct guidance of the Board, the board of supervisors and the senior management, the Internal Control Management Committee Office functions as the main body for organisation, promotion, coordination, instruction and training, with the participation of all employees. The internal control standard was implemented throughout the bank on a gradual basis, with the head office first, and branches next; pilot first, and rolling-out next.
In 2011, five parts of work were conducted for the internal control construction of the Bank, namely, the clearing up of internal controls, building of the system of management rules, self-evaluation of the effectiveness of the operations, rectification and improvement, and promotion and training. The Bank focused on overall internal control, which embraces the reorganisation and self-evaluation of the effectiveness of financial reports internal control and as well as internal control that is not related to financial reports.
According to the standard and requirement of the Basic Standard for Enterprises Internal Control, the Bank also developed a set of unified reorganisation tools and methods suitable for the Bank, focusing on the framework of five elements, which includes the internal environment, risk evaluation, control activity, information and communication and internal supervision. The Bank took the duties of departments as the starting point, and the process flow as the orientation, and reorganised, consolidated, improved and completed the internal control in full swing. It made the handbook of internal control for the head office and branches, and completed the chart for risk control of the main business processes of the Bank, establishing the basic framework of the internal control for the Bank. In addition, the Bank improved the internal control management system by formulating a series of documents including the Basic Regulations for Internal Control, which provided the management mechanism and regulation support for on-going internal control.
In addition, the Bank formulated a proposal for the standardisation of evaluation of effectiveness of the operation of internal control, based on the rules for evaluation of internal control. It organised the testing and evaluation of the effectiveness of the operation of internal control throughout the Bank. By finding out and correcting the problems within internal control, the Bank has established the management mechanism for self-correction, self-improvement and constant improvement.
The five-year development plan of internal control of the Bank makes the objective, task, responsibility and timeline clear, setting the path for the Bank to develop its internal control system effectively and continuously with specific plans and steps.
In August 2011, the Board approved the Measures on Accountability of Major Mistakes in Disclosure of Annual Report Information and established the rules for the accountability of major mistakes.
COMMITTEES UNDER THE BOARDThere are five committees established under the Board: the strategy development committee, audit committee, risk management committee, nomination and compensation committee and related party transactions committee. Among these committees, more than half of the members of the audit committee, nomination and compensation committee and related party transactions committee are independent non-executive directors.
Strategy development committeeThe strategy development committee consists of 13 directors. Mr. Wang Hongzhang, chairman of the Board, currently serves as chairman of the strategy development committee. Members include Mr. Wang Yong, Lord Peter Levene, Mr. Zhu Xiaohuang, Mr. Zhu Zhenmin, Mr. Yam Chi Kwong, Joseph, Ms. Li Xiaoling, Rt Hon Dame Jenny Shipley, Mr. Zhang Jianguo, Mr. Lu Xiaoma, Ms. Chen Yuanling, Mr. Chen Zuofu and Mr. Dong Shi.
The primary responsibilities of the strategy development committee include:
assessing implementation thereof;
the Bank;
liability management targets;
businesses;
and
In 2011, the strategy development committee convened four meetings in total, strengthening the analysis and judgement of the macroeconomic and financial situation, promoting the compilation and implementation of the overall strategic plan of the Bank, improving the business structure adjustment and strategic emerging business development and promoting the continuous improvement of service and supporting capability from the middle and back offices.

81CHINA CONSTRUCTION BANK CORPORATION ANNUAL REPORT 2011
Members of strategy development committee
Number of meetings attended in person/
Number of meetings during term of office
Number of meetings attended by proxy/
Number of meetings during term of office Attendance rate (%)
Mr. Wang Hongzhang – – –Mr. Wang Yong 4/4 0/4 100Lord Peter Levene 3/4 1/4 100Mr. Zhu Xiaohuang 4/4 0/4 100Mr. Zhu Zhenmin 4/4 0/4 100Mr. Yam Chi Kwong, Joseph 4/4 0/4 100Ms. Li Xiaoling 4/4 0/4 100Rt Hon Dame Jenny Shipley 3/4 1/4 100Mr. Zhang Jianguo 4/4 0/4 100Mr. Lu Xiaoma 4/4 0/4 100Ms. Chen Yuanling 4/4 0/4 100Mr. Chen Zuofu 4/4 0/4 100Mr. Dong Shi 1/1 0/1 100
Resigned membersMr. Guo Shuqing 3/3 0/3 100Ms. Wang Shumin 1/1 0/1 100Ms. Sue Yang 2/3 1/3 100Ms. Elaine La Roche 1/1 0/1 100
In 2012, the strategy development committee shall improve the research on the macroeconomic and financial situation, continuously accelerate the transformation of development mode, deepen business structure and income structure adjustments, implement the development plan for 2011 to 2015, and strengthen supervision and valuation, continue to consolidate traditional business advantage, improve strategic emerging business development, mainly focusing on the fundamental construction, including customers, products and channels, improving the long-term competitiveness and future development capability.
Audit committeeThe audit committee consists of five directors. Mr. Wong Kai-Man, an independent non-executive director, currently serves as chairman of the audit committee. Members include Ms. Li Xiaoling, Rt Hon Dame Jenny Shipley, Mr. Zhao Xijun and Mr. Dong Shi.
The composition of the audit committee of the Bank is in compliance with domestic and overseas regulatory requirements. The primary responsibilities of the audit committee include:
accounting information and significant events;
management systems and principal business activities;
In 2011, the audit committee convened seven meetings in total, reviewing the financial reports for 2010, the first half of 2011, and the first and third quarter of 2011. The audit committee actively pushed forward the implementation and assessment of enterprise internal control standards, tracked the rectification against audit results found by internal and external audit. The audit committee reviewed the internal audit working plan and monitored and assessed the internal audit periodically. The audit committee seriously monitored and evaluated the external audit work, reviewed the working plan for annual financial report audit and the audit results, and urged the external auditors to issue audit report on time.
Pursuant to requirements by the CSRC and the annual report working rules of the audit committee, the audit committee reviewed the financial report of the Bank, and communicated and discussed with the management as to the major accounting policies and accounting estimates and formed written opinions. The audit committee reviewed the Bank’s financial report again in respect to the initial audit opinions given by the external auditors, communicated with the management and external auditors, discussed matters such as the accounting standards and methods adopted in the financial statements, internal monitoring and financial report, and urged the auditors to submit the summary audit report to the Board. The audit committee reviewed and approved the 2011 financial report of the Bank, and submitted the proposal to the Board for consideration.
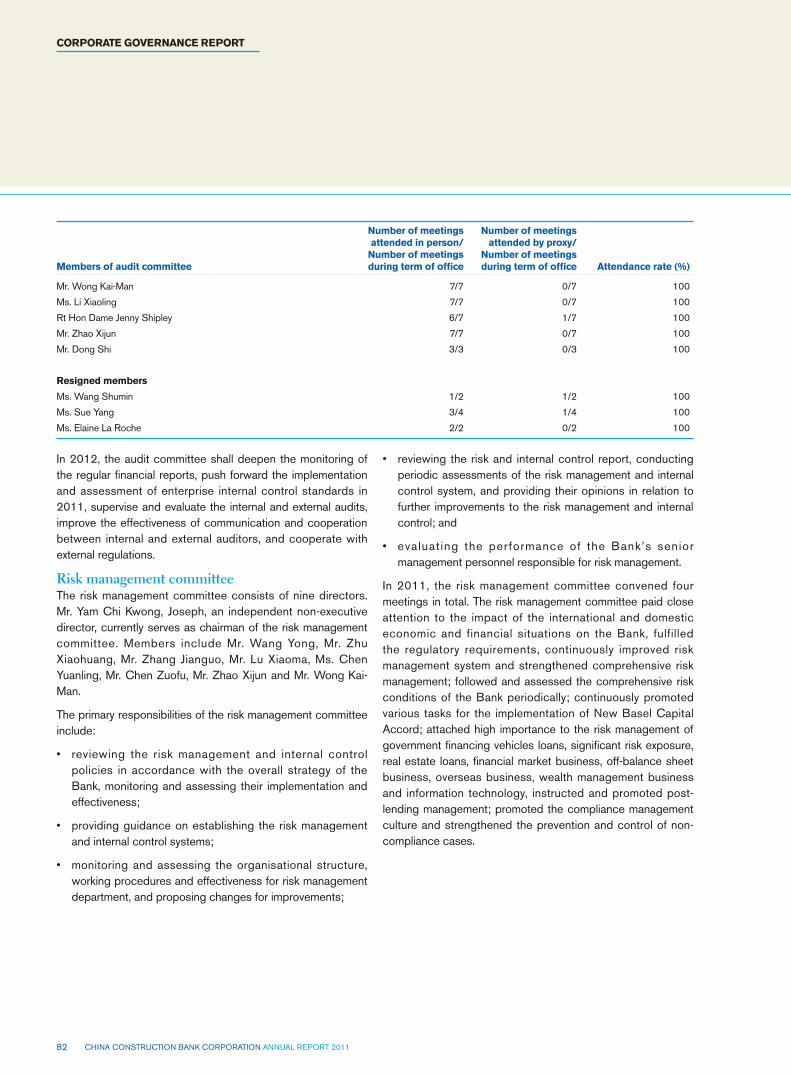
82 CHINA CONSTRUCTION BANK CORPORATION ANNUAL REPORT 2011
CORPORATE GOVERNANCE REPORT
Members of audit committee
Number of meetings attended in person/
Number of meetings during term of office
Number of meetings attended by proxy/
Number of meetings during term of office Attendance rate (%)
Mr. Wong Kai-Man 7/7 0/7 100
Ms. Li Xiaoling 7/7 0/7 100
Rt Hon Dame Jenny Shipley 6/7 1/7 100
Mr. Zhao Xijun 7/7 0/7 100
Mr. Dong Shi 3/3 0/3 100
Resigned members
Ms. Wang Shumin 1/2 1/2 100
Ms. Sue Yang 3/4 1/4 100
Ms. Elaine La Roche 2/2 0/2 100
In 2012, the audit committee shall deepen the monitoring of the regular financial reports, push forward the implementation and assessment of enterprise internal control standards in 2011, supervise and evaluate the internal and external audits, improve the effectiveness of communication and cooperation between internal and external auditors, and cooperate with external regulations.
Risk management committeeThe risk management committee consists of nine directors. Mr. Yam Chi Kwong, Joseph, an independent non-executive director, currently serves as chairman of the risk management committee. Members include Mr. Wang Yong, Mr. Zhu Xiaohuang, Mr. Zhang Jianguo, Mr. Lu Xiaoma, Ms. Chen Yuanling, Mr. Chen Zuofu, Mr. Zhao Xijun and Mr. Wong Kai-Man.
The primary responsibilities of the risk management committee include:
policies in accordance with the overall strategy of the Bank, monitoring and assessing their implementation and effectiveness;
and internal control systems;
working procedures and effectiveness for risk management department, and proposing changes for improvements;
periodic assessments of the risk management and internal control system, and providing their opinions in relation to further improvements to the risk management and internal control; and
management personnel responsible for risk management.
In 2011, the risk management committee convened four meetings in total. The risk management committee paid close attention to the impact of the international and domestic economic and financial situations on the Bank, fulfilled the regulatory requirements, continuously improved risk management system and strengthened comprehensive risk management; followed and assessed the comprehensive risk conditions of the Bank periodically; continuously promoted various tasks for the implementation of New Basel Capital Accord; attached high importance to the risk management of government financing vehicles loans, significant risk exposure, real estate loans, financial market business, off-balance sheet business, overseas business, wealth management business and information technology, instructed and promoted post-lending management; promoted the compliance management culture and strengthened the prevention and control of non-compliance cases.

83CHINA CONSTRUCTION BANK CORPORATION ANNUAL REPORT 2011
Members of risk management committee
Number of meetings attended in person/
Number of meetings during term of office
Number of meetings attended by proxy/
Number of meetings during term of office Attendance rate (%)
Mr. Yam Chi Kwong, Joseph 4/4 0/4 100Mr. Wang Yong 4/4 0/4 100Mr. Zhu Xiaohuang 4/4 0/4 100Mr. Zhang Jianguo 4/4 0/4 100Mr. Lu Xiaoma 4/4 0/4 100Ms. Chen Yuanling 4/4 0/4 100Mr. Chen Zuofu 4/4 0/4 100Mr. Zhao Xijun 4/4 0/4 100Mr. Wong Kai-Man 4/4 0/4 100
Resigned memberMs. Elaine La Roche 1/1 0/1 100
In 2012, the risk management committee will continue to conscientiously perform their duties, promote the fulfilment of various regulatory requirements, further improve comprehensive risk management system, further push forward the implementation of the New Basel Capital Accord, pay close attention to such substantial risks as credit risk, market risk, operational risk and compliance risk, and emphasize on enhancing the risk management level of off-balance sheet business, overseas business and financial market business.
Nomination and compensation committeeThe nomination and compensation committee consists of five directors. Rt Hon Dame Jenny Shipley, an independent non-executive director, currently serves as chairperson of the nomination and compensation committee. Members include Mr. Wang Yong, Lord Peter Levene, Mr. Zhu Zhenmin and Mr. Wong Kai-Man.
The pr imary responsibi l i t ies of the nominat ion and compensation committee include:
appointment of directors and senior management;
audit officer, secretary to the Board and board committee members to the Board;
the president;
back-up personnel for key positions;
and senior management, and compensation plans for directors, supervisors and senior management;
president;
in accordance with the performance assessment of the supervisors by the board of supervisors; and
assessment and compensation system.
In 2011, the nomination and compensation committee convened five meetings in total. Regarding nomination, the nomination and compensation committee reviewed proposals for electing director candidates, appointing senior management personnel and electing the chairperson of the nomination and compensation committee. Regarding compensation, the nomination and compensation committee organised the settlement scheme of the compensation to directors, supervisors and senior management for 2010, studied detailed implementation rules for the distribution of compensation for directors, supervisors and senior management for 2011. Regarding the fundamental work, the nomination and compensation committee debriefed the latest changes of the remuneration policy of the state and the target and plan of the cooperative training with Bank of America in 2011, and provided their opinions and suggestions.
Members of nomination and compensation committee
Number of meetings attended in person/
Number of meetings during term of office
Number of meetings attended by proxy/
Number of meetings during term of office Attendance rate (%)
Rt Hon Dame Jenny Shipley 4/5 1/5 100Mr. Wang Yong 5/5 0/5 100Lord Peter Levene 3/5 1/5 80Mr. Zhu Zhenmin 5/5 0/5 100Mr. Wong Kai-Man 4/5 1/5 100
Resigned membersMs. Elaine La Roche 2/2 0/2 100Ms. Sue Yang 3/3 0/3 100

84 CHINA CONSTRUCTION BANK CORPORATION ANNUAL REPORT 2011
CORPORATE GOVERNANCE REPORT
In 2012, the nomination and compensation committee will continue to accomplish the work in connection with nomination, further advance the remuneration and appraisal measures for directors, supervisors and senior management of the Bank in accordance with the national remuneration policies. The committee will propose the settlement of compensation for directors, supervisors and senior management for 2011 according to the operation results of the Bank and comprehensive consideration of various factors, and pay attention to the remuneration system and the training for the personnel of the Bank.
Related party transactions committeeThe related party transactions committee consists of five directors. The independent non-executive director Mr. Zhao Xijun currently serves as chairman of the related party transactions committee. Members include: Mr. Zhu Xiaohuang, Rt Hon Dame Jenny Shipley, Mr. Chen Zuofu and Mr. Wong Kai-Man.
The primary responsibilities of the related party transactions committee include:
party transactions and the system for management of related party transactions, as well as the internal approval and filing system of the Bank, and submitting the above standards for approval to the Board;
In 2011, the related party transactions committee convened four meetings in total. The committee fulfilled the new regulatory requirements and guide business compliance development; debriefed reports on related party transaction and its management, considered the variation of main associated parties and related party transactions, provided early warning on the compliance risk; engaged external advisors to provide special consultations on the management of related party transactions in achieving predictor control of the related party transactions in the system.
Members of related party transactions committee
Number of meetings attended in person/
Number of meetings during term of office
Number of meetings attended by proxy/
Number of meetings during term of office Attendance rate (%)
Mr. Zhao Xijun 4/4 0/4 100Mr. Zhu Xiaohuang 4/4 0/4 100Rt Hon Dame Jenny Shipley 3/4 1/4 100Mr. Chen Zuofu 4/4 0/4 100Mr. Wong Kai-Man 4/4 0/4 100
In 2012, the related party transactions committee will continue to focus on the progress of the management consultation of related party transactions, study and urge to implement the advisory opinion; monitor to enhance the bank-wide awareness of related party transactions risk, strengthen the fundamental management of related party transactions.
BOARD OF SUPERVISORSResponsibilities of the board of supervisorsThe board of supervisors, being the supervisory body of the Bank, is accountable to the shareholders’ general meeting and performs the following duties in accordance with relevant laws:
management and their members;
to correct their acts when their acts infringe the interests of the Bank;
report, business report and profit distribution proposal that are proposed to the shareholders’ general meeting by the Board; and
general meeting and the Articles of Association of the Bank.
Composition of the board of supervisorsThe board of supervisors currently consists of nine supervisors, including four shareholder representative supervisors, namely Mr. Zhang Furong, Ms. Liu Jin, Mr. Song Fengming and Mr. Zhang Huajian, three employee representative supervisors, namely Mr. Jin Panshi, Mr. Li Weiping and Ms. Huang Shuping, and two external supervisors, namely Mr. Guo Feng and Mr. Dai Deming.
The term of office of the supervisors is three years, and they may be re-elected upon expiration of their term of office. The shareholder representative supervisors and the external supervisors of the Bank are elected by the shareholders’ general meeting, and the employee representative supervisors are elected by the employee representative organisation.
Chairman of the board of supervisorsMr. Zhang Furong is the chairman of the board of supervisors of the Bank and is responsible for organisation and performance of duties of the board of supervisors.

85CHINA CONSTRUCTION BANK CORPORATION ANNUAL REPORT 2011
Appointment and re-election of supervisorsUpon appointment by the first extraordinary general meeting of 2011, Mr. Zhang Huajian commenced his position as a shareholder representative supervisor of the Bank from August 2011.
Operation of the board of supervisorsThe board of supervisors convenes regular meetings, generally not less than four times a year, and extraordinary meetings are convened, if and when required. Meetings of the board of supervisors may be convened by on-site conference or written resolutions. Supervisors are generally notified in written 10 days prior to the convening of the board of supervisors’ meeting. Matters concerning such meeting are specified in the written notice. During the meeting, the supervisors are free to express their opinions, and decisions on important matters are only made after detailed discussions.
Detailed minutes are prepared for the meetings of the board of supervisors. At the end of each meeting, minutes will be circulated to all attending supervisors for review and comments. After finalising the minutes, the board of supervisors’ office shall be responsible for distributing the final version of the minutes to all supervisors.
The board of supervisors may engage external legal advisors or certified public accountants when necessary to discharge its duties, and the Bank will bear all related expenses. The Bank takes necessary measures and methods to ensure
supervisors’ right to information, and provides relevant information and materials to them in accordance with related regulations.
Members of the board of supervisors may attend board meetings as non-voting attendees, and the board of supervisors may, as it considers appropriate, assign supervisors to attend as non-voting attendees such meetings of the Bank as board committees, annual work conference, symposia of general managers of branches, analytic meetings on operating conditions, and president executive meetings. The board of supervisors of the Bank conducts supervisory work through measures such as inspection and review of information, off-site monitoring and analysis and on-site specific inspection, visits and symposia, and performance and due diligence evaluation.
The Bank effected supervisors’ liability insurance policy for all the supervisors in 2011.
Meetings of the board of supervisorsThe board of supervisors convened seven meetings during the year 2011, among which, six were convened by on-site conference and one was convened by written resolutions. For details, please refer to the “Report of the Board of Supervisors” of this annual report.
The following table sets forth the attendance records of each of the supervisors in the meetings of the board of supervisors in 2011:
Members of the board of supervisors
Number of meetings attended in person/
Number of meetings during term of office
Number of meetings attended by proxy/
Number of meetings during term of office Attendance rate (%)
Shareholder representative supervisors
Mr. Zhang Furong 7/7 0/7 100
Ms. Liu Jin 7/7 0/7 100
Mr. Song Fengming 7/7 0/7 100
Mr. Zhang Huajian 2/2 0/2 100
Employee representative supervisors
Mr. Jin Panshi 7/7 0/7 100
Mr. Li Weiping 7/7 0/7 100
Ms. Huang Shuping 7/7 0/7 100
External supervisors
Mr. Guo Feng 6/7 1/7 100
Mr. Dai Deming 7/7 0/7 100
COMMITTEES UNDER THE BOARD OF SUPERVISORSTwo committees, namely the performance and due diligence supervision committee and the finance and internal control supervision committee, are established under the board of supervisors.
Performance and due diligence supervision committeeThe performance and due diligence supervision committee consists of six supervisors. Mr. Zhang Furong, chairman of the board of supervisors, serves as chairman of the performance and due diligence supervision committee. Members include Ms. Liu Jin, Mr. Song Fengming, Mr. Jin Panshi, Mr. Li Weiping and Mr. Guo Feng.

86 CHINA CONSTRUCTION BANK CORPORATION ANNUAL REPORT 2011
CORPORATE GOVERNANCE REPORT
The primary responsibilities of the performance and due diligence supervision committee include:
implementation plan for supervision and examination in connection with the supervision of the performance and degree of diligence of the board of directors, senior management and their members; and implementing and organising the implementation of such rules, plans and proposals after the board of supervisors’ approval;
board of directors and senior management as well as their members; and
supervisors and organising the implementation of such measures.
In 2011, the performance and due diligence supervision committee convened four meetings in total. The performance and due diligence supervision committee improved the annual supervision plan regarding performance and due diligence and revised the due diligence supervision and valuation rules; formulated the annual work plan for performance supervision and evaluation, proposed opinions on the performance and due diligence of the Board, senior management and their members; examined the position qualifications and conditions of supervisor candidates.
Members of the Finance and Internal Control Supervision Committee
Number of meetings attended in person/
Number of meetings during term of office
Number of meetings attended by proxy/
Number of meetings during term of office Attendance rate (%)
Mr. Dai Deming 5/5 0/5 100Ms. Liu Jin 5/5 0/5 100Mr. Song Fengming 5/5 0/5 100Mr. Zhang Huajian 1/1 0/1 100Mr. Jin Panshi 5/5 0/5 100Ms. Huang Shuping 5/5 0/5 100
Members of the Performance and Due Diligence Supervision Committee
Number of meetings attended in person/
Number of meetings during term of office
Number of meetings attended by proxy/
Number of meetings during term of office Attendance rate (%)
Mr. Zhang Furong 4/4 0/4 100Ms. Liu Jin 4/4 0/4 100Mr. Song Fengming 4/4 0/4 100Mr. Jin Panshi 4/4 0/4 100Mr. Li Weiping 2/4 2/4 100Mr. Guo Feng 3/4 1/4 100
In 2012, the performance and due diligence supervision committee will, in accordance with the requirements of external regulatory systems, further improve the ways and means of performance and due diligence supervision, and strengthen the performance and due diligence supervision and valuation of the board of directors, senior management and their members.
Finance and internal control supervision committeeThe finance and internal control supervision committee consists of six supervisors. Mr. Dai Deming, external supervisor, serves as chairman of the finance and internal control supervision committee. Members include Ms. Liu Jin, Mr. Song Fengming, Mr. Zhang Huajian, Mr. Jin Panshi and Ms. Huang Shuping.
The primary responsibilities of the finance and internal control supervision committee include:
connection with the finance and internal control; and implementing or organising the implementation of such rules, plans, and proposals upon the approval of the board of supervisors;
distribution proposals, and providing suggestions on such reports to the board of supervisors; and
implementation of supervision and inspections on the finance and internal control of the Bank, as required by circumstances.
In 2011, the finance and internal control supervision committee convened five meetings in total, researched and formulated the annual work plan for finance and internal control supervision; reviewed the periodic financial reports, profit distribution plans and internal control valuation report; debriefed reports including internal audit findings, internal control self-assessment, and the working progress of the implementation of internal control standards; conducted supervision on the internal control, acquisition and disposal of material assets, and related party transactions of the Bank; strengthened the Bank’s risk management and finance and internal control supervision by ways of materials analysis, interviews and discussion, debriefing specific reports, communicating with the headquarter departments and the external auditors, etc.

87CHINA CONSTRUCTION BANK CORPORATION ANNUAL REPORT 2011
In 2012, the finance and internal control supervision committee will pay close attention to the key issues and in the area of the finance and internal control of the Bank, make more efforts in research and investigation, and continue the supervisory work for the risk management and the finance and internal control of the Bank.
AUDITORS’ REMUNERATIONPr icewaterhouseCoopers Zhongt ian is appointed as the domestic auditors of the Bank and its major domes t ic subs id ia r i es fo r the yea r o f 2011 and PricewaterhouseCoopers is appointed as the international auditors of the Bank and its overseas subsidiaries for the year of 2011.
Auditors’ fees for the audit of the financial report of the Group and other services paid to PricewaterhouseCoopers Zhong Tian CPAs Limited Company, PricewaterhouseCoopers and other PricewaterhouseCoopers member firms by the Group for the year ended 31 December 2011 are set out as follows:
(In millions of RMB) 2011 2010
Fees for the audit of the financial statements 140.00 140.40Other service fees 2.43 7.18
FURTHER INFORMATIONShareholders’ rights
Right to convene an extraordinary general meeting. The extraordinary general meeting shall be convened within two months, if any shareholder, individually or jointly holding more than 10% of the total issued voting shares of the Bank, requests the Bank in written.
Right to convene an extraordinary meeting of the Board. The chairman of the Board shall sign the notice of the extraordinary meeting of the Board within seven business days, if any shareholder, individually or jointly holding more than 10% of the total issued voting shares of the Bank, requests the Bank in written.
Right to raise proposals to the shareholders’ general meeting. Shareholders, who individually or jointly hold more than 3% of the shares of the Bank, have the right to raise proposals to the shareholders’ general meeting; Shareholders, who individually or jointly hold more than 5% of the total issued voting shares of the Bank, have the right to raise proposals regarding the nomination of the candidates for directors (including independent directors) and non-employee representative supervisors (including external supervisors).
Right to raise enquiries to the Board. In accordance with the provisions of the Articles of Association of the Bank, the shareholders have the right to obtain relevant information, including the Articles of Association, status of the share capital, financial report, report of the board of directors and report of the board of supervisors.
Effective communication with shareholdersThe Bank attaches great importance to the communication with the shareholders, and exchanges opinions with the shareholders through many channels such as the shareholders’ general meetings, results announcement conferences, road shows, receptions of visitors and telephone enquiries. In 2011, the Bank organised and arranged results announcement conferences and analysts’ on-site briefings and conference calls during the period of annual and interim results publication. Relevant announcements of results are published on designated newspapers and websites for shareholders’ review.
Shareholder enquiriesAny enquiries related to your shareholding, including transfer of shares, change of address, loss reporting of share certificates and dividend notes, should be sent in writing to our share registrar at:
A-share:China Securities Depository and Clearing Corporation Limited, Shanghai Branch36th FloorChina Insurance Building166 Lujiazui East Road, Pudong DistrictShanghai, ChinaTelephone: (8621) 5870-8888Facsimile: (8621) 5889-9400
H-share:Computershare Hong Kong Investor Services LimitedRooms 1712-16, 17th FloorHopewell Centre183 Queen’s Road EastHong KongTelephone: (852) 2862-2863Facsimile: (852) 2865-0990/(852) 2529-6087
Investor relationsEnquiries to the Board may be directed to:Board of directors officeChina Construction Bank CorporationNo. 25, Financial Street, Xicheng District, Beijing, ChinaTelephone: (8610) 6621-5533Facsimile: (8610) 6621-8888Email: [email protected]
Board of directors office – Hong Kong OfficeChina Construction Bank Corporation12/F, AIA Central, 1 Connaught Road Central, Central, Hong KongTelephone: (852) 2532-9637Facsimile: (852) 2523-8185
This annual report is available on the following websites of the Bank (www.ccb.com), Shanghai Stock Exchange (www.sse.com.cn) and Hong Kong Stock Exchange (www.hkex.com.hk). If you have any queries on reading this annual report, please call our hotline at (8610) 6621-5533 or (852) 2532-9637. If you have any comments or advice on the annual report, please send email to [email protected].

88 CHINA CONSTRUCTION BANK CORPORATION ANNUAL REPORT 2011
PARTICULARS OF DIRECTORS, SUPERVISORS AND SENIOR MANAGEMENTDirectors of the BankName Position Gender Age Term of Office
Wang Hongzhang Chairman, executive director Male 57 January 2012 to 2014 annual general meetingZhang Jianguo Vice chairman, executive director,
presidentMale 57 June 2010 to 2012 annual general meeting
Chen Zuofu Executive director, executive vice president
Male 57 July 2009 to 2011 annual general meeting
Zhu Xiaohuang Executive director, executive vice president
Male 55 July 2010 to 2012 annual general meeting
Wang Yong Non-executive director Male 50 June 2010 to 2012 annual general meetingZhu Zhenmin Non-executive director Male 62 August 2010 to 2012 annual general meetingLi Xiaoling Non-executive director Female 54 June 2010 to 2012 annual general meetingLu Xiaoma Non-executive director Male 45 August 2010 to 2012 annual general meetingChen Yuanling Non-executive director Female 48 August 2010 to 2012 annual general meetingDong Shi Non-executive director Male 46 September 2011 to 2013 annual general meetingLord Peter Levene Independent non-executive director Male 70 June 2010 to 2011 annual general meetingYam Chi Kwong, Joseph Independent non-executive director Male 63 August 2010 to 2012 annual general meetingRt Hon Dame Jenny Shipley Independent non-executive director Female 60 June 2010 to 2012 annual general meetingZhao Xijun Independent non-executive director Male 48 August 2010 to 2012 annual general meetingWong Kai-Man Independent non-executive director Male 61 June 2010 to 2012 annual general meeting
Supervisors of the BankName Position Gender Age Term of Office
Zhang Furong Chairman of the board of supervisors Male 59 September 2010 to 2012 annual general meetingLiu Jin Shareholder representative supervisor Female 47 June 2010 to 2012 annual general meetingSong Fengming Shareholder representative supervisor Male 65 June 2010 to 2012 annual general meetingZhang Huajian Shareholder representative supervisor Male 56 August 2011 to 2013 annual general meetingJin Panshi Employee representative supervisor Male 47 June 2010 to 2012 annual general meetingLi Weiping Employee representative supervisor Male 58 June 2010 to 2012 annual general meetingHuang Shuping Employee representative supervisor Female 58 June 2010 to 2012 annual general meetingGuo Feng External supervisor Male 49 June 2010 to 2012 annual general meetingDai Deming External supervisor Male 49 June 2010 to 2012 annual general meeting
Senior management of the BankName Position Gender Age Term of Office
Zhang Jianguo President Male 57 July 2006-Chen Zuofu Executive vice president Male 57 July 2005 -Zhu Xiaohuang Executive vice president Male 55 June 2008 -Zhu Hongbo Executive vice president Male 49 February 2012-Hu Zheyi Executive vice president Male 57 March 2009 -Pang Xiusheng Executive vice president Male 53 February 2010 -Zhao Huan Executive vice president Male 48 May 2011-Zhang Gengsheng Member of senior management Male 51 December 2010 -Zeng Jianhua Chief financial officer Male 54 March 2011-Huang Zhiling Chief risk officer Male 51 February 2011 -Yu Jingbo Chief audit officer Male 54 March 2011-Chen Caihong Secretary to the Board Male 55 August 2007 -Xu Huibin Controller of wholesale banking Male 54 March 2011-Tian Huiyu Controller of retail banking Male 46 March 2011-Wang Guiya Controller of investment and wealth
management bankingMale 47 March 2011-

89CHINA CONSTRUCTION BANK CORPORATION ANNUAL REPORT 2011
During the reporting period, some of the Bank’s supervisors and senior executives indirectly held H-shares of the Bank via employee stock incentive plan before they assumed duties of their current positions. Mr. Zhang Huajian held 18,999 H-shares, Mr. Li Weiping held 20,446 H-shares, Ms. Huang Shuping 21,910 H-shares, Mr. Zhao Huan 18,292 H-shares,
Mr. Zhang Gengsheng 19,304 H-shares, Mr. Zeng Jianhua 25,838 H-shares, Mr. Huang Zhiling 18,751 H-shares, Mr. Yu Jingbo 22,567 H-shares and Mr. Chen Caihong 19,417 H-shares, Mr. Xu Huibin 20,004 H-shares, Mr. Wang Guiya 19,724 H-shares. Apart from these, the directors, supervisors and senior executives do not hold any shares of the Bank.
Compensation for directors, supervisors and senior management in 2011Unit: RMB’000
Name Fees Remuneration paid
Contribution by the employer to compulsory
insurances, housing allowances, etc Total (before tax)1
Other compensation or allowances
from corporate shareholders or other
connected entities
Wang Hongzhang – – – – NoneZhang Jianguo – 668 333 1,001 NoneChen Zuofu – 589 287 876 NoneZhu Xiaohuang – 589 287 876 NoneWang Yong – – – – YesZhu Zhenmin – – – – YesLi Xiaoling – – – – YesLu Xiaoma – – – – YesChen Yuanling – – – – YesDong Shi – – – – YesLord Peter Levene 360 – – 360 NoneYam Chi Kwong, Joseph 380 – – 380 NoneRt Hon Dame Jenny Shipley 432 – – 432 NoneZhao Xijun 410 – – 410 NoneWong Kai-Man 440 – – 440 NoneZhang Furong – 651 333 984 NoneLiu Jin – 432 249 681 NoneSong Fengming 360 – – 360 NoneZhang Huajian – 158 82 240 NoneJin Panshi2 50 – – 50 NoneLi Weiping2 50 – – 50 NoneHuang Shuping2 50 – – 50 NoneGuo Feng 330 – – 330 NoneDai Deming 350 – – 350 NoneZhu Hongbo – – – – NoneHu Zheyi – 589 287 876 NonePang Xiusheng – 589 283 872 NoneZhao Huan – 589 278 867 NoneZhang Gengsheng – 571 272 843 NoneZeng Jianhua – 414 185 599 NoneHuang Zhiling – 455 205 660 NoneYu Jingbo – 414 184 598 NoneChen Caihong – 538 249 787 NoneXu Huibin – 414 185 599 NoneTian Huiyu – 414 176 590 NoneWang Guiya – 414 184 598 None
1. Full compensations for Chairman of the Board of Directors, President, Chairman of the Board of Supervisors, Executive Directors, some Supervisors and Senior Management members have not been finalised in accordance with the latest policies. Their remaining compensation details will be disclosed when determined.
2. Compensation before tax paid for working as the supervisor of the Bank.

90 CHINA CONSTRUCTION BANK CORPORATION ANNUAL REPORT 2011
PROFILES OF DIRECTORS, SUPERVISORS AND SENIOR MANAGEMENT
CHANGES IN DIRECTORS, SUPERVISORS AND SENIOR MANAGEMENTDirectors of the BankUpon election at the first extraordinary general meeting and Board meeting of the Bank in 2012 and approval of the CBRC, Mr. Wang Hongzhang commenced his position as chairman and executive director of the Bank from January 2012.
Upon election at the 2010 Annual General Meeting and approval of the CBRC, Mr. Dong Shi commenced his position as non-executive director of the Bank from September 2011.
Upon the conclusion of the 2010 Annual General Meeting of the Bank, Ms. Elaine La Roche ceased to serve as independent non-executive director of the Bank due to the expiration of her term of office.
Upon the following day of the conclusion of the 2010 Annual General Meeting of the Bank, Ms. Wang Shumin ceased to serve as non-executive director of the Bank due to her personal variation of work.
Ms. Sue Yang ceased to serve as non-executive director of the Bank due to personal reasons since 11 October 2011.
Mr. Guo Shuqing ceased to serve as the chairman and executive director of the Bank due to the arrangement of the national finance work since 28 October 2011.
Supervisors of the BankUpon election at the first extraordinary general meeting of the Bank in 2011, Mr. Zhang Huajian commenced his position as shareholder representative supervisor of the Bank.
Senior management of the BankUpon appointment at the tenth meeting of the Board in 2010 and approval of the CBRC, Mr. Huang Zhiling commenced his position as chief risk officer of the Bank from February 2011, and Mr. Zhu Xiaohuang no longer served as chief risk officer of the Bank.
Upon appointment at the tenth meeting of the Board in 2010 and approval of the CBRC, Mr. Zeng Jianhua commenced his position as chief financial officer of the Bank from March 2011, and Mr. Pang Xiusheng no longer served as chief financial officer of the Bank.
Upon appointment at the tenth meeting of the Board in 2010 and approval of the CBRC, Mr. Yu Jingbo commenced his position as chief audit officer of the Bank from March 2011.
Upon approval of the CBRC, Mr. Xu Huibin commenced his position as controller of wholesale banking from March 2011, and Mr. Gu Jingpu no longer served as controller of wholesale banking of the Bank.
Upon approval of the CBRC, Mr. Tian Huiyu commenced his position as controller of retail banking from March 2011, and Mr. Du Yajun no longer served as controller of retail banking of the Bank.
Upon approval of the CBRC, Mr. Wang Guiya commenced his position as controller of investment and wealth management banking from March 2011, and Mr. Mao Yumin no longer served as controller of investment and wealth management banking of the Bank.
Upon appointment at the first meeting of the Board in 2011 and approval of the CBRC, Mr. Zhao Huan commenced his position as executive vice president of the Bank from May 2011.
Upon appointment at the first meeting of the Board in 2012 and approval of the CBRC, Mr. Zhu Hongbo commenced his position as executive vice president of the Bank from February 2012.

91CHINA CONSTRUCTION BANK CORPORATION ANNUAL REPORT 2011
BIOGRAPHICAL DETAILS OF THE DIRECTORS, SUPERVISORS AND SENIOR MANAGEMENTDirectors of the Bank
Wang HongzhangChairman, executive director
Mr. Wang commenced his position as chairman and executive director from January 2012. From November 2003 to November 2011, Mr. Wang was chief disciplinary officer of the PBC. From June 2000 to November 2003, Mr. Wang was the president of Chengdu Branch of the PBC and administrator of Sichuan Branch of the State Administration of Foreign Exchange. From April 1996 to June 2000, Mr. Wang was deputy director-general of the Supervision Bureau and director-general of the internal auditing department of the PBC. From November 1989 to April 1996, Mr. Wang served on various positions including assistant president of Qingdao Branch, deputy director of the General Administration Office, deputy director of the Finance Planning Department and general manager of the banking business department of Industrial and Commercial Bank of China. From January 1984 to November 1989, Mr. Wang worked in the Industrial and Commercial Credit Department and the General Administration Office of ICBC. From September 1978 to January 1984, Mr. Wang worked in the Credit Bureau, Savings Bureau and Industrial and Commercial Credit Department of the PBC. Mr. Wang is a senior economist and a certified public accountant. Mr. Wang graduated from Liaoning Finance and Economics College with a bachelor’s degree in Finance in 1978, and obtained his master’s degree in economics from Dongbei University of Finance and Economics in 1997.
Zhang JianguoVice chairman, executive director, president
Mr. Zhang has served as vice chairman and executive director of the Bank since October 2006, president of the Bank since July 2006. Mr. Zhang was vice chairman of the board of directors and president of Bank of Communications Co., Ltd. from May 2004 to July 2006, executive vice president of Bank of Communications Co., Ltd from September 2001 to May 2004. From September 1984 to September 2001, Mr. Zhang served several positions in Industrial and Commercial Bank of China, including deputy general manager and general manager of the international banking department, and deputy general manager of Tianjin Branch. From November 1987 to December 1988, Mr. Zhang studied international financial business in Canadian Imperial Bank of Commerce and Ryerson Institute of Technology. Mr. Zhang graduated from Tianjin College of Finance and Economics with a bachelor’s degree in Finance in 1982 and a master’s degree in economics in 1995.
Chen ZuofuExecutive director, executive vice president
Mr. Chen has served as a director since July 2009 and executive vice president since July 2005. Mr. Chen was assistant president of the Bank from September 2004 to July 2005, and assistant president of China Construction Bank from July 1997 to September 2004. Mr. Chen was a visiting scholar to Stanford University from June 1999 to May 2000. Mr. Chen graduated from Southwest University of Politics and Law with a bachelor’s degree in law in 1983. He obtained his master’s degree in management and engineering from Central South University in 1996.

92 CHINA CONSTRUCTION BANK CORPORATION ANNUAL REPORT 2011
PROFILES OF DIRECTORS, SUPERVISORS AND SENIOR MANAGEMENT
Zhu XiaohuangExecutive director, executive vice president
Mr. Zhu has served as a director since July 2010 and executive vice president since June 2008. Mr. Zhu served as the Bank’s chief risk officer from April 2006 to February 2011. He was executive vice chairman of the Bank’s risk management and internal control committee from March 2006 to April 2006. Mr. Zhu was general manager of the Bank’s corporate banking business department from October 2004 to March 2006; general manager of Guangdong Branch of China Construction Bank from May 2001 to October 2004. He served consecutively as deputy director of administrative office, deputy director of head office’s No.1 credit department, deputy general manager of credit management department, deputy general manager of Liaoning Branch, and general manager of banking department of China Construction Bank from September 1993 to May 2001. Mr. Zhu is a senior economist, and a recipient of a special grant by PRC government. He obtained his bachelor’s degree in infrastructure finance and credit from Hubei Finance and Economics College in 1982 and obtained an associate degree in economic law from Peking University in October 1985. He also obtained his doctorate degree in world economics from Sun Yat-Sen University in 2006.
Wang YongNon-executive director
Mr. Wang has served as a director since June 2007. Mr. Wang was an inspector of the Balance of Payments Department of the SAFE from August 2004 to March 2007, and served consecutively as deputy director-general of the Foreign Investment Administration Department, deputy director-general of the Capital Account Management Department and director general of the Balance of Payments Department of the SAFE from January 1997 to August 2004. Mr. Wang is a senior economist. He graduated from Jilin University with a bachelor’s degree in world economics in 1984 and a master’s degree in world economics in 1987. Mr. Wang is currently an employee of the Bank’s substantial shareholder, Huijin.
Zhu ZhenminNon-executive director
Mr. Zhu has served as a director since August 2010. He was an inspector of the Tax Bureau of the MOF from October 2007 to October 2009, a director of the Bank from September 2004 to June 2007, director-general of the Tax Bureau of the MOF from December 2003 to September 2004, director-general of the Tax Bureau of the MOF and concurrently director of the General Office of Customs Tariff Commission under the State Council from September 2002 to December 2003, and deputy director-general of the Tax Bureau of the MOF from August 1997 to September 2002. Mr. Zhu graduated with a degree in finance from the Central Institute of Finance Administration in 1987. Mr. Zhu is currently an employee of the Bank’s substantial shareholder, Huijin.

93CHINA CONSTRUCTION BANK CORPORATION ANNUAL REPORT 2011
Li XiaolingNon-executive director
Ms. Li has served as a director since June 2007. Ms. Li was a deputy inspector of Budget Department of the MOF from January 2006 to June 2007, and an assistant inspector of Budget Department of the MOF from May 2001 to January 2006. Ms. Li is an economist and graduated from Beijing Normal University in 2003 with a master’s degree in political economics. Ms. Li is currently an employee of the Bank’s substantial shareholder, Huijin.
Lu XiaomaNon-executive director
Mr. Lu has served as a director since August 2010. Mr. Lu served several positions for the State Street Bank & Trust Company from May 1999 to August 2010 and he had been serving as the Chief Representative of the State Street Bank & Trust Company in China since August 2007. From March 1993 to December 1997, Mr. Lu was a lecturer of the Department of Thermal Engineering of Tsinghua University. In 1988, he graduated with a bachelor’s degree from the Department of Thermal Engineering of Tsinghua University and a master’s degree from the Department of Thermal Engineering of Tsinghua University in 1993. He obtained his MBA degree from Boston College in 1999. Mr. Lu is currently an employee of the Bank’s substantial shareholder, Huijin.
Chen YuanlingNon-executive director
Ms. Chen has served as a director since August 2010. She was a partner of Beijing Kang Da Law Firm from November 2007 to August 2010. Previously, she was a partner and lawyer of Beijing DeHeng Law Offices from May 2005 to November 2007, a lawyer of Beijing JunZeJun Law Offices from May 2002 to May 2005 and a senior manager of the Legal Department of China Securities Corporation from March 2001 to May 2002. Ms. Chen is a first-grade lawyer. She graduated with a bachelor’s degree in law from the law faculty of Peking University in 1985 and graduated from post-graduate level class in accounting at the Business School of Jilin University in 2000. Ms. Chen is currently an employee of the Bank’s substantial shareholder, Huijin.

94 CHINA CONSTRUCTION BANK CORPORATION ANNUAL REPORT 2011
PROFILES OF DIRECTORS, SUPERVISORS AND SENIOR MANAGEMENT
Dong ShiNon-executive director
Mr. Dong has served as a director since September 2011. He has served as a director of both China Reinsurance (Group) Corporation and China Reinsurance Asset Management Co., Ltd. since October 2008. Mr. Dong served consecutively as Assistant Special Inspector of the State Council, Division-Chief of the Supervisory Committee of Central Enterprises Working Commission and Deputy Director-General of the Foreign Affairs Bureau under the State-owned Assets Supervision and Administration Commission from August 1998 to September 2008. Mr. Dong made a study visit to the Federal Reserve of the United States in 1994 and studied at RMIT University in Australia in 1996. Mr. Dong is a senior economist and accountant. Mr. Dong graduated from Zhengzhou University with a bachelor’s degree in finance in 1988 and obtained his master’s degree in economic law from the Renmin University of China in 2002. Mr. Dong is currently an employee of the Bank’s substantial shareholder, Huijin.
Lord Peter LeveneIndependent non-executive director
Lord Peter Levene has served as a director since June 2006. He is currently the chairman of NBNK plc, General Dynamics UK Limited, and director of EUROTUNNEL SA, and Haymarket Group Ltd. Before that, he served as Chairman of Lloyd’s and held directorships in various other listed companies including director of J Sainsbury plc from 2001 to 2004, and member of the board of directors of Deutsche Boerse from 2004 to 2005. Lord Peter Levene was awarded a bachelor’s degree in economics and politics from the University of Manchester.
Yam Chi Kwong, JosephIndependent non-executive director
Mr. Yam Chi Kwong, Joseph, has served as a director since August 2010. He was Chief Executive of the Hong Kong Monetary Authority from 1993 to September 2009 and Director of the Office of the Exchange Fund of Hong Kong from 1991 to 1993. Mr. Yam held a number of positions in the Hong Kong Government from 1971 to 1991. Mr. Yam is Executive Vice President of the China Society for Finance and Banking in the PRC, a Distinguished Research Fellow of the Institute of Global Economics and Finance at the Chinese University of Hong Kong and Chairman of Macroprudential Consultancy Limited. Mr. Yam is also a member of the advisory committees of a number of academic and private institutions focusing in finance. Mr. Yam graduated from the University of Hong Kong with first class honours in 1970, receiving a Bachelor of Social Sciences degree. He also obtained his post-graduate diploma in Statistics and National Accounting from the Institute of Social Studies of the Hague, the Netherlands in 1974. Over the years, he was conferred a number of honorary doctorate degrees and professorships from universities in Hong Kong and overseas. Mr. Yam was awarded the Commander of the Most Excellent Order of the British Empire in 1995, the Gold Bauhinia Star by the Hong Kong Special Administrative Region Government in 2001, and the highest honour of the Grand Bauhinia Medal by the Hong Kong Special Administrative Region Government in 2009.

95CHINA CONSTRUCTION BANK CORPORATION ANNUAL REPORT 2011
Rt Hon Dame Jenny ShipleyIndependent non-executive director
Rt Hon Dame Jenny Shipley has served as a director since November 2007. She is currently Chairman of Mainzeal Construction and Development, Momentum Consulting, Senior Money International, the Financial Services Council of New Zealand and Genesis Energy, a New Zealand state owned energy company. Dame Jenny is Managing Director in her consultancy company Jenny Shipley New Zealand Limited. She had served as a Director of Richina Pacific, a listed company from 2004 to 2009. As a professional director, keynote speaker and advisor, she tracks economic, social and geo-political mega trends globally. She was a Member of the New Zealand Parliament from 1987 to 2002 and held the key role of Prime Minister of New Zealand from 1997 to 1999. She held a range of other key leadership positions including Minister of Women’s Affairs, Minister of Social Welfare, Minister of Health, Minister responsible for Radio New Zealand, Minister of Transport, Minister of Accident & Compensation, Minister of State Owned Enterprises, and Minister of State Services from 1990 to 1997.
Zhao XijunIndependent non-executive director
Mr. Zhao has served as a director since August 2010. As a professor, he is currently Deputy Dean of the School of Finance of Renmin University of China. Mr. Zhao was Director of International Office of Renmin University of China from 2001 to 2005, Department Head of the Finance Department of the School of Finance of Renmin University of China from 1995 to 2001 and a research fellow of the International Department of China Securities Regulatory Commission from 1994 to 1995. Mr. Zhao currently serves as an external director of China Coal Technology & Engineering Group Corporation (an unlisted company), an independent director of Xuchang Bank Corporation (an unlisted company) and an independent director of Beijing Gate-guard Information Security Technology Stock Co., Ltd (an unlisted company). Mr. Zhao was a visiting scholar in University of Sherbrooke and McGill University, Canada from 1989 to 1990 and Nijenrode University, Netherlands from 1995 to 1996. Mr. Zhao graduated from Wuhan University with a bachelor’s degree in Scientific French in 1985, a master’s degree in finance from the Finance Department of Renmin University of China in 1987 and a PhD in finance from the School of Finance of Renmin University of China in 1999.
Wong Kai-ManIndependent non-executive director
Mr. Wong has served as a director since November 2007 and is currently a director of Victor and William Fung Foundation Limited and Li & Fung (1906) Foundation Ltd, an honorary associate professor of the School of Business of the University of Hong Kong, and an independent non-executive director of Shangri-la Asia Limited, SCMP Group Limited and SUNeVision Holdings Ltd., which are listed on the Hong Kong Stock Exchange. He is a non-executive director of the Securities and Futures Commission. In addition, he serves in a number of government committees and the boards of non-governmental organisations. Mr. Wong was a partner of PricewaterhouseCoopers Hong Kong and retired from that post in June 2005 with 32 years of experience in accounting. Mr. Wong was a member of the GEM Listing Committee of the Hong Kong Stock Exchange from 1999 to 2003. Mr. Wong obtained his bachelor degree in Physics from the University of Hong Kong and his master degree in Business Administration from the Chinese University of Hong Kong. Mr. Wong is a fellow of the Hong Kong Institute of Certified Public Accountants and a fellow of the Association of Chartered Certified Accountants of the United Kingdom. Mr. Wong was appointed as a Justice of the Peace in 2002 and awarded Bronze Bauhinia Star in 2007 by the Government of the Hong Kong Special Administrative Region, and awarded an honorary fellow by Lingnan University, Hong Kong in 2007.

96 CHINA CONSTRUCTION BANK CORPORATION ANNUAL REPORT 2011
PROFILES OF DIRECTORS, SUPERVISORS AND SENIOR MANAGEMENT
Zhang FurongChairman of the board of supervisors
Mr. Zhang has served as Chairman of the board of supervisors since September 2010. He served as executive director and executive vice president of Industrial and Commercial Bank of China Limited (ICBC) from October 2005 to July 2010. Mr. Zhang served as executive vice president of ICBC from 2000, assistant president of ICBC, general manager of Human Resources Department from 1997, deputy general manager of ICBC Liaoning Branch and general manager of ICBC Dalian Branch from 1994, chief of the Accounting Division and deputy general manager of ICBC Liaoning Branch from 1986. Mr. Zhang joined ICBC in 1984, and joined the People’s Bank of China in 1971. Mr. Zhang is also vice chairman of the Banking Accounting Society of China and vice chairman of Financial Planning Standards Council of China. Mr. Zhang graduated from Liaoning Finance and Economics College and obtained a Master’s degree in economics and a Doctorate degree in finance from Dongbei University of Finance and Economics.
Liu JinShareholder representative supervisor
Ms. Liu has served as a supervisor since September 2004 and served concurrently as director of board of supervisors office since November 2004. Ms. Liu was a dedicated supervisor of deputy director-general level at the board of supervisors of China Construction Bank from July 2003 to September 2004, dedicated supervisor of deputy director-general level at the board of supervisors of the People’s Insurance Company of China and China Reinsurance Company from November 2001 to July 2003. Ms. Liu is a senior economist and graduated from Hunan Finance and Economics College with a bachelor’s degree in finance in 1984. She graduated from postgraduate finance program of Shaanxi Finance and Economics College in 1999 and from the Research Institute for Fiscal Science of the MOF with a doctorate degree in public finance in 2008.
Song FengmingShareholder representative supervisor
Mr. Song has served as a supervisor since June 2010. He served as an independent non-executive director of the Bank from September 2004 to June 2010. Mr. Song is a professor and supervisor for doctorate students and co-chairman of China Centre for Financial Research at Tsinghua University. Mr. Song has been the dean of the department of finance and international trade of School of Economics and Management at Tsinghua University from 1995 to 2006. He was an associate professor and director of the Division of International Trade and Finance of the same school from 1988 to 1992, and served as a lecturer and the dean of the management department of Jiangsu University of Science and Technology from 1982 to 1988. Mr. Song obtained his bachelor’s degree in computational mathematics from Peking University in 1970, his master’s degree in enterprise management from Shanghai Jiaotong University in 1982, and his Ph.D. degree in systems engineering from Tsinghua University in 1988. He pursued his post-doctorate research at the University of California, Riverside, from 1992 to 1995.
Supervisors of the Bank

97CHINA CONSTRUCTION BANK CORPORATION ANNUAL REPORT 2011
Zhang HuajianShareholder representative supervisor
Mr. Zhang has served as a supervisor since August 2011. He has served as general manager of the disciplinary and supervisory department of the Bank since March 2007. He served as deputy general manager of the human resources department of the Bank from June 2005 to March 2007(general manager level at the head office), deputy general manager of the human resources department of China Construction Bank from February 2001 to June 2005, and deputy general manager of the personnel and education department of China Construction Bank from December 1996 to February 2001. Mr. Zhang is a senior economist. He graduated f rom Hubei F inance and Economics College with a bachelor’s degree in infrastructure finance and credit in 1984.
Jin PanshiEmployee representative supervisor
Mr. Jin has served as an employee representative supervisor since June 2010. He served as a shareholder representative supervisor from September 2004 to June 2010. He has been general manager of the information technology management department of the Bank since January 2010. Mr. Jin was general manager of the audit department of the Bank from December 2007 to January 2010. Mr. Jin was deputy general manager of the audit department of China Construction Bank from June 2001 to September 2004. Mr. Jin is a senior engineer and a Certified Information Systems Auditor and graduated from Jilin University of Technology with a bachelor’s degree in computer application in 1986, and a master’s degree in computer application from the same university in 1989. Mr. Jin graduated from Tsinghua University with an EMBA degree in 2010.
Li WeipingEmployee representative supervisor
Mr. Li has served as a supervisor since June 2010. He has served as general manager of the human resources department of the Bank since August 2008. Mr. Li was acting as general manager of the human resources department of the Bank from May 2008 to August 2008, the deputy general manager of Beijing Branch from August 2005 to May 2008, deputy general manager of Guangdong Branch from July 2001 to August 2005, and deputy general manager of Shenzhen Branch from February 1995 to July 2001. Mr. Li is a senior economist and graduated from Zhongnan University of Economics and Law with a bachelor’s degree in finance.

98 CHINA CONSTRUCTION BANK CORPORATION ANNUAL REPORT 2011
PROFILES OF DIRECTORS, SUPERVISORS AND SENIOR MANAGEMENT
Huang ShupingEmployee representative supervisor
Ms. Huang has served as a supervisor since June 2010. She has served as director of Chengdu Audit Sub-Bureau of the Bank since December 2010. Ms. Huang served as general manager of Chongqing Branch from September 2001 to December 2010. Ms. Huang was deputy general manager of Sichuan Branch from March 1993 to September 2001. Ms. Huang is a senior economist. Ms. Huang graduated from Sichuan Provincial Fiscal School majoring in Finance and Accounting in 1975, and graduated from Harbin Advanced Investment Specialized School majoring in Infrastructure Finance and Credit in 1991, and graduated from Wuhan University with a bachelor’s degree in International Finance in 1997.
Guo FengExternal supervisor
Mr. Guo has served as a supervisor since March 2005. Mr. Guo has been dean of the law school of Central University of Finance and Economics since January 2007. Mr. Guo has been a professor at the law school of Central University of Finance and Economics and director of the Research Institute of Financial and Economic Law of the same university since December 2004. He was an associate professor at the law school of Renmin University of China from June 1993 to December 2004, and deputy director of the Institute of Financial Law of the same university from February 1993 to December 2004. Mr. Guo was a visiting scholar at the law school of the City Polytechnic of Hong Kong from January 1993 to June 1993. He obtained his master’s degree in civil and commercial law from Renmin University of China in 1986 and his Ph.D. degree in civil and commercial law from the same university in 1995.
Dai DemingExternal supervisor
Mr. Dai has served as a supervisor since June 2007. Mr. Dai has served as a professor of accounting department of Renmin University of China since June 1996, dean of accounting department of Business School at Renmin University of China from October 2001 to September 2010. Mr. Dai pursued his post-doctorate research at Hitotsubashi University from October 1997 to September 1999, and served as deputy director of accounting department of Renmin University of China from May 1996 to October 1997, and associate professor of accounting department of the same University from June 1993 to May 1996. At present, Mr. Dai serves as an independent director of China South Locomotive & Rolling Stock Corporation Limited and Shanxi Taigang Stainless Steel Co., Ltd. Mr. Dai obtained his bachelor’s degree in industry accounting from Hunan College of Finance and Economics in 1983, master’s degree in accounting from Zhongnan University of Economics in 1986 and Ph.D. degree in accounting from Renmin
University of China in 1991.

99CHINA CONSTRUCTION BANK CORPORATION ANNUAL REPORT 2011
Zhang JianguoVice chairman, executive director, president
See “Directors of the Bank”.
Chen ZuofuExecutive director, executive vice president
See “Directors of the Bank”.
Zhu XiaohuangExecutive director, executive vice president
See “Directors of the Bank”.
Senior management of the Bank
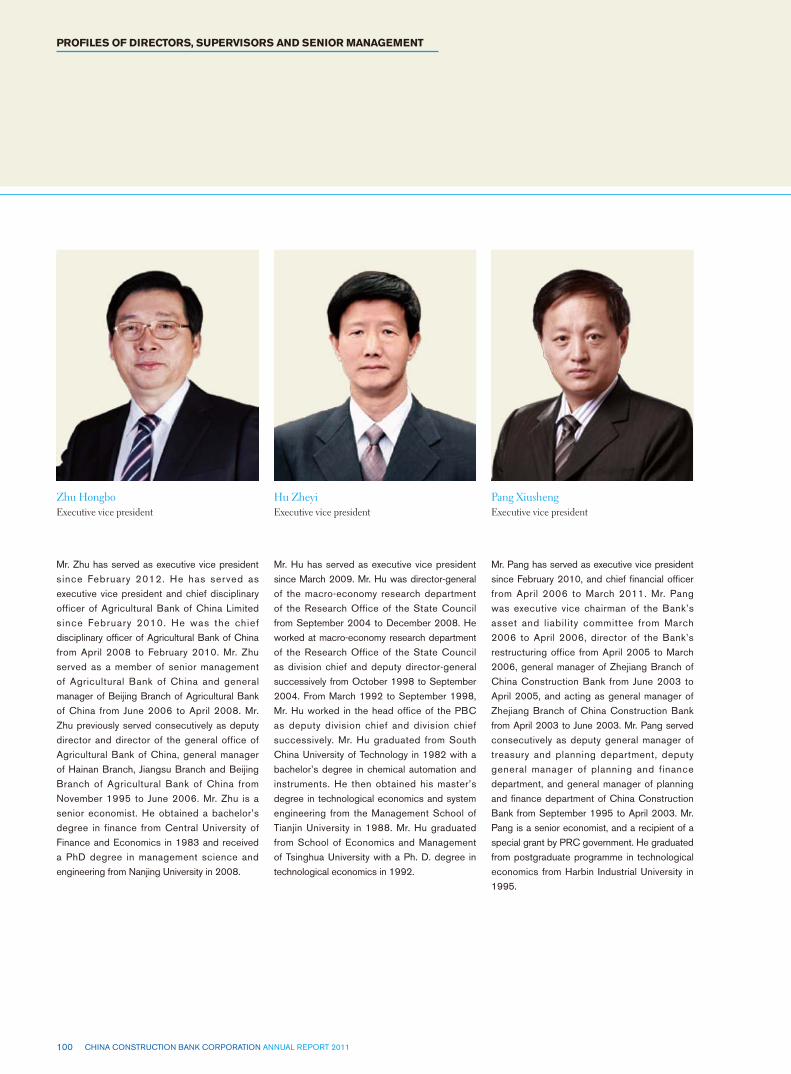
100 CHINA CONSTRUCTION BANK CORPORATION ANNUAL REPORT 2011
PROFILES OF DIRECTORS, SUPERVISORS AND SENIOR MANAGEMENT
Zhu HongboExecutive vice president
Mr. Zhu has served as executive vice president since February 2012. He has served as executive vice president and chief disciplinary officer of Agricultural Bank of China Limited since February 2010. He was the chief disciplinary officer of Agricultural Bank of China from April 2008 to February 2010. Mr. Zhu served as a member of senior management of Agricultural Bank of China and general manager of Beijing Branch of Agricultural Bank of China from June 2006 to April 2008. Mr. Zhu previously served consecutively as deputy director and director of the general office of Agricultural Bank of China, general manager of Hainan Branch, Jiangsu Branch and Beijing Branch of Agricultural Bank of China from November 1995 to June 2006. Mr. Zhu is a senior economist. He obtained a bachelor’s degree in finance from Central University of Finance and Economics in 1983 and received a PhD degree in management science and engineering from Nanjing University in 2008.
Hu ZheyiExecutive vice president
Mr. Hu has served as executive vice president since March 2009. Mr. Hu was director-general of the macro-economy research department of the Research Office of the State Council from September 2004 to December 2008. He worked at macro-economy research department of the Research Office of the State Council as division chief and deputy director-general successively from October 1998 to September 2004. From March 1992 to September 1998, Mr. Hu worked in the head office of the PBC as deputy division chief and division chief successively. Mr. Hu graduated from South China University of Technology in 1982 with a bachelor’s degree in chemical automation and instruments. He then obtained his master’s degree in technological economics and system engineering from the Management School of Tianjin University in 1988. Mr. Hu graduated from School of Economics and Management of Tsinghua University with a Ph. D. degree in technological economics in 1992.
Pang XiushengExecutive vice president
Mr. Pang has served as executive vice president since February 2010, and chief financial officer from April 2006 to March 2011. Mr. Pang was executive vice chairman of the Bank’s asset and liability committee from March 2006 to April 2006, director of the Bank’s restructuring office from April 2005 to March 2006, general manager of Zhejiang Branch of China Construction Bank from June 2003 to April 2005, and acting as general manager of Zhejiang Branch of China Construction Bank from April 2003 to June 2003. Mr. Pang served consecutively as deputy general manager of treasury and planning department, deputy general manager of planning and finance department, and general manager of planning and finance department of China Construction Bank from September 1995 to April 2003. Mr. Pang is a senior economist, and a recipient of a special grant by PRC government. He graduated from postgraduate programme in technological economics from Harbin Industrial University in 1995.

101CHINA CONSTRUCTION BANK CORPORATION ANNUAL REPORT 2011
Zhao HuanExecutive vice president
Mr. Zhao has served as executive vice president of the Bank since May 2011. Mr. Zhao Huan has served as member of senior management of the Bank from December 2010. He was general manager of Shanghai Branch of the Bank from September 2007, head of Shanghai Branch of the Bank from July 2007 to September 2007, general manger of the Bank’s corporate banking department from June 2006 to July 2007, deputy general manger of the Bank’s corporate banking department from April 2004 to June 2006, deputy general manger of the Bank’s Xiamen Branch from July 2003 to April 2004, and deputy general manger of the Bank’s corporate banking department from March 2001 to May 2003. Mr. Zhao is a senior economist. He obtained his bachelor’s degree in industrial management and engineering from Xi’an Jiaotong University in 1986.
Zhang GengshengMember of senior management
Mr. Zhang has served as member of senior management of the Bank since December 2010. Mr. Zhang was general manager of the group clients department and deputy general manger of Beijing Branch of the Bank from October 2006, general manager of the banking business department and the group clients department from March 2004 to October 2006, deputy general manger of the banking business department from June 2000 to March 2004 (in charge of overall management from March 2003), general manager of the Three Gorges Branch from September 1998 to June 2000, and deputy general manger of Three Gorges Branch from December 1996 to September 1998. Mr. Zhang is a senior economist. He obtained his bachelor’s degree in infrastructure finance and credit from Liaoning Finance and Economics College in 1984 and an Executive MBA degree from Peking University in 2010.
Zeng JianhuaChief Financial Officer
Mr. Zeng has served as the Bank’s Chief Financial Officer since March 2011. He served as general manager of Guangdong Branch of the Bank from September 2007. Mr. Zeng was consecutively the head of Guangdong Branch from July 2007 to September 2007, general manager of Shenzhen Branch of the Bank from October 2004 to July 2007, deputy general manager of the asset and liability management department of China Construction Bank from July 2003 to October 2004, and deputy general manager of Hunan Branch of China Construction Bank from February 1996 to July 2003. Mr. Zeng is a senior economist and obtained his Ph.D. degree in enterprise management from Hunan University in 2005.

102 CHINA CONSTRUCTION BANK CORPORATION ANNUAL REPORT 2011
PROFILES OF DIRECTORS, SUPERVISORS AND SENIOR MANAGEMENT
Huang ZhilingChief Risk Officer
Mr. Huang has served as the Bank’s Chief Risk Officer since February 2011. He served as general manager of the risk management department of the Bank from April 2006. Mr. Huang was consecutively the director of the asset disposal review committee of China Cinda Asset Management Corporation from December 2000 to April 2006, director of asset disposal decision-making committee office of China Cinda Asset Management Corporation from November 2000 to December 2000, director of president office and director of the party committee office of China Cinda Asset Management Corporation from August 1999 to November 2000, deputy general manager of administrative office and secretary to the party team of China Construction Bank from June 1997 to August 1999. Mr. Huang is a researcher and a recipient of a special grant by PRC government. He obtained his Ph.D. degree in finance from Shaanxi Institute of Finance and Economics in 1991.
Yu JingboChief Audit Officer
Mr. Yu has served as the Bank’s Chief Audit Officer since March 2011. He was general manager of Zhejiang Branch of the Bank from March 2005. Mr. Yu was consecutively deputy general manager (in charge) of Zhejiang Branch of China Construction Bank from July 2004 to March 2005, deputy general manager of Zhejiang Branch of China Construction Bank from August 1999 to July 2004, and general manager of Hangzhou Branch from April 1997 to August 1999. Mr. Yu is a senior engineer. Mr. Yu obtained his bachelor’s degree in industrial and civil architecture from Tongji University in 1985 and his master’s degree in enterprise management from Hangzhou University in 1998.
Chen CaihongSecretary to the Board
Mr. Chen has served as secretary to the Board since August 2007. Mr. Chen was general manager of Seoul Branch of China Construction Bank from December 2003 to July 2007. Mr. Chen served consecutively as deputy director, director of administrative office, deputy general manager of Fujian Branch, and head of preparation team for Seoul Branch of China Construction Bank from March 1997 to December 2003. Mr. Chen is a senior economist. He graduated from Hubei Finance and Economics College with a bachelor’s degree in infrastructure economics in 1982 and obtained his master’s degree in public finance from the Research Institute for Fiscal Science of the MOF in 1986.
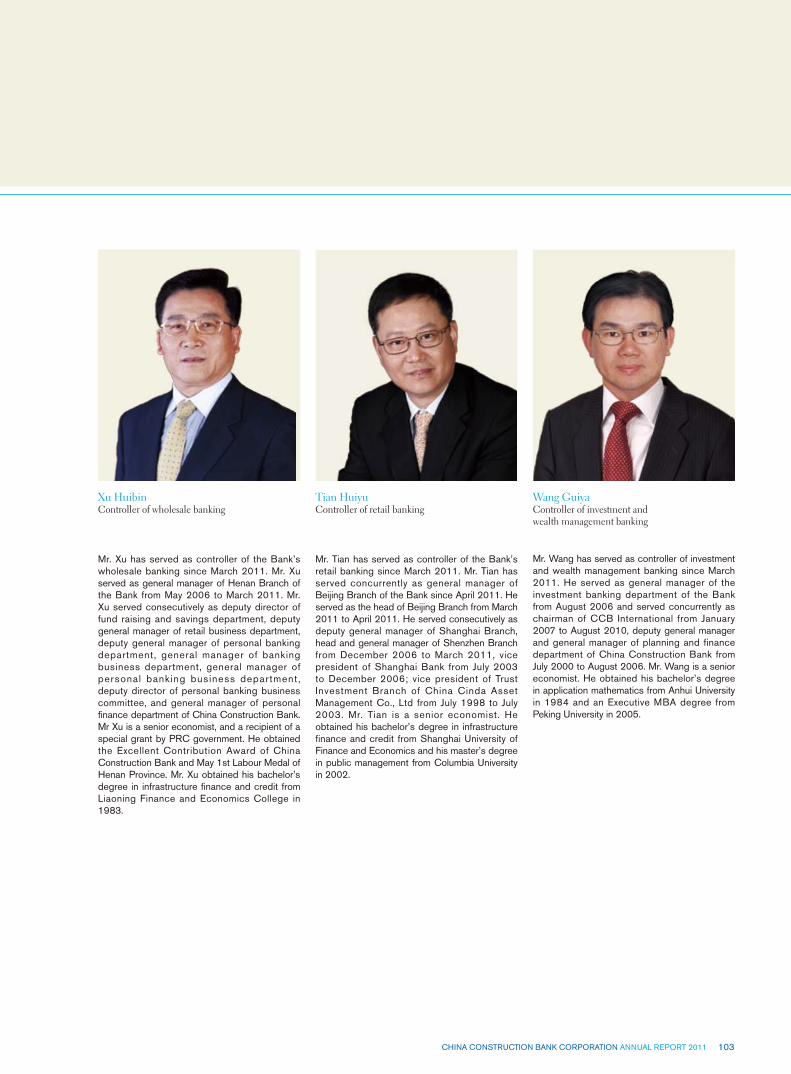
103CHINA CONSTRUCTION BANK CORPORATION ANNUAL REPORT 2011
Xu HuibinController of wholesale banking
Mr. Xu has served as controller of the Bank’s wholesale banking since March 2011. Mr. Xu served as general manager of Henan Branch of the Bank from May 2006 to March 2011. Mr. Xu served consecutively as deputy director of fund raising and savings department, deputy general manager of retail business department, deputy general manager of personal banking department, general manager of banking business department, general manager of personal banking business department, deputy director of personal banking business committee, and general manager of personal finance department of China Construction Bank. Mr Xu is a senior economist, and a recipient of a special grant by PRC government. He obtained the Excellent Contribution Award of China Construction Bank and May 1st Labour Medal of Henan Province. Mr. Xu obtained his bachelor’s degree in infrastructure finance and credit from Liaoning Finance and Economics College in 1983.
Tian HuiyuController of retail banking
Mr. Tian has served as controller of the Bank’s retail banking since March 2011. Mr. Tian has served concurrently as general manager of Beijing Branch of the Bank since April 2011. He served as the head of Beijing Branch from March 2011 to April 2011. He served consecutively as deputy general manager of Shanghai Branch, head and general manager of Shenzhen Branch from December 2006 to March 2011, vice president of Shanghai Bank from July 2003 to December 2006; vice president of Trust Investment Branch of China Cinda Asset Management Co., Ltd from July 1998 to July 2003. Mr. Tian is a senior economist. He obtained his bachelor’s degree in infrastructure finance and credit from Shanghai University of Finance and Economics and his master’s degree in public management from Columbia University in 2002.
Wang GuiyaController of investment and wealth management banking
Mr. Wang has served as controller of investment and wealth management banking since March 2011. He served as general manager of the investment banking department of the Bank from August 2006 and served concurrently as chairman of CCB International from January 2007 to August 2010, deputy general manager and general manager of planning and finance department of China Construction Bank from July 2000 to August 2006. Mr. Wang is a senior economist. He obtained his bachelor’s degree in application mathematics from Anhui University in 1984 and an Executive MBA degree from Peking University in 2005.

104 CHINA CONSTRUCTION BANK CORPORATION ANNUAL REPORT 2011
PROFILES OF DIRECTORS, SUPERVISORS AND SENIOR MANAGEMENT
Chan Mei SheungCompany secretary
Ms. Chan has served as the Bank’s company secretary since October 2007. She has been head of legal & compliance division of CCB International and acted as company secretary since then. Ms. Chan was group legal counsel and head of Legal Department in China Everbright Limited from July 2006 to October 2007. She also served as company secretary of China Everbright Limited during this period. She has been a member of the Mainland Legal Affairs Committee of the Law Society of Hong Kong from 2006 to 2010. She was group legal counsel and company secretary of Sing Tao News Corporation Limited from 2003 to 2005. She was the partner in charge of Corporate Finance and China Services Department of Hastings & Co. from 1999 to 2003. Ms. Chan is a member of the Law Society of Hong Kong and a Ministry of Justice of China-Appointed Attesting Officer. She is also a qualif ied solicitor in Hong Kong, England and Wales, and is a qualified solicitor and barrister in the Australian Capital Territory. She graduated from the University of Hong Kong with an honorary bachelor’s degree in law in 1987.
Yuen Yiu LeungQualified Accountant
Mr. Yuen has served as the Bank’s qualified accountant since August 2005. Mr. Yuen has been head of finance department of Hong Kong Branch of the Bank since September 2004, and has also been head of finance department of CCB International from January 2006 to May 2011. Prior to that, Mr. Yuen held the same position in the Hong Kong Branch of China Construction Bank from October 1995 to September 2004 and he served in several capacities at the internal control, finance and accounting functions of Standard Chartered Bank. Mr. Yuen is a fellow of the Hong Kong Institute of Certified Public Accountants, the Association of Chartered Certified Accountants, UK and the Chartered Institute of Management Accountants, UK and an associate of the Institute of Chartered Accountants in England & Wales. Mr. Yuen graduated from Hong Kong Polytechnic University with a professional diploma in management accountancy in 1988 and obtained a master’s degree in business administration from University of Wales in cooperation with Manchester Business School in 1998.
Company secretary and qualified accountant of the Bank

105CHINA CONSTRUCTION BANK CORPORATION ANNUAL REPORT 2011
The Board of the Bank is pleased to present its report together with the financial statements of the Group for the year ended 31 December 2011.
Principal activitiesThe Group is engaged in a range of banking services and related financial services.
Profit and dividendsThe profit of the Group for the year ended 31 December 2011 and the Group’s financial position as at that date are set out in the “Financial Statements” of this annual report.
In accordance with the resolutions passed at the annual general meeting 2010 held on 9 June 2011, the Bank paid an annual cash dividend for 2010 of RMB0.2122 per share (including tax), totalling approximately RMB53,052 million, to all of its shareholders whose names appeared on the register of members on 23 June 2011.
The Board recommends a cash dividend for 2011 of RMB0.2365 per share (including tax), subject to the approval of the annual general meeting 2011.
Pursuant to the Articles of Association of the Bank, the after-tax profits of the bank shall be distributed in accordance with the following order: making up for the losses of the previous years, allocating to the statutory reserve fund, allocating discretionary reserve fund and paying for the dividend of the shareholders. The dividend may be distributed in form of cash or shares.
The Bank has sound procedures and mechanism for the decision-making of profit distribution. During the process of preparing the profit distribution plan, the Board extensively collected the opinions and requirements from the shareholders, protected the legal rights and interests of the shareholders, and submitted the profit distribution plan to the general meeting for approval. The independent directors conducted due diligence and played their due roles in the decision-making process of the profit distribution plan. The Bank attaches great importance to the return of shareholders, and constantly pays cash dividends to the shareholders.
The amounts of cash dividends and ratios of cash dividends to net profit of the Bank for the previous three years are as follows:
(In millions of RMB) 2008 2009 2010
Cash dividends1 45,383 47,205 53,052
Ratio of cash dividends to net profit2 49.01% 44.22% 39.34%
1. Cash dividends include interim cash dividend and final cash dividend for the year.2. The net profit refers to the net profit attributable to equity shareholders of the Bank on a consolidated basis. Please refer to Note “Profit Distributions” in the “Financial Statements” of annual
reports of the related years for details of cash dividends.
ReservesPlease refer to the consolidated statement of changes in equity for details of the movements in the reserves of the Group for the year ended 31 December 2011.
Summary of financial informationPlease refer to the “Financial Highlights” of this annual report for the summary of the operating results, assets and liabilities of the Group for the five years ended 31 December 2011.
DonationsDonations made by the Group for the year ended 31 December 2011 were RMB47 million.
Property and equipmentPlease refer to Note “Fixed Assets” in the “Financial Statements” of this annual report for details of movements in the property and equipment of the Group for the year ended 31 December 2011.
Retirement benefitsPlease refer to Note “Accrued Staff Costs” in the “Financial Statements” of this annual report for details of the retirement benefits provided to employees of the Group.
Major customersFor the year ended 31 December 2011, the aggregate amount of interest income and other operating income generated from the five largest customers of the Group represented an amount not exceeding 30% of the total interest income and other operating income of the Group.
Ultimate parent company and its subsidiariesPlease refer to “Changes in Share Capital and Particulars of Shareholders-Substantial Shareholders of the Bank” and Note “Investments in Subsidiaries” in the “Financial Statements” for details of the Bank’s ultimate parent company and its subsidiaries respectively as at 31 December 2011.
106 CHINA CONSTRUCTION BANK CORPORATION ANNUAL REPORT 2011
REPORT OF THE BOARD OF DIRECTORS
Share capital and public floatThe Bank completed the rights issue of A-shares and H-shares in 2010. As of 31 December 2011, the Bank issued 250,010,977,486 shares in total (including 240,417,319,880 H-shares and 9,593,657,606 A-shares) and had 887,132 registered shareholders. The Bank was in compliance with the relevant requirements regarding public float under relevant laws and regulations as well as the listing rules of its listing venues.
Purchase, sale and redemption of sharesThere was no purchase, sale or redemption by the Bank or any of its subsidiaries of the shares of the Bank during the reporting period.
Pre-emptive rightsThe Articles of Association of the Bank and the relevant PRC laws do not have such provisions under which the Bank’s shareholders have pre-emptive rights. The Articles of Association provide that if the Bank wishes to increase its capital, it may issue new shares to non-specified investors, may issue shares to existing shareholders or issue shares by way of distribution to existing shareholders, may transfer its capital reserve to share capital, or by other means permitted by laws and regulations.
Use of proceedsThe proceeds raised from the rights issue of A-shares and H-shares in 2010 are all used to strengthen the capital base of the Bank.
The Bank issued subordinated bonds amounted to RMB40 billion in November 2011, the proceeds raised from which are used to replenish the supplementary capital of the Bank.
Top ten shareholders and their shareholdingsThe top ten shareholders of the Bank and their respective shareholdings at the end of 2011 are stated in “Changes in Share Capital and Particulars of Shareholders” of this annual report.
Directors, supervisors and senior managementPlease refer to the “Profiles of Directors, Supervisors and Senior Management” of this annual report for details of directors, supervisors and senior management of the Bank.
Independence of the independent non-executive directorsAll the independent non-executive directors of the Bank are independent, and their independence is in compliance with the independence guidelines set out in Rule 3.13 of the Listing Rules of Hong Kong Stock Exchange.
Material interests and short positionsAs at 31 December 2011, the interests and short positions of substantial shareholders and other persons in the shares of the Bank as recorded in the register required to be kept under section 336 of the SFO of Hong Kong were as follows:
NameInterests in H-shares and
short positions Nature % of issued H-shares % of total issued shares
CIC1 145,350,494,651 Long position 60.46 58.14
Temasek 22,655,348,797 Long position 9.42 9.06
1. On 14 November 2011, CIC declared interests on the website of the Hong Kong Stock Exchange. It disclosed that it indirectly held the interests of 145,350,494,651 H-shares of the Bank, accounting for 60.46% and 58.14% of the H-shares issued (240,417,319,880 shares) and total shares issued (250,010,977,486 shares) respectively. In this amount, Huijin held 142,590,494,651 H-shares of the Bank and Best Investment Corporation (a subsidiary engaged in overseas investment, which is indirectly held by CIC through CIC International) held 2,760,000,000 H-shares. In pursuant to the Articles of Association and internal system of CIC, there exists strict information isolation between CIC’s overseas investment and Huijin, and Huijin does not participate in the decision-making of CIC’s overseas investment.

107CHINA CONSTRUCTION BANK CORPORATION ANNUAL REPORT 2011
Directors’ and supervisors’ interests and short positions in shares, underlying shares and debentures of the BankExcept for the fact that Mr. Zhang Huajian, Mr. Li Weiping and Ms. Huang Shuping, the supervisors of the Bank, indirectly held 18,999 H-shares, 20,446 H-shares and 21,910 H-shares of the Bank, respectively, by participating in the employee stock incentive plan before they were appointed as supervisors, as at 31 December 2011, none of the directors and supervisors of the Bank had any interests or short positions in the shares, underlying shares and debentures of the Bank or its associated corporations (within the meaning of Part XV of the SFO of Hong Kong) as recorded in the register required to be kept under Section 352 of the SFO of Hong Kong or as otherwise notified to the Bank and Hong Kong Stock Exchange pursuant to Model Code for Securities Transactions by Directors of Listed Issuers in Appendix 10 of the Listing Rules.
As of 31 December 2011, except for the employee stock incentive plan, the Bank had not granted its directors or supervisors, or their respective spouses or children below the age of 18, any other rights to subscribe for the shares or debentures of the Bank or any of its associated corporations.
Directors ’ f inancial , business and family relationshipsThere are no relationships among the directors of the Bank, including financial, business, family or other material relationships.
Directors’ and supervisors’ interests in contracts and service contractsFor the year 2011, no director or supervisor of the Bank had any interest, whether directly or indirectly, in any contract of significance in relation to the Group’s business with the Bank or any of its holding companies or subsidiaries or subsidiaries of the Bank’s holding companies, apart from their respective service contracts.
None of the directors and supervisors of the Bank has entered into service contracts with the Bank that cannot be terminated by the Bank within one year without payment of compensation (other than statutory compensation).
Directors’ interests in competing businessesNone of the directors of the Bank directly or indirectly has any interest that constitutes or may constitute a competing business of the Bank.
Corporate governanceThe Bank is committed to maintaining the highest level of corporate governance practice. Please refer to the “Corporate Governance Report” of this annual report for details of corporate governance practices adopted by the Bank and its compliance with the Code on Corporate Governance Practices.
Connected transactionsContinuing connected transactions as defined by the Listing Rules of Hong Kong Stock Exchange of the Bank are as follows:
Taking deposits from connected personsThe Bank provides commercial banking services and products to its customers. Such services and products include taking deposits. Customers who place deposits with the Bank include the Bank’s connected persons under the Listing Rules of Hong Kong Stock Exchange. Therefore, such deposit activities are continuing connected transactions under the Listing Rules of Hong Kong Stock Exchange.
The Bank takes deposits from its connected persons on normal commercial terms that are comparable to or no more favourable than those offered to independent third parties, without using any assets of the Bank as mortgages. These transactions are exempt continuing connected transactions under rule 14A.65 (4) of the Listing Rules of Hong Kong Stock Exchange, and thus are exempt from the reporting, annual review, announcement and independent shareholders’ approval requirements under the Listing Rules of Hong Kong Stock Exchange.
Loans and credit facilities granted by the Bank to connected personsThe Bank extends loans and credit facilities (including long-term loans, short-term loans, consumption credit, credit card loans, mortgages, guarantees, mortgages for third party loans, comfort letters and discounted bills) to its customers in the ordinary and usual course of its business on normal commercial terms with reference to prevailing market rates. Customers who utilise the loans and credit facilities of the Bank include its connected persons defined in the Listing Rules of Hong Kong Stock Exchange. Therefore, these loans and credit facilities are continuing connected transactions under the Listing Rules of Hong Kong Stock Exchange.

108 CHINA CONSTRUCTION BANK CORPORATION ANNUAL REPORT 2011
REPORT OF THE BOARD OF DIRECTORS
The loans and credit facilities extended by the Bank to its connected persons in the ordinary and usual course of its business are based on normal commercial terms that are comparable to or no more favourable than those offered to independent third parties. These transactions are exempt continuing connected transactions under rule 14A.65 (1) of the Listing Rules of Hong Kong Stock Exchange, and thus are exempt from the reporting, annual review, announcement and independent shareholders’ approval requirements under the Listing Rules of Hong Kong Stock Exchange.
Service contracts between the Bank and its directors and supervisorsThe Bank entered into service contracts and indemnification agreements with each of its directors and supervisors. These contracts are exempt connected transactions under the Listing Rules of Hong Kong Stock Exchange, and thus are exempt from the reporting, annual review, announcement and independent shareholders’ approval requirements under the Listing Rules of Hong Kong Stock Exchange.
Please refer to the “Financial Statements” of this annual report and the notes therein for details of the related party transactions as defined by domestic laws and regulations.
Remuneration policy for the directors, supervisors and senior managementThe Bank has endeavored to improve its remuneration management measures and performance assessment systems for its directors, supervisors and senior management as guided by the relevant policies of China.
The Bank’s remuneration policy for directors, supervisors and senior management is based on the principle of combining incentives and disciplines, short-term incentives and long-term incentives, and governmental regulations and market adjustment, and has defined a structured remuneration system compromising basic annual salary, performance annual salary, mid-term and long-term incentives, allowances and welfare income. The Bank participates in the relevant PRC mandatory retirement schemes for its directors, supervisors and senior management and other employees. Since the state has not issued relevant policies, the Bank does not implement mid-term and long-term incentive plan for directors, supervisors and senior management.
Registration and management of insidersIn 2010, the Bank formulated the Provisional Management Measures on Insider of Insider Information , which was reviewed and approved by the Board meeting of the Bank. During the reporting period, pursuant to the Provisional Management Measures on Insider of Insider Information , relevant laws and regulat ions, and other rules and requirements of the Bank, the Bank strictly conducted the secrecy system regarding insider information, standardised the information transfer process, strengthened insider information management and controlled scope of insider of insider information.
The Bank is not aware of any insider trading of the shares of the Bank on the basis of insider information during the reporting period.
C o m p l i a n c e w i t h H o n g K o n g B a n k i n g (Disclosure) RulesIn preparing the financial report for 2011, the Bank has complied with the Banking (Disclosure) Rules , which is chapter 155M of the Banking Ordinance of Hong Kong.
AuditorsThe Bank’s domestic auditors were PricewaterhouseCoopers Z h o n g T i a n a n d i t s i n t e r n a t i o n a l a u d i t o r s w e r e PricewaterhouseCoopers for the year 2011. A proposal in relation to engage such two auditors as auditors of the Bank for the year 2011 was reviewed and approved on the annual general meeting of 2010. The engagement term is one year from the date of the annual general meeting of 2010 to the date of the annual general meeting of 2011.
Environmental protection and other social security issuesThere is no material environmental protection or other social security issues of the Bank.
By order of the board of directorsWang HongzhangChairman
23 March 2012

109CHINA CONSTRUCTION BANK CORPORATION ANNUAL REPORT 2011
In 2011, pursuant to the provisions the Company Law and the Articles of Association of the Bank, the board of supervisors earnestly performed its duties, strengthened its efforts in internal risk control, finance supervision, and performance and due diligence supervision, made contributions proactively and safeguarded the interest of the shareholders and the Bank.
Convening of the meetingsDuring the reporting period, the board of supervisors convened seven meetings in total, the details of which are as follows:
On 26 January 2011, it convened the 1st session of the board of supervisors in 2011, where it reviewed and adopted the 2010 Board of Supervisors’ Performance Summary as well as its 2011 Work Plan, studied and discussed Measures for Appraising Performance of Directors of Commercial Banks (Trial Implementation).
On 16 March 2011, it convened the 2nd session of the board of supervisors in 2011, where it studied and discussed the 2010 Board of Supervisors Report, 2010 annual work and relevant supervisory opinions of board of supervisors.
On 25 March 2011, it convened the 3rd session of the board of supervisors in 2011, where it reviewed and adopted the 2010 Annual Report and the summary thereof, the 2010 Profit Distribution Plan, specific report on deposit and actual use of proceeds from the rights issue of A-shares, the 2010 Social Responsibility Report and the 2010 Internal Control Assessment Report and the 2010 Board of Supervisors Report.
On 28 April 2011, it convened the 4th session of the board of supervisors in 2011, where it reviewed and adopted the Report for the First Quarter of 2011, studied and discussed directors’ performance assessment report, and implemented matters relating to the Measures for Appraising Performance of Directors of Commercial Banks (Trial Implementation).
On 22 June 2011, it convened the 5th session of the board of supervisors in 2011 by means of written proposals, where it reviewed and adopted the proposals on the nomination of shareholder representative supervisor candidates.
On 19 August 2011, it convened the 6th session of the board of supervisors in 2011, where it reviewed and adopted the Half-Year Report 2011 and the summary thereof, the proposals on the nomination of members of the finance and internal control supervision committee under the board of supervisors, studied and discussed Measures for Performance Supervision and Assessment of Board of Directors, Senior Management and their members by Board of Supervisors, debriefed supervision and survey work.
On 28 October 2011, it convened the 7th session of the board of supervisors in 2011, where it reviewed and adopted the Report for the Third Quarter of 2011, Measures
for Performance Supervision and Assessment of Board of Directors, Senior Management and their members by Board of Supervisors and the 2011 Supervisory Work Programme of the board of supervisors.
During the reporting period, the performance and due dil igence supervision committee under the board of supervisors convened four sessions and reviewed four proposals. The finance and internal control supervision committee under the board of supervisors convened five sessions and reviewed ten proposals.
Major work
strategic and overall importance. On matters regarding strategy planning and implementation, integrated operation, building of development capacity, and internal control and risk management, the board of supervisors provided opinions and suggestions actively, and thus pushed forward relevant work. Through holding surveys and seminars, onsite inspections and other means, the board of supervisors also developed in-depth understanding of the present operation and development situation of branches and outlets, urged relevant parties to study the bottom needs and promoted solutions to actual difficulties and problems.
key business fields, listened to submissions regarding loan management of government financing vehicles, off-balance sheet business, overseas business, risk management, case prevention and control, operation and development of rural banks, etc. It also indicated relevant risks at proper time and presented opinions and suggestions. The board of supervisors conducted five specified surveys covering operation and management of banking outlets, implementation of internal control regulations, risk analysis of land mortgage loans, operation of overseas entities, and post-lending management of corporate business, during which it presented opinions and suggestions, and as a result prompted the improvement of relevant work.
supervision, the board of supervisors revised and optimised Measures for Performance Supervision and Assessment of Board of Directors, Senior Management and their members by Board of Supervisors. Through attending meetings, reviewing analysis materials and performance report, holding interviews and seminars and making performance ratings, the board of supervisors strongly supervised the corporate governance practice of the Bank, material decision-making and implementation, and performance of directors and senior management members. They also seriously implemented the annual performance assessment, presented annual performance assessment reports of the Board, senior management and their members with reporting and disclosing in accordance with relevant rules.

110 CHINA CONSTRUCTION BANK CORPORATION ANNUAL REPORT 2011
REPORT OF THE BOARD OF SUPERVISORS
and disclosure of regular reports, continuously conducted qualified finance supervision, timely analysed new regulations and new changes of accounting standards, strengthened the relationship with functional departments, regularly communicated with external auditors to follow up the audit development, report compilation and reviewing work and presented opinions and requirements. It also focused on matters affecting the authenticity and fairness of financial reports. It supervised the implementation of insider registration and management of insider information as well as fund raising and reviewed regular reports and profit distribution plan, and presented the opinions.
of the basic standard for internal control of the Bank, conducted specific survey in respect of the implementation of the basic standard for internal control, reviewed analysis materials, interviewed with departments, conducted onsite surveys in several branches and drafted specific survey report and presented opinions and suggestions. Through attending meetings, listening to submissions, the board of supervisors conducted supervision over the establishment of implementation of internal control and the internal control assessment by the board of directors of the Bank, reviewed the assessment report of the internal control of the Bank and presented opinions in compliance with regulatory requirements.
consistently regulated the internal operation, created new working methods, enhanced communication and discussion, organised business training and dedicatedly improved the overall supervision level. All members of the board of supervisors performed their duties in a diligent, legitimate and compliant manner, attended sessions of the board of supervisors, participated in the research, review and voting regarding relevant motions and topics. They attended the meetings of the Board and the senior management and reviewed and analysed financial reports and operation materials, consistently focused on the reform and development of the Bank as well as the operation of corporate governance, participated in the various supervision work and surveys organised by the board of supervisors and diligently fulfilled the obligations.
Independent opinions on relevant matters of the BankOperations in compliance with laws and regulationsDuring the reporting period, the Bank carried out its operations in compliance with the law and its decision-making procedure was in compliance with the provisions of applicable laws and regulations as well as the Articles of Association
of the Bank. Its directors and senior executives fulfilled their duties in a diligent manner. The board of supervisors did not find any of their acts in the performance of their duties that were in breach of applicable laws and regulations as well as the Articles of Association of the Bank or damaged the Bank’s interest.
Financial reportingThe 2011 financial report of the Bank accurately and fairly reflected the financial position and operating results of the Bank.
Use of proceedsDuring the reporting period, the Bank issued RMB40 billion subordinated bonds. All of the proceeds were used to supplement the capital base of the Bank in accordance with the undertaking of the Bank.
Acquisition and sale of assetsDuring the reporting period, the board of supervisors was not aware of any insider transactions or any acts in acquisition or sale of assets detrimental to the interests of the shareholders or leading to a drain on the Bank’s assets.
Connected transactionsThe board of supervisors was not aware of any connected transactions that were detrimental to the interests of the Bank during the reporting period.
Internal controlDuring the reporting period, the Bank consistently enhanced and improved its internal control. The board of supervisors had no objection to the 2011 Internal Control Assessment Report.
Performance of social responsibilitiesDuring the reporting period, the Bank performed its social responsibilities in a proactive manner. The board of supervisors had no objection to the 2011 Social Responsibility Report.
Opinions on performance assessment of directors of the BankAll directors were evaluated as qualified in the 2011 performance assessment process.
By order of the board of supervisorsZhang FurongChairman of the board of supervisors
23 March 2012
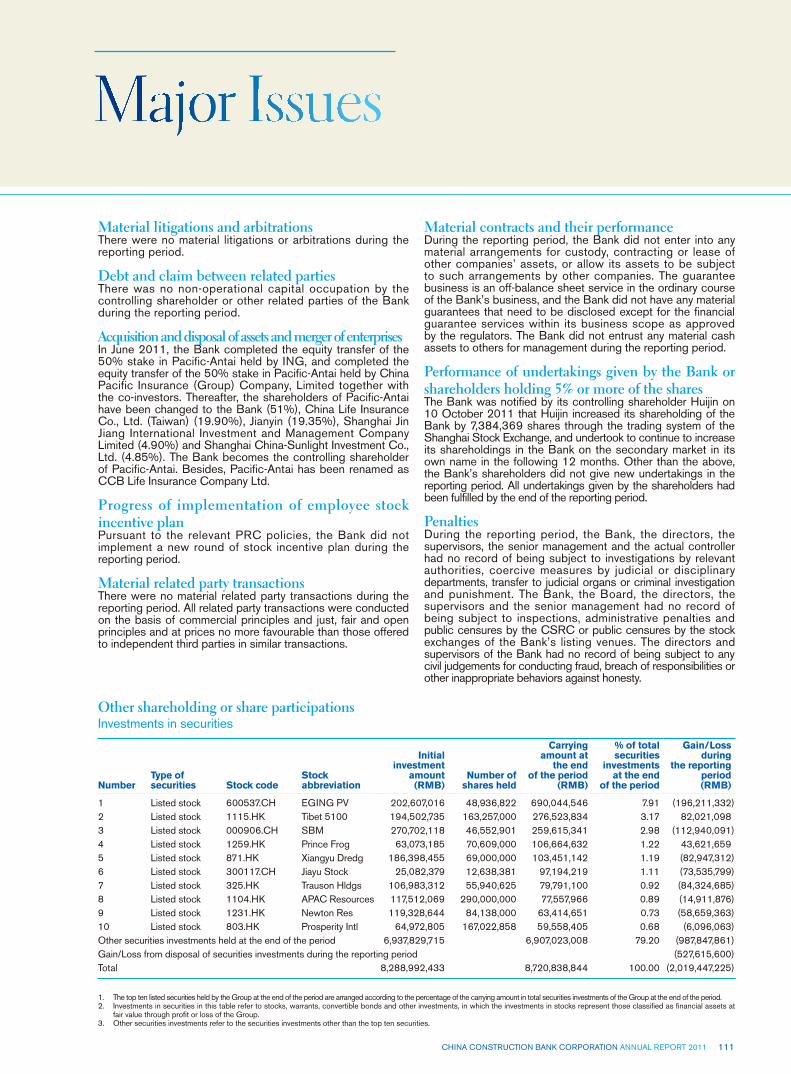
111CHINA CONSTRUCTION BANK CORPORATION ANNUAL REPORT 2011
Material litigations and arbitrationsThere were no material litigations or arbitrations during the reporting period.
Debt and claim between related partiesThere was no non-operational capital occupation by the controlling shareholder or other related parties of the Bank during the reporting period.
Acquisition and disposal of assets and merger of enterprisesIn June 2011, the Bank completed the equity transfer of the 50% stake in Pacific-Antai held by ING, and completed the equity transfer of the 50% stake in Pacific-Antai held by China Pacific Insurance (Group) Company, Limited together with the co-investors. Thereafter, the shareholders of Pacific-Antai have been changed to the Bank (51%), China Life Insurance Co., Ltd. (Taiwan) (19.90%), Jianyin (19.35%), Shanghai Jin Jiang International Investment and Management Company Limited (4.90%) and Shanghai China-Sunlight Investment Co., Ltd. (4.85%). The Bank becomes the controlling shareholder of Pacific-Antai. Besides, Pacific-Antai has been renamed as CCB Life Insurance Company Ltd.
Progress of implementation of employee stock incentive planPursuant to the relevant PRC policies, the Bank did not implement a new round of stock incentive plan during the reporting period.
Material related party transactionsThere were no material related party transactions during the reporting period. All related party transactions were conducted on the basis of commercial principles and just, fair and open principles and at prices no more favourable than those offered to independent third parties in similar transactions.
Material contracts and their performanceDuring the reporting period, the Bank did not enter into any material arrangements for custody, contracting or lease of other companies’ assets, or allow its assets to be subject to such arrangements by other companies. The guarantee business is an off-balance sheet service in the ordinary course of the Bank’s business, and the Bank did not have any material guarantees that need to be disclosed except for the financial guarantee services within its business scope as approved by the regulators. The Bank did not entrust any material cash assets to others for management during the reporting period.
Performance of undertakings given by the Bank or shareholders holding 5% or more of the sharesThe Bank was notified by its controlling shareholder Huijin on 10 October 2011 that Huijin increased its shareholding of the Bank by 7,384,369 shares through the trading system of the Shanghai Stock Exchange, and undertook to continue to increase its shareholdings in the Bank on the secondary market in its own name in the following 12 months. Other than the above, the Bank’s shareholders did not give new undertakings in the reporting period. All undertakings given by the shareholders had been fulfilled by the end of the reporting period.
PenaltiesDuring the reporting period, the Bank, the directors, the supervisors, the senior management and the actual controller had no record of being subject to investigations by relevant authorities, coercive measures by judicial or disciplinary departments, transfer to judicial organs or criminal investigation and punishment. The Bank, the Board, the directors, the supervisors and the senior management had no record of being subject to inspections, administrative penalties and public censures by the CSRC or public censures by the stock exchanges of the Bank’s listing venues. The directors and supervisors of the Bank had no record of being subject to any civil judgements for conducting fraud, breach of responsibilities or other inappropriate behaviors against honesty.
Other shareholding or share participationsInvestments in securities
NumberType of securities Stock code
Stock abbreviation
Initial investment
amount (RMB)
Number of shares held
Carrying amount at
the end of the period
(RMB)
% of total securities
investments at the end
of the period
Gain/Loss during
the reporting period (RMB)
1 Listed stock 600537.CH EGING PV 202,607,016 48,936,822 690,044,546 7.91 (196,211,332)2 Listed stock 1115.HK Tibet 5100 194,502,735 163,257,000 276,523,834 3.17 82,021,0983 Listed stock 000906.CH SBM 270,702,118 46,552,901 259,615,341 2.98 (112,940,091)4 Listed stock 1259.HK Prince Frog 63,073,185 70,609,000 106,664,632 1.22 43,621,6595 Listed stock 871.HK Xiangyu Dredg 186,398,455 69,000,000 103,451,142 1.19 (82,947,312)6 Listed stock 300117.CH Jiayu Stock 25,082,379 12,638,381 97,194,219 1.11 (73,535,799)7 Listed stock 325.HK Trauson Hldgs 106,983,312 55,940,625 79,791,100 0.92 (84,324,685)8 Listed stock 1104.HK APAC Resources 117,512,069 290,000,000 77,557,966 0.89 (14,911,876)9 Listed stock 1231.HK Newton Res 119,328,644 84,138,000 63,414,651 0.73 (58,659,363)10 Listed stock 803.HK Prosperity Intl 64,972,805 167,022,858 59,558,405 0.68 (6,096,063)Other securities investments held at the end of the period 6,937,829,715 6,907,023,008 79.20 (987,847,861)Gain/Loss from disposal of securities investments during the reporting period (527,615,600)Total 8,288,992,433 8,720,838,844 100.00 (2,019,447,225)
1. The top ten listed securities held by the Group at the end of the period are arranged according to the percentage of the carrying amount in total securities investments of the Group at the end of the period.2. Investments in securities in this table refer to stocks, warrants, convertible bonds and other investments, in which the investments in stocks represent those classified as financial assets at
fair value through profit or loss of the Group.3. Other securities investments refer to the securities investments other than the top ten securities.

112 CHINA CONSTRUCTION BANK CORPORATION ANNUAL REPORT 2011
MAJOR ISSUES
Interests of the Bank in shares of other listed companies
Stock codeStock abbreviation
Initial investment
amount (RMB)
% of shareholding
in the company
Carrying amount
at the end of the period
(RMB)
Gain/Loss during the reporting
period (RMB)
Changes in equity
during the reporting
period (RMB) Accounting item Sources of shares
601600 CHALCO 855,216,651 5.08 4,409,870,375 245,765,813 (2,755,301,199) Available-for-sale financial assets
Investment held through debt equity swap
000792 QINGHAI SALT LAKE
136,572,470 3.94 1,995,723,446 9,327,061 (2,854,649,246) Available-for-sale financial assets
Investment held through debt equity swap
600068 G.C.L 345,324,902 6.39 1,716,460,376 54,773,907 (899,880,458) Available-for-sale financial assets
Investment held through debt equity swap
601989 CSIC 340,290,000 1.30 906,258,735 – 906,258,735 Available-for-sale financial assets
Investment held through debt equity swap
600984 SCMC 35,320,486 13.75 97,515,031 38,974,306 (94,093,678) Available-for-sale financial assets
Investment held through debt equity swap
600462 Y.S.B.P 13,030,622 3.89 62,955,605 32,913,217 (39,202,222) Available-for-sale financial assets
Investment held through debt equity swap
Total 1,725,755,131 9,188,783,568 381,754,304 (5,736,868,068)
1. The table shows the shares of other listed companies which are 1% or more than 1% held by the Group and classified as available-for-sale financial assets.2. Gain/Loss during the reporting period refers to the effect of the investment on the consolidated net profit of the Group for the reporting period.
Interests in non-listed financial institutions
Name of the company
Initial investment
amount (RMB)
Number of shares held
% of shareholding
in the company
Carrying amount at the end of the period
(RMB)
Gain/Loss during the reporting
period (RMB)
Changes in equity during the reporting
period (RMB) Accounting item Sources of shares
HuiShang Bank Corporation Ltd. 228,835,900 225,548,176 2.76 228,835,900 22,554,818 – Available-for-sale financial assets
Establishment, increase in share capital
China UnionPay Co., Ltd. 221,250,000 142,500,000 4.87 220,718,981 3,920,000 – Available-for-sale financial assets
Establishment, increase in share capital
QBE Hongkong and Shanghai Insurance Limited
98,758,409 19,939,016 25.50 123,602,594 22,717,532 – Interests in associates and jointly controlled entities
Share purchase and sale
Guangdong Development Bank Ltd.
48,558,031 13,423,847 0.09 48,558,031 – – Available-for-sale financial assets
Establishment of investment
Evergrowing Bank Co., Ltd. 41,125,000 95,823,000 1.58 41,125,000 – – Available-for-sale financial assets
Establishment of investment
Huarong Xiangjiang Bank 3,500,000 3,536,400 0.09 980,000 – – Available-for-sale financial assets
Establishment of investment
1. These do not include subsidiaries contained in the consolidated statements.2. Allowances for impairment losses have been deducted from the carrying amount at the end of the period.
Purchase and disposal of shares of other listed companies
Stock name
Number of shares at the beginning
of the period
Number of shares purchased
during the reporting period
Number of shares disposed
during the reporting period
Number of shares at the end
of the period
Amount of funds used
(RMB)
Investment gain/(loss)
(RMB)
Total 3,384,810,849 1,628,209,054 (2,601,021,694) 2,411,998,209 3,055,252,908 (536,066,233)

CHINA CONSTRUCTION BANK CORPORATION ANNUAL REPORT 2011
INDEPENDENT AUDITOR’S REPORT
113
To the shareholders of China Construction Bank Corporation(a joint stock company incorporated in the People’s Republic of China with limited liability)
We have audited the consolidated financial statements of China Construction Bank Corporation (the “Bank”) and its subsidiaries (together, the “Group”) set out on pages 114 to 229, which comprise the consolidated and Bank statements of financial position as at 31 December 2011, and the consolidated statement of comprehensive income, the consolidated and Bank statements of changes in equity and the consolidated statement of cash flows for the year then ended, and a summary of significant accounting policies and other explanatory information.
DIRECTORS’ RESPONSIBILITY FOR THE CONSOLIDATED FINANCIAL STATEMENTSThe directors of the Bank are responsible for the preparation of consolidated financial statements that give a true and fair view in accordance with International Financial Reporting Standards issued by the International Accounting Standards Board and the disclosure requirements of the Hong Kong Companies Ordinance, and for such internal control as the directors determine is necessary to enable the preparation of consolidated financial statements that are free from material misstatement, whether due to fraud or error.
AUDITOR’S RESPONSIBILITYOur responsibility is to express an opinion on these consolidated financial statements based on our audit and to report our opinion solely to you, as a body, and for no other purpose. We do not assume responsibility towards or accept liability to any other person for the contents of this report.
We conducted our audit in accordance with Hong Kong Standards on Auditing issued by the Hong Kong Institute of Certified Public Accountants. Those standards require that we comply with ethical requirements and plan and perform the audit to obtain reasonable assurance about whether the consolidated financial statements are free from material misstatement.
An audit involves performing procedures to obtain audit evidence about the amounts and disclosures in the consolidated financial statements. The procedures selected depend on the auditor’s judgment, including the assessment of the risks of material misstatement of the consolidated financial statements, whether due to fraud or error. In making those risk assessments, the auditor considers internal control relevant to the entity’s preparation of consolidated financial statements that give a true and fair view in order to design audit procedures that are appropriate in the circumstances, but not for the purpose of expressing an opinion on the effectiveness of the entity’s internal control. An audit also includes evaluating the appropriateness of accounting policies used and the reasonableness of accounting estimates made by the directors, as well as evaluating the overall presentation of the consolidated financial statements.
We believe that the audit evidence we have obtained is sufficient and appropriate to provide a basis for our audit opinion.
OPINIONIn our opinion, the consolidated financial statements give a true and fair view of the state of affairs of the Bank and of the Group as at 31 December 2011, and of the Group’s financial performance and cash flows for the year then ended in accordance with International Financial Reporting Standards and have been properly prepared in accordance with the disclosure requirements of the Hong Kong Companies Ordinance.
PricewaterhouseCoopersCertified Public Accountants
Hong Kong, 23 March 2012

114 CHINA CONSTRUCTION BANK CORPORATION ANNUAL REPORT 2011
CONSOLIDATED STATEMENT OF COMPREHENSIVE INCOME
For the year ended 31 December 2011 (Expressed in millions of RMB, unless otherwise stated)
Note 2011 2010
Interest income 482,247 377,783Interest expense (177,675) (126,283)
Net interest income 6 304,572 251,500
Fee and commission income 89,494 68,156Fee and commission expense (2,500) (2,024)
Net fee and commission income 7 86,994 66,132
Net trading gain 8 388 3,509Dividend income 9 158 228Net gain arising from investment securities 10 1,756 1,903Other operating income, net 11 5,535 2,508
Operating income 399,403 325,780Operating expenses 12 (144,537) (121,366)
254,866 204,414
Impairment losses on: – Loans and advances to customers (32,403) (25,641) – Others (3,380) (3,651)
Impairment losses 13 (35,783) (29,292)
Share of profits less losses of associates and jointly controlled entities 24 34
Profit before tax 219,107 175,156
Income tax expense 16 (49,668) (40,125)
Net profit 169,439 135,031
Other comprehensive income:Loss of available-for-sale financial assets arising during the year (966) (8,183)Less: Income tax relating to available-for-sale financial assets 318 1,995Reclassification adjustments for loss/(gain) included in profit or loss 265 (288)
(383) (6,476)Exchange difference on translating foreign operations (1,577) (1,057)Others 42 33
Other comprehensive income for the year, net of tax (1,918) (7,500)
Total comprehensive income for the year 167,521 127,531
Net profit attributable to:Equity shareholders of the Bank 169,258 134,844Non-controlling interests 181 187
169,439 135,031
Total comprehensive income attributable to:Equity shareholders of the Bank 167,401 127,363Non-controlling interests 120 168
167,521 127,531
Basic and diluted earnings per share (in RMB Yuan) 17 0.68 0.56
The notes on pages 121 to 229 form part of these financial statements.

CHINA CONSTRUCTION BANK CORPORATION ANNUAL REPORT 2011
CONSOLIDATED STATEMENT OF FINANCIAL POSITION
As at 31 December 2011 (Expressed in millions of RMB, unless otherwise stated)
115
Note 2011 2010
Assets:
Cash and deposits with central banks 18 2,379,809 1,848,029Deposits with banks and non-bank financial institutions 19 276,752 78,318Precious metals 22,718 14,495Placements with banks and non-bank financial institutions 20 109,040 63,962Financial assets at fair value through profit or loss 21 23,096 17,344Positive fair value of derivatives 22 14,127 11,224Financial assets held under resale agreements 23 200,045 181,075Interest receivable 24 56,776 44,088Loans and advances to customers 25 6,325,194 5,526,026Available-for-sale financial assets 26 675,058 696,848Held-to-maturity investments 27 1,743,569 1,884,057Debt securities classified as receivables 28 300,027 306,748Interests in associates and jointly controlled entities 30 2,069 1,777Fixed assets 31 94,222 83,434Land use rights 32 16,457 16,922Intangible assets 33 1,660 1,310Goodwill 34 1,662 1,534Deferred tax assets 35 21,410 17,825Other assets 36 18,143 15,301
Total assets 12,281,834 10,810,317
Liabilities:
Borrowings from central banks 2,220 1,781Deposits from banks and non-bank financial institutions 39 966,229 683,537Placements from banks and non-bank financial institutions 40 78,725 66,272Financial liabilities at fair value through profit or loss 41 33,656 15,287Negative fair value of derivatives 22 13,310 9,358Financial assets sold under repurchase agreements 42 10,461 4,922Deposits from customers 43 9,987,450 9,075,369Accrued staff costs 44 35,931 31,369Taxes payable 45 47,189 34,241Interest payable 46 80,554 65,659Provisions 47 5,180 3,399Debt securities issued 48 168,312 93,315Deferred tax liabilities 35 358 243Other liabilities 49 35,598 24,660
Total liabilities 11,465,173 10,109,412
Equity:
Share capital 50 250,011 250,011Capital reserve 51 135,178 135,136Investment revaluation reserve 52 6,383 6,706Surplus reserve 53 67,576 50,681General reserve 54 67,342 61,347Retained earnings 55 289,266 195,950Exchange reserve (4,615) (3,039)
Total equity attributable to equity shareholders of the Bank 811,141 696,792Non-controlling interests 5,520 4,113
Total equity 816,661 700,905
Total liabilities and equity 12,281,834 10,810,317
Approved and authorised for issue by the Board of Directors on 23 March 2012.
Zhang Jianguo Wong Kai-Man Zhao Xijun Vice chairman, executive director and president Independent non-executive director Independent non-executive director
The notes on pages 121 to 229 form part of these financial statements.

116 CHINA CONSTRUCTION BANK CORPORATION ANNUAL REPORT 2011
STATEMENT OF FINANCIAL POSITION
As at 31 December 2011 (Expressed in millions of RMB, unless otherwise stated)
Note 2011 2010
Assets:
Cash and deposits with central banks 18 2,373,493 1,841,867Deposits with banks and non-bank financial institutions 19 279,861 78,198Precious metals 22,718 14,495Placements with banks and non-bank financial institutions 20 110,533 68,528Financial assets at fair value through profit or loss 21 8,715 3,044Positive fair value of derivatives 22 13,073 10,153Financial assets held under resale agreements 23 200,045 181,075Interest receivable 24 56,420 43,861Loans and advances to customers 25 6,189,363 5,428,279Available-for-sale financial assets 26 663,583 693,031Held-to-maturity investments 27 1,742,342 1,883,927Debt securities classified as receivables 28 299,765 306,748Investments in subsidiaries 29 11,950 9,869Fixed assets 31 93,369 82,696Land use rights 32 16,404 16,865Intangible assets 33 1,176 1,273Deferred tax assets 35 22,003 18,774Other assets 36 34,077 32,122
Total assets 12,138,890 10,714,805
Liabilities:
Borrowings from central banks 2,210 1,781Deposits from banks and non-bank financial institutions 39 970,033 685,238Placements from banks and non-bank financial institutions 40 45,654 41,664Financial liabilities at fair value through profit or loss 41 30,966 12,940Negative fair value of derivatives 22 12,354 8,734Financial assets sold under repurchase agreements 42 11,594 11,089Deposits from customers 43 9,906,093 9,014,646Accrued staff costs 44 35,182 30,522Taxes payable 45 46,950 33,945Interest payable 46 80,312 65,592Provisions 47 5,180 3,399Debt securities issued 48 158,050 91,431Deferred tax liabilities 35 23 4Other liabilities 49 27,712 22,455
Total liabilities 11,332,313 10,023,440
Equity:
Share capital 50 250,011 250,011Capital reserve 51 135,178 135,136Investment revaluation reserve 52 6,472 6,743Surplus reserve 53 67,576 50,681General reserve 54 66,645 60,608Retained earnings 55 281,491 188,525Exchange reserve (796) (339)
Total equity 806,577 691,365
Total liabilities and equity 12,138,890 10,714,805
Approved and authorised for issue by the Board of Directors on 23 March 2012.
Zhang Jianguo Wong Kai-Man Zhao Xijun Vice chairman, executive director and president Independent non-executive director Independent non-executive director
The notes on pages 121 to 229 form part of these financial statements.

CHINA CONSTRUCTION BANK CORPORATION ANNUAL REPORT 2011
CONSOLIDATED STATEMENT OF CHANGES IN EQUITY
For the year ended 31 December 2011 (Expressed in millions of RMB, unless otherwise stated)
117
Attributable to equity shareholders of the Bank
Share capital
Capital reserve
Investment revaluation
reserveSurplus reserve
General reserve
Retained earnings
Exchange reserve
Non- controlling
interestsTotal
equity
As at 1 January 2011 250,011 135,136 6,706 50,681 61,347 195,950 (3,039) 4,113 700,905
Movements during the year – 42 (323) 16,895 5,995 93,316 (1,576) 1,407 115,756
(1) Total comprehensive income for the year – 42 (323) – – 169,258 (1,576) 120 167,521
(2) Changes in share capital – – – – – – – 1,325 1,325
i Acquisition of subsidiaries – – – – – – – 599 599
ii Capital injection by non-controlling interests – – – – – – – 435 435
iii Non-controlling interests of new subsidiaries – – – – – – – 315 315
iv Change in shareholdings in subsidiaries – – – – – – – (24) (24)
(3) Profit distribution – – – 16,895 5,995 (75,942) – (38) (53,090)
i Appropriation to surplus reserve – – – 16,895 – (16,895) – – –
ii Appropriation to general reserve – – – – 5,995 (5,995) – – –
iii Appropriation to equity shareholders – – – – – (53,052) – (38) (53,090)
As at 31 December 2011 250,011 135,178 6,383 67,576 67,342 289,266 (4,615) 5,520 816,661
As at 1 January 2010 233,689 90,266 13,163 37,421 46,806 136,112 (1,982) 3,545 559,020
Movements during the year 16,322 44,870 (6,457) 13,260 14,541 59,838 (1,057) 568 141,885
(1) Total comprehensive income for the year – 33 (6,457) – – 134,844 (1,057) 168 127,531
(2) Changes in share capital 16,322 44,837 – – – – – 440 61,599
i Rights issue 16,322 44,837 – – – – – – 61,159
ii Capital injection by non-controlling interests – – – – – – – 106 106
iii Non-controlling interests of new subsidiaries – – – – – – – 334 334
(3) Profit distribution – – – 13,260 14,541 (75,006) – (40) (47,245)
i Appropriation to surplus reserve – – – 13,260 – (13,260) – – –
ii Appropriation to general reserve – – – – 14,541 (14,541) – – –
iii Appropriation to equity shareholders – – – – – (47,205) – (40) (47,245)
As at 31 December 2010 250,011 135,136 6,706 50,681 61,347 195,950 (3,039) 4,113 700,905
The notes on pages 121 to 229 form part of these financial statements.

118 CHINA CONSTRUCTION BANK CORPORATION ANNUAL REPORT 2011
STATEMENT OF CHANGES IN EQUITY
For the year ended 31 December 2011 (Expressed in millions of RMB, unless otherwise stated)
Share capital
Capital reserve
Investment revaluation
reserveSurplus reserve
General reserve
Retained earnings
Exchange reserve
Total equity
As at 1 January 2011 250,011 135,136 6,743 50,681 60,608 188,525 (339) 691,365
Movements during the year – 42 (271) 16,895 6,037 92,966 (457) 115,212
(1) Total comprehensive income for the year – 42 (271) – – 168,950 (457) 168,264
(2) Profit distribution – – – 16,895 6,037 (75,984) – (53,052)
i Appropriation to surplus reserve – – – 16,895 – (16,895) – –
ii Appropriation to general reserve – – – – 6,037 (6,037) – –
iii Appropriation to equity shareholders – – – – – (53,052) – (53,052)
As at 31 December 2011 250,011 135,178 6,472 67,576 66,645 281,491 (796) 806,577
As at 1 January 2010 233,689 90,266 13,213 37,421 46,209 130,785 (264) 551,319
Movements during the year 16,322 44,870 (6,470) 13,260 14,399 57,740 (75) 140,046
(1) Total comprehensive income for the year – 33 (6,470) – – 132,604 (75) 126,092
(2) Changes in share capital 16,322 44,837 – – – – – 61,159
i Rights issue 16,322 44,837 – – – – – 61,159
(3) Profit distribution – – – 13,260 14,399 (74,864) – (47,205)
i Appropriation to surplus reserve – – – 13,260 – (13,260) – –
ii Appropriation to general reserve – – – – 14,399 (14,399) – –
iii Appropriation to equity shareholders – – – – – (47,205) – (47,205)
As at 31 December 2010 250,011 135,136 6,743 50,681 60,608 188,525 (339) 691,365
The notes on pages 121 to 229 form part of these financial statements.

CHINA CONSTRUCTION BANK CORPORATION ANNUAL REPORT 2011
CONSOLIDATED STATEMENT OF CASH FLOWS
For the year ended 31 December 2011 (Expressed in millions of RMB, unless otherwise stated)
119
Note 2011 2010
Cash flows from operating activities
Profit before tax 219,107 175,156
Adjustments for:
– Impairment losses 13 35,783 29,292
– Depreciation and amortisation 12 12,497 11,827
– Unwinding of discount (1,413) (799)
– Revaluation loss/(gain) on financial instruments at fair value through profit or loss 1,396 (1,659)
– Share of profit less losses of associates and jointly controlled entities (24) (34)
– Dividend income 9 (158) (228)
– Unrealised foreign exchange loss 3,013 1,847
– Interest expense on subordinated bonds issued 3,561 3,282
– Net gain on disposal of investment securities 10 (1,756) (1,903)
– Net gain on disposal of fixed assets and other long-term assets (489) (455)
271,517 216,326
Changes in operating assets:
Net increase in deposits with central banks and with banks and non-bank financial institutions (479,504) (485,985)
Net increase in placements with banks and non-bank financial institutions (39,399) (2,490)
Net increase in loans and advances to customers (849,238) (869,732)
Net (increase)/decrease in financial assets held under resale agreements (18,952) 408,498
Increase in other operating assets (35,472) (19,954)
(1,422,565) (969,663)
Changes in operating liabilities:
Net increase in borrowings from central banks 530 1,806
Net increase in placements from banks and non-bank financial institutions 14,509 29,407
Net increase in deposits from customers and from banks and non-bank financial institutions 1,212,274 992,829
Net increase in financial assets sold under repurchase agreements 5,540 4,899
Net increase/(decrease) in certificates of deposit issued 36,447 (1,967)
Income tax paid (41,897) (37,921)
Increase in other operating liabilities 48,659 23,645
1,276,062 1,012,698
Net cash from operating activities 125,014 259,361
The notes on pages 121 to 229 form part of these financial statements.

120 CHINA CONSTRUCTION BANK CORPORATION ANNUAL REPORT 2011
For the year ended 31 December 2011 (Expressed in millions of RMB, unless otherwise stated)
CONSOLIDATED STATEMENT OF CASH FLOWS
Note 2011 2010
Cash flows from investing activities
Proceeds from sale and redemption of investments 1,146,554 1,371,120
Dividends received 160 229
Proceeds from disposal of fixed assets and other long-term assets 1,409 713
Purchase of investment securities (971,164) (1,696,728)
Purchase of fixed assets and other long-term assets (23,312) (20,452)
Acquisition of subsidiaries, associates and jointly controlled entities (1,063) (18)
Net cash from/(used in) investing activities 152,584 (345,136)
Cash flows from financing activities
Rights issue – 61,159
Issue of subordinated bonds 39,945 –
Capital contribution by non-controlling interests 750 440
Dividends paid (53,078) (47,232)
Repayments of debt securities issued – (2,870)
Interest paid on bonds issued (3,200) (3,298)
Cash paid relating to other financing activities (51) –
Net cash (used in)/from financing activities (15,634) 8,199
Effect of exchange rate changes on cash and cash equivalents (4,800) (1,374)
Net increase/(decrease) in cash and cash equivalents 257,164 (78,950)
Cash and cash equivalents as at 1 January 56(1) 301,299 380,249
Cash and cash equivalents as at 31 December 56(1) 558,463 301,299
Cash flows from operating activities include:
Interest received 461,477 362,523
Interest paid, excluding interest expense on bonds issued (159,565) (116,793)
The notes on pages 121 to 229 form part of these financial statements.
CHINA CONSTRUCTION BANK CORPORATION ANNUAL REPORT 2011
NOTES TO THE FINANCIAL STATEMENTS
(Expressed in millions of RMB, unless otherwise stated)
121
1 COMPANY INFORMATIONThe history of China Construction Bank Corporation (the “Bank”) dates back to 1954, which was previously known as the People’s Construction Bank of China when it was established. It administered and disbursed government funds for construction and infrastructure related projects under the state economic plan. The People’s Construction Bank of China gradually became a full service commercial bank following the establishment of China Development Bank in 1994 to assume its policy lending functions. In 1996, the People’s Construction Bank of China changed its name to China Construction Bank (“CCB”). On 17 September 2004, China Construction Bank Corporation was formed as a joint-stock commercial bank in the People’s Republic of China (the “PRC”) as a result of a separation procedure undertaken by our predecessor, China Construction Bank. In October 2005 and September 2007, the Bank’s H-shares and A-shares were listed on Hong Kong Stock Exchange (Stock Code: 939) and Shanghai Stock Exchange (Stock Code: 601939) respectively.
The Bank obtained its finance permit No.B0004H111000001 from the China Banking Regulatory Commission (the “CBRC”) of the PRC. The Bank obtained its business license No.100000000039122 from the State Administration for Industry and Commerce of the PRC. The registered office of the Bank is located at No.25, Finance Street, Xicheng District, Beijing, the PRC.
The principal activities of the Bank and its subsidiaries (collectively the “Group”) are the provision of corporate and personal banking services, conducting treasury business, the provision of asset management, trustee, finance leasing, investment banking, insurance and other financial services. The Group mainly operates in Mainland China and also has several overseas branches and subsidiaries. For the purpose of these financial statements, Mainland China refers to the PRC excluding Hong Kong Special Administrative Region of the PRC (“Hong Kong”), Macau Special Administrative Region of the PRC and Taiwan. Overseas refers to countries and regions other than Mainland China.
The Bank is under the supervision of the banking regulatory bodies empowered by the State Council of the PRC (the “State Council”). The overseas financial operations of the Bank are under the supervision of their respective local jurisdictions. Central Huijin Investments Limited (“Huijin”), a wholly owned subsidiary of China Investment Corporation (“CIC”), exercises the rights and obligations as an investor on behalf of the PRC government.
These financial statements were authorised for issue by the board of directors of the Bank on 23 March 2012.
2 BASIS OF PREPARATIONThe group used the calendar year as the accounting year, which is from 1 January to 31 December.
These financial statements for the year ended 31 December 2011 comprise the Bank and its subsidiaries and the Group’s interests in associates and jointly controlled entities.
(1) Basis of measurement
These financial statements have been prepared on the historical cost basis except that: (i) financial instruments at fair value through profit or loss are measured at fair value; (ii) derivative financial instruments are measured at fair value; (iii) available-for-sale financial assets are measured at fair value; and (iv) certain non-financial assets are measured at deemed cost. The measurement basis of major assets and liabilities are further explained in Note 4.
(2) Functional and presentation currency
These financial statements are presented in RMB, unless otherwise stated, rounded to the nearest million, which is the functional currency of domestic operations of the Group. The functional currencies of overseas branches and subsidiaries are determined in accordance with the primary economic environment in which they operate, and are translated into RMB for the preparation of these financial statements according to Note 4(2)(b).
(3) Use of estimates and judgements
The preparation of financial statements requires management to make judgements, estimates and assumptions that affect the application of accounting policies and the reported amounts of assets and liabilities, income and expenses. Actual results may differ from these estimates.
The estimates and associated assumptions are reviewed on an ongoing basis. Revisions to accounting estimates are recognised in the period in which the estimates are revised and in any future periods affected.
Judgements that have a significant effect on the financial statements and estimates with a significant risk of material adjustments in the subsequent period are discussed in Note 4(22).

122 CHINA CONSTRUCTION BANK CORPORATION ANNUAL REPORT 2011
(Expressed in millions of RMB, unless otherwise stated)
NOTES TO THE FINANCIAL STATEMENTS
3 STATEMENT OF COMPLIANCEThese financial statements have been prepared in accordance with International Financial Reporting Standards (“IFRSs”) as issued by the International Accounting Standards Board (“IASB”) and the disclosure requirements of the Hong Kong Companies Ordinance. These financial statements also comply with the applicable disclosure provisions of the Rules Governing the Listing of Securities on The Stock Exchange of Hong Kong Limited.
The Group has adopted new or revised IFRSs effective for the current year. There is no early adoption of any new IFRSs not yet effective for the year ended 31 December 2011. The following revised IFRSs adopted are relevant to these financial statements:
Related Party Disclosures – It introduces an exemption from all of the disclosure requirements of IAS 24 for transactions among government related entities and with the government. Those disclosures are replaced with a requirement to disclose:
– The name of the government and the nature of their relationship;
– The nature and amount of any individually significant transactions; and
– The extent of any collectively-significant transactions qualitatively or quantitatively.
The adoption of new or revised IFRSs has no significant impact on the accounting policies of the Group. The accounting policies set out below have been applied consistently by the Group to all periods presented in these financial statements.
4 SIGNIFICANT ACCOUNTING POLICIES AND ACCOUNTING ESTIMATES(1) Consolidated financial statements
(a) Business combinations
The consideration transferred by the acquirer for the acquisition and the identifiable assets acquired and liabilities and contingent liabilities assumed in a business combination are measured initially at their fair values at the acquisition date. Where the cost of a business combination exceeds the Group’s interest in the fair value of the acquiree’s identifiable net assets, the difference is recognised as goodwill in accordance with the accounting policies set out in Note 4(9); where the cost of a business combination is less than the Group’s interest in the fair value of the acquiree’s identifiable net assets, the difference is recognised in profit or loss.
Acquisition date mentioned above is the date that the Group effectively obtains control of the acquiree.
(b) Subsidiaries and non-controlling interests
Subsidiaries are those enterprises controlled by the Bank. Control exists when the Bank has the power, directly or indirectly, to govern the financial and operating policies of an enterprise so as to obtain benefits from its operating activities. In assessing control, potential voting rights that presently are exercisable are taken into account.
For the separate financial statements of the Bank, investments in subsidiaries are accounted for at cost. At initial recognition, investment in subsidiaries is measured at: the cost of acquisition determined at the acquisition date when the subsidiaries are acquired through business combination; or the capital injected into the subsidiaries set up by the Group. Impairment losses on investments in subsidiaries are accounted for in accordance with the accounting policies as set out in Note 4(11).
The results and affairs of subsidiaries are included in the consolidated financial statements from the date that control commences until the date that control ceases. When preparing the consolidated financial statements, the Bank makes necessary adjustments on the accounting period and accounting policies of subsidiaries to comply with those of the Bank.
Intragroup balances and transactions, and any profits or losses arising from intragroup transactions are eliminated in full in preparing the consolidated financial statements.
The portion of a subsidiary’s net assets that is attributable to equity interests that are not owned by the Bank, whether directly or indirectly through subsidiaries, is treated as non-controlling interests and presented as “non-controlling interests” in the consolidated statement of financial position within total equity. The portion of net profit or loss and other comprehensive income of subsidiaries for the year attributable to non-controlling interests is separately presented in the consolidated statement of comprehensive income as a component of the Group’s net profit.

CHINA CONSTRUCTION BANK CORPORATION ANNUAL REPORT 2011
(Expressed in millions of RMB, unless otherwise stated)
123
NOTES TO THE FINANCIAL STATEMENTS
4 SIGNIFICANT ACCOUNTING POLICIES AND ACCOUNTING ESTIMATES (CONTINUED)(1) Consolidated financial statements (continued)
(c) Special purpose entities
The Group has established a number of Special Purpose Entities (“SPEs”) for investment and securitisation purposes. The Group evaluates the substance of its relationship with the SPEs as well as the SPEs’ risks and rewards to determine whether the Group controls the SPEs. The following circumstances, which may indicate a relationship in which the Group controls a SPE are taken into account: (i) in substance, the activities of the SPE are being conducted on behalf of the Group according to its specific business needs so that the Group obtains benefits from the SPE’s operations; (ii) in substance, the Group has the decision-making powers to obtain the majority of the benefits of the activities of the SPE; (iii) in substance, the Group has rights to obtain the majority of the benefits of the SPE and therefore may be exposed to risks incident to the activities of the SPE; and (iv) in substance, the Group retains the majority of the residual or ownership risks related to the SPE or its assets in order to obtain benefits from its activities. Where the evaluation result indicates that control exists, the Group will consolidate the SPE.
(d) Associates and jointly controlled entities
An associate is an enterprise in which the Group has significant influence. Significant influence is the power to participate in the financial and operating policy decisions of the investee but is not control or joint control over those policy decisions.
A jointly controlled entity is an enterprise which operates under joint control between the Group and other parties. Joint control is the contractually agreed sharing of control over an economic activity, and exists only when the strategic financial and operating decisions relating to the activity require the unanimous consent of the parties sharing the control.
Investments in associate or jointly controlled entity are accounted for using the equity method in the consolidated financial statements and are initially recorded at acquisition cost, and adjusted thereafter for the post acquisition change in the Group’s share of net assets of the associate or jointly controlled entity. The Group’s share of the post-acquisition, post-tax results of the associate or jointly controlled entity for the year is recognised in the consolidated statement of comprehensive income. The Group’s interest in associate or jointly controlled entity is included from the date that significant influence or joint control commences until the date that significant influence or joint control ceases.
Profits and losses resulting from transactions between the Group and its associate or jointly controlled entity are eliminated to the extent of the Group’s interest in the associate or jointly controlled entity.
The Group discontinues recognising its share of net losses of the associate or jointly controlled entity after the carrying amount of investments in associate and jointly controlled entity together with any long-term interests that in substance form part of the Group’s net investment in the associate or jointly controlled entity are reduced to zero, except to the extent that the Group has incurred legal or constructive obligations to assume additional losses. Where the associate or jointly controlled entity makes net profits subsequently, the Group resumes recognising its share of those profits only after its share of the profits equals the share of losses not recognised.
(2) Translation of foreign currencies
(a) Translation of foreign currency transactions
Foreign currency transactions are, on initial recognition, translated into the functional currency at the spot exchange rates at the dates of the transactions. At the end of each reporting period, monetary items denominated in foreign currencies are translated into the functional currency at the spot exchange rates at that date. The resulting exchange differences are recognised in profit or loss. Non-monetary items denominated in foreign currencies that are measured at historical cost are translated into functional currency using the spot exchange rates at the transaction dates. Non-monetary items denominated in foreign currencies that are measured at fair value are translated using the spot exchange rates at the dates the fair values are determined; exchange differences are recognised in profit or loss, except for the differences arising from the translation of available-for-sale equity instruments, which are recognised in other comprehensive income.
(b) Translation of financial statements denominated in foreign currencies
Foreign currency financial statements of overseas branches and subsidiaries are translated into RMB for the preparation of consolidated financial statements. At the end of each reporting period, the assets and liabilities in the financial statements denominated in foreign currencies are translated into RMB at the spot exchange rates ruling at that date. The income and expenses of foreign operations are translated into RMB at the spot exchange rates or the rates that approximate the spot exchange rates on the transaction dates. Foreign exchange differences arising from foreign operations are recognised as “exchange reserve” in the shareholder’s equity in the statement of financial position. The effect of exchange rate changes on cash is presented separately in the statement of cash flows.

124 CHINA CONSTRUCTION BANK CORPORATION ANNUAL REPORT 2011
(Expressed in millions of RMB, unless otherwise stated)
NOTES TO THE FINANCIAL STATEMENTS
4 SIGNIFICANT ACCOUNTING POLICIES AND ACCOUNTING ESTIMATES (CONTINUED)(3) Financial instruments
(a) Categorisation
The Group classifies financial instruments into different categories at inception, depending on the purposes for which the assets were acquired or the liabilities were incurred. The categories are: financial assets and financial liabilities at fair value through profit or loss, held-to-maturity investments, loans and receivables, available-for-sale financial assets and other financial liabilities.
Financial assets and financial liabilities at fair value through profit or loss
Financial assets and financial liabilities at fair value through profit or loss include those classified as held for trading, and those designated as at fair value through profit or loss.
A financial asset or financial liability is classified as held for trading if it is: (i) acquired or incurred principally for the purpose of selling or repurchasing it in the near term; (ii) part of a portfolio of identified financial instruments that are managed together and for which there is evidence of a recent actual pattern of short-term profit-taking; or (iii) a derivative (except for a derivative that is a designated and effective hedging instrument or a financial guarantee contract).
Financial assets or financial liabilities are designated at fair value through profit or loss upon initial recognition when: (i) the financial assets or financial liabilities are managed, evaluated and reported internally on a fair value basis; (ii) the designation eliminates or significantly reduces an accounting mismatch in the gain and loss recognition arising from the difference in measurement basis of the financial assets or financial liabilities; or (iii) if a contract contains one or more embedded derivatives, an entity may designate the entire hybrid (combined) contract as a financial asset or financial liability at fair value through profit or loss unless: the embedded derivative(s) does not significantly modify the cash flows that otherwise would be required by the contract; or it is clear with little or no analysis when a similar hybrid (combined) instrument is first considered that separation of the embedded derivative(s) is prohibited.
Held-to-maturity investments
Held-to-maturity investments are non-derivative financial assets with fixed or determinable payments and fixed maturity that the Group has the positive intention and ability to hold to maturity, other than: (i) those that the Group, upon initial recognition, designates as at fair value through profit or loss or as available-for-sale; or (ii) those that meet the definition of loans and receivables.
Loans and receivables
Loans and receivables are non-derivative financial assets with fixed or determinable payments that are not quoted in an active market, other than: (i) those that the Group intends to sell immediately or in the near term, which will be classified as held for trading; (ii) those that the Group, upon initial recognition, designates as at fair value through profit or loss or as available-for-sale; or (iii) those where the Group may not recover substantially all of its initial investment, other than because of credit deterioration, which will be classified as available-for-sale. Loans and receivables mainly comprise deposits with central banks, deposits and placements with banks and non-bank financial institutions, financial assets held under resale agreements, loans and advances to customers, and debt securities classified as receivables.
Available-for-sale financial assets
Available-for-sale financial assets are non-derivative financial assets that are designated as available-for-sale or are not classified as: (i) financial assets at fair value through profit or loss; (ii) held-to-maturity investments; or (iii) loans and receivables.
Other financial liabilities
Other financial liabilities are financial liabilities other than those designated as at fair value through profit or loss and mainly comprise borrowings from central banks, deposits and placements from banks and non-bank financial institutions, financial assets sold under repurchase agreements, deposits from customers and debt securities issued.
Investment securities in the financial statements comprise the securities classified as held-to-maturity investments, available-for-sale financial assets and debt securities classified as receivables.

CHINA CONSTRUCTION BANK CORPORATION ANNUAL REPORT 2011
(Expressed in millions of RMB, unless otherwise stated)
125
NOTES TO THE FINANCIAL STATEMENTS
4 SIGNIFICANT ACCOUNTING POLICIES AND ACCOUNTING ESTIMATES (CONTINUED)(3) Financial instruments (continued)
(b) Derivatives and embedded derivatives
The Group uses derivatives to hedge its exposure to foreign exchange and interest rate risks. Derivatives are recognised at fair value upon initial recognition. The positive fair value is recognised as an asset while the negative fair value is recognized as a liability. The gain or loss on re-measurement to fair value is recognised in profit or loss.
Certain derivatives are embedded into non-derivative hybrid instruments (the host contracts). The embedded derivatives are separated from the host contract and accounted for as a separate derivative when (i) the economic characteristics and risks of the embedded derivative are not closely related to the host contract; (ii) a separate instrument with the same terms as the embedded derivative would meet the definition of a derivative; and (iii) the hybrid (combined) instrument is not measured at fair value with changes in fair value recognised in profit or loss. When the embedded derivative is separated, the host contract is accounted for as a financial instrument in accordance with the accounting policies as set out in Note 4(3).
(c) Recognition and derecognition
All financial assets and financial liabilities are recognised in the statement of financial position, when and only when, the Group becomes a party to the contractual provisions of the instrument.
The Group derecognises a financial asset if the part being considered for derecognition meets one of the following conditions: (i) the contractual rights to receive the cash flows from the financial asset expire; (ii) the contractual rights to receive the cash flows of the financial asset have been transferred and the Group transfers substantially all the risks and rewards of ownership of the financial asset; or (iii) the Group retains the contractual rights to receive the cash flows of the financial asset, but assumes a contractual obligation to pay the cash flows to the eventual recipient in an agreement that meets all the conditions of transfer of cash flows and transfers substantially all the risks and rewards of ownership of the financial asset.
The difference between the carrying amount of the financial asset derecognised and the consideration received and the cumulative changes in fair value previously recognised in equity are recognised in profit or loss.
If the Group neither transfers nor retains substantially all the risks and rewards of ownership of the financial asset, but retains control, the Group continues to recognise the financial asset to the extent of its continuing involvement in the financial asset. If the Group has not retained control, it derecognises the financial asset and recognises separately as assets or liabilities any rights and obligations created or retained in the transfer.
The financial liability is derecognised only when: (i) the underlying present obligation specified in the contracts is discharged, cancelled or expired, or (ii) an agreement between the Group and an existing lender to replace the original financial liability with a new financial liability with substantially different terms, or a substantial modification of the terms of an existing financial liability is accounted for as an extinguishment of the original financial liability and recognition of a new financial liability.
The difference between the carrying amount of the financial liability derecognised and the consideration paid is recognised in profit or loss.
(d) Measurement
Financial instruments are measured initially at fair value plus, in the case of a financial instrument not at fair value through profit or loss, transaction costs that are directly attributable to the acquisition or issue of the instrument. Transaction costs for financial instruments at fair value through profit or loss are expensed immediately.
Subsequent to initial recognition, held-to-maturity investments, loans and receivables and other financial liabilities are measured at amortised cost, while other categories of financial instruments are measured at fair value, without any deduction for transaction costs that may occur on sale or other disposal. Investments in available-for-sale equity instruments that do not have a quoted market price in an active market and whose fair value cannot be reliably measured, and derivatives that are linked to and must be settled by delivery of such unquoted equity instruments are measured at cost less impairment losses, if any.
Gains and losses from changes in the fair value of financial instruments at fair value through profit or loss are recognised in profit or loss.
Unrealised gains and losses arising from changes in the fair value of available-for-sale financial assets are recognised in other comprehensive income and accumulated separately in equity, except for impairment losses and foreign exchange gains and losses on monetary items such as debt securities which are recognised in profit or loss.
When the available-for-sale financial assets are sold, gains or losses on disposal are recognised in profit or loss. Gains or losses on disposal include those previously recognised in other comprehensive income and reclassified into the profit or loss.
For financial assets and financial liabilities carried at amortised cost, a gain or loss is recognised in profit or loss when the financial asset or financial liability is derecognised, impaired, or through the amortisation process.

126 CHINA CONSTRUCTION BANK CORPORATION ANNUAL REPORT 2011
(Expressed in millions of RMB, unless otherwise stated)
NOTES TO THE FINANCIAL STATEMENTS
4 SIGNIFICANT ACCOUNTING POLICIES AND ACCOUNTING ESTIMATES (CONTINUED)(3) Financial instruments (continued)
(e) Impairment
At the end of each reporting period, the Group assesses the carrying amount of financial assets (except for those at fair value through profit or loss). If there is any objective evidence that a financial asset is impaired, the Group will recognise the impairment loss in profit or loss. Losses expected as a result of future events, no matter how likely, are not recognised as impairment losses.
Objective evidence that a financial asset is impaired includes one or more events that occurred after the initial recognition of the asset where the event (or events) has an impact on the estimated future cash flows of the financial asset that can be reliably estimated. Objective evidence includes the following loss event:
– significant financial difficulty of the borrower or issuer;
– a breach of contract, such as a default or delinquency in interest or principal payments;
– the Group, for economic or legal reasons relating to the borrower’s financial difficulty, granting to the borrower a concession that the Group would not otherwise consider;
– it becoming probable that the borrower will enter bankruptcy or other financial reorganisation;
– disappearance of an active market for financial assets because of financial difficulties;
– observable data indicating that there is a measurable decrease in the estimated future cash flows from a group of financial assets since the initial recognition of those assets, although the decrease cannot yet be identified with the individual financial assets in the group, including: adverse changes in the payment status of borrowers in the group, an increase in the unemployment rate in the geographical area of the borrowers, a decrease in property prices for mortgages in the relevant area, or adverse changes in industry conditions that affect the borrowers in the group;
– significant changes in the technological, market, economic or legal environment that have an adverse effect on the issuer of an equity instrument;
– a significant or prolonged decline in the fair value of an investment in an equity instrument below its cost; and
– other objective evidence indicating there is an impairment of the financial asset.
Loans and receivables and held-to-maturity investments
Individual assessment
Loans and receivables and held-to-maturity investments, which are considered individually significant, are assessed individually for impairment. If there is objective evidence that an impairment loss on loans and receivables or held-to-maturity investments carried at amortised cost has been incurred on an individual basis, the amount of the loss is measured as the difference between the asset’s carrying amount and the present value of estimated future cash flows discounted at the asset’s original effective interest rate, and recognised in profit or loss.
Cash flows relating to short-term loans and receivables and held-to-maturity investments are not discounted if the effect of discounting is immaterial. The calculation of the present value of the estimated future cash flows of a collateralised loan or receivable reflects the cash flows that may result from foreclosure less costs for obtaining and selling the collateral, whether or not foreclosure is probable.
Collective assessment
Homogeneous groups of loans and advances to customers not considered individually significant and individually assessed loans and receivables and held-to-maturity investments with no objective evidence of impairment on an individual basis are assessed for impairment losses on a collective basis. If there is observable data indicating that there is a measurable decrease in the estimated future cash flows from a group of financial assets since the initial recognition of those financial assets, the impairment is recognised and recorded in profit or loss.
For homogeneous groups of loans and advances that are not considered individually significant, the Group adopts a flow rate methodology to assess impairment losses on a collective basis. This methodology utilises a statistical analysis of historical trends of probability of default and amount of consequential loss, as well as an adjustment of observable data that reflects the current economic conditions.

CHINA CONSTRUCTION BANK CORPORATION ANNUAL REPORT 2011
(Expressed in millions of RMB, unless otherwise stated)
127
NOTES TO THE FINANCIAL STATEMENTS
4 SIGNIFICANT ACCOUNTING POLICIES AND ACCOUNTING ESTIMATES (CONTINUED)(3) Financial instruments (continued)
(e) Impairment (continued)Loans and receivables and held-to-maturity investments (continued)
Collective assessment (continued)
Loans and receivables and held-to-maturity investments which are individually significant and therefore have been individually assessed but for which no impairment can be identified, are grouped together in portfolios of similar credit risk characteristics for the purpose of assessing a collective impairment loss. The collective impairment loss is assessed after taking into account: (i) historical loss experience in portfolios of similar risk characteristics; (ii) the emergence period between a loss occurring and that loss being identified; and (iii) the current economic and credit environments and whether in management’s experience these indicate that the actual losses level is likely to be greater or less than that suggested by historical experience.
The emergence period between a loss occurring and its identification is determined by management based on the historical experience of the markets where the Group operates.
Impairment losses recognised on a collective basis represent an interim step pending the identification of impairment losses on individual assets (which are subject to individual assessment) in the pool of financial assets that are collectively assessed for impairment.
At the end of each reporting period, collective assessment covers those loans and receivables and held-to-maturity investments that were impaired but was not individually identified as such until some time in the future. As soon as information is available to specifically identify objective evidence of impairment on individual assets in a pool, those assets are removed from the pool of collectively assessed financial assets.
Impairment reversal and loan write-off
If, in a subsequent period, the amount of the impairment loss on loans and receivables and held-to-maturity investments decreases and the decrease can be related objectively to an event occurring after the impairment was recognised, the previously recognised impairment loss is reversed. The amount of the reversal is recognised in profit or loss. The reversal shall not result in a carrying amount of the financial asset that exceeds the amortised cost at the date of the reversal had the impairment not been recognised.
When the Group determines that a loan has no reasonable prospect of recovery after the Group has completed all the necessary legal or other proceedings, the loan is written off against its allowance for impairment losses. If in a subsequent period the loan written off is recovered, the amount recovered will be recognised in profit or loss through impairment losses.
Rescheduled loans
Rescheduled loans are loans that have been restructured due to deterioration in the borrower’s financial position to the extent that the borrower is unable to repay according to the original terms and where the Group has made concessions that it would not otherwise consider under normal circumstances. Rescheduled loans are assessed individually and classified as impaired loans and advances upon restructuring. Rescheduled loans are subject to ongoing monitoring. Once a rescheduled loan has met specific conditions by the end of the observation period of normally 6 months, with the approval from management, they would no longer be considered as impaired.
Available-for-sale financial assets
When an available-for-sale financial asset is impaired, the cumulative loss arising from decline in fair value that had been recognised in other comprehensive income is reclassified to the profit or loss even though the financial asset has not been derecognised. The amount of the cumulative loss that is removed from equity is the difference between the acquisition cost (net of any principal repayment and amortisation) and current fair value, less any impairment loss on that financial asset previously recognised in profit or loss. For available-for-sale investments in equity instruments measured at cost, the amount of any impairment loss is measured as the difference between the carrying amount of the financial asset and the present value of estimated future cash flows discounted at the current market rate of return for a similar financial asset and recognised in profit or loss.
If, in a subsequent period, the fair value of available-for-sale financial assets increases and the increase can be objectively related to an event occurring after the impairment loss was recognised, the impairment loss shall be treated in accordance with the following principles: (i) the impairment loss on debt instruments classified as available-for-sale shall be reversed, with the amount of the reversal recognised in profit or loss; (ii) the impairment loss on equity instruments classified as available-for-sale shall not be reversed through the profit or loss. Any subsequent increase in the fair value of such assets is recognised in other comprehensive income; or (iii) the impairment loss in respect of available-for-sale equity investments carried at cost shall not be reversed.
128 CHINA CONSTRUCTION BANK CORPORATION ANNUAL REPORT 2011
(Expressed in millions of RMB, unless otherwise stated)
NOTES TO THE FINANCIAL STATEMENTS
4 SIGNIFICANT ACCOUNTING POLICIES AND ACCOUNTING ESTIMATES (CONTINUED)(3) Financial instruments (continued)
(f) Fair value measurement
If there is an active market for financial instruments, the fair value of financial instruments is based on quoted market prices without any deduction for transaction costs that may occur on sales or disposals. The appropriate quoted price in an active market for financial assets held or liabilities to be issued is usually the current bid price and for financial assets to be acquired or liabilities held, the asking price. A quoted price is from an active market where price information is readily and regularly available from an exchange, dealer, industry group or pricing service agency and that price information represents actual and regularly occurring market transactions on an arm’s length basis.
If a quoted market price is not available, the fair value of the financial instruments is estimated using valuation techniques. Valuation techniques applied include recent arm’s length market transactions between knowledgeable and willing parties, reference to the fair value of another instrument that is substantially the same, discounted cash flow analysis and option pricing models. The Group selects valuation techniques that are commonly accepted by market participants for pricing the instruments and these techniques have been demonstrated to provide reliable estimates of prices obtained in actual market transactions. Periodically, the Group reviews the valuation techniques and tests them for validity.
(g) Offsetting
Financial assets and financial liabilities are offset and the net amount is reported in the statement of financial position when the Group has a legally enforceable right to offset the recognised amounts and the transactions are intended to be settled on a net basis, or by realising the asset and settling the liability simultaneously.
(h) Securitisations
The Group securitises certain loans, which generally involves the sale of these assets to SPEs, which in turn issue securities to investors. Interests in the securitised financial assets may be retained in the form of credit enhancement or subordinated tranches, or other residual interests (“retained interests”). Retained interests are carried at fair value on inception date on the Group’s statement of financial position. Gains or losses on securitisation are the difference between the carrying amount of the transferred financial assets and the consideration received (including retained interest) which is recognised in profit or loss.
(i) Financial assets held under resale agreements and financial assets sold under repurchase agreements
Financial assets held under resale agreements are transactions where the Group acquires financial assets which will be resold at a predetermined price at a future date under resale agreements. Financial assets sold under repurchase agreements are transactions where the Group sells financial assets which will be repurchased at a predetermined price at a future date under repurchase agreements.
The cash advanced or received is recognised as amounts held under resale or sold under repurchase agreements in the statement of financial position. Assets held under resale agreements are not recognised. Assets sold under repurchase agreements continue to be recognised in the statement of financial position.
The difference between the purchase and resale consideration, and that between the sale and repurchase consideration, is amortised over the period of the respective transaction using the effective interest method and is included in interest income and interest expenses respectively.
(4) Precious metals
Precious metals comprise gold and other precious metals. Precious metals that are acquired by the Group principally for trading purpose are initially recognised at fair value and re-measured at fair value less cost to sell. The changes in fair value less cost to sell are included in the statement of comprehensive income. Precious metals that are not acquired by the Group principally for trading purpose are carried at lower of cost and net realisable value.

CHINA CONSTRUCTION BANK CORPORATION ANNUAL REPORT 2011
(Expressed in millions of RMB, unless otherwise stated)
129
NOTES TO THE FINANCIAL STATEMENTS
4 SIGNIFICANT ACCOUNTING POLICIES AND ACCOUNTING ESTIMATES (CONTINUED)(5) Fixed assets
Fixed assets are assets held by the Group for the conduct of business and are expected to be used for more than one year. Construction in progress is the property and equipment under construction, which is transferred to fixed assets when ready for its intended use.
(a) Cost
Fixed assets are initially recognised at cost, except for the fixed assets and construction in progress obtained from CCB by the Bank which were recognised at the revalued amount as deemed cost on the Restructuring Date. The cost of a purchased fixed asset comprises the purchase price, related taxes, and any directly attributable expenditures for bringing the asset to working condition for its intended use. The cost of a self-constructed fixed asset comprises those expenditures necessarily incurred for bringing the asset to working condition for its intended use.
Where the individual components of an item of fixed asset have different useful lives or provide benefits to the Group in different patterns thus necessitating use of different depreciation rates or methods, they are recognised as separate fixed assets.
Subsequent costs, including the cost of replacing part of an item of fixed assets, are recognised in the carrying amount of the item if the recognition criteria are satisfied, and the carrying amount of the replaced part is derecognised. Expenditures relating to ordinary maintenance of fixed assets are recognised in profit or loss.
(b) Depreciation and impairment
Depreciation is calculated to write off to the profit or loss the cost of items of fixed assets, less their estimated residual value, if any, using the straight line method over their estimated useful lives. Impaired fixed assets are depreciated net of accumulated impairment losses. No depreciation is provided on construction in progress.
The estimated useful lives, residual values and annual depreciation rates of respective fixed assets are as follows:
Types of assetsEstimated
useful livesEstimated net
residual valuesAnnual
depreciation rates
Bank premises 30-35 years 3% 2.8%-3.2%
Equipment 3-8 years 3% 12.1%-32.3%
Others 4-11 years 3% 8.8%-24.3%
The Group reviews the estimated useful life and estimated residual value of a fixed asset and the depreciation method applied at least once a financial year.
Impairment losses on fixed assets are accounted for in accordance with the accounting policies as set out in Note 4(11).
(c) Disposal
Gains or losses arising from the retirement or disposal of a fixed asset are determined as the difference between the net disposal proceeds and the carrying amount of the fixed asset and are recognised in profit or loss on the date of retirement or disposal.
(6) Lease
A finance lease is a lease that transfers substantially all the risks and rewards incidental to ownership of an asset to the lessee, irrespective of whether the legal title to the asset is eventually transferred or not. An operating lease is a lease other than a finance lease.
(a) Finance lease
Where the Group is a lessor under finance leases, an amount representing the sum of the minimum lease receivables and initial direct costs at the commencement of the lease term, is included in “loans and advances to customers” on statement of financial position as a lease receivable. Unrecognised finance income under finance leases is amortised using the effective interest rate method over the lease term. Hire purchase contracts having the characteristics of finance leases are accounted for in the same manner as finance leases.
Impairment losses on lease receivables are accounted for in accordance with the accounting policies as set out in Note 4(3)(e).

130 CHINA CONSTRUCTION BANK CORPORATION ANNUAL REPORT 2011
(Expressed in millions of RMB, unless otherwise stated)
NOTES TO THE FINANCIAL STATEMENTS
4 SIGNIFICANT ACCOUNTING POLICIES AND ACCOUNTING ESTIMATES (CONTINUED)(6) Lease (continued)
(b) Operating lease
Where the Group has the use of assets held under operating leases, payments made under the leases are charged to the profit or loss, using the straight-line method, over the accounting periods covered by the lease term, except where an alternative basis is more representative of the pattern of benefits to be derived from the leased assets. Lease incentives received are recognised in profit or loss as an integral part of the aggregate net lease payments made. Contingent rentals are charged to the profit or loss in the accounting period in which they are incurred.
(7) Land use rights
Land use rights are initially recognised at cost. The land use rights obtained from CCB by the Bank on the date of Restructuring were recorded at the revalued amount. The cost of the land use rights is amortised on a straight-line basis over their authorized useful lives, and charged to the profit or loss. Impaired land use rights are amortised net of accumulated impairment losses.
Impairment losses on land use rights are accounted for in accordance with the accounting policies as set out in Note 4(11).
(8) Intangible assets
Software and other intangible assets are initially recognised at cost. The cost less estimated residual values, if any, of the intangible assets is amortised on a straight-line basis over their useful lives, and charged to the profit or loss. Impaired intangible assets are amortised net of accumulated impairment losses.
Impairment losses on intangible assets are accounted for in accordance with the accounting policies as set out in Note 4(11).
(9) Goodwill
Goodwill represents the excess of the cost of a business combination over the Group’s interest in the fair value of the acquiree’s identifiable net assets. Goodwill is not amortised. Goodwill arising on a business combination is allocated to each cash-generating unit (“CGU”) or group of CGUs, that is expected to benefit from the synergies of the combination. The Group performs impairment test on goodwill semi-annually.
Any excess of the Group’s interest in the net fair value of the acquiree’s identifiable net assets over the cost of a business combination is recognised immediately in profit or loss.
On disposal of the related CGU or group of CGUs, any attributable amount of goodwill net of allowances for impairment losses, if any, is included in the calculation of the profit or loss on disposal.
Impairment loss on goodwill is accounted for in accordance with the accounting policies as set out in Note 4(11).
(10) Repossessed assets
In the recovery of impaired loans and advances, the Group may take possession of assets held as collateral through court proceedings or voluntary delivery of possession by the borrowers. Repossessed assets are recognised and reported in “other assets” in the statement of financial position when the Group intends to achieve an orderly realisation of the impaired assets and the Group is no longer seeking repayment from the borrower.
When the Group seizes assets to compensate for the losses of loans and advances and interest receivable, the repossessed assets are initially recognised at fair value, plus any taxes paid for the seizure of the assets, litigation fees and other expenses incurred for collecting the repossessed assets. Repossessed assets are recognised at the carrying value, net of allowances for impairment losses (Note 4(11)).
(11) Allowances for impairment losses on non-financial assets
At the end of each reporting period, the Group assesses whether there is any indication that a non-financial asset may be impaired. If any indication exists that an asset may be impaired, the Group estimates the recoverable amount of the asset.
If there is any indication that an asset may be impaired and it is not possible to estimate the recoverable amount of an individual asset, the Group determines the recoverable amount of the CGU to which the asset belongs.
CGU is the smallest identifiable group of assets that generates cash inflows that are largely independent of the cash flows from other assets or groups of assets.
The recoverable amount of an asset (or CGU, group of CGUs) is the higher of its fair value less costs to sell and the present value of the expected future cash flows. The Group considers all relevant factors in estimating the present value of future cash flows, such as the expected future cash flows, the useful life and the discount rate.

CHINA CONSTRUCTION BANK CORPORATION ANNUAL REPORT 2011
(Expressed in millions of RMB, unless otherwise stated)
131
NOTES TO THE FINANCIAL STATEMENTS
4 SIGNIFICANT ACCOUNTING POLICIES AND ACCOUNTING ESTIMATES (CONTINUED)(11) Allowances for impairment losses on non-financial assets (continued)
(a) Testing CGU with goodwill for impairment
For the purpose of impairment testing, goodwill acquired in a business combination is allocated to the CGU or group of CGUs that is expected to benefit from the synergies of the combination.
A CGU or group of CGUs to which goodwill has been allocated is tested for impairment by the Group semi-annually, or whenever there is an indication that the CGU or group of CGUs are impaired, by comparing the carrying amount of the CGU or group of CGUs, including the goodwill, with the recoverable amount of the CGU or group of CGUs. The recoverable amount of the CGU or group of CGUs are the estimated future cash flows, which are discounted to their present value using a discount rate that reflects current market assessments of the time value of money and the risks specific to the CGU or group of CGUs with allocated goodwill.
At the time of impairment testing of a CGU or group of CGUs to which goodwill has been allocated, there may be an indication of an impairment of an asset within the CGU containing the goodwill. In such circumstances, the Group tests the asset for impairment first, and recognises any impairment loss for that asset before testing for impairment on the CGU or group of CGUs containing the goodwill. Similarly, there may be an indication of an impairment of a CGU within a group of CGUs containing the goodwill. In such circumstances, the entity tests the CGU for impairment first, and recognises any impairment loss for that CGU, before testing for impairment the group of CGUs to which the goodwill is allocated.
(b) Impairment loss
If the recoverable amount of an asset is less than its carrying amount, the carrying amount of the asset is reduced to its recoverable amount. That reduction is recognised as an impairment loss and charged to the profit or loss.
For a CGU or a group of CGUs, the amount of impairment loss firstly reduces the carrying amount of any goodwill allocated to the CGU or group of CGUs, and then reduces the carrying amount of other assets (other than goodwill) within the CGU or group of CGUs, pro rata on the basis of the carrying amount of each asset.
(c) Reversing an impairment loss
If, in a subsequent period, the amount of impairment loss of the non-financial asset except for goodwill decreases and the decrease can be linked objectively to an event occurring after the impairment was recognised, the previously recognized impairment loss is reversed through the profit or loss. A reversal of impairment loss is limited to the asset’s carrying amount that would have been determined had no impairment loss been recognised in prior periods.
An impairment loss in respect of goodwill is not reversed.
(12) Employee benefits
Employee benefits are all forms of consideration given and other relevant expenditures incurred by the Group in exchange for services rendered by employees. Except for termination benefits, employee benefits are recognised as a liability in the period in which the associated services are rendered by its employees, with a corresponding increase in cost of relevant assets or the expenses in profit or loss. Where payment or settlement is deferred and the effect of discount would be material, these amounts are stated at their present values in the statement of financial position.
(a) Defined contribution retirement schemes
Pursuant to the relevant laws and regulations in the PRC, the Group has joined defined contribution retirement schemes for the employees arranged by local government labor and security authorities. The Group makes contributions to the retirement schemes at the applicable rates based on the amounts stipulated by the local government organisations. The contributions are charged to the profit or loss on an accrual basis. When employees retire, the local government labor and security authorities are responsible for the payment of the basic retirement benefits to the retired employees.
In addition to the statutory provision schemes, the Bank’s employees have joined the annuity scheme set up by the Bank under “CCBC Annuity Scheme” (the “scheme”) in accordance with state enterprise annuity regulations. The Bank has made annuity contributions in proportion to its employees’ gross wages, which are expensed in profit or loss when the contributions are made.
(b) Housing fund and other social insurance
In accordance with the related laws, regulations and policies of the PRC, the Group participates in mandatory social insurance programmes, including housing fund, basic medical insurance, unemployment insurance, work injury insurance and maternity insurance etc. The Group makes housing fund and social insurance contributions to government agencies in proportion to each employees’ salary and expenses monthly and recognises them in profit or loss on an accrual basis.
132 CHINA CONSTRUCTION BANK CORPORATION ANNUAL REPORT 2011
(Expressed in millions of RMB, unless otherwise stated)
NOTES TO THE FINANCIAL STATEMENTS
4 SIGNIFICANT ACCOUNTING POLICIES AND ACCOUNTING ESTIMATES (CONTINUED)(12) Employee benefits (continued)
(c) Supplementary retirement benefits
The Group pays supplementary retirement benefits for its employees in Mainland China who retired on or before 31 December 2003 in addition to the contributions made to statutory insurance schemes. The Group’s obligations in respect of supplementary retirement benefits are calculated by estimating the amount of obligations that the Group is committed to pay to the employees after their retirement using actuarial techniques. At the end of each reporting period, such obligations are discounted with interest yield of government bonds with similar duration. In calculating the Group’s obligations, to the extent that any cumulative unrecognised gains or losses exceed 10% of the present value of the obligation at the end of each reporting period, that portion is recognised in profit or loss. Otherwise, the gain or loss is not recognised.
(d) Early retirement expenses
The Group recognises the present value of all its liabilities to employees who voluntarily agreed to retire early. The early retirement benefit payments are made by the Group from the date of early retirement to the normal retirement date. Differences arising from changes in assumptions and estimates of the present value of the liabilities are recognised in profit or loss when incurred.
(e) Termination benefits
Where the Group terminates the employment relationship with employees before the end of the employment contracts or provides compensation as an offer to encourage employees to accept voluntary redundancy, a provision is recognised for the compensation arising from termination of employment relationship, with a corresponding charge to the profit or loss for the current period, when both of the following conditions are satisfied: (i) the Group has a formal plan for termination of employment relationship or has made an offer for voluntary redundancy, which will be implemented immediately; (ii) the Group cannot unilaterally withdraw from the termination plan or the redundancy offer.
(f) Staff incentive plan
As approved by the board of directors, for the purposes of providing incentives and rewards to eligible employees for their past services, the Group awards a specified amount of staff compensation to the staff incentive plan independently managed by a designated staff committee for those eligible participating employees. The Group recognises its contribution to the plan when it has a present legal or constructive obligation to make such payment and a reliable estimate of the obligation can be made.
(13) Provisions and contingent liabilities
A provision is recognised in the statement of financial position if, as the result of a past event, the Group has a present legal or constructive obligation that can be reliably estimated and it is probable that an outflow of economic benefits will be required to settle the obligation. A provision is initially measured at the best estimate of the expenditure required to settle the related present obligation. Factors pertaining to a contingency such as the risks, uncertainties and time value of money are taken into account as a whole in reaching the best estimate. Where the effect of the time value of money is material, the best estimate is determined by discounting the related future cash outflows.
A potential obligation arising from a past transaction or event whose existence can only be confirmed by the occurrence or nonoccurrence of future uncertain events; or a present obligation that arises from past transactions or events where it is not probable that an outflow of economic benefits is required to settle the obligation or the amount of the obligation cannot be measured reliably, is disclosed as a contingent liability unless the probability of outflow of economic benefit is remote.
(14) Financial guarantees
Financial guarantees are contracts that require the Group as the guarantor (the “issuer”) to make specified payments to reimburse the beneficiary of the guarantee (the “holder”) for a loss the holder incurs when a specified debtor fails to make payment when due in accordance with the terms of a debt instrument. The fair value of the guarantee (being the guarantee fees received) is initially recognised as deferred income in “other liabilities”. The deferred income is amortised in profit or loss over the term of the guarantee as income from financial guarantees issued. Provisions are recognised in the statement of financial position if and when it becomes probable that the holder of the guarantee will call upon the Group under the guarantee, and the amount of that claim on the Group is expected to exceed the carrying amount of the deferred income.
(15) Fiduciary activities
The Group’s fiduciary business refers to the management of assets for customers in accordance with custody agreements signed by the Group and securities investment funds, insurance companies, annuity plans and other organisations. The Group fulfils its fiduciary duty and receives relevant fees in accordance with these agreements, and does not take up any risks and rewards related to the assets under custody, which are recorded as off-balance sheet items.

CHINA CONSTRUCTION BANK CORPORATION ANNUAL REPORT 2011
(Expressed in millions of RMB, unless otherwise stated)
133
NOTES TO THE FINANCIAL STATEMENTS
4 SIGNIFICANT ACCOUNTING POLICIES AND ACCOUNTING ESTIMATES (CONTINUED)(15) Fiduciary activities (continued)
The Group conducts entrusted lending business, whereby it enters into entrusted loan agreements with customers. Under the terms of these agreements, the customers provide funding (the “entrusted funds”) to the Group, and the Group grants loans to third parties (the “entrusted loans”) according to the instructions of the customers. As the Group does not assume the risks and rewards of the entrusted loans and the corresponding entrusted funds, entrusted loans and funds are recorded as off-balance sheet items at their principal amounts and no impairment assessments are made for these entrusted loans.
(16) Income recognition
Provided it is probable that economic benefits will flow to the Group and the revenue and costs, if applicable, can be measured reliably, revenue is recognised in profit or loss as follows:
(a) Interest income
Interest income for interest bearing financial instruments is recognised in profit or loss based on effective interest method. Interest income includes the amortisation of any discount or premium or other differences between the initial carrying amount of an interest-bearing instrument and its amount at maturity calculated on an effective interest basis.
The effective interest basis is a method of calculating the amortised cost of financial assets and liabilities and of allocating the interest income and interest expense over the relevant period. The effective interest rate is the rate that exactly discounts estimated future cash payments or receipts through the expected life of the financial instrument or, when appropriate, a shorter period to the net carrying amount of the financial instrument. When calculating the effective interest rate, the Group estimates cash flows considering all contractual terms of the financial instrument (for example, prepayment, call and similar options) but does not consider future credit losses. The calculation includes all fees and points paid or received between parties to the contract that are an integral part of the effective interest rate, transaction costs and all other premiums or discounts.
Interest on the impaired financial assets is recognised using the rate of interest used to discount future cash flows for the purpose of measuring the related impairment loss.
(b) Fee and commission income
Fee and commission income is recognised in profit or loss when the corresponding service is provided. Origination or commitment fees received by the Group which result in the creation or acquisition of a financial asset are deferred and recognised as an adjustment to the effective interest rate. If the commitment expires without the Group making a loan, the fee is recognised as commission on expiry.
(c) Finance income from finance leases and hire purchase contracts
Finance income implicit in finance lease and hire purchase payments is recognised as interest income over the period of the leases so as to produce an approximately constant periodic rate of return on the outstanding net investment in the leases for each accounting period. Contingent rentals receivable are recognised as income in the accounting period in which they are earned.
(d) Dividend income
Dividend income from unlisted equity investments is recognised in profit or loss on the date when the Group’s right to receive payment is established. Dividend income from a listed equity investment is recognised when the share price of the investment goes ex-dividend.
(17) Income tax
Current income tax is the expected tax payable on the taxable income for the period, using tax rates enacted or substantially enacted at the end of each reporting period, and any adjustment to tax payable in respect of previous periods. Deferred tax assets and liabilities arise from deductible and taxable temporary differences respectively, being the differences between the carrying amounts of assets and liabilities for financial reporting purposes and their tax bases. Deferred tax also arises from unused tax losses and unused tax credits. A deferred tax asset is recognised to the extent that it is probable that future taxable profits will be available against which the asset can be utilised.
Current income tax and movements in deferred tax balances are recognised in profit or loss except to the extent that it relates to items recognised in other comprehensive income or directly in equity, in which case the relevant amounts of tax are recognised in other comprehensive income or directly in equity, respectively.
At the end of each reporting period, deferred tax assets and deferred tax liabilities are measured at the tax rates that are expected to apply to the period when the asset is realised or the liability is settled according to the requirements of tax laws. The Group also considers the possibility of realisation and the settlement of deferred tax assets and deferred tax liabilities in the calculation.

134 CHINA CONSTRUCTION BANK CORPORATION ANNUAL REPORT 2011
(Expressed in millions of RMB, unless otherwise stated)
NOTES TO THE FINANCIAL STATEMENTS
4 SIGNIFICANT ACCOUNTING POLICIES AND ACCOUNTING ESTIMATES (CONTINUED)(17) Income tax (continued)
Current tax assets are offset against current tax liabilities, and deferred tax assets against deferred tax liabilities if the Group has the legally enforceable right to offset current tax assets against current tax liabilities and the deferred tax assets and liabilities relate to income taxes levied by the same taxation authority on the same taxable entity. Otherwise, the balances of deferred tax assets and deferred tax liabilities, and movements therein, are presented separately from each other and are not offset.
(18) Cash equivalents
Cash equivalents are short-term, highly liquid investments that are readily convertible into known amounts of cash and which are subject to an insignificant risk of changes in value, having been within three months of maturity at acquisition.
(19) Profit distribution
Proposed dividends which are declared and approved after the end of each reporting period are not recognised as a liability in the statement of financial position and are instead disclosed as a subsequent event after the end of each reporting period in the note to the financial statements. Dividends payable are recognised as liabilities in the period in which they are approved.
(20) Related parties
If the Group has the power, directly or indirectly, to control, jointly control or exercise significant influence over another party, or vice versa, or where the Group and one or more parties are subject to common control or joint control from another party, they are considered to be related parties. Related parties may be individuals or enterprises. The Group’s related parties include but are not limited to the following:
(a) the Bank’s parents;
(b) the Bank’s subsidiaries;
(c) other entities which are controlled by the Bank’s parents;
(d) an investor who has joint control over the Group;
(e) an investor who can exercise significant influence over the Group;
(f) an associate of the Group;
(g) a jointly controlled entity of the Group;
(h) principal individual investors of the Group, and close family members of such individuals (principal individual investors are the individual investors who have the power, directly or indirectly, to control, jointly control or exercise significant influence over another party);
(i) key management personnel of the Group and close family members of such individuals (key management personnel represent those persons having authority and responsibility for planning, directing and controlling the activities of the entity, directly or indirectly, including any director of that entity);
(j) key management personnel of the Bank’s parents and close family members of such individuals;
(k) other entities that are controlled or jointly controlled by the Group’s principal individual investors, key management personnel, or close family members of such individuals; and
(l) a post-employment benefit plan for the benefit of employees of the Group, or of any entity that is a related party of the Group.
(21) Operating segments
The identification of operating segments of the Group is on the basis of internal reports that are regularly reviewed by the Group’s chief operating decision maker in order to allocate resources to the segment and assess its performance. On the basis of the operating segments, the Group identifies the reportable segments, using a combination of factors including products and services, geographical areas, regulatory environments etc., which the management has chosen for organisation. The operating segments that meet the specified criteria have been aggregated, and the operating segments that meet quantitative thresholds have been reported separately.
The amount reported for each operating segment item is the measure reported to the chief operating decision maker for the purposes of allocating resources to the segment and assessing its performance. Segment information is prepared in conformity with the accounting policies adopted for preparing and presenting the financial statements of the Group.

CHINA CONSTRUCTION BANK CORPORATION ANNUAL REPORT 2011
(Expressed in millions of RMB, unless otherwise stated)
135
NOTES TO THE FINANCIAL STATEMENTS
4 SIGNIFICANT ACCOUNTING POLICIES AND ACCOUNTING ESTIMATES (CONTINUED)(22) Significant accounting estimates and judgements
(a) Impairment losses on loans and advances, and available-for-sale and held-to-maturity debt investmentsThe Group reviews the portfolios of loans and advances, and available-for-sale and held-to-maturity debt investments periodically to assess whether impairment losses exist and if they exist, the amounts of impairment losses. Objective evidence for impairment includes observable data indicating that there is a measurable decrease in the estimated future cash flows identified with an individual loan and advance, an available-for-sale or a held-to-maturity debt investment. It also includes observable data indicating adverse changes in the repayment status of borrowers or issuers in the assets portfolio or national or local economic conditions that correlate with defaults on the assets in the portfolio.
The impairment loss for a loan that is individually assessed for impairment is the decrease in the estimated discounted future cash flows. Same principle is adopted for impairment loss on a held-to-maturity debt investment which is individually assessed, except that as a practical expedient, the Group may measure the impairment loss on the basis of the instrument’s fair value using an observable market price at the measurement date. The impairment loss for an available-for-sale debt investment is the difference between the acquisition cost (net off any principal repayments and amortisation) and the fair value, less any impairment loss previously recognised in profit or loss at the measurement date.
When loans and advances and held-to-maturity debt investments are collectively assessed for impairment, the estimate is based on historical loss experience for assets with credit risk characteristics similar to the loans and advances and held-to-maturity debt investments that are being assessed. Historical loss experience is adjusted on the basis of the relevant observable data that reflect current economic conditions. Management reviews the methodology and assumptions used in estimating future cash flows regularly to reduce any difference between loss estimates and actual losses.
(b) Impairment of available-for-sale equity instrumentsFor available-for-sale equity instruments, a significant or prolonged decline in fair value below cost is considered to be objective evidence of impairment. Judgement is required when determining whether a decline in fair value has been significant or prolonged. In making this judgement, the Group considers historical market volatility and share price data of the specific equity instrument as well as other factors, such as sector performance, and financial information regarding the investee.
(c) Fair value of financial instrumentsThe fair value of financial instruments that are traded in an active market is based on their quoted market prices in an active market at the valuation date. A quoted market price is a price from an active market where price information is readily and regularly available from an exchange or from a dealer quotation and where this price information represents actual and recurring market transactions on an arm’s length basis.
For all other financial instruments, the Group determines fair values using valuation techniques which include discounted cash flow models, as well as other types of valuation model. Assumptions and inputs used in valuation techniques include risk-free and benchmark interest rates, credit spreads and foreign currency exchange rates. Where discounted cash flow techniques are used, estimated cash flows are based on management’s best estimates and the discount rate used is a market rate at the end of each reporting period applicable for an instrument with similar terms and conditions. Where other pricing models are used, inputs are based on maximised observable market data at the end of each reporting period. However, where market data are not available, the Group needs to make the best estimates on such unobservable market data.
The objective of valuation techniques is to arrive at a fair value determination that reflects the price of the financial instrument at the reporting date that would have been determined by market participants acting at arm’s length.
(d) Classification of held-to-maturity investmentsIn evaluating whether the requirements to classify a financial asset as held-to-maturity are met, management makes significant judgements. Change of the Group in sustaining the intention and ability to hold specific investments until maturity may result in reclassification of the whole portfolio as available-for-sale.
(e) Income taxesDetermining income tax provisions involves judgement on the future tax treatment of certain transactions. The Group carefully evaluates the tax implications of transactions and tax provisions are set up accordingly. The tax treatment of such transactions is reconsidered periodically to take into account all changes in tax legislations. Deferred tax assets are recognised for tax losses not yet used and temporary deductible differences. As those deferred tax assets can only be recognised to the extent that it is probable that future taxable profits will be available against which the unused tax credits can be utilised, management’s judgement is required to assess the probability of future taxable profits. Management’s assessment is constantly reviewed and additional deferred tax assets are recognised if it becomes probable that future taxable profits will allow the deferred tax assets to be recovered.
(f) Employee retirement benefit obligationsThe Group has established liabilities in connection with benefits payable to certain retired employees. The amounts of employee benefit expense and these liabilities are dependent on assumptions used in calculating such amounts. These assumptions include discount rates, pension benefit inflation rates, medical benefit inflation rates, and other factors. Actual results that differ from the assumptions are recognised to the extent that any cumulative unrecognised gains or losses exceed 10% of the present value of the obligation at the end of each reporting period. While management believes that its assumptions are appropriate, differences in actual experience or changes in assumptions may affect the Group’s expense and liability related to its employee retirement benefit obligations.

136 CHINA CONSTRUCTION BANK CORPORATION ANNUAL REPORT 2011
(Expressed in millions of RMB, unless otherwise stated)
NOTES TO THE FINANCIAL STATEMENTS
5 TAXATIONThe Group’s main applicable taxes and tax rates are as follows:
Business tax
Business tax is charged at 5% on taxable income.
City construction tax
City construction tax is calculated as 1% – 7% of business tax.
Education surcharge
Education surcharge is calculated as 3% of business tax.
Income tax
The income tax rate that is applicable to the Bank and its subsidiaries in Mainland China is 25%. Taxation on overseas operations is charged at the relevant local rates. Tax paid on overseas operations is set off to the extent which is allowed under the relevant income tax laws of the PRC. All tax exemptions are determined upon approval from the relevant tax authorities.
Current liabilities arising from the above taxes are presented as “taxes payable” in the statement of financial position.
6 NET INTEREST INCOME2011 2010
Interest income arising from:
Deposits with central banks 31,282 23,226
Deposits with banks and non-bank financial institutions 4,302 1,360
Placements with banks and non-bank financial institutions 1,539 450
Financial assets at fair value through profit or loss 577 706
Financial assets held under resale agreements 7,888 6,424
Investment securities 89,139 78,611
Loans and advances to customers
– Corporate loans and advances 255,718 199,623
– Personal loans and advances 84,302 60,848
– Discounted bills 7,500 6,535
Total 482,247 377,783
Interest expense arising from:
Borrowings from central banks (17) (14)
Deposits from banks and non-bank financial institutions (17,990) (13,626)
Placements from banks and non-bank financial institutions (2,474) (741)
Financial liabilities at fair value through profit or loss (2) (1)
Financial assets sold under repurchase agreements (1,233) (176)
Debt securities issued (3,987) (3,526)
Deposits from customers
– Corporate deposits (77,086) (52,524)
– Personal deposits (74,886) (55,675)
Total (177,675) (126,283)
Net interest income 304,572 251,500
Notes:
(1) Interest income from impaired financial assets is listed as follows:
2011 2010
Impaired loans and advances 1,413 799Other impaired financial assets 423 446
Total 1,836 1,245
(2) Interest expense on financial liabilities with maturity over five years mainly represented the interest expense on debt securities issued.

CHINA CONSTRUCTION BANK CORPORATION ANNUAL REPORT 2011
(Expressed in millions of RMB, unless otherwise stated)
137
NOTES TO THE FINANCIAL STATEMENTS
7 NET FEE AND COMMISSION INCOME2011 2010
Fee and commission income
Consultancy and advisory fees 17,488 12,816
Bank card fees 14,910 12,344
Agency service fees 14,210 12,115
Settlement and clearing fees 13,484 9,614
Wealth management service fees 7,907 5,611
Commission on trust and fiduciary activities 7,732 6,720
Electronic banking service fees 4,246 2,879
Guarantee fees 2,495 1,857
Credit commitment fees 2,369 1,605
Others 4,653 2,595
Total 89,494 68,156
Fee and commission expense
Bank card transaction fees (1,540) (1,302)
Inter-bank transaction fees (342) (341)
Others (618) (381)
Total (2,500) (2,024)
Net fee and commission income 86,994 66,132
8 NET TRADING GAIN2011 2010
Debt securities (89) (11)
Derivatives 1,102 1,587
Equity investments (2,019) 1,232
Others 1,394 701
Total 388 3,509
For the year ended 31 December 2011, trading loss related to financial assets designated at fair value through profit or loss of the Group amounted to RMB1,547 million (2010: gain RMB1,017 million). Trading gain related to financial liabilities designated at fair value through profit or loss of the Group amounted to RMB2,011 million (2010: loss RMB807 million).
9 DIVIDEND INCOME2011 2010
Dividend income from listed trading equity investments 46 29
Dividend income from available-for-sale equity investments
– Listed 26 83
– Unlisted 86 116
Total 158 228

138 CHINA CONSTRUCTION BANK CORPORATION ANNUAL REPORT 2011
(Expressed in millions of RMB, unless otherwise stated)
NOTES TO THE FINANCIAL STATEMENTS
10 NET GAIN ARISING FROM INVESTMENT SECURITIES2011 2010
Net gain on sale of available-for-sale financial assets 813 1,103
Net revaluation gain reclassified from other comprehensive income on disposal 810 735
Net gain on sale of held-to-maturity investments 133 65
Total 1,756 1,903
11 OTHER OPERATING INCOME, NET2011 2010
Net foreign exchange gain/(loss) 1,451 (611)
Net gain on disposal of fixed assets 489 455
Net gain on disposal of repossessed assets 172 140
Others 3,423 2,524
Total 5,535 2,508
Net foreign exchange gain or loss includes gains and losses in connection with the translation of foreign currency denominated monetary assets and liabilities, and net realised and unrealised gains and losses on foreign exchange derivatives (including those foreign exchange swaps, foreign exchange options and cross currency swaps entered into in order to economically hedge long positions in foreign currency assets).
12 OPERATING EXPENSES2011 2010
Staff costs
– Salaries, bonuses, allowances and subsidies 49,703 42,652
– Defined contribution retirement schemes 8,495 7,206
– Other social insurance and welfare 6,581 5,311
– Housing funds 3,989 3,409
– Union running costs and employee education costs 2,013 1,695
– Supplementary retirement benefits 387 432
– Early retirement expenses 210 685
– Compensation to employees for termination of employment relationship 10 19
71,388 61,409
Premises and equipment expenses
– Depreciation charges 10,397 9,855
– Rent and property management expenses 5,177 4,578
– Maintenance 2,149 1,673
– Utilities 1,643 1,545
– Others 1,031 879
20,397 18,530
Business taxes and surcharges 24,229 18,364
Amortisation expenses 2,100 1,972
Audit fees 153 148
Other general and administrative expenses 26,270 20,943
Total 144,537 121,366

CHINA CONSTRUCTION BANK CORPORATION ANNUAL REPORT 2011
(Expressed in millions of RMB, unless otherwise stated)
139
NOTES TO THE FINANCIAL STATEMENTS
13 IMPAIRMENT LOSSES2011 2010
Loans and advances to customers
– Additions 42,628 38,425
– Releases (10,225) (12,784)
Available-for-sale debt securities 1,106 139
Available-for-sale equity investments 24 1,678
Held-to-maturity investments (15) (381)
Debt securities classified as receivables 495 24
Fixed assets 1 2
Others 1,769 2,189
Total 35,783 29,292
14 DIRECTORS’ AND SUPERVISORS’ EMOLUMENTSThe aggregate of the emoluments before individual income tax in respect of the directors and supervisors who held office during the year is as follows:
2011
FeesRemuneration
paid
Contributions to defined
contribution retirement
schemes
Other benefits in
kind (note (vi))
Total (note (i))
RMB’000 RMB’000 RMB’000 RMB’000 RMB’000
Executive directors
Wang Hongzhang (note (ii)) – – – – –
Zhang Jianguo (note (vii)) – 668 30 303 1,001
Chen Zuofu (note (vii)) – 589 30 257 876
Zhu Xiaohuang (note (ii)&(vii)) – 589 30 257 876
Non-executive directors
Wang Yong (note (iii)) – – – – –
Zhu Zhenmin (note (ii)&(iii)) – – – – –
Li Xiaoling (note (iii)) – – – – –
Lu Xiaoma (note (ii)&(iii)) – – – – –
Chen Yuanling (note (ii)&(iii)) – – – – –
Dong Shi (note (ii)&(iii)) – – – – –
Independent non-executive directors
Lord Peter Levene 360 – – – 360
Yam Chi Kwong, Joseph (note (ii)) 380 – – – 380
Dame Jenny Shipley 432 – – – 432
Zhao Xijun (note (ii)) 410 – – – 410
Wong Kai-Man 440 – – – 440
Supervisors
Zhang Furong (note (ii)&(vii)) – 651 30 303 984
Liu Jin (note (vii)) – 432 30 219 681
Song Fengming (note (ii)) 360 – – – 360
Zhang Huajian (note (ii), (v)&(vii)) – 158 10 72 240
Jin Panshi (note (ii)) 50 – – – 50
Li Weiping (note (ii)&(v)) 50 – – – 50
Huang Shuping (note (ii)&(v)) 50 – – – 50
Guo Feng 330 – – – 330
Dai Deming 350 – – – 350

140 CHINA CONSTRUCTION BANK CORPORATION ANNUAL REPORT 2011
(Expressed in millions of RMB, unless otherwise stated)
NOTES TO THE FINANCIAL STATEMENTS
14 DIRECTORS’ AND SUPERVISORS’ EMOLUMENTS (CONTINUED)2011
FeesRemuneration
paid
Contributions to defined
contribution retirement
schemes
Other benefits
in kind (note (vi))
Total (note (i))
RMB’000 RMB’000 RMB’000 RMB’000 RMB’000
Former executive director
Guo Shuqing (note (ii)&(vii)) – 575 25 253 853
Former non-executive directors
Wang Shumin (note (ii)&(iii)) – – – – –
Sue Yang (note (ii)&(iv)) 325 – – – 325
Former independent non-executive directors
Elaine La Roche (note (ii)) 220 – – – 220
3,757 3,662 185 1,664 9,268
2010
Basic annual salaries
Annual performance
bonus Allowance Welfare
Total (before tax) (note (viii))
Including: deferral
payment
The actual payment in
2010 (before tax)
RMB’000 RMB’000 RMB’000 RMB’000 RMB’000 RMB’000 RMB’000
Executive directors
Guo Shuqing (note (ii)) 427 1,080 – 319 1,826 540 1,286
Zhang Jianguo 385 1,062 – 319 1,766 531 1,235
Chen Zuofu 363 1,002 – 276 1,641 501 1,140
Zhu Xiaohuang (note (ii)) 363 1,002 – 276 1,641 501 1,140
Non-executive directors
Wang Yong (note (iii)) – – – – – – –
Wang Shumin (note (ii)&(iii)) – – – – – – –
Zhu Zhenmin (note (ii)&(iii)) – – – – – – –
Li Xiaoling (note (iii)) – – – – – – –
Sue Yang (note (ii)&(iv)) – – 163 – 163 – 163
Lu Xiaoma (note (ii)&(iii)) – – – – – – –
Chen Yuanling (note (ii)&(iii)) – – – – – – –
Independent non-executive directors
Lord Peter Levene – – 360 – 360 – 360
Yam Chi Kwong, Joseph (note (ii)) – – 158 – 158 – 158
Dame Jenny Shipley – – 390 – 390 – 390
Elaine La Roche (note (ii)) – – 425 – 425 – 425
Zhao Xijun (note (ii)) – – 171 – 171 – 171
Wong Kai-Man – – 415 – 415 – 415

CHINA CONSTRUCTION BANK CORPORATION ANNUAL REPORT 2011
(Expressed in millions of RMB, unless otherwise stated)
141
NOTES TO THE FINANCIAL STATEMENTS
14 DIRECTORS’ AND SUPERVISORS’ EMOLUMENTS (CONTINUED)2010
Basic annual salaries
Annual performance
bonus Allowance Welfare
Total (before tax) (note (viii))
Including: deferral
payment
The actual payment in
2010 (before tax)
RMB’000 RMB’000 RMB’000 RMB’000 RMB’000 RMB’000 RMB’000
Supervisors
Zhang Furong (note (ii)) 157 432 – 139 728 216 512
Liu Jin 278 766 – 237 1,281 383 898
Song Fengming (note (ii)) – – 135 – 135 – 135
Jin Panshi (note (ii)) 139 383 13 114 649 191 458
Li Weiping (note (ii)&(v)) – – 13 – 13 – 13
Huang Shuping (note (ii)&(v)) – – 13 – 13 – 13
Guo Feng – – 250 – 250 – 250
Dai Deming – – 270 – 270 – 270
Former non-executive directors
Wang Yonggang (note (ii)&(iii)) – – – – – – –
Liu Xianghui (note (ii)&(iii)) – – – – – – –
Zhang Xiangdong (note (ii)&(iii)) – – – – – – –
Gregory L. Curl (note (ii)&(iv)) – – 195 – 195 – 195
Former independent non-executive directors
Song Fengming (note (ii)) – – 220 – 220 – 220
Tse Hau Yin, Aloysius (note (ii)) – – 220 – 220 – 220
Former supervisors
Xie Duyang (note (ii)) 282 779 – 236 1,297 389 908
Cheng Meifen (note (ii)&(v)) – – 13 – 13 – 13
Sun Zhixin (note (ii)&(v)) – – 13 – 13 – 13
Shuai Jinkun (note (ii)&(v)) – – 13 – 13 – 13
2,394 6,506 3,450 1,916 14,266 3,252 11,014
Notes:
(i) The amounts of emoluments for the year ended 31 December 2011 in respect of the services rendered by the directors and supervisors are subject to the approval of the Bank’s shareholders in 2011 Annual General Meeting.
(ii) Upon election at the first extraordinary general meeting and Board meeting of the Bank in 2012 and approval of the CBRC, Mr, Wang Hongzhang commenced his position as the chairman and executive director of the Bank since January 2012.
Upon the election at the 2009 Annual General Meeting of the Bank and the approval of the CBRC, Mr. Zhu Xiaohuang commenced his position as an executive director of the Bank from July 2010; Mr. Zhu Zhenmin, Ms. Sue Yang, Mr. Lu Xiaoma and Ms. Chen Yuanling commenced their positions as non-executive directors of the Bank from August 2010; and Mr. Yam Chi Kwong, Joseph and Mr. Zhao Xijun commenced their positions as independent non-executive directors of the Bank from August 2010.
Upon election at the 2010 Annual General Meeting and approval of the CBRC, Mr. Dong Shi commenced his position as non-executive director of the Bank since September 2011.
Mr. Guo Shuqing ceased to serve as the chairman and executive director of the Bank due to the arrangement of the national finance work since 28 October 2011.
Upon the next day of the conclusion of the 2010 Annual General Meeting of the Bank, Ms. Wang Shumin ceased to serve as non-executive director of the Bank due to her personal variation of work.
Ms. Sue Yang ceased to serve as non-executive director of the Bank due to personal reasons since 11 October 2011.
Upon the conclusion of the 2010 Annual General Meeting of the Bank, Ms. Elaine La Roche ceased to serve as independent non-executive director of the Bank due to the expiration of her term of office.
Upon the conclusion of the 2009 Annual General Meeting of the Bank, Mr. Wang Yonggang, Mr. Liu Xianghui, Mr. Zhang Xiangdong, Mr. Gregory L. Curl., Mr. Song Fengming and Mr. Tse Hau Yin, Aloysius ceased to serve as directors of the Bank.
Upon the election at the first Extraordinary General Meeting in 2010, Mr. Zhang Furong commenced his position as a shareholder representative supervisor. Upon election at the sixth meeting of the board of supervisors in 2010, Mr. Zhang Furong was elected the chairman of the board of supervisors.
Upon the election at the 2009 Annual General Meeting of the Bank, Mr. Song Fengming commenced his position as a shareholder representative supervisor of the Bank; and at the second joint session of the second staff representative conference of the Bank, Mr. Jin Panshi, Mr. Li Weiping and Ms. Huang Shuping were elected as the employee representative supervisors the Bank.
Upon election at the first extraordinary general meeting of the Bank in 2011, Mr. Zhang Huajian commenced his position as shareholder representative supervisor of the Bank.
In accordance with relevant regulations and due to his age, Mr. Xie Duyang resigned on 15 September 2010 from the positions of supervisor and chairman of the board of supervisors of the Bank.
Upon the conclusion of the 2009 Annual General Meeting of the Bank, Ms. Cheng Meifen, Mr. Sun Zhixin and Mr. Shuai Jinkun ceased to serve as supervisors of the Bank; Mr. Jin Panshi ceased to serve as the shareholder representative supervisor of the Bank.

142 CHINA CONSTRUCTION BANK CORPORATION ANNUAL REPORT 2011
(Expressed in millions of RMB, unless otherwise stated)
NOTES TO THE FINANCIAL STATEMENTS
14 DIRECTORS’ AND SUPERVISORS’ EMOLUMENTS (CONTINUED)Notes: (continued)
(iii) The Bank does not need to pay the emoluments of non-executive directors appointed by Huijin for the services rendered in 2011 and 2010.
(iv) The amount will be payable to Bank of America Corporation (“BOA”) for their services as director after the approval of the Bank’s shareholders as mentioned in note (i).
(v) The amounts only included fees for their services as supervisors.
(vi) Other benefits in kind included the Bank’s contributions to medical fund, housing fund and other social insurances, which are payable to labour and security authorities based on the lower of certain percentage of the salaries and allowance or the prescribed upper limits as required by the relevant regulations issued by the government authorities. Other benefits also included the Bank’s contribution to its own corporate annuity plan (which was set up in accordance with the relevant policies issued by the government authorities) and supplementary medical insurance.
None of the directors and supervisors received any inducements or compensation for loss of office, or waived any emoluments during the years ended 31 December 2010 and 2011.
(vii) The total compensation package for these directors and supervisors for the year ended 31 December 2011 has not yet been finalised in accordance with regulations of the PRC relevant authorities. The amount of the compensation not provided for is not expected to have significant impact on the Group’s and the Bank’s financial statements for the year ended 31 December 2011. The final compensation will be disclosed in a separate announcement when determined.
(viii) The total compensation package for certain directors and supervisors for the year ended 31 December 2010 had not been finalised in accordance with regulations of the PRC relevant authorities till the date that the 2010 financial statements were announced. The aforesaid total compensation package for the directors and supervisors for the year ended 31 December 2010 was the final amount and the Bank made the relevant supplementary announcement on 18 May 2011.
15 INDIVIDUALS WITH HIGHEST EMOLUMENTSNone of the five individuals with the highest emoluments are directors or supervisors whose emoluments are disclosed in Note 14. The aggregate of the emoluments before individual income tax in respect of the five highest paid individuals during the year is as follows:
2011 2010
RMB’000 RMB’000
Salaries and allowance 12,781 5,137
Variable compensation 32,452 43,149
Contributions to defined contribution retirement schemes 902 425
Other benefit in kind 186 85
46,321 48,796
The number of these individuals whose emoluments before individual income tax are within the following bands is set out below.
2011 2010
RMB7,000,001 – RMB7,500,000 – 1
RMB7,500,001 – RMB8,000,000 – 1
RMB8,000,001 – RMB8,500,000 1 1
RMB8,500,001 – RMB9,000,000 1 –
RMB9,000,001 – RMB9,500,000 1 1
RMB9,500,001 – RMB10,000,000 1 –
RMB10,000,001 – RMB10,500,000 1 –
RMB16,000,001 – RMB16,500,000 – 1
None of these individuals received any inducements, or compensation for loss of office, or waived any emoluments during the year ended 31 December 2011 and 2010.
16 INCOME TAX EXPENSE(1) Income tax expense
2011 2010
Current tax 55,325 44,846
– Mainland China 54,812 44,386
– Hong Kong 401 374
– Other countries and regions 112 86
Adjustments for prior years (2,277) 196
Deferred tax (3,380) (4,917)
Total 49,668 40,125
The provisions of income taxes for Mainland China and Hong Kong are calculated at 25% and 16.5% of the estimated taxable income from Mainland China and Hong Kong operations for the year respectively. Taxation for other overseas operations is charged at the appropriate current rates of taxation ruling in the relevant tax jurisdictions.

CHINA CONSTRUCTION BANK CORPORATION ANNUAL REPORT 2011
(Expressed in millions of RMB, unless otherwise stated)
143
NOTES TO THE FINANCIAL STATEMENTS
16 INCOME TAX EXPENSE (CONTINUED)(2) Reconciliation between income tax expense and accounting profit
2011 2010
Profit before tax 219,107 175,156
Income tax calculated at statutory tax rate 54,777 43,789
Non-deductible expenses
– Staff costs 586 365
– Others 678 632
1,264 997
Non-taxable income
– Interest income from PRC government bonds (6,606) (4,701)
– Others (260) (156)
(6,866) (4,857)
Total 49,175 39,929
Adjustments on income tax for prior years which affect profit or loss 493 196
Income tax expense 49,668 40,125
17 EARNINGS PER SHAREBasic earnings per share for the year ended 31 December 2011 and 2010 have been computed by dividing the net profit attributable to equity shareholders of the Bank by the weighted average number of ordinary shares outstanding during the years. There was no difference between basic and diluted earnings per share as there were no potentially dilutive shares outstanding during the year ended 31 December 2011 and 2010.
Note 2011 2010
Net profit attributable to shareholders of the Bank 169,258 134,844
Weighted average number of shares after Rights Issue (in million shares) (a) 250,011 240,977
Basic and diluted earnings per share attributable to shareholders of the Bank after Rights Issue (in RMB Yuan) 0.68 0.56
(a) Weighted average number of ordinary shares after Rights Issue (in million shares)
2011 2010
Issued ordinary shares 250,011 233,689
Weighted average number of shares for Rights Issue 7,288
Weighted average number of shares in issue 250,011 240,977

144 CHINA CONSTRUCTION BANK CORPORATION ANNUAL REPORT 2011
(Expressed in millions of RMB, unless otherwise stated)
NOTES TO THE FINANCIAL STATEMENTS
18 CASH AND DEPOSITS WITH CENTRAL BANKSGroup Bank
Note 2011 2010 2011 2010
Cash 58,308 48,201 58,061 47,960
Deposits with central banks
– Statutory deposit reserves (1) 1,982,150 1,611,442 1,980,915 1,610,924
– Surplus deposit reserves (2) 324,568 170,938 319,734 165,535
– Fiscal deposits 14,783 17,448 14,783 17,448
Subtotal 2,321,501 1,799,828 2,315,432 1,793,907
Total 2,379,809 1,848,029 2,373,493 1,841,867
Notes:
(1) The Group places statutory deposit reserves with the People’s Bank of China (“PBOC”) and overseas central banks where it has operations. The statutory deposit reserves are not available for use in the Group’s daily business.
As at the end of the reporting period, the statutory deposit reserve rates in Mainland China of the Bank were as follows:
2011 2010
Reserve rate for RMB deposits 21.0% 19.0%Reserve rate for foreign currency deposits 5.0% 5.0%
The statutory RMB deposit reserve rates applicable to domestic subsidiaries of the Group are determined by the PBOC.
The amounts of statutory deposit reserves placed with the central banks of overseas countries are determined by local jurisdictions.
(2) The surplus deposit reserve maintained with the PBOC is mainly for the purpose of clearing.
19 DEPOSITS WITH BANKS AND NON-BANK FINANCIAL INSTITUTIONS(1) Analysed by type of counterparties
Group Bank
2011 2010 2011 2010
Banks 274,228 77,838 277,427 77,772
Non-bank financial institutions 2,533 491 2,443 437
Gross balances 276,761 78,329 279,870 78,209
Allowances for impairment losses (Note 37) (9) (11) (9) (11)
Net balances 276,752 78,318 279,861 78,198
(2) Analysed by geographical sectors
Group Bank
2011 2010 2011 2010
Mainland China 252,409 62,660 257,902 66,033
Overseas 24,352 15,669 21,968 12,176
Gross balances 276,761 78,329 279,870 78,209
Allowances for impairment losses (Note 37) (9) (11) (9) (11)
Net balances 276,752 78,318 279,861 78,198

CHINA CONSTRUCTION BANK CORPORATION ANNUAL REPORT 2011
(Expressed in millions of RMB, unless otherwise stated)
145
NOTES TO THE FINANCIAL STATEMENTS
20 PLACEMENTS WITH BANKS AND NON-BANK FINANCIAL INSTITUTIONS(1) Analysed by type of counterparties
Group Bank
2011 2010 2011 2010
Banks 77,946 61,039 76,380 63,219
Non-bank financial institutions 31,159 3,007 34,218 5,393
Gross balances 109,105 64,046 110,598 68,612
Allowances for impairment losses (Note 37) (65) (84) (65) (84)
Net balances 109,040 63,962 110,533 68,528
(2) Analysed by geographical sectors
Group Bank
2011 2010 2011 2010
Mainland China 86,244 14,600 87,844 14,600
Overseas 22,861 49,446 22,754 54,012
Gross balances 109,105 64,046 110,598 68,612
Allowances for impairment losses (Note 37) (65) (84) (65) (84)
Net balances 109,040 63,962 110,533 68,528
21 FINANCIAL ASSETS AT FAIR VALUE THROUGH PROFIT OR LOSSGroup Bank
Note 2011 2010 2011 2010
Held for trading purpose (1)
– Debt securities 8,715 3,044 8,715 3,044
– Equity instruments 515 1,191 – –
– Funds 34 350 – –
9,264 4,585 8,715 3,044
Designated at fair value through profit or loss (2)
– Debt securities 5,660 4,816 – –
– Equity instruments 8,172 7,943 – –
13,832 12,759 – –
Total 23,096 17,344 8,715 3,044

146 CHINA CONSTRUCTION BANK CORPORATION ANNUAL REPORT 2011
(Expressed in millions of RMB, unless otherwise stated)
NOTES TO THE FINANCIAL STATEMENTS
21 FINANCIAL ASSETS AT FAIR VALUE THROUGH PROFIT OR LOSS (CONTINUED)(1) Held for trading purpose
(a) Debt securitiesGroup Bank
2011 2010 2011 2010
Government 950 618 950 618
Central banks 2,830 1,093 2,830 1,093
Policy banks 752 110 752 110
Banks and non-bank financial institutions 1,369 1,064 1,369 1,064
Others 2,814 159 2,814 159
Total 8,715 3,044 8,715 3,044
Listed outside Hong Kong – 51 – 51
Unlisted 8,715 2,993 8,715 2,993
Total 8,715 3,044 8,715 3,044
(b) Equity instruments and FundsGroup
2011 2010
Banks and non-bank financial institutions – 4
Others 549 1,537
Total 549 1,541
Listed 549 1,541
– of which in Hong Kong 488 1,151
(2) Designated at fair value through profit or loss
(a) Debt securitiesGroup
2011 2010
Policy banks 264 281
Banks and non-bank financial institutions 633 1,184
Others 4,763 3,351
Total 5,660 4,816
Listed 280 535
– of which in Hong Kong 31 411
Unlisted 5,380 4,281
Total 5,660 4,816

CHINA CONSTRUCTION BANK CORPORATION ANNUAL REPORT 2011
(Expressed in millions of RMB, unless otherwise stated)
147
NOTES TO THE FINANCIAL STATEMENTS
21 FINANCIAL ASSETS AT FAIR VALUE THROUGH PROFIT OR LOSS (CONTINUED)(2) Designated at fair value through profit or loss (continued)
(b) Equity instrumentsGroup
2011 2010
Banks and non-bank financial institutions 618 –
Others 7,554 7,943
Total 8,172 7,943
Listed 1,961 2,379
– of which in Hong Kong 1,141 2,003
Unlisted 6,211 5,564
Total 8,172 7,943
There was no significant limitation on the ability of the Group and the Bank to dispose of financial assets at fair value through profit or loss.
22 DERIVATIVES(1) Analysed by type of contract
Group
2011 2010
Notional amounts Assets Liabilities
Notional amounts Assets Liabilities
Interest rate contracts 183,660 4,252 4,434 181,130 3,493 3,706
Exchange rate contracts 740,737 9,344 8,480 619,449 7,054 5,414
Other contracts 5,011 531 396 3,875 677 238
Total 929,408 14,127 13,310 804,454 11,224 9,358
Bank
2011 2010
Notional amounts Assets Liabilities
Notional amounts Assets Liabilities
Interest rate contracts 172,652 4,203 4,356 172,667 3,512 3,682
Exchange rate contracts 631,047 8,851 7,941 550,524 6,631 5,042
Other contracts 3,137 19 57 1,625 10 10
Total 806,836 13,073 12,354 724,816 10,153 8,734
(2) Analysed by credit risk-weighted amountGroup Bank
2011 2010 2011 2010
Interest rate contracts 4,004 3,491 3,979 3,485
Exchange rate contracts 11,900 7,868 10,909 7,195
Other contracts 685 830 49 22
Total 16,589 12,189 14,937 10,702
The notional amounts of derivatives only represent the unsettled transaction volume as at the end of the reporting period. They do not represent the amounts at risk. The credit risk-weighted amount was computed in accordance with the rules set out by the CBRC and depended on the status of the counterparty and the maturity characteristics. It included customer driven transactions, which were hedged back to back.

148 CHINA CONSTRUCTION BANK CORPORATION ANNUAL REPORT 2011
(Expressed in millions of RMB, unless otherwise stated)
NOTES TO THE FINANCIAL STATEMENTS
23 FINANCIAL ASSETS HELD UNDER RESALE AGREEMENTSGroup Bank
2011 2010 2011 2010
Securities – Government bonds 63,787 98,288 63,787 98,288 – Bills issued by the PBOC 14,810 2,490 14,810 2,490 – Debt securities issued by banks and non-bank financial institutions 107,467 13,541 107,467 13,541
Subtotal 186,064 114,319 186,064 114,319Discounted bills 5,811 44,689 5,811 44,689Loans and advances to customers 8,170 22,067 8,170 22,067
Total and net balances 200,045 181,075 200,045 181,075
24 INTEREST RECEIVABLEGroup Bank
2011 2010 2011 2010
Deposits with central banks 919 757 919 757Deposits with banks and non-bank financial institutions 1,055 176 1,070 176Financial assets held under resale agreements 580 704 580 704Loans and advances to customers 16,674 11,575 16,334 11,442Debt securities 37,060 30,703 36,978 30,609Others 489 174 540 174
Gross balances 56,777 44,089 56,421 43,862Allowances for impairment losses (Note 37) (1) (1) (1) (1)
Net balances 56,776 44,088 56,420 43,861
25 LOANS AND ADVANCES TO CUSTOMERS(1) Analysed by nature
Group Bank
2011 2010 2011 2010
Corporate loans and advances – Loans 4,636,821 4,111,613 4,563,855 4,061,698 – Finance leases 36,095 23,382 – –
4,672,916 4,134,995 4,563,855 4,061,698
Personal loans and advances – Residential mortgages 1,330,198 1,105,431 1,312,974 1,088,603 – Personal consumer loans 79,515 81,118 76,692 78,844 – Personal business loans 80,075 48,659 78,716 48,185 – Credit cards 101,694 59,562 97,553 55,440 – Others 114,140 96,187 111,975 94,612
1,705,622 1,390,957 1,677,910 1,365,684
Discounted bills 117,873 143,176 117,781 143,158
Gross loans and advances to customers 6,496,411 5,669,128 6,359,546 5,570,540Allowances for impairment losses (Note 37) (171,217) (143,102) (170,183) (142,261) – Individual assessment (38,109) (37,352) (38,020) (37,278) – Collective assessment (133,108) (105,750) (132,163) (104,983)
Net loans and advances to customers 6,325,194 5,526,026 6,189,363 5,428,279

CHINA CONSTRUCTION BANK CORPORATION ANNUAL REPORT 2011
(Expressed in millions of RMB, unless otherwise stated)
149
NOTES TO THE FINANCIAL STATEMENTS
25 LOANS AND ADVANCES TO CUSTOMERS (CONTINUED)(2) Analysed by assessment method of allowances for impairment losses
(note (a)) Loans and advances for which
collectively assessed
(note (b)) Impaired loans and advances
for which allowances
are collectively assessed
for which allowances
are individually assessed Total
Group
As at 31 December 2011
Gross loans and advances to customers 6,425,496 5,290 65,625 6,496,411
Allowances for impairment losses (129,832) (3,276) (38,109) (171,217)
Net loans and advances to customers 6,295,664 2,014 27,516 6,325,194
As at 31 December 2010
Gross loans and advances to customers 5,604,416 6,054 58,658 5,669,128
Allowances for impairment losses (102,093) (3,657) (37,352) (143,102)
Net loans and advances to customers 5,502,323 2,397 21,306 5,526,026
Bank
As at 31 December 2011
Gross loans and advances to customers 6,288,878 5,178 65,490 6,359,546
Allowances for impairment losses (128,898) (3,265) (38,020) (170,183)
Net loans and advances to customers 6,159,980 1,913 27,470 6,189,363
As at 31 December 2010
Gross loans and advances to customers 5,506,036 5,920 58,584 5,570,540
Allowances for impairment losses (101,335) (3,648) (37,278) (142,261)
Net loans and advances to customers 5,404,701 2,272 21,306 5,428,279
(a) Loans and advances assessed on a collective basis for impairment are those graded normal or special mention.
(b) Impaired loans and advances include loans for which objective evidence of impairment exists and assessed:
– individually (including corporate loans and advances which are graded substandard, doubtful or loss); or
– collectively; these are portfolios of homogeneous loans (including personal loans and advances which are graded substandard, doubtful or loss).
The proportion of impaired loans and advances of the Group to gross loans and advances as at 31 December 2011 is 1.09% (2010: 1.14%).
The proportion of impaired loans and advances of the Bank to gross loans and advances as at 31 December 2011 is 1.11% (2010: 1.16%).
(c) The definitions of the loan classifications stated in notes (a) and (b) above are set out in Note 62(1).

150 CHINA CONSTRUCTION BANK CORPORATION ANNUAL REPORT 2011
(Expressed in millions of RMB, unless otherwise stated)
NOTES TO THE FINANCIAL STATEMENTS
25 LOANS AND ADVANCES TO CUSTOMERS (CONTINUED)(3) Movements of allowances for impairment losses
Group
2011
Allowances for loans and
advances which are collectively
assessed
Allowances for impaired loans and advances
Note
which are collectively
assessed
which are individually
assessed Total
As at 1 January 102,093 3,657 37,352 143,102
Charge for the year 27,806 217 14,605 42,628
Release during the year – – (10,225) (10,225)
Unwinding of discount – – (1,413) (1,413)
Transfers out (a) (67) (8) (718) (793)
Write-offs – (676) (2,654) (3,330)
Recoveries – 86 1,162 1,248
As at 31 December 129,832 3,276 38,109 171,217
2010
Allowances for loans and
advances which are collectively
assessed
Allowances for impaired loans and advances
Note
which are collectively
assessed
which are individually assessed Total
As at 1 January 75,628 4,838 46,360 126,826
Charge for the year 26,465 103 11,857 38,425
Release during the year – (261) (12,523) (12,784)
Unwinding of discount – – (799) (799)
Transfers out (a) – (18) (383) (401)
Write-offs – (1,084) (8,193) (9,277)
Recoveries – 79 1,033 1,112
As at 31 December 102,093 3,657 37,352 143,102
Bank
2011
Allowances for loans and
advances which are collectively
assessed
Allowances for impaired loans and advances
Note
which are collectively
assessed
which are individually
assessed Total
As at 1 January 101,335 3,648 37,278 142,261
Charge for the year 27,630 144 14,567 42,341
Release during the year – – (10,220) (10,220)
Unwinding of discount – – (1,413) (1,413)
Transfers out (a) (67) (8) (698) (773)
Write-offs – (582) (2,653) (3,235)
Recoveries – 63 1,159 1,222
As at 31 December 128,898 3,265 38,020 170,183

CHINA CONSTRUCTION BANK CORPORATION ANNUAL REPORT 2011
(Expressed in millions of RMB, unless otherwise stated)
151
NOTES TO THE FINANCIAL STATEMENTS
25 LOANS AND ADVANCES TO CUSTOMERS (CONTINUED)(3) Movements of allowances for impairment losses (continued)
Bank (continued)
2010
Allowances for loans and
advances which are collectively
assessed
Allowances for impaired loans and advances
Note
which are collectively
assessed
which are individually assessed Total
As at 1 January 74,971 4,832 46,308 126,111
Charge for the year 26,364 – 11,817 38,181
Release during the year – (261) (12,520) (12,781)
Unwinding of discount – – (799) (799)
Transfers out (a) – (14) (366) (380)
Write-offs – (966) (8,193) (9,159)
Recoveries – 57 1,031 1,088
As at 31 December 101,335 3,648 37,278 142,261
(a) Transfers out include the transfer of allowances for impairment losses to repossessed assets.
(4) Overdue loans analysed by overdue period
Group
2011
Overdue within three
months
Overdue between three
months and one year
Overdue between one
year and three years
Overdue over three years Total
Unsecured loans 2,515 603 938 1,209 5,265
Guaranteed loans 2,732 2,958 2,781 4,558 13,029
Loans secured by tangible assets other than monetary assets 15,585 5,585 7,525 6,989 35,684
Loans secured by monetary assets 983 593 641 797 3,014
Total 21,815 9,739 11,885 13,553 56,992
As a percentage of gross loans and advances to customers 0.34% 0.15% 0.18% 0.21% 0.88%
2010
Overdue within three
months
Overdue between three
months and one year
Overdue between one
year and three years
Overdue over three years Total
Unsecured loans 2,141 529 1,486 1,081 5,237
Guaranteed loans 943 833 5,275 4,243 11,294
Loans secured by tangible assets other than monetary assets 15,095 3,926 11,141 5,842 36,004
Loans secured by monetary assets 428 1,307 1,164 821 3,720
Total 18,607 6,595 19,066 11,987 56,255
As a percentage of gross loans and advances to customers 0.33% 0.12% 0.34% 0.20% 0.99%

152 CHINA CONSTRUCTION BANK CORPORATION ANNUAL REPORT 2011
(Expressed in millions of RMB, unless otherwise stated)
NOTES TO THE FINANCIAL STATEMENTS
25 LOANS AND ADVANCES TO CUSTOMERS (CONTINUED)(4) Overdue loans analysed by overdue period (continued)
Bank
2011
Overdue within three
months
Overdue between three
months and one year
Overdue between one
year and three years
Overdue over three years Total
Unsecured loans 2,444 595 896 1,203 5,138
Guaranteed loans 2,731 2,892 2,781 4,558 12,962
Loans secured by tangible assets other than monetary assets 15,302 5,585 7,525 6,987 35,399
Loans secured by monetary assets 983 593 641 797 3,014
Total 21,460 9,665 11,843 13,545 56,513
As a percentage of gross loans and advances to customers 0.34% 0.15% 0.19% 0.21% 0.89%
2010
Overdue within three months
Overdue between three
months and one year
Overdue between one
year and three years
Overdue over three years Total
Unsecured loans 2,068 520 1,436 1,080 5,104
Guaranteed loans 942 833 5,275 4,243 11,293
Loans secured by tangible assets other than monetary assets 14,889 3,925 11,141 5,840 35,795
Loans secured by monetary assets 428 1,307 1,164 821 3,720
Total 18,327 6,585 19,016 11,984 55,912
As a percentage of gross loans and advances to customers 0.33% 0.11% 0.34% 0.22% 1.00%
Overdue loans represent loans of which the whole or part of the principal or interest are overdue for 1 day or more.

CHINA CONSTRUCTION BANK CORPORATION ANNUAL REPORT 2011
(Expressed in millions of RMB, unless otherwise stated)
153
NOTES TO THE FINANCIAL STATEMENTS
26 AVAILABLE-FOR-SALE FINANCIAL ASSETSGroup Bank
Note 2011 2010 2011 2010
Debt securities (1) 661,036 676,840 651,585 675,277
Equity instruments (2) 13,764 19,837 11,998 17,754
Funds (2) 258 171 – –
Total 675,058 696,848 663,583 693,031
(1) Debt securities
Group Bank
2011 2010 2011 2010
Government 84,591 87,556 84,015 87,226
Central banks 144,830 284,706 141,810 284,029
Policy banks 59,175 31,770 59,165 31,760
Banks and non-bank financial institutions 156,185 110,678 151,626 110,552
Public sector entities 196 1,458 196 1,458
Other enterprises 216,059 160,672 214,773 160,252
Total 661,036 676,840 651,585 675,277
Listed 18,666 23,012 18,312 22,576
– of which in Hong Kong 1,906 2,287 1,906 2,254
Unlisted 642,370 653,828 633,273 652,701
Total 661,036 676,840 651,585 675,277
(2) Equity instruments and funds
Group Bank
2011 2010 2011 2010
Debt equity swap (“DES”) investments 10,607 16,467 10,607 16,467
Other equity instruments 3,157 3,370 1,391 1,287
Funds 258 171 – –
Total 14,022 20,008 11,998 17,754
Listed 10,251 16,550 10,064 15,953
– of which in Hong Kong 632 1,011 617 740
Unlisted 3,771 3,458 1,934 1,801
Total 14,022 20,008 11,998 17,754
Pursuant to the DES arrangement by the PRC government in 1999, the Group obtained equity interests of certain entities in lieu of repayments of loans granted to them. According to relevant requirements, the Group is prohibited from being involved in management of the operations of these entities. In substance, the Group does not have any control or significant influence over these entities.

154 CHINA CONSTRUCTION BANK CORPORATION ANNUAL REPORT 2011
(Expressed in millions of RMB, unless otherwise stated)
NOTES TO THE FINANCIAL STATEMENTS
27 HELD-TO-MATURITY INVESTMENTSGroup Bank
2011 2010 2011 2010
Government 765,747 673,620 764,969 673,490
Central banks 270,122 668,407 270,122 668,407
Policy banks 225,576 151,743 225,576 151,743
Banks and non-bank financial institutions 475,703 385,708 475,504 385,708
Public sector entities – 198 – 198
Other enterprises 10,415 9,384 10,165 9,384
Gross balances 1,747,563 1,889,060 1,746,336 1,888,930
Allowances for impairment losses (Note 37) (3,994) (5,003) (3,994) (5,003)
Net balances 1,743,569 1,884,057 1,742,342 1,883,927
Listed outside Hong Kong 4,126 4,684 4,115 4,684
Unlisted 1,739,443 1,879,373 1,738,227 1,879,243
Total 1,743,569 1,884,057 1,742,342 1,883,927
Market value of listed securities 4,627 5,341 4,616 5,341
28 DEBT SECURITIES CLASSIFIED AS RECEIVABLESAll debt securities classified as receivables are unlisted and issued by the following entities in Mainland China:
Group Bank
Note 2011 2010 2011 2010
Government
– Special government bond (1) 49,200 49,200 49,200 49,200
– Others 742 530 530 530
The PBOC (2) 17,944 593 17,944 593
Banks and non-bank financial institutions 82,336 48,925 82,286 48,925
China Cinda Assets Management Co., Ltd. (“Cinda”) (3) 131,761 206,261 131,761 206,261
Other enterprises 18,659 1,359 18,659 1,359
Gross balances 300,642 306,868 300,380 306,868
Allowance for impairment losses (Note 37) (615) (120) (615) (120)
Net balances 300,027 306,748 299,765 306,748
(1) This represents a non-negotiable bond with a nominal value of RMB49,200 million issued by the Ministry of Finance (“MOF”) in 1998 to strengthen the capital base of CCB. The bond matures in 2028 and bears a fixed interest rate of 2.25% per annum. The PBOC approved the Bank’s use of the special government bond as eligible assets equivalent to the surplus deposit reserve at PBOC for clearing purpose.
(2) Debt securities issued by the PBOC mainly refer to PBOC bills issued specifically to the Bank.
(3) China Cinda Assets Management Co., Ltd. (formerly known as China Cinda Asset Management Corporation) (“Cinda”) issued a bond (“Cinda Bond”) with a nominal value of RMB247 billion specifically to CCB in 1999 with a fixed coupon rate of 2.25%. Cinda Bond was extended for 10 years upon its expiry and the interest rate remained unchanged from 2009.

CHINA CONSTRUCTION BANK CORPORATION ANNUAL REPORT 2011
(Expressed in millions of RMB, unless otherwise stated)
155
NOTES TO THE FINANCIAL STATEMENTS
29 INVESTMENTS IN SUBSIDIARIES(1) Investment cost
2011 2010
Sing Jian Development Company Limited (“SJDCL”) 383 383
Sino-German Bausparkasse Corporation Limited (“Sino-German”) 1,502 751
CCB Principal Asset Management Corporation Limited (“CCB Principal”) 130 130
CCB International Group Holdings Limited (“CCBIG”) – –
CCB Financial Leasing Corporation Limited (“CCBFLCL”) 3,380 3,380
China Construction Bank (London) Limited (“CCB London”) 1,361 1,361
Jianxin Trust Corporation Limited (“Jianxin Trust”) 3,409 3,409
CCB Life Insurance Company Limited (“CCB Life”) 1,010 –
Rural Banks 775 455
Total 11,950 9,869
The total amount of investment costs of rural banks consists 16 rural banks in total, which are established and controlled by the Bank in substance.
(2) Major subsidiaries of the Group are unlisted enterprises; details of the investments in subsidiaries are as follows:
Name of companyPlace of
incorporation
Particulars of the issued and paid up capital Principal activities
% of ownership
directly held by
the Bank
% of ownership
indirectly held by
the Bank
% of voting rights
held by the Bank
SJDCL Hong Kong, the PRC 300 million shares of HK$1 each
Investment 100% – 100%
Sino-German Tianjin, the PRC RMB2,000 million Loan and deposit taking business
75.1% – 75.1%
CCB Principal Beijing, the PRC RMB200 million Fund management services
65% – 65%
CCBIG Hong Kong, the PRC 1 share of HK$1 each Investment 100% – 100%
CCBFLCL Beijing, the PRC 4,500 million shares of RMB1 each
Financial leasing 75.1% – 75.1%
CCB London London, United Kingdom
200 million shares of US$1 each
Commercial banking 100% – 100%
Jianxin Trust Anhui, the PRC RMB1,527 million Trust business 67% – 67%
CCB Life Shanghai, the PRC RMB1,180 million Insurance 51% – 51%
Lanhye Investment Holdings Limited British Virgin Islands 1 share of US$1 each Investment – 100% 100%
CCB International (Holdings) Limited (“CCBI”)
Hong Kong, the PRC 601 million shares of US$1 each
Investment – 100% 100%
China Construction Bank (Asia) Corporation Limited (“CCB Asia”)
Hong Kong, the PRC 163 million shares of HK$40 each
Commercial banking – 100% 100%

156 CHINA CONSTRUCTION BANK CORPORATION ANNUAL REPORT 2011
(Expressed in millions of RMB, unless otherwise stated)
NOTES TO THE FINANCIAL STATEMENTS
30 INTERESTS IN ASSOCIATES AND JOINTLY CONTROLLED ENTITIES(1) The movement of the Group’s interests in associates and jointly controlled entities is as follows:
2011 2010
As at 1 January 1,777 1,791
Acquisition during the year 348 18
Share of profits less losses 24 34
Cash dividend receivable (3) –
Effect of exchange difference and others (77) (66)
Total 2,069 1,777
(2) Details of the interests in major associate and jointly controlled entity are as follows:
Name of CompanyPlace of
incorporation
Particulars of issued and paid
up capitalPrincipal
activity
% of ownership
held
% of voting
held
Total assets
at year end
Total liabilities
at year endRevenue
for the year
Net profit for
the year
QBE Hong Kong and Shanghai Insurance Limited
Hong Kong, the PRC
78,192,220 ordinary shares of HK$1 each
Insurance 25.5% 25.5% 1,400 896 659 89
Diamond String Limited
Hong Kong, the PRC
10,000 ordinary shares of
HK$1 each
Property investment
50% 50% 1,232 1,230 – –
31 FIXED ASSETSGroup
Bank premises
Construction in progress Equipments Others Total
Cost/deemed cost
As at 1 January 2011 57,848 15,639 26,724 19,375 119,586
Additions through acquisition – – 10 52 62
Additions 3,808 10,150 5,053 3,158 22,169
Transfer in/(out) 4,396 (6,233) 62 1,775 –
Disposals (361) (623) (1,774) (1,127) (3,885)
As at 31 December 2011 65,691 18,933 30,075 23,233 137,932
Accumulated depreciation
As at 1 January 2011 (11,646) – (16,360) (7,661) (35,667)
Additions through acquisition – – (8) (45) (53)
Charge for the year (2,212) – (4,264) (3,921) (10,397)
Disposals 97 – 1,667 1,110 2,874
As at 31 December 2011 (13,761) – (18,965) (10,517) (43,243)
Allowances for impairment losses (Note 37)
As at 1 January 2011 (476) – (3) (6) (485)
Charge for the year – – – (1) (1)
Disposals 17 – 2 – 19
As at 31 December 2011 (459) – (1) (7) (467)
Net carrying value
As at 1 January 2011 45,726 15,639 10,361 11,708 83,434
As at 31 December 2011 51,471 18,933 11,109 12,709 94,222

CHINA CONSTRUCTION BANK CORPORATION ANNUAL REPORT 2011
(Expressed in millions of RMB, unless otherwise stated)
157
NOTES TO THE FINANCIAL STATEMENTS
31 FIXED ASSETS (CONTINUED)Group (continued)
Bank premisesConstruction
in progress Equipments Others Total
Cost/deemed costAs at 1 January 2010 51,305 11,349 24,030 16,351 103,035Additions 3,506 8,940 3,928 2,505 18,879Transfer in/(out) 3,174 (4,546) 29 1,343 –Disposals (137) (104) (1,263) (824) (2,328)
As at 31 December 2010 57,848 15,639 26,724 19,375 119,586
Accumulated depreciationAs at 1 January 2010 (9,701) – (13,286) (4,852) (27,839)Charge for the year (2,009) – (4,285) (3,561) (9,855)Disposals 64 – 1,211 752 2,027
As at 31 December 2010 (11,646) – (16,360) (7,661) (35,667)
Allowances for impairment losses (Note 37)As at 1 January 2010 (489) (5) (3) (6) (503)Charge for the year (2) – – – (2)Disposals 15 5 – – 20
As at 31 December 2010 (476) – (3) (6) (485)
Net carrying valueAs at 1 January 2010 41,115 11,344 10,741 11,493 74,693
As at 31 December 2010 45,726 15,639 10,361 11,708 83,434
Bank
Bank premisesConstruction
in progress Equipments Others Total
Cost/deemed costAs at 1 January 2011 57,296 15,636 26,458 19,083 118,473Additions 3,806 10,131 5,006 2,978 21,921Transfer in/(out) 4,395 (6,225) 62 1,768 –Disposals (357) (614) (1,761) (1,113) (3,845)
As at 31 December 2011 65,140 18,928 29,765 22,716 136,549
Accumulated depreciationAs at 1 January 2011 (11,585) – (16,201) (7,506) (35,292)Charge for the year (2,192) – (4,216) (3,869) (10,277)Disposals 97 – 1,655 1,103 2,855
As at 31 December 2011 (13,680) – (18,762) (10,272) (42,714)
Allowances for impairment losses (Note 37)As at 1 January 2011 (476) – (3) (6) (485)Disposals 17 – 2 – 19
As at 31 December 2011 (459) – (1) (6) (466)
Net carrying valueAs at 1 January 2011 45,235 15,636 10,254 11,571 82,696
As at 31 December 2011 51,001 18,928 11,002 12,438 93,369
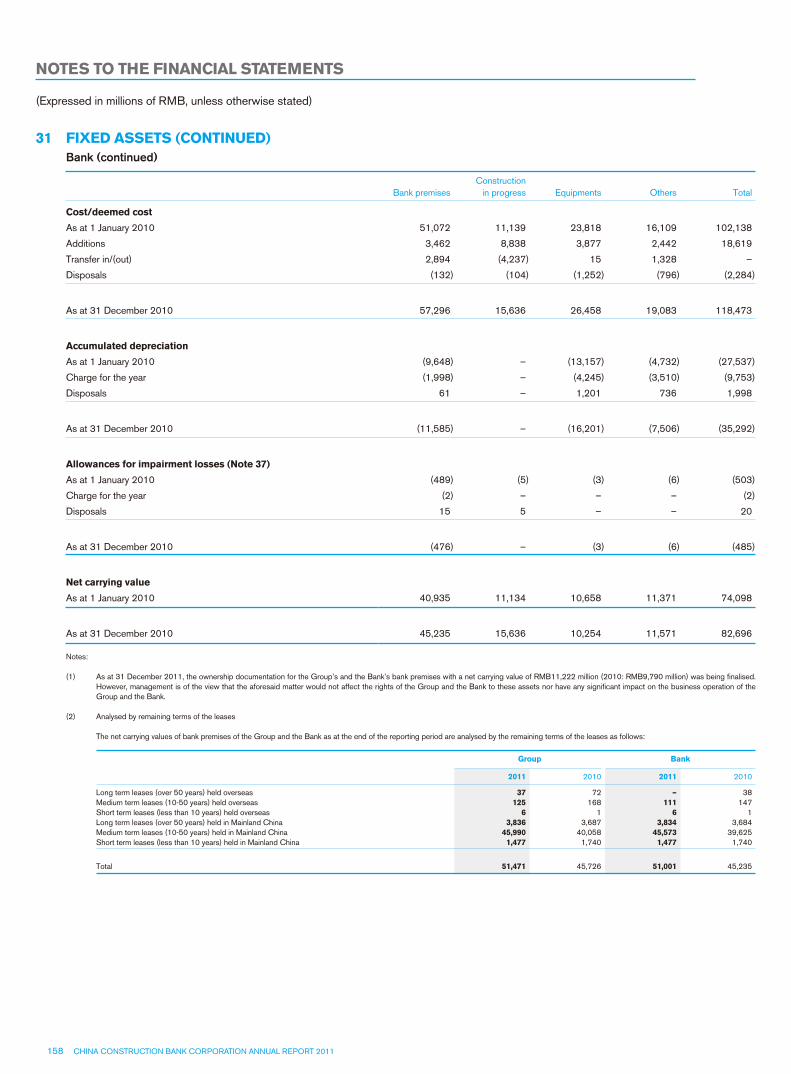
158 CHINA CONSTRUCTION BANK CORPORATION ANNUAL REPORT 2011
(Expressed in millions of RMB, unless otherwise stated)
NOTES TO THE FINANCIAL STATEMENTS
31 FIXED ASSETS (CONTINUED)Bank (continued)
Bank premisesConstruction
in progress Equipments Others Total
Cost/deemed cost
As at 1 January 2010 51,072 11,139 23,818 16,109 102,138
Additions 3,462 8,838 3,877 2,442 18,619
Transfer in/(out) 2,894 (4,237) 15 1,328 –
Disposals (132) (104) (1,252) (796) (2,284)
As at 31 December 2010 57,296 15,636 26,458 19,083 118,473
Accumulated depreciation
As at 1 January 2010 (9,648) – (13,157) (4,732) (27,537)
Charge for the year (1,998) – (4,245) (3,510) (9,753)
Disposals 61 – 1,201 736 1,998
As at 31 December 2010 (11,585) – (16,201) (7,506) (35,292)
Allowances for impairment losses (Note 37)
As at 1 January 2010 (489) (5) (3) (6) (503)
Charge for the year (2) – – – (2)
Disposals 15 5 – – 20
As at 31 December 2010 (476) – (3) (6) (485)
Net carrying value
As at 1 January 2010 40,935 11,134 10,658 11,371 74,098
As at 31 December 2010 45,235 15,636 10,254 11,571 82,696
Notes:
(1) As at 31 December 2011, the ownership documentation for the Group’s and the Bank’s bank premises with a net carrying value of RMB11,222 million (2010: RMB9,790 million) was being finalised. However, management is of the view that the aforesaid matter would not affect the rights of the Group and the Bank to these assets nor have any significant impact on the business operation of the Group and the Bank.
(2) Analysed by remaining terms of the leases
The net carrying values of bank premises of the Group and the Bank as at the end of the reporting period are analysed by the remaining terms of the leases as follows:
Group Bank
2011 2010 2011 2010
Long term leases (over 50 years) held overseas 37 72 – 38Medium term leases (10-50 years) held overseas 125 168 111 147Short term leases (less than 10 years) held overseas 6 1 6 1Long term leases (over 50 years) held in Mainland China 3,836 3,687 3,834 3,684Medium term leases (10-50 years) held in Mainland China 45,990 40,058 45,573 39,625Short term leases (less than 10 years) held in Mainland China 1,477 1,740 1,477 1,740
Total 51,471 45,726 51,001 45,235

CHINA CONSTRUCTION BANK CORPORATION ANNUAL REPORT 2011
(Expressed in millions of RMB, unless otherwise stated)
159
NOTES TO THE FINANCIAL STATEMENTS
32 LAND USE RIGHTSGroup
2011 2010
Cost/deemed cost
As at 1 January 20,458 20,173
Additions 172 375
Disposals (155) (90)
As at 31 December 20,475 20,458
Amortisation
As at 1 January (3,387) (2,900)
Charge for the year (508) (503)
Disposals 23 16
As at 31 December (3,872) (3,387)
Allowances for impairment losses (Note 37)
As at 1 January (149) (151)
Disposals 3 2
As at 31 December (146) (149)
Net carrying value
As at 1 January 16,922 17,122
As at 31 December 16,457 16,922
Bank
2011 2010
Cost/deemed cost
As at 1 January 20,397 20,110
Additions 172 375
Disposals (152) (88)
As at 31 December 20,417 20,397
Amortisation
As at 1 January (3,383) (2,897)
Charge for the year (507) (502)
Disposals 23 16
As at 31 December (3,867) (3,383)
Allowances for impairment losses (Note 37)
As at 1 January (149) (151)
Disposals 3 2
As at 31 December (146) (149)
Net carrying value
As at 1 January 16,865 17,062
As at 31 December 16,404 16,865

160 CHINA CONSTRUCTION BANK CORPORATION ANNUAL REPORT 2011
(Expressed in millions of RMB, unless otherwise stated)
NOTES TO THE FINANCIAL STATEMENTS
33 INTANGIBLE ASSETSGroup
Software Others Total
Cost/deemed cost
As at 1 January 2011 3,906 49 3,955
Additions through acquisition 48 424 472
Additions 409 71 480
Disposals (118) (5) (123)
As at 31 December 2011 4,245 539 4,784
Amortisation
As at 1 January 2011 (2,626) (11) (2,637)
Additions through acquisition (27) – (27)
Charge for the year (491) (74) (565)
Disposals 111 2 113
As at 31 December 2011 (3,033) (83) (3,116)
Allowances for impairment losses (Note 37)
As at 1 January 2011 (1) (7) (8)
As at 31 December 2011 (1) (7) (8)
Net carrying value
As at 1 January 2011 1,279 31 1,310
As at 31 December 2011 1,211 449 1,660
Cost/deemed cost
As at 1 January 2010 3,433 58 3,491
Additions 502 14 516
Disposals (29) (23) (52)
As at 31 December 2010 3,906 49 3,955
Amortisation
As at 1 January 2010 (2,183) (30) (2,213)
Charge for the year (467) (1) (468)
Disposals 24 20 44
As at 31 December 2010 (2,626) (11) (2,637)
Allowances for impairment losses (Note 37)
As at 1 January 2010 (1) (7) (8)
As at 31 December 2010 (1) (7) (8)
Net carrying value
As at 1 January 2010 1,249 21 1,270
As at 31 December 2010 1,279 31 1,310

CHINA CONSTRUCTION BANK CORPORATION ANNUAL REPORT 2011
(Expressed in millions of RMB, unless otherwise stated)
161
NOTES TO THE FINANCIAL STATEMENTS
33 INTANGIBLE ASSETS (CONTINUED)Bank
Software Others Total
Cost/deemed cost
As at 1 January 2011 3,858 38 3,896
Additions 386 69 455
Disposals (117) (5) (122)
As at 31 December 2011 4,127 102 4,229
Amortisation
As at 1 January 2011 (2,604) (11) (2,615)
Charge for the year (477) (66) (543)
Disposals 111 2 113
As at 31 December 2011 (2,970) (75) (3,045)
Allowances for impairment losses (Note 37)
As at 1 January 2011 (1) (7) (8)
As at 31 December 2011 (1) (7) (8)
Net carrying value
As at 1 January 2011 1,253 20 1,273
As at 31 December 2011 1,156 20 1,176
Cost/deemed cost
As at 1 January 2010 3,400 49 3,449
Additions 482 10 492
Disposals (24) (21) (45)
As at 31 December 2010 3,858 38 3,896
Amortisation
As at 1 January 2010 (2,170) (29) (2,199)
Charge for the year (458) (1) (459)
Disposals 24 19 43
As at 31 December 2010 (2,604) (11) (2,615)
Allowances for impairment losses (Note 37)
As at 1 January 2010 (1) (7) (8)
As at 31 December 2010 (1) (7) (8)
Net carrying value
As at 1 January 2010 1,229 13 1,242
As at 31 December 2010 1,253 20 1,273

162 CHINA CONSTRUCTION BANK CORPORATION ANNUAL REPORT 2011
(Expressed in millions of RMB, unless otherwise stated)
NOTES TO THE FINANCIAL STATEMENTS
34 GOODWILL(1) The goodwill is attributable to the expected synergies arising from the acquisition of CCB Asia on 29 December 2006, Jianxin Trust
on 29 July 2009 and CCB Life on 29 June 2011. Movement of the goodwill is as follows:
2011 2010
As at 1 January 1,534 1,590
Additions through acquisitions 194 –
Effect of exchange difference (66) (56)
As at 31 December 1,662 1,534
(2) Impairment test for CGU containing goodwill
The Group calculated the recoverable amount of the CGU using cash flow projections based on financial forecasts approved by management. The average growth rate used by the Group is consistent with the forecasts included in industry reports. The discount rate used reflects specific risks relating to the relevant segments.
Based on the result of the impairment test, no impairment losses on goodwill were recognised as at 31 December 2011 (2010: nil).
35 DEFERRED TAXGroup Bank
2011 2010 2011 2010
Deferred tax assets 21,410 17,825 22,003 18,774
Deferred tax liabilities (358) (243) (23) (4)
Total 21,052 17,582 21,980 18,770
(1) Analysed by nature
Group
2011 2010
Deductible/(taxable)
temporary differences
Deferred tax assets/(liabilities)
Deductible/(taxable)
temporary differences
Deferred tax assets/(liabilities)
Deferred tax assets
– Fair value adjustments (9,066) (2,271) (10,685) (2,683)
– Allowances for impairment losses 86,022 21,386 63,559 15,736
– Early retirement benefits and accrued salaries 22,755 5,689 18,772 4,694
– Others (12,758) (3,394) 469 78
Total 86,953 21,410 72,115 17,825
Deferred tax liabilities
– Fair value adjustments (1,323) (309) (1,034) (236)
– Allowances for impairment losses (46) (11) 73 24
– Accrued salaries – – (34) (6)
– Others (148) (38) (77) (25)
Total (1,517) (358) (1,072) (243)

CHINA CONSTRUCTION BANK CORPORATION ANNUAL REPORT 2011
(Expressed in millions of RMB, unless otherwise stated)
163
NOTES TO THE FINANCIAL STATEMENTS
35 DEFERRED TAX (CONTINUED)(1) Analysed by nature (continued)
Bank
2011 2010
Deductible/(taxable)
temporary differences
Deferred tax assets/(liabilities)
Deductible/(taxable)
temporary differences
Deferred tax assets/(liabilities)
Deferred tax assets – Fair value adjustments (9,106) (2,281) (10,752) (2,692) – Allowances for impairment losses 85,634 21,320 63,143 15,665 – Early retirement benefits and accrued salaries 22,606 5,651 18,627 4,657 – Others (7,268) (2,687) 7,840 1,144
Total 91,866 22,003 78,858 18,774
Deferred tax liabilities – Fair value adjustments (55) (13) (7) (2) – Allowances for impairment losses (46) (11) 73 24 – Others 4 1 (80) (26)
Total (97) (23) (14) (4)
(2) Movements of deferred taxGroup
Early retirement benefits and
accrued salariesFair value
adjustments
Allowances for impairment
losses Others Total
As at 1 January 2011 4,688 (2,919) 15,760 53 17,582Recognised in profit or loss 998 210 5,615 (3,443) 3,380Recognised in other comprehensive income – 229 – – 229Addition through acquisition 3 (100) – (42) (139)
As at 31 December 2011 5,689 (2,580) 21,375 (3,432) 21,052
As at 1 January 2010 3,809 (4,565) 11,249 81 10,574Recognised in profit or loss 879 (445) 4,511 (28) 4,917Recognised in other comprehensive income – 2,091 – – 2,091
As at 31 December 2010 4,688 (2,919) 15,760 53 17,582
Bank
Early retirement benefits and
accrued salariesFair value
adjustments
Allowances for impairment
losses Others Total
As at 1 January 2011 4,657 (2,694) 15,689 1,118 18,770Recognised in profit or loss 994 198 5,620 (3,804) 3,008Recognised in other comprehensive income – 202 – – 202
As at 31 December 2011 5,651 (2,294) 21,309 (2,686) 21,980
As at 1 January 2010 3,802 (4,405) 11,164 740 11,301Recognised in profit or loss 855 (409) 4,525 378 5,349Recognised in other comprehensive income – 2,120 – – 2,120
As at 31 December 2010 4,657 (2,694) 15,689 1,118 18,770
The Group and the Bank did not have significant unrecognised deferred tax as at the end of the reporting period.

164 CHINA CONSTRUCTION BANK CORPORATION ANNUAL REPORT 2011
(Expressed in millions of RMB, unless otherwise stated)
NOTES TO THE FINANCIAL STATEMENTS
36 OTHER ASSETSGroup Bank
Note 2011 2010 2011 2010
Repossessed assets (1)
– Buildings 1,553 1,373 1,549 1,373
– Land use rights 219 243 219 243
– Others 60 230 60 230
1,832 1,846 1,828 1,846
Long-term deferred expenses 493 351 462 344
Receivables from CCBIG (2) – – 18,205 19,055
Other receivables 15,920 13,478 13,696 11,260
Leasehold improvements 2,401 2,607 2,389 2,595
Subtotal 20,646 18,282 36,580 35,100
Allowances for impairment losses (Note 37) (2,503) (2,981) (2,503) (2,978)
Total 18,143 15,301 34,077 32,122
(1) During the year ended 31 December 2011, the original cost of repossessed assets disposed of by the Group amounted to RMB473 million (2010: RMB1,764 million). The Group intends to dispose of repossessed assets through various methods including auction, competitive bidding and disposal.
(2) Receivables from CCBIG represent lending to CCBIG, a wholly owned subsidiary, for acquisition of equity investments and capital injection to other subsidiaries. The receivables are unsecured, non-interest bearing and without fixed repayment term.
37 MOVEMENTS OF ALLOWANCES FOR IMPAIRMENT LOSSESGroup
2011
NoteAs at
1 January
Charge for the year/
(Write-back)Transfer in/(out) Write-offs
As at 31 December
Deposits with banks and non-bank financial institutions 19 11 (16) 14 – 9
Placements with banks and non-bank financial institutions 20 84 (37) 35 (17) 65
Interest receivable 24 1 – – – 1
Loans and advances to customers 25(3) 143,102 32,403 (958) (3,330) 171,217
Held-to-maturity investments 27 5,003 (15) (192) (802) 3,994
Debt securities classified as receivables 28 120 495 – – 615
Fixed assets 31 485 1 – (19) 467
Land use rights 32 149 – – (3) 146
Intangible assets 33 8 – – – 8
Other assets 36 2,981 (169) – (309) 2,503
Total 151,944 32,662 (1,101) (4,480) 179,025
Transfer in/(out) includes the exchange difference; write-offs include disposals.

CHINA CONSTRUCTION BANK CORPORATION ANNUAL REPORT 2011
(Expressed in millions of RMB, unless otherwise stated)
165
NOTES TO THE FINANCIAL STATEMENTS
37 MOVEMENTS OF ALLOWANCES FOR IMPAIRMENT LOSSES (CONTINUED)Group (continued)
2010
NoteAs at
1 January
Charge for the year/
(Write-back) Transfer out Write-offsAs at
31 December
Deposits with banks and non-bank financial institutions 19 18 (3) – (4) 11
Placements with banks and non-bank financial institutions 20 131 (30) – (17) 84
Interest receivable 24 1 14 – (14) 1
Loans and advances to customers 25(3) 126,826 25,641 (88) (9,277) 143,102
Held-to-maturity investments 27 6,086 (381) (173) (529) 5,003
Debt securities classified as receivables 28 96 24 – – 120
Fixed assets 31 503 2 – (20) 485
Land use rights 32 151 – – (2) 149
Intangible assets 33 8 – – – 8
Other assets 36 3,288 226 – (533) 2,981
Total 137,108 25,493 (261) (10,396) 151,944
Bank
2011
NoteAs at
1 January
Charge for the year/
(Write-back)Transfer in/(out) Write-offs
As at 31 December
Deposits with banks and non-bank financial institutions 19 11 (16) 14 – 9
Placements with banks and non-bank financial institutions 20 84 (37) 35 (17) 65
Interest receivable 24 1 – – – 1
Loans and advances to customers 25(3) 142,261 32,121 (964) (3,235) 170,183
Held-to-maturity investments 27 5,003 (15) (192) (802) 3,994
Debt securities classified as receivables 28 120 495 – – 615
Fixed assets 31 485 – – (19) 466
Land use rights 32 149 – – (3) 146
Intangible assets 33 8 – – – 8
Other assets 36 2,978 (242) – (233) 2,503
Total 151,100 32,306 (1,107) (4,309) 177,990
2010
NoteAs at
1 January
Charge for the year/
(Write-back) Transfer out Write-offsAs at
31 December
Deposits with banks and non-bank financial institutions 19 18 (3) – (4) 11
Placements with banks and non-bank financial institutions 20 131 (30) – (17) 84
Interest receivable 24 1 14 – (14) 1
Loans and advances to customers 25(3) 126,111 25,400 (91) (9,159) 142,261
Held-to-maturity investments 27 6,086 (381) (173) (529) 5,003
Debt securities classified as receivables 28 96 24 – – 120
Fixed assets 31 503 2 – (20) 485
Land use rights 32 151 – – (2) 149
Intangible assets 33 8 – – – 8
Other assets 36 3,283 228 – (533) 2,978
Total 136,388 25,254 (264) (10,278) 151,100
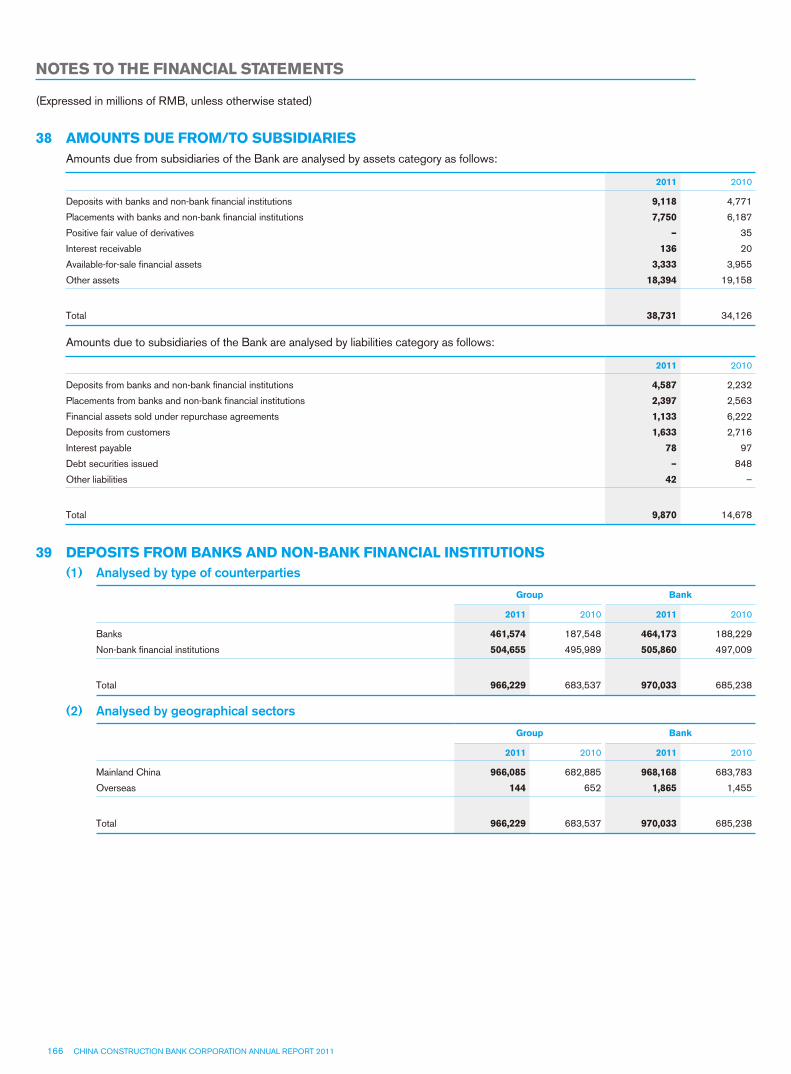
166 CHINA CONSTRUCTION BANK CORPORATION ANNUAL REPORT 2011
(Expressed in millions of RMB, unless otherwise stated)
NOTES TO THE FINANCIAL STATEMENTS
38 AMOUNTS DUE FROM/TO SUBSIDIARIESAmounts due from subsidiaries of the Bank are analysed by assets category as follows:
2011 2010
Deposits with banks and non-bank financial institutions 9,118 4,771
Placements with banks and non-bank financial institutions 7,750 6,187
Positive fair value of derivatives – 35
Interest receivable 136 20
Available-for-sale financial assets 3,333 3,955
Other assets 18,394 19,158
Total 38,731 34,126
Amounts due to subsidiaries of the Bank are analysed by liabilities category as follows:
2011 2010
Deposits from banks and non-bank financial institutions 4,587 2,232
Placements from banks and non-bank financial institutions 2,397 2,563
Financial assets sold under repurchase agreements 1,133 6,222
Deposits from customers 1,633 2,716
Interest payable 78 97
Debt securities issued – 848
Other liabilities 42 –
Total 9,870 14,678
39 DEPOSITS FROM BANKS AND NON-BANK FINANCIAL INSTITUTIONS(1) Analysed by type of counterparties
Group Bank
2011 2010 2011 2010
Banks 461,574 187,548 464,173 188,229
Non-bank financial institutions 504,655 495,989 505,860 497,009
Total 966,229 683,537 970,033 685,238
(2) Analysed by geographical sectors
Group Bank
2011 2010 2011 2010
Mainland China 966,085 682,885 968,168 683,783
Overseas 144 652 1,865 1,455
Total 966,229 683,537 970,033 685,238

CHINA CONSTRUCTION BANK CORPORATION ANNUAL REPORT 2011
(Expressed in millions of RMB, unless otherwise stated)
167
NOTES TO THE FINANCIAL STATEMENTS
40 PLACEMENTS FROM BANKS AND NON-BANK FINANCIAL INSTITUTIONS(1) Analysed by type of counterparties
Group Bank
2011 2010 2011 2010
Banks 77,474 65,895 44,692 41,334
Non-bank financial institutions 1,251 377 962 330
Total 78,725 66,272 45,654 41,664
(2) Analysed by geographical sectors
Group Bank
2011 2010 2011 2010
Mainland China 33,045 24,952 5,745 6,292
Overseas 45,680 41,320 39,909 35,372
Total 78,725 66,272 45,654 41,664
41 FINANCIAL LIABILITIES AT FAIR VALUE THROUGH PROFIT OR LOSSGroup Bank
2011 2010 2011 2010
Structured financial instruments 11,332 2,422 8,642 75
Financial liabilities related to precious metals 22,324 12,865 22,324 12,865
Total 33,656 15,287 30,966 12,940
The Group’s and the Bank’s financial liabilities at fair value through profit or loss are those designated at fair value through profit or loss. As at the end of reporting period, the difference between the fair value of these financial liabilities and the contractual payables at maturity is not material. The amounts of changes in the fair value of these financial liabilities that are attributable to changes in credit risk are considered not significant during the year presented and cumulatively as at 31 December 2011 and 2010.
42 FINANCIAL ASSETS SOLD UNDER REPURCHASE AGREEMENTSGroup Bank
2011 2010 2011 2010
Securities
– PBOC bills 10,010 2,867 10,010 2,867
– Other securities – 55 – –
10,010 2,922 10,010 2,867
Discounted bills 451 – 451 –
Loans – 2,000 1,133 8,222
Total 10,461 4,922 11,594 11,089

168 CHINA CONSTRUCTION BANK CORPORATION ANNUAL REPORT 2011
(Expressed in millions of RMB, unless otherwise stated)
NOTES TO THE FINANCIAL STATEMENTS
43 DEPOSITS FROM CUSTOMERSGroup Bank
2011 2010 2011 2010
Demand deposits
– Corporate customers 3,576,929 3,412,050 3,569,524 3,408,265
– Personal customers 1,839,812 1,726,159 1,829,426 1,714,764
Subtotal 5,416,741 5,138,209 5,398,950 5,123,029
Time deposits (including call deposits)
– Corporate customers 1,949,188 1,608,186 1,920,555 1,585,294
– Personal customers 2,621,521 2,328,974 2,586,588 2,306,323
Subtotal 4,570,709 3,937,160 4,507,143 3,891,617
Total 9,987,450 9,075,369 9,906,093 9,014,646
Deposits from customers include:
Group Bank
2011 2010 2011 2010
(1) Pledged deposits
– Deposits for acceptance 104,880 118,172 104,699 118,172
– Deposits for guarantee 40,570 34,103 40,570 34,103
– Deposits for letter of credit 59,445 39,692 59,441 39,692
– Others 158,088 104,779 157,986 104,747
Total 362,983 296,746 362,696 296,714
(2) Outward remittance and remittance payables 9,508 15,895 9,434 15,864
(3) As at 31 December 2011, the deposits arising from wealth management products with principal guaranteed by the Group and the Bank were RMB154,062 million.
44 ACCRUED STAFF COSTSGroup
2011
NoteAs at
1 January Accrued PaidAs at
31 December
Salaries, bonuses, allowances and subsidies 14,873 49,703 (44,705) 19,871
Defined contribution retirement schemes 492 8,495 (8,435) 552
Other social insurance and welfare 1,265 6,581 (6,216) 1,630
Housing funds 112 3,989 (3,977) 124
Union running costs and employee education costs 954 2,013 (1,793) 1,174
Supplementary retirement benefits (1) 6,901 638 (507) 7,032
Early retirement benefits 6,765 409 (1,632) 5,542
Compensation to employees for termination of employment relationship 7 10 (11) 6
Total 31,369 71,838 (67,276) 35,931

CHINA CONSTRUCTION BANK CORPORATION ANNUAL REPORT 2011
(Expressed in millions of RMB, unless otherwise stated)
169
NOTES TO THE FINANCIAL STATEMENTS
44 ACCRUED STAFF COSTS (CONTINUED)Group (continued)
2010
NoteAs at
1 January Accrued PaidAs at
31 December
Salaries, bonuses, allowances and subsidies 10,835 42,652 (38,614) 14,873
Defined contribution retirement schemes 459 7,206 (7,173) 492
Other social insurance and welfare 1,105 5,311 (5,151) 1,265
Housing funds 82 3,409 (3,379) 112
Union running costs and employee education costs 797 1,695 (1,538) 954
Supplementary retirement benefits (1) 6,786 651 (536) 6,901
Early retirement benefits 7,353 841 (1,429) 6,765
Compensation to employees for termination of employment relationship 8 19 (20) 7
Total 27,425 61,784 (57,840) 31,369
Bank
2011
NoteAs at
1 January Accrued PaidAs at
31 December
Salaries, bonuses, allowances and subsidies 14,133 48,153 (43,064) 19,222
Defined contribution retirement schemes 491 8,397 (8,338) 550
Other social insurance and welfare 1,169 6,525 (6,150) 1,544
Housing funds 111 3,968 (3,955) 124
Union running costs and employee education costs 945 1,997 (1,780) 1,162
Supplementary retirement benefits (1) 6,901 638 (507) 7,032
Early retirement benefits 6,765 409 (1,632) 5,542
Compensation to employees for termination of employment relationship 7 10 (11) 6
Total 30,522 70,097 (65,437) 35,182
2010
NoteAs at
1 January Accrued PaidAs at
31 December
Salaries, bonuses, allowances and subsidies 10,217 41,218 (37,302) 14,133
Defined contribution retirement schemes 458 7,142 (7,109) 491
Other social insurance and welfare 1,013 5,236 (5,080) 1,169
Housing funds 81 3,397 (3,367) 111
Union running costs and employee education costs 792 1,684 (1,531) 945
Supplementary retirement benefits (1) 6,786 651 (536) 6,901
Early retirement benefits 7,353 841 (1,429) 6,765
Compensation to employees for termination of employment relationship 8 19 (20) 7
Total 26,708 60,188 (56,374) 30,522

170 CHINA CONSTRUCTION BANK CORPORATION ANNUAL REPORT 2011
(Expressed in millions of RMB, unless otherwise stated)
NOTES TO THE FINANCIAL STATEMENTS
44 ACCRUED STAFF COSTS (CONTINUED)(1) Supplementary retirement benefits
The Group’s obligations in respect of the supplementary retirement benefits as at the end of the reporting period were calculated using the projected unit credit actuarial cost method and reviewed by qualified staff (a member of Society of Actuaries of the United States of America) of an external independent actuary: Towers, Perrin, Forster & Crosby, Inc., Hong Kong.
(a) Breakdowns of supplementary retirement benefits of the Group and the Bank are as follows:2011 2010
Present value of supplementary retirement benefit obligations 7,033 6,646
Unrecognised actuarial (losses)/gains (1) 255
As at 31 December 7,032 6,901
(b) Movements of supplementary retirement benefits of the Group and the Bank are as follows:2011 2010
As at 1 January 6,901 6,786
Payments made (507) (536)
Expenses recognised in profit or loss
– Interest cost 251 219
– Past service costs 387 432
As at 31 December 7,032 6,901
Interest cost was recognised in other general and administrative expenses. Past service costs were recognised in staff costs.
(c) Principal actuarial assumptions of the Group and the Bank as at the end of the reporting period are as follows:
2011 2010
Discount rate 3.50% 4.00%
Health care cost increases 7.00% 7.00%
Average expected future lifetime of eligible employees 13.6 years 14.1 years
(2) The Group and the Bank had no overdue balance of accrued staff costs as at the end of the reporting period.
45 TAXES PAYABLEGroup Bank
2011 2010 2011 2010
Income tax 38,899 27,748 38,747 27,554
Business tax and surcharges 7,752 5,739 7,688 5,704
Others 538 754 515 687
Total 47,189 34,241 46,950 33,945
46 INTEREST PAYABLEGroup Bank
2011 2010 2011 2010
Deposits from banks and non-bank financial institutions 1,405 1,002 1,392 982
Deposits from customers 76,850 62,966 76,665 62,906
Debts securities issued 1,921 1,575 1,921 1,575
Others 378 116 334 129
Total 80,554 65,659 80,312 65,592

CHINA CONSTRUCTION BANK CORPORATION ANNUAL REPORT 2011
(Expressed in millions of RMB, unless otherwise stated)
171
NOTES TO THE FINANCIAL STATEMENTS
47 PROVISIONSGroup and Bank
2011 2010
Litigation provisions 896 691
Others 4,284 2,708
Total 5,180 3,399
48 DEBT SECURITIES ISSUEDGroup Bank
Note 2011 2010 2011 2010
Certificates of deposit issued (1) 48,451 13,414 38,189 11,530
Subordinated bonds issued (2) 119,861 79,901 119,861 79,901
Total 168,312 93,315 158,050 91,431
(1) Certificates of deposit were mainly issued by overseas branches and CCB Asia and recognised at amortised cost.
(2) Subordinated bonds issued
The carrying value of the Group and the Bank’s subordinated bonds issued upon the approval of the PBOC and the CBRC is as follows:
Group and Bank
Note 2011 2010
3.20% subordinated fixed rate bonds maturing in February 2019 (a) 12,000 12,0004.00% subordinated fixed rate bonds maturing in February 2024 (b) 28,000 28,0003.32% subordinated fixed rate bonds maturing in August 2019 (c) 10,000 10,0004.04% subordinated fixed rate bonds maturing in August 2024 (d) 10,000 10,0004.80% subordinated fixed rate bonds maturing in December 2024 (e) 20,000 20,0005.70% subordinated fixed rate bonds maturing in November 2026 (f) 40,000 –
Total nominal value 120,000 80,000Less: Unamortised issuance cost (139) (99)
Carrying value as at 31 December 119,861 79,901
(a) The interest rate per annum on the subordinated fixed rate bonds issued in February 2009 is 3.20%. The Group has an option to redeem the bonds on 26 February 2014. If they are not redeemed by the Group, the interest rate will increase to 6.20% per annum from 26 February 2014 for the next five years.
(b) The interest rate per annum on the subordinated fixed rate bonds issued in February 2009 is 4.00%. The Group has an option to redeem the bonds on 26 February 2019. If they are not redeemed by the Group, the interest rate will increase to 7.00% per annum from 26 February 2019 for the next five years.
(c) The interest rate per annum on the subordinated fixed rate bonds issued in August 2009 is 3.32%. The Group has an option to redeem the bonds on 11 August 2014. If they are not redeemed by the Group, the interest rate will increase to 6.32% per annum from 11 August 2014 for the next five years.
(d) The interest rate per annum on the subordinated fixed rate bonds issued in August 2009 is 4.04%. The Group has an option to redeem the bonds on 11 August 2019. If they are not redeemed by the Group, the interest rate will increase to 7.04% per annum from 11 August 2019 for the next five years.
(e) The interest rate per annum on the subordinated fixed rate bonds issued in December 2009 is 4.80%. The Group has an option to redeem the bonds on 22 December 2019. If they are not redeemed by the Group, the interest rate will increase to 7.80% per annum from 22 December 2019 for the next five years.
(f) The interest rate per annum on the subordinated fixed rate bonds issued in November 2011 is 5.70%. The Group has an option to redeem the bonds on 7 November 2021, subject to an approval from relevant authority. The interest rate for these bonds will remain at 5.70% per annum for the next five years from 7 November 2021.

172 CHINA CONSTRUCTION BANK CORPORATION ANNUAL REPORT 2011
(Expressed in millions of RMB, unless otherwise stated)
NOTES TO THE FINANCIAL STATEMENTS
49 OTHER LIABILITIESGroup Bank
2011 2010 2011 2010
Deferred income 7,455 4,049 7,296 3,956Capital expenditure payable 5,518 5,332 5,517 5,332Insurance reserve of CCB life 2,670 – – –Dormant accounts 2,193 3,388 2,193 3,388Securities underwriting and redemption payable 2,000 1,977 2,000 1,977Payment and collection clearance accounts 572 491 572 487Settlement accounts 452 555 452 555Payables to China Jianyin Investment Limited (“Jianyin”) 107 150 107 150Others 14,631 8,718 9,575 6,610
Total 35,598 24,660 27,712 22,455
50 SHARE CAPITALGroup and Bank
2011 2010
Listed in Hong Kong (H share) 240,417 240,417Listed in Mainland China (A share) 9,594 9,594
Total 250,011 250,011
All H and A shares are ordinary shares and rank pari passu with the same rights and benefits.
51 CAPITAL RESERVEGroup and Bank
2011 2010
Share premium 135,047 135,047Others 131 89
Total 135,178 135,136
52 INVESTMENT REVALUATION RESERVEThe changes in fair value of available-for-sale financial assets were recognised in “investment revaluation reserve”. Movements of investment revaluation reserve are as follows:
Group
2011
Before-tax amount
Tax (expense)/ benefit
Net-of-tax amount
As at 1 January 9,024 (2,318) 6,706
Gains/(losses) during the year – Debt securities 5,118 (1,203) 3,915 – Equity instruments and funds (6,004) 1,501 (4,503)
(886) 298 (588)
Reclassification adjustments – Impairment 1,106 (277) 829 – Disposals (810) 202 (608) – Others 58 (14) 44
354 (89) 265
As at 31 December 8,492 (2,109) 6,383

CHINA CONSTRUCTION BANK CORPORATION ANNUAL REPORT 2011
(Expressed in millions of RMB, unless otherwise stated)
173
NOTES TO THE FINANCIAL STATEMENTS
52 INVESTMENT REVALUATION RESERVE (CONTINUED)Group (continued)
2010
Before-tax amount
Tax (expense)/ benefit
Net-of-tax amount
As at 1 January 17,566 (4,403) 13,163
Losses during the year
– Debt securities (6,140) 1,485 (4,655)
– Equity instruments and funds (2,018) 504 (1,514)
(8,158) 1,989 (6,169)
Reclassification adjustments
– Impairment 295 (74) 221
– Disposals (735) 184 (551)
– Others 56 (14) 42
(384) 96 (288)
As at 31 December 9,024 (2,318) 6,706
Bank
2011
Before-tax amount
Tax (expense)/ benefit
Net-of-tax amount
As at 1 January 9,039 (2,296) 6,743
Gains/(losses) during the year
– Debt securities 4,942 (1,151) 3,791
– Equity instruments (5,825) 1,456 (4,369)
(883) 305 (578)
Reclassification adjustments
– Impairment 1,106 (277) 829
– Disposals (754) 188 (566)
– Others 58 (14) 44
410 (103) 307
As at 31 December 8,566 (2,094) 6,472
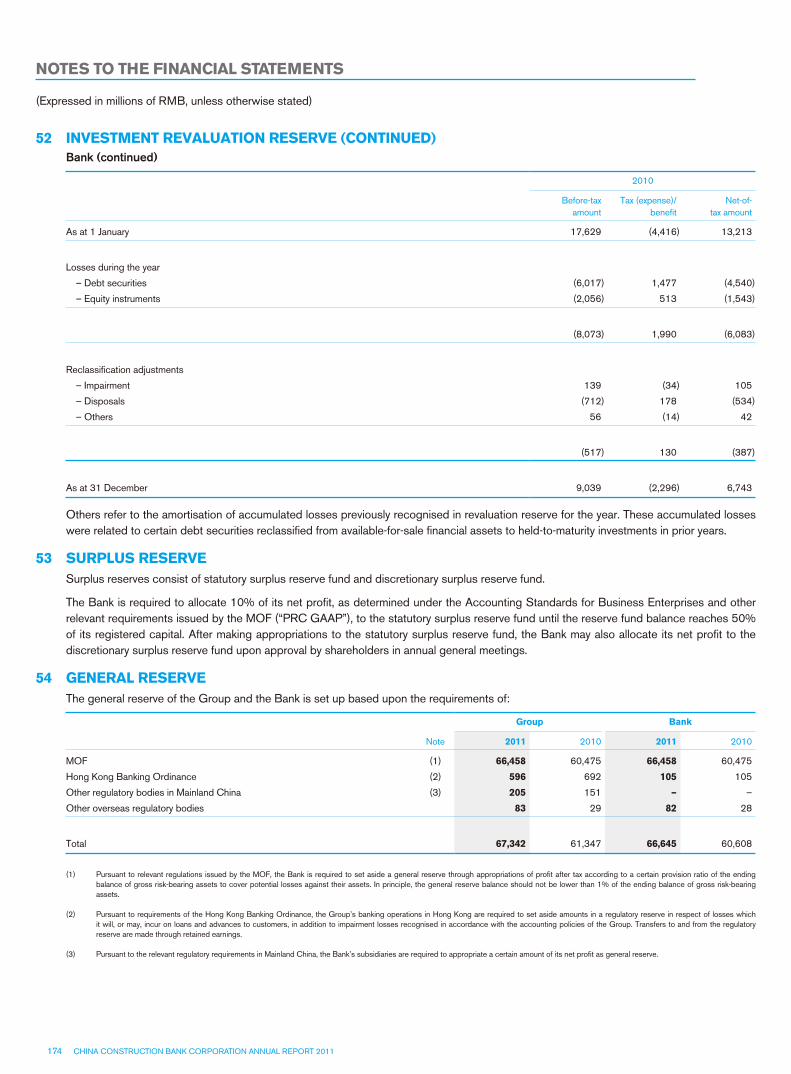
174 CHINA CONSTRUCTION BANK CORPORATION ANNUAL REPORT 2011
(Expressed in millions of RMB, unless otherwise stated)
NOTES TO THE FINANCIAL STATEMENTS
52 INVESTMENT REVALUATION RESERVE (CONTINUED)Bank (continued)
2010
Before-tax amount
Tax (expense)/ benefit
Net-of-tax amount
As at 1 January 17,629 (4,416) 13,213
Losses during the year
– Debt securities (6,017) 1,477 (4,540)
– Equity instruments (2,056) 513 (1,543)
(8,073) 1,990 (6,083)
Reclassification adjustments
– Impairment 139 (34) 105
– Disposals (712) 178 (534)
– Others 56 (14) 42
(517) 130 (387)
As at 31 December 9,039 (2,296) 6,743
Others refer to the amortisation of accumulated losses previously recognised in revaluation reserve for the year. These accumulated losses were related to certain debt securities reclassified from available-for-sale financial assets to held-to-maturity investments in prior years.
53 SURPLUS RESERVESurplus reserves consist of statutory surplus reserve fund and discretionary surplus reserve fund.
The Bank is required to allocate 10% of its net profit, as determined under the Accounting Standards for Business Enterprises and other relevant requirements issued by the MOF (“PRC GAAP”), to the statutory surplus reserve fund until the reserve fund balance reaches 50% of its registered capital. After making appropriations to the statutory surplus reserve fund, the Bank may also allocate its net profit to the discretionary surplus reserve fund upon approval by shareholders in annual general meetings.
54 GENERAL RESERVEThe general reserve of the Group and the Bank is set up based upon the requirements of:
Group Bank
Note 2011 2010 2011 2010
MOF (1) 66,458 60,475 66,458 60,475
Hong Kong Banking Ordinance (2) 596 692 105 105
Other regulatory bodies in Mainland China (3) 205 151 – –
Other overseas regulatory bodies 83 29 82 28
Total 67,342 61,347 66,645 60,608
(1) Pursuant to relevant regulations issued by the MOF, the Bank is required to set aside a general reserve through appropriations of profit after tax according to a certain provision ratio of the ending balance of gross risk-bearing assets to cover potential losses against their assets. In principle, the general reserve balance should not be lower than 1% of the ending balance of gross risk-bearing assets.
(2) Pursuant to requirements of the Hong Kong Banking Ordinance, the Group’s banking operations in Hong Kong are required to set aside amounts in a regulatory reserve in respect of losses which it will, or may, incur on loans and advances to customers, in addition to impairment losses recognised in accordance with the accounting policies of the Group. Transfers to and from the regulatory reserve are made through retained earnings.
(3) Pursuant to the relevant regulatory requirements in Mainland China, the Bank’s subsidiaries are required to appropriate a certain amount of its net profit as general reserve.

CHINA CONSTRUCTION BANK CORPORATION ANNUAL REPORT 2011
(Expressed in millions of RMB, unless otherwise stated)
175
NOTES TO THE FINANCIAL STATEMENTS
55 PROFIT DISTRIBUTIONIn the Annual General Meeting held on 9 June 2011, the shareholders approved the profit distribution for the year ended 31 December 2010. The Bank appropriated cash dividend for the year ended 31 December 2010 in an aggregate amount of RMB53,052 million.
On 23 March 2012, Board of Directors proposed the following profit distribution scheme for the year ended 31 December 2011:
(1) Appropriate statutory surplus reserve amounted to RMB168,950 million, based on 10% of the net profit of the Bank amounted to RMB16,895 million. It has been recorded in “Surplus reserve” as at the end of the reporting period.
(2) Appropriate general reserve amounted to RMB12,723 million, pursuant to relevant regulations issued by MOF.
(3) Appropriate cash dividend RMB0.2365 per share before tax and in aggregation amount of RMB59,128 million to all shareholders. Proposed dividends at the end of the reporting period are not recognised as a liability.
Above proposed profit distribution scheme is subject to the approval of shareholders in the Annual General Meeting. Cash dividends will be distributed to all shareholders registered at the relevant date upon approval.
56 NOTES TO CONSOLIDATED STATEMENT OF CASH FLOWS(1) Cash and cash equivalents
2011 2010
Cash 58,308 48,201Surplus deposit reserves with central banks 324,568 170,938Demand deposits with banks and non-bank financial institutions 33,072 17,910Deposits with banks and non-bank financial institutions with original maturity with or within three months 78,795 7,000Placements with banks and non-bank financial institutions with original maturity with or within three months 63,720 57,250
Total 558,463 301,299
(2) Acquisition of CCB LifeTo acquire CCB Life, the Bank paid a cash consideration of RMB816 million, and acquired cash and cash equivalents of RMB99 million. The net cash outflow arising from the aforesaid acquisition was RMB717 million, which is analysed as follows:
Recognised values
Fair value adjustments
Carrying amounts
Deposits with banks and non-bank financial institutions 1,096 – 1,096Financial assets at fair value through profit or loss 6 – 6Financial assets held under resale agreements 50 – 50Interest receivable 75 – 75Loans and advances to customers 10 – 10Available-for-sale financial assets 1,678 – 1,678Held-to-maturity investments 1,146 – 1,146Debt securities classified as receivables 50 – 50Fixed assets 9 – 9Intangible assets 445 424 21Other assets 250 – 250Accrued staff costs (9) – (9)Taxes payable (9) – (9)Deferred tax liabilities (139) (106) (33)Other liabilities (3,439) – (3,439)
Total 1,219 318 901Non-controlling interests (597)
Net identifiable assets 622Goodwill on acquisition 194
Consideration transferred 816
Cash and cash equivalents acquired 99Cash consideration (816)
Net cash outflow from the acquisition (717)
Operating income and net profit of CCB Life contributed to the Group since the acquisition date did not result in significant impact to the consolidated statement of comprehensive income for the year ended 31 December 2011. Operating income and net profit of the Group for the year ended 31 December 2011 was not significantly impacted either had the acquisition occurred as at the beginning of the year.

176 CHINA CONSTRUCTION BANK CORPORATION ANNUAL REPORT 2011
(Expressed in millions of RMB, unless otherwise stated)
NOTES TO THE FINANCIAL STATEMENTS
57 OPERATING SEGMENTSThe Group has presented the operating segments in a manner consistent with the way in which information is reported internally to the Group’s chief operating decision maker for the purposes of resource allocation and performance assessment. Measurement of segment assets and liabilities and segment income and results is based on the Group’s accounting policies.
Transactions between segments are conducted under normal commercial terms and conditions. Internal charges and transfer prices are determined with reference to market rates and have been reflected in the performance of each segment. Net interest income and expense arising from internal charges and transfer pricing adjustments are referred to as “internal net interest income/expense”. Interest income and expense earned from third parties are referred to as “external net interest income/expense”.
Segment revenues, results, assets and liabilities include items directly attributable to a segment as well as those that can be allocated on a reasonable basis. Segment income, results, assets, and liabilities are determined before intra-group balances and intra-group transactions are eliminated as part of the consolidation process. Segment capital expenditure is the total cost incurred during the period to acquire fixed assets, intangible assets and other long-term assets.
(1) Geographical segments
The Group operates principally in Mainland China with branches covering all provinces, autonomous regions and municipalities directly under the central government, and several subsidiaries located in Mainland China. The Group also has bank branch operations in Hong Kong, Singapore, Frankfurt, Johannesburg, Tokyo, Seoul, New York, Sydney and Ho Chi Minh City and certain subsidiaries operating in Hong Kong and London.
In presenting information on the basis of geographical segments, operating income is allocated based on the location of the branches and subsidiaries that generate the income. Segment assets, liabilities and capital expenditure are allocated based on their geographical location.
Geographical segments of the Group, as defined for management reporting purposes, are defined as follows:
– “Yangtze River Delta” refers to the following areas serviced by the subsidiary and tier-1 branches of the Bank: Shanghai Municipality, Jiangsu Province, Zhejiang Province, City of Ningbo and City of Suzhou;
– “Pearl River Delta” refers to the following areas serviced by the tier-1 branches of the Bank: Guangdong Province, City of Shenzhen, Fujian Province and City of Xiamen;
– “Bohai Rim” refers to the following areas serviced by the subsidiaries and tier-1 branches of the Bank: Beijing Municipality, Shandong Province, Tianjin Municipality, Hebei Province and City of Qingdao;
– the “Central” region refers to the following areas serviced by the subsidiaries and tier-1 branches of the Bank: Shanxi Province, Guangxi Autonomous Region, Hubei Province, Henan Province, Hunan Province, Jiangxi Province, Hainan Province, Anhui Province and the Three Gorges Area;
– the “Western” region refers to the following areas serviced by the tier-1 branches of the Bank: Sichuan Province, Chongqing Municipality, Guizhou Province, Yunnan Province, Tibet Autonomous Region, Inner Mongolia Autonomous Region, Shaanxi Province, Gansu Province, Qinghai Province, Ningxia Autonomous Region and Xinjiang Autonomous Region; and
– the “Northeastern” region refers to the following areas serviced by the tier-1 branches of the Bank: Liaoning Province, Jilin Province, Heilongjiang Province and City of Dalian.

CHINA CONSTRUCTION BANK CORPORATION ANNUAL REPORT 2011
NOTES TO THE FINANCIAL STATEMENTS
(Expressed in millions of RMB, unless otherwise stated)
177
57 OPERATING SEGMENTS (CONTINUED)(1) Geographical segments (continued)
2011
Yangtze River Delta
Pearl River Delta Bohai Rim Central Western Northeastern Head Office Overseas Total
External net interest income 46,645 24,815 27,473 32,486 36,034 11,469 123,007 2,643 304,572
Internal net interest income/(expense) 7,534 12,700 18,169 12,322 10,936 7,055 (69,224) 508 –
Net interest income 54,179 37,515 45,642 44,808 46,970 18,524 53,783 3,151 304,572
Net fee and commission income 21,011 15,556 13,917 13,360 11,845 5,467 4,692 1,146 86,994
Net trading gain/(loss) 507 465 290 257 259 121 957 (2,468) 388
Dividend income 7 – – 48 11 – 43 49 158
Net gain arising from investment securities 64 – 5 434 17 41 1,147 48 1,756
Other operating income, net 1,436 378 209 547 863 122 340 1,640 5,535
Operating income 77,204 53,914 60,063 59,454 59,965 24,275 60,962 3,566 399,403
Operating expenses (27,277) (19,330) (22,096) (24,795) (23,856) (10,622) (13,634) (2,927) (144,537)
Impairment losses (8,811) (5,611) (4,218) (4,780) (4,666) (1,604) (5,727) (366) (35,783)
Share of profits less losses of associates and jointly controlled
entities – – – (7) – – – 31 24
Profit before tax 41,116 28,973 33,749 29,872 31,443 12,049 41,601 304 219,107
Capital expenditure 3,631 2,690 3,224 4,522 4,166 1,932 2,546 93 22,804
Depreciation and amortisation 2,107 1,451 1,847 2,259 1,978 1,020 1,727 108 12,497
Segment assets 2,309,626 1,773,562 2,241,298 1,874,631 1,982,662 769,288 5,140,899 441,119 16,533,085
Interests in associates and jointly controlled entities – – – – – – – 2,069 2,069
2,309,626 1,773,562 2,241,298 1,874,631 1,982,662 769,288 5,140,899 443,188 16,535,154
Deferred tax assets 21,410
Elimination (4,274,730)
Total assets 12,281,834
Segment liabilities 2,304,167 1,769,903 2,232,283 1,869,614 1,976,095 766,375 4,402,281 418,827 15,739,545
Deferred tax liabilities 358
Elimination (4,274,730)
Total liabilities 11,465,173
Off-balance sheet credit commitments 565,867 365,648 406,115 245,292 233,361 103,085 12,002 50,579 1,981,949

178 CHINA CONSTRUCTION BANK CORPORATION ANNUAL REPORT 2011
NOTES TO THE FINANCIAL STATEMENTS
(Expressed in millions of RMB, unless otherwise stated)
57 OPERATING SEGMENTS (CONTINUED)(1) Geographical segments (continued)
2010
Yangtze River Delta
Pearl River Delta Bohai Rim Central Western Northeastern Head Office Overseas Total
External net interest income 36,485 19,546 23,000 25,777 30,198 8,368 104,896 3,230 251,500Internal net interest income/(expense) 8,994 12,488 14,741 11,886 9,638 6,282 (63,899) (130) –
Net interest income 45,479 32,034 37,741 37,663 39,836 14,650 40,997 3,100 251,500Net fee and commission income 16,101 12,173 10,097 9,770 8,799 3,752 4,091 1,349 66,132Net trading gain 313 362 209 59 143 90 1,124 1,209 3,509Dividend income 2 – 25 51 64 – 34 52 228Net gain arising from investment securities 41 8 69 463 102 258 845 117 1,903Other operating income/(loss), net 487 457 494 451 897 174 (1,601) 1,149 2,508
Operating income 62,423 45,034 48,635 48,457 49,841 18,924 45,490 6,976 325,780
Operating expenses (21,601) (16,109) (18,330) (20,617) (20,204) (8,821) (12,864) (2,820) (121,366)Impairment losses (7,596) (4,289) (3,119) (5,547) (5,580) (1,689) (495) (977) (29,292)Share of profits less losses of associates and jointly controlled
entities – – – – – – – 34 34
Profit before tax 33,226 24,636 27,186 22,293 24,057 8,414 32,131 3,213 175,156
Capital expenditure 3,204 1,876 2,563 3,424 3,483 1,962 3,573 74 20,159Depreciation and amortisation 1,966 1,409 1,736 2,098 1,845 915 1,752 106 11,827
Segment assets 2,054,133 1,663,001 1,913,481 1,672,191 1,717,538 694,294 4,781,069 271,052 14,766,759Interests in associates and jointly controlled entities – – – – – – – 1,777 1,777
2,054,133 1,663,001 1,913,481 1,672,191 1,717,538 694,294 4,781,069 272,829 14,768,536
Deferred tax assets 17,825Elimination (3,976,044)
Total assets 10,810,317
Segment liabilities 2,050,953 1,659,607 1,907,041 1,669,392 1,715,699 692,888 4,142,555 247,078 14,085,213
Deferred tax liabilities 243Elimination (3,976,044)
Total liabilities 10,109,412
Off-balance sheet credit commitments 559,761 322,547 430,258 270,124 265,379 126,394 12,002 49,355 2,035,820
(2) Business segments
Business segments, as defined for management reporting purposes, are as follows:
Corporate banking
This segment represents the provision of a range of financial products and services to corporations, government agencies and financial institutions. The products and services include corporate loans, trade financing, deposit taking activities, agency services, financial consulting and advisory services, cash management services, remittance and settlement services, custody services and guarantee services, etc.

CHINA CONSTRUCTION BANK CORPORATION ANNUAL REPORT 2011
NOTES TO THE FINANCIAL STATEMENTS
(Expressed in millions of RMB, unless otherwise stated)
179
57 OPERATING SEGMENTS (CONTINUED)(2) Business segments (continued)
Personal banking
This segment represents the provision of a range of financial products and services to individual customers. The products and services comprise personal loans, deposit taking activities, card business, personal wealth management services, remittance services and securities agency services, etc.
Treasury business
This segment covers the Group’s treasury operations. The treasury enters into inter-bank money market transactions, repurchase and resale transactions, and invests in debt securities. It also trades in derivatives and foreign currency for its own account. The treasury carries out customer-driven derivatives, foreign currency and precious metal trading. Its function also includes the management of the Group’s overall liquidity position, including the issuance of debt securities.
Others
These represent equity investments and the revenues, results, assets and liabilities of overseas branches and subsidiaries.
2011
Corporate banking
Personal banking
Treasury business Others Total
External net interest income 181,180 (3,644) 122,483 4,553 304,572Internal net interest income/(expense) (21,784) 88,562 (63,185) (3,593) –
Net interest income 159,396 84,918 59,298 960 304,572Net fee and commission income 39,170 29,061 16,841 1,922 86,994Net trading gain/(loss) 7 688 2,047 (2,354) 388Dividend income – – – 158 158Net gain arising from investment securities – – 824 932 1,756Other operating income/(loss), net 782 288 (524) 4,989 5,535
Operating income 199,355 114,955 78,486 6,607 399,403
Operating expenses (60,023) (73,361) (4,309) (6,844) (144,537)Impairment losses (28,291) (3,967) (3,118) (407) (35,783)Share of profits less losses of associates and jointly controlled entities – – – 24 24
Profit before tax 111,041 37,627 71,059 (620) 219,107
Capital expenditure 6,783 14,818 826 377 22,804Depreciation and amortisation 3,717 8,120 453 207 12,497
Segment assets 4,643,350 1,662,434 5,411,041 700,464 12,417,289Interests in associates and jointly controlled entities – – – 2,069 2,069
4,643,350 1,662,434 5,411,041 702,533 12,419,358
Deferred tax assets 21,410Elimination (158,934)
Total assets 12,281,834
Segment liabilities 5,911,337 4,981,889 160,905 569,618 11,623,749
Deferred tax liabilities 358Elimination (158,934)
Total liabilities 11,465,173
Off-balance sheet credit commitments 1,689,179 242,191 – 50,579 1,981,949

180 CHINA CONSTRUCTION BANK CORPORATION ANNUAL REPORT 2011
NOTES TO THE FINANCIAL STATEMENTS
(Expressed in millions of RMB, unless otherwise stated)
57 OPERATING SEGMENTS (CONTINUED)(2) Business segments (continued)
2010
Corporate banking
Personal banking
Treasury business Others Total
External net interest income 150,070 (3,659) 101,116 3,973 251,500
Internal net interest income/(expense) (14,511) 74,156 (58,441) (1,204) –
Net interest income 135,559 70,497 42,675 2,769 251,500
Net fee and commission income 28,563 23,919 11,898 1,752 66,132
Net trading (loss)/gain (1) 350 1,940 1,220 3,509
Dividend income – – – 228 228
Net gain arising from investment securities – – 504 1,399 1,903
Other operating income/(loss), net 754 278 (1,591) 3,067 2,508
Operating income 164,875 95,044 55,426 10,435 325,780
Operating expenses (50,151) (62,278) (3,573) (5,364) (121,366)
Impairment losses (23,557) (2,176) (655) (2,904) (29,292)
Share of profits less losses of associates and jointly controlled entities – – – 34 34
Profit before tax 91,167 30,590 51,198 2,201 175,156
Capital expenditure 6,065 13,048 777 269 20,159
Depreciation and amortisation 3,558 7,655 456 158 11,827
Segment assets 4,343,277 1,361,904 4,684,227 487,968 10,877,376
Interests in associates and jointly controlled entities – – – 1,777 1,777
4,343,277 1,361,904 4,684,227 489,745 10,879,153
Deferred tax assets 17,825
Elimination (86,661)
Total assets 10,810,317
Segment liabilities 5,238,032 4,489,333 110,697 357,768 10,195,830
Deferred tax liabilities 243
Elimination (86,661)
Total liabilities 10,109,412
Off-balance sheet credit commitments 1,781,695 205,092 – 49,033 2,035,820
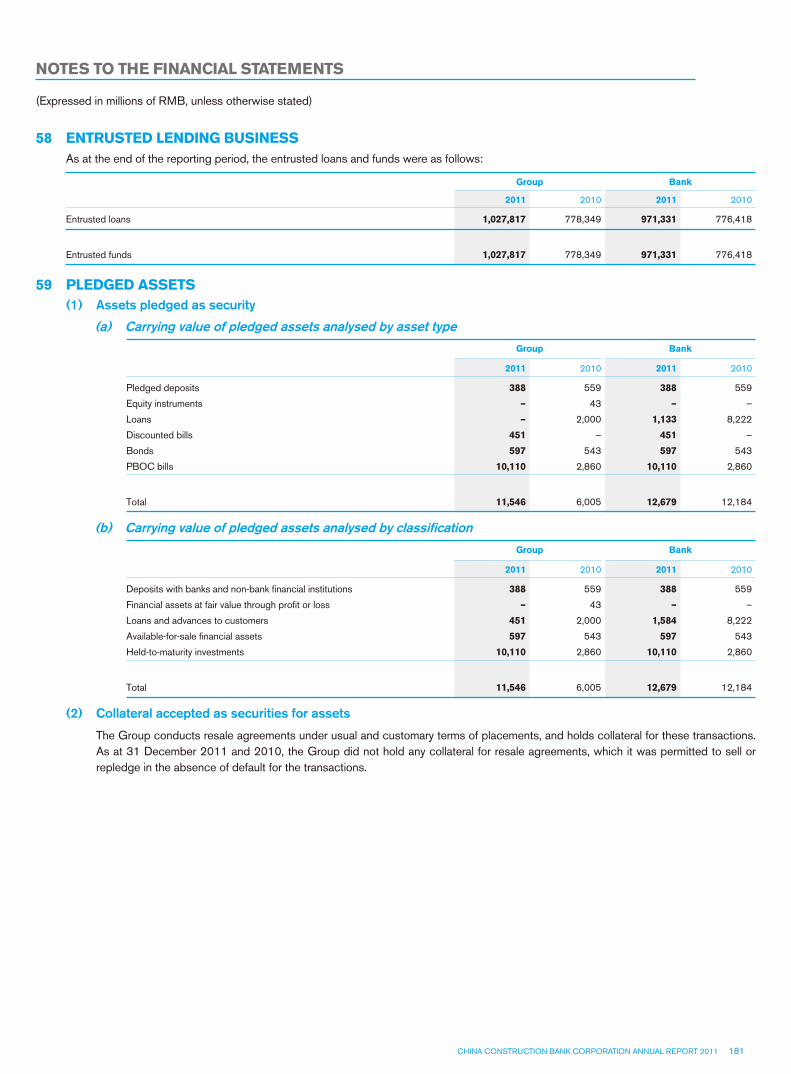
CHINA CONSTRUCTION BANK CORPORATION ANNUAL REPORT 2011
NOTES TO THE FINANCIAL STATEMENTS
(Expressed in millions of RMB, unless otherwise stated)
181
58 ENTRUSTED LENDING BUSINESSAs at the end of the reporting period, the entrusted loans and funds were as follows:
Group Bank
2011 2010 2011 2010
Entrusted loans 1,027,817 778,349 971,331 776,418
Entrusted funds 1,027,817 778,349 971,331 776,418
59 PLEDGED ASSETS(1) Assets pledged as security
(a) Carrying value of pledged assets analysed by asset typeGroup Bank
2011 2010 2011 2010
Pledged deposits 388 559 388 559
Equity instruments – 43 – –
Loans – 2,000 1,133 8,222
Discounted bills 451 – 451 –
Bonds 597 543 597 543
PBOC bills 10,110 2,860 10,110 2,860
Total 11,546 6,005 12,679 12,184
(b) Carrying value of pledged assets analysed by classificationGroup Bank
2011 2010 2011 2010
Deposits with banks and non-bank financial institutions 388 559 388 559
Financial assets at fair value through profit or loss – 43 – –
Loans and advances to customers 451 2,000 1,584 8,222
Available-for-sale financial assets 597 543 597 543
Held-to-maturity investments 10,110 2,860 10,110 2,860
Total 11,546 6,005 12,679 12,184
(2) Collateral accepted as securities for assets
The Group conducts resale agreements under usual and customary terms of placements, and holds collateral for these transactions. As at 31 December 2011 and 2010, the Group did not hold any collateral for resale agreements, which it was permitted to sell or repledge in the absence of default for the transactions.

182 CHINA CONSTRUCTION BANK CORPORATION ANNUAL REPORT 2011
NOTES TO THE FINANCIAL STATEMENTS
(Expressed in millions of RMB, unless otherwise stated)
60 COMMITMENTS AND CONTINGENT LIABILITIES(1) Credit commitments
Credit commitments take the form of undrawn loan facilities which are approved and contracted, unutilised credit card limits, financial guarantees, letters of credit etc. The Group assesses and makes allowance for any probable losses accordingly.
The contractual amounts of loans and credit card commitments represent the cash outflows should the contracts be fully drawn upon. The amounts of guarantees and letters of credit represent the maximum potential loss that would be recognised if counterparties failed completely to perform as contracted. Acceptances comprise undertakings by the Group to pay bills of exchange drawn on customers.
As credit commitments expire without being drawn upon, the total of the contractual amounts set out in the following table do not represent the expected future cash outflows.
Group Bank
2011 2010 2011 2010
Loan commitments
– with an original maturity under one year 129,745 123,092 127,134 120,071
– with an original maturity of one year or over 349,032 461,785 348,992 461,636
Credit card commitments 266,447 227,478 242,191 205,092
745,224 812,355 718,317 786,799
Bank acceptances 335,517 393,671 335,391 393,522
Financing guarantees 189,258 162,824 188,537 162,410
Non-financing guarantees 439,322 446,010 439,231 445,936
Sight letters of credit 42,778 58,135 42,778 58,135
Usance letters of credit 203,810 131,045 204,242 130,710
Others 26,040 31,780 28,288 31,881
Total 1,981,949 2,035,820 1,956,784 2,009,393
(2) Credit risk-weighted amount
The credit risk-weighted amount refers to the amount as computed in accordance with the rules set out by the CBRC and depends on the status of the counterparty and the maturity characteristics. The risk weights used range from 0% to 100% of contingent liabilities and commitments.
Group Bank
2011 2010 2011 2010
Credit risk-weighted amount of contingent liabilities and commitments 929,681 954,706 928,188 953,856

CHINA CONSTRUCTION BANK CORPORATION ANNUAL REPORT 2011
NOTES TO THE FINANCIAL STATEMENTS
(Expressed in millions of RMB, unless otherwise stated)
183
60 COMMITMENTS AND CONTINGENT LIABILITIES (CONTINUED)(3) Operating lease commitments
The Group and the Bank lease certain property and equipment under operating leases, which typically run for an initial period of one to five years and may include an option to renew the lease when all terms are renegotiated. As at the end of the reporting period, the future minimum lease payments under non-cancellable operating leases for property and equipment were as follows:
Group Bank
2011 2010 2011 2010
Within one year 3,363 3,002 3,130 2,742
After one year but within two years 2,640 2,319 2,503 2,243
After two years but within three years 1,836 1,766 1,770 1,727
After three years but within five years 2,130 2,171 2,113 1,968
After five years 1,467 1,388 1,461 1,359
Total 11,436 10,646 10,977 10,039
(4) Capital commitments
As at the end of the reporting period, the Group and the Bank had capital commitments as follows:
Group Bank
2011 2010 2011 2010
Contracted for 4,793 3,815 4,759 3,726
Authorised but not contracted for 5,802 1,619 5,782 1,603
Total 10,595 5,434 10,541 5,329
(5) Underwriting obligations
As at 31 December 2011, there was no unexpired underwriting commitments of the Group and the Bank (2010: RMB51,846 million).
(6) Redemption obligations
As an underwriting agent of PRC government bonds, the Group has the responsibility to buy back those bonds sold by it should the holders decide to early redeem the bonds held. The redemption price for the bonds at any time before their maturity date is based on the coupon value plus any interest unpaid and accrued up to the redemption date. Accrued interest payables to the bond holders are calculated in accordance with relevant rules of the MOF and the PBOC. The redemption price may be different from the fair value of similar instruments traded at the redemption date.
The redemption obligations, which represent the nominal value of government bonds underwritten and sold by the Group and the Bank, but not yet matured as at 31 December 2011, were RMB72,205 million (2010: RMB91,578 million).
(7) Outstanding litigation and disputes
As at 31 December 2011, the Group was the defendant in certain pending litigation and disputes with gross claims of RMB2,173 million (2010: RMB1,976 million). Provisions have been made for the estimated losses arising from such litigations based upon the opinions of the Group’s internal and external legal counsels (Note 47). The Group considers that the provisions made are reasonable and adequate.
(8) Provision against commitments and contingent liabilities
The Group and the Bank assessed and made provisions for any probable outflow of economic benefits in relation to the above commitments and contingent liabilities in accordance with their accounting policies (Note 4 (13)).

184 CHINA CONSTRUCTION BANK CORPORATION ANNUAL REPORT 2011
NOTES TO THE FINANCIAL STATEMENTS
(Expressed in millions of RMB, unless otherwise stated)
61 RELATED PARTY RELATIONSHIPS AND TRANSACTIONS(1) Transactions with parent companies and their affiliates
The parent companies of the Group are CIC and Huijin.
Approved by the State Council, CIC was established on 29 September 2007 with a registered capital of RMB1,550 billion. As a wholly owned subsidiary of CIC, Huijin exercises its rights and obligations as an investor on behalf of PRC government.
Huijin was incorporated on 16 December 2003 as a wholly state-owned investment company with the approval of the State Council. It was registered in Beijing with a registered capital of RMB828,209 million. Its principal activities are equity investments as authorised by the State Council, without engaging in other commercial operations. As at 31 December 2011, Huijin directly held 57.13% shares of the Bank.
The related companies under parent companies include the subsidiaries under parent companies and other associates and jointly controlled entities.
The Group’s transactions with parent companies and their affiliates mainly include deposit taking, entrusted asset management, operating leases, lending, purchase and sale of debt securities, money market transactions and inter-bank clearing. These transactions are priced based on market prices and conducted under general commercial terms.
The Group has issued subordinated debts with a nominal value of RMB120 billion (2010: RMB80 billion). These are bearer bonds and tradable in secondary market. Accordingly, the Group has no information in respect of the amount of the bonds held by the affiliates of parent companies as at the end of the reporting period.
(a) Transactions with parent companies
In the ordinary course of the business, material transactions that the Group and the Bank entered into with parent companies are as follows:
Amounts
2011 2010
Amount
Ratio to similar
transactions Amount
Ratio to similar
transactions
Interest income 578 0.12% 185 0.05%
Interest expense 113 0.06% 68 0.05%
Fee and commission income – – 2 0.00%
Balances outstanding as at the end of the reporting period
2011 2010
Balance
Ratio to similar
transactions Balance
Ratio to similar
transactions
Interest receivable 186 0.33% 185 0.42%
Held-to-maturity investments 16,680 0.96% 16,680 0.89%
Deposits from customers 3,559 0.04% 4,934 0.05%
Interest payable 22 0.03% 1 0.00%
Credit commitments 288 0.01% – –

CHINA CONSTRUCTION BANK CORPORATION ANNUAL REPORT 2011
NOTES TO THE FINANCIAL STATEMENTS
(Expressed in millions of RMB, unless otherwise stated)
185
61 RELATED PARTY RELATIONSHIPS AND TRANSACTIONS (CONTINUED)(1) Transactions with parent companies and their affiliates (continued)
(b) Transactions with the affiliates of parent companies
In the ordinary course of the business, material transactions that the Group and the Bank entered into with the affiliates of parent companies are as follows:
Amounts
2011 2010
Note Amount
Ratio to similar
transactions Amount
Ratio to similar
transactions
Interest income 27,761 5.76% 15,123 4.00%
Interest expense 2,372 1.34% 1,670 1.32%
Fee and commission income 495 0.55% 201 0.29%
Fee and commission expense 56 2.24% 113 5.58%
Other operating income, net – – 10 0.40%
Operating expenses (i) 1,025 0.71% 967 0.80%
Balances outstanding as at the end of the reporting period
2011 2010
Note Balance
Ratio to similar
transactions Balance
Ratio to similar
transactions
Deposits with banks and non-bank financial institutions 41,033 14.83% 9,436 12.05%
Placements with banks and non-bank financial institutions 21,941 20.12% 19,478 30.45%
Financial assets at fair value through profit or loss 2,106 9.12% 1,353 7.80%
Positive fair value of derivatives 529 3.74% 830 7.39%
Financial assets held under resale agreements 10,007 5.00% 1,401 0.77%
Interest receivable 11,358 20.00% 5,875 13.33%
Loans and advances to customers 33,244 0.53% 15,306 0.28%
Available for sale financial assets 134,765 19.96% 85,682 12.30%
Held-to-maturity investments 443,695 25.45% 372,605 19.78%
Debt securities classified as receivables 64,549 21.51% 34,049 11.10%
Other assets (ii) 32 0.18% 157 1.03%
Deposits from banks and non-bank financial institutions (iii) 67,006 6.93% 53,529 7.83%
Placements from banks and non-bank financial institutions 33,744 42.86% 14,018 21.15%
Negative fair value of derivatives 514 3.86% 628 6.71%
Deposits from customers 40,238 0.40% 13,597 0.15%
Interest payable 163 0.20% 69 0.11%
Other liabilities 234 0.66% 150 0.61%
Credit commitments 7,822 0.39% 6,878 0.34%
(i) Operating expenses mainly represent rental expenses paid by the Group for leased assets, including properties and motor vehicles, owned by parent companies and its affiliates, and fees for related services provided by parent companies and its affiliates.
(ii) Other assets mainly represent other receivables from the affiliates of parent companies.
(iii) Deposits from the affiliates of parent companies are unsecured and are repayable under general commercial terms.

186 CHINA CONSTRUCTION BANK CORPORATION ANNUAL REPORT 2011
NOTES TO THE FINANCIAL STATEMENTS
(Expressed in millions of RMB, unless otherwise stated)
61 RELATED PARTY RELATIONSHIPS AND TRANSACTIONS (CONTINUED)(2) Transactions with associates and jointly controlled entities of the Group
Transactions between the Group and its associates and jointly controlled entities are conducted in the normal and ordinary course of the business and under general commercial terms as those transactions conducted between the Group and non-related companies outside the Group. In the ordinary course of the business, material transactions that the Group entered into with associates and jointly controlled entities are as follows:
Amounts
2011 2010
Interest income 6 3
Interest expense 2 –
Balances outstanding as at the end of the reporting period
2011 2010
Loans and advances to customers 497 567
Deposits from customers 824 –
(3) Transactions between the Bank and its subsidiaries
Transactions between the Bank and its subsidiaries are conducted in the normal and ordinary course of the business and under normal commercial terms as those transactions conducted between the Group and non-related companies outside the Group. All the inter-group transactions and inter-group balances are eliminated when preparing the consolidated financial statements as mentioned in Note 4(1)(b).
In the ordinary course of the business, material transactions that the Bank entered into with its subsidiaries are as follows:
Amounts
2011 2010
Interest income 412 128
Interest expense 418 169
Fee and commission income 268 260
Fee and commission expense 32 28
Dividend income 85 65
Net trading gain 22 60
Other operating income, net 5 13
Credit commitment 35 62
Balances outstanding as at the end of the reporting period are presented in Note 38.
As at 31 December 2011, the total maximum guarantee limit of guarantee letters issued by the Bank with its subsidiaries as beneficiary is RMB3,416 million (2010: RMB4,262 million).
For the year ended 31 December 2011, the transactions between subsidiaries of the Group are mainly deposit taking and ordinary receivables and payables. As at 31 December, 2011, the balances of the above transactions were RMB783 million (2010: RMB737 million) and RMB148 million (2010: RMB220 million) respectively.
(4) Transactions with other PRC state-owned entities
State-owned entities refer to those entities directly or indirectly owned by the PRC government through its government authorities, agencies, affiliations and other organisations. Transactions with other state-owned entities include but are not limited to: lending and deposit taking; taking and placing of inter-bank balances; entrusted lending and other custody services; insurance and securities agency, and other intermediary services; sale, purchase, underwriting and redemption of bonds issued by other state-owned entities; purchase, sale and leases of property and other assets; and rendering and receiving of utilities and other services.
These transactions are conducted in the ordinary course of the Group’s banking business on terms similar to those that would have been entered into with non-state-owned entities. The Group’s pricing strategy and approval processes for major products and services, such as loans, deposits and commission income, do not depend on whether the customers are state-owned entities or not. Having due regard to the substance of the relationships, the Group is of the opinion that none of these transactions are material related party transactions that require separate disclosure.

CHINA CONSTRUCTION BANK CORPORATION ANNUAL REPORT 2011
NOTES TO THE FINANCIAL STATEMENTS
(Expressed in millions of RMB, unless otherwise stated)
187
61 RELATED PARTY RELATIONSHIPS AND TRANSACTIONS (CONTINUED)(5) Key management personnel
Key management personnel are those persons having authorities and responsibilities for planning, directing and controlling the activities of the Group, directly or indirectly, including directors, supervisors and senior executives.
The compensation of directors and supervisors is disclosed in Note 14. The senior executives’ annual compensation before individual income tax during the year is as follows:
2011
Remuneration paid
Contributions to defined
contribution retirement
schemes
Other benefits in kind
(note (i)) TotalRMB’000 RMB’000 RMB’000 RMB’000
Executive vice president
Zhu Hongbo – – – –
Hu Zheyi (Note (ii)) 589 30 257 876
Pang Xiusheng (Note (ii)) 589 30 253 872
Zhao Huan (Note (ii)) 589 30 248 867
Member of senior management
Zhang Gengsheng (Note (ii)) 571 30 242 843
Chief Financial Officer
Zeng Jianhua (Note (ii)) 414 23 162 599
Chief Risk Officer
Huang Zhiling (Note (ii)) 455 25 180 660
Chief Audit Officer
Yu Jingbo (Note (ii)) 414 23 161 598
Secretary to the board of directors
Chen Caihong (Note (ii)) 538 30 219 787
Controller of wholesale banking
Xu Huibin (Note (ii)) 414 23 162 599
Controller of retail banking
Tian Huiyu (Note (ii)) 414 23 153 590
Controller of investment and wealth management banking
Wang Guiya (Note (ii)) 414 23 161 598
Former controller of wholesale banking
Gu Jingpu (Note (ii)) 125 7 54 186
Former controller of retail banking
Du Yajun – – – –
Former controller of investment and wealth management banking
Mao Yumin 975 2 6 983
6,501 299 2,258 9,058

188 CHINA CONSTRUCTION BANK CORPORATION ANNUAL REPORT 2011
NOTES TO THE FINANCIAL STATEMENTS
(Expressed in millions of RMB, unless otherwise stated)
61 RELATED PARTY RELATIONSHIPS AND TRANSACTIONS (CONTINUED)(5) Key management personnel (continued)
2011
Salaries and allowance
Variable compensation
Contributions to defined
contribution retirement
schemes
Other benefits in kind
(Note (i)) TotalRMB’000 RMB’000 RMB’000 RMB’000 RMB’000
Company SecretaryChan Mei Sheung 2,297 1,823 184 13 4,317
Qualified accountantYuen Yiu Leung 2,085 564 152 22 2,823
4,382 2,387 336 35 7,140
2010
Basic annual salaries
Annual performance
bonus Allowance Welfare
Total (before tax)
(Note (iii))
Including: deferral payment
The actual payment in 2010
(before tax)RMB’000 RMB’000 RMB’000 RMB’000 RMB’000 RMB’000 RMB’000
Executive vice presidentHu Zheyi 363 1,002 – 275 1,640 501 1,139
Executive vice presidentPang Xiusheng 363 1,003 – 270 1,636 501 1,135
Executive vice presidentZhao Huan – – – – – – –
Member of senior managementZhang Gengsheng – – – – – – –
Chief Financial OfficerZeng Jianhua – – – – – – –
Chief Risk OfficerHuang Zhiling – – – – – – –
Chief Audit OfficerYu Jingbo – – – – – – –
Secretary to the board of directorsChen Caihong 333 919 – 240 1,492 459 1,033
Controller of wholesale bankingGu Jingpu 333 919 – 240 1,492 459 1,033
Controller of retail bankingDu Yajun 333 919 – 240 1,492 459 1,033
Controller of investment and wealth management bankingMao Yumin 4,330 400 – 31 4,761 – 4,761
Former vice presidentFan Yifei 152 417 – 112 681 209 472
Former chief audit officerYu Yongshun 333 919 – 240 1,492 459 1,033
6,540 6,498 – 1,648 14,686 3,047 11,639

CHINA CONSTRUCTION BANK CORPORATION ANNUAL REPORT 2011
NOTES TO THE FINANCIAL STATEMENTS
(Expressed in millions of RMB, unless otherwise stated)
189
61 RELATED PARTY RELATIONSHIPS AND TRANSACTIONS (CONTINUED)(5) Key management personnel (continued)
2010
Salaries and allowance
Variable compensation
Contributions to defined
contribution retirement schemes
Other benefits in kind
(Note (i)) Total
RMB’000 RMB’000 RMB’000 RMB’000 RMB’000
Company Secretary
Chan Mei Sheung 2,289 2,348 183 16 4,836
Qualified accountant
Yuen Yiu Leung 2,116 1,185 148 19 3,468
4,405 3,533 331 35 8,304
Notes:
(i) Other benefits in kind included the Bank’s contributions to medical fund, housing fund and other social insurances, which are payable to labour and security authorities based on the lower of certain percentage of the salaries and allowance or the prescribed upper limits as required by the relevant regulations issued by the government authorities. Other benefits also included the Bank’s contribution to its own corporate annuity plan (which was set up in accordance with the relevant policies issued by the government authorities) and supplementary medical insurance.
(ii) The total compensation package for these key management personnel for the year ended 31 December 2011 has not yet been finalised in accordance with regulations of the PRC relevant authorities. The amount of the compensation to be adjusted for is not expected to have significant impact on the Group’s and the Bank’s financial statements for the year ended 31 December 2011. The final compensation will be disclosed in a separate announcement when determined.
(iii) The total compensation package for certain key management personnel for the year ended 31 December 2010 had not been finalised in accordance with regulations of the PRC relevant authorities till the date that the 2010 financial statements were announced. The aforesaid total compensation package for the key management personnel for the year ended 31 December 2010 was the final amount and the Bank made the relevant supplementary announcement on 18 May 2011.
(6) Loans and advances to directors, supervisors and senior executives
The Group had no material balance of loans and advances to directors, supervisors and senior executives as at the end of reporting period. Those loans and advances to directors, supervisors and senior executives were conducted in the normal and ordinary course of the business and under normal commercial terms or on the same terms and conditions with those which are available to other employees, based on terms and conditions granted to third parties adjusted for risk reduction.
(7) Defined contribution retirement schemes
The Group participates in various defined contribution retirement schemes organized by municipal and provincial governments for its employees in Mainland China. For its overseas employees, the Group participates in various defined contribution retirement schemes at funding rates determined in accordance with the local practices and regulations. The details of the Group’s defined contribution retirement schemes are described in Note 4 (12)(a).
62 RISK MANAGEMENTThe Group has exposure to the following risks from its use of financial instruments:
– credit risk– market risk– liquidity risk– operational risk
This note presents information about the Group’s exposure to each of the above risks, the Group’s objectives, policies and processes for measuring and managing risk, and the Group’s capital management.
Risk management framework
The Board of Directors has overall responsibility for the establishment and oversight of the Group’s risk management framework. The Board has established the Risk Management Committee, which is responsible for developing and monitoring the Group’s risk strategy and risk management policies and evaluating the Group’s overall risk exposures regularly.
To identify, evaluate, monitor and manage risk, the Group has designed a comprehensive governance framework, internal control policies and procedures. The Chief Risk Officer, who reports directly to the President, is responsible for the Group’s overall risk management. Risk management policies and systems are reviewed regularly to reflect changes in market conditions, products and services offered. The Group, through its training and management standards and procedures management, aims to develop a disciplined and constructive control environment, in which all employees understand their roles and obligations.

190 CHINA CONSTRUCTION BANK CORPORATION ANNUAL REPORT 2011
NOTES TO THE FINANCIAL STATEMENTS
(Expressed in millions of RMB, unless otherwise stated)
62 RISK MANAGEMENT (CONTINUED)Risk management framework (continued)
The Group Audit Committee is responsible for monitoring and evaluating internal controls, and monitoring the compliance of core business sectors and their management procedures. The Group Audit Committee is assisted in these functions by Audit Department. Audit Department undertakes both regular and ad-hoc reviews of risk management controls and procedures, the findings of which are reported to the Group Audit Committee.
(1) Credit risk
Credit risk management
Credit risk represents the financial loss that arises from the failure of a debtor or counterparty to discharge its contractual obligations or commitments to the Group.
Credit business
The Risk Management Department, under the supervision of the Chief Risk Officer, is responsible for establishing credit risk management policies and performing credit risk measurement and analysis. The Credit Management Department is responsible for monitoring the implementation of credit risk management policies and coordinating credit approval and credit ratings activities. The Credit Management Department works together with the Corporate Banking Department, the SME Business Department, the Institutional Banking Department, the International Business Department, the Group Clients Department, the Housing Finance & Personal Lending Department, the Credit Card Center, the Special Assets Resolution Department and the Legal and Compliance Department to implement credit risk management policies and procedures.
With respect to the credit risk management of corporate and institutional business, the Group has sped up the adjustment of its credit portfolio structure, enhanced post-lending monitoring, and refined the industry-specific guideline and policy baseline for credit approval. Management also fine-tuned the credit acceptance and exit policies, and optimised its economic capital and credit risk limit management. All these policies have implemented to improve the overall asset quality. The Group manages credit risk throughout the entire credit process including pre-lending evaluations, credit approval and post-lending monitoring. The Group performs pre-lending evaluations by assessing the entity’s credit ratings based on internal rating criteria and assessing the risk and rewards with respect to the proposed project. Credit approvals are granted by designated Credit Approval Officers. The Group continually monitors loans, particularly those related to targeted industries, geographical segments, products and clients. Any adverse events that may significantly affect a borrower’s repayment ability are reported timely and measures are implemented to prevent and control risks. The centralized risk management was also expedited in the cities where the first-tier branches are located, and the Bank will continue to explore the ways of specifying the operating characteristic for those branches, in addition to develop an intensive management for risk, reallocation of resource, and improving the quality and efficiency.
With respect to the personal credit business, the Group relies on credit assessment of applicants as the basis for loan approval. Customer relationship managers are required to assess the income level, credit history, and repayment ability of the applicant. The customer relationship managers then forward the application and recommendations to the loan-approval departments for consent. The Group monitors borrowers’ repayment ability, the status of collateral and any changes to collateral value. Once a loan becomes overdue, the Group starts the recovery process according to standard personal loan recovery procedures.
To mitigate risks, the Group requests the customers to provide collateral and guarantees where appropriate. A fine management system and operating workflow for collateral was developed, and there is a guideline to specify the suitability of accepting specific types of collateral, as well as determining evaluation parameters. Collateral values, structures and legal covenants are regularly reviewed to ensure that they still serve their intended purposes and conform to market practices.

CHINA CONSTRUCTION BANK CORPORATION ANNUAL REPORT 2011
NOTES TO THE FINANCIAL STATEMENTS
(Expressed in millions of RMB, unless otherwise stated)
191
62 RISK MANAGEMENT (CONTINUED)(1) Credit risk (continued)
Credit grading classification
The Group adopts a loan risk classification approach to manage the loan portfolio risk. Loans are generally classified as normal, special mention, substandard, doubtful and loss according to their level of risk. Substandard, doubtful and loss loans are considered as impaired loans and advances when one or more events demonstrate there is objective evidence of a loss event which triggers impairment. The allowance for impairment loss on impaired loans and advances is collectively or individually assessed as appropriate.
The core definitions of the five categories of loans and advances are set out below:
Normal: Borrowers can honour the terms of their loans. There is no reason to doubt their ability to repay principal and interest in full on a timely basis.
Special mention: Borrowers are able to service their loans currently, although repayment may be adversely affected by specific factors.
Substandard: Borrowers’ abilities to service their loans are in question and they cannot rely entirely on normal business revenues to repay principal and interest. Losses may ensue even when collateral or guarantees are invoked.
Doubtful: Borrowers cannot repay principal and interest in full and significant losses will need to be recognised even when collateral or guarantees are invoked.
Loss: Principal and interest of loans cannot be recovered or only a small portion of them can be recovered after taking all possible measures or resorting to all necessary legal procedures.
The Group has also applied the same grading criteria and management approach in classifying the off-balance sheet credit-related operations.
Treasury business
For risk management purposes, credit risk arising on debt securities and exposures relating to the Group’s derivatives portfolio is managed independently and information thereon is disclosed in notes (1)(h) and (1)(i) below. The Group sets credit limits for treasury activities and monitors them regularly with reference to the fair values of the relevant financial instruments.

192 CHINA CONSTRUCTION BANK CORPORATION ANNUAL REPORT 2011
NOTES TO THE FINANCIAL STATEMENTS
(Expressed in millions of RMB, unless otherwise stated)
62 RISK MANAGEMENT (CONTINUED)(1) Credit risk (continued)
(a) Maximum credit risk exposure
The following table presents the maximum exposure to credit risk as at the end of the reporting period without taking into consideration any collateral held or other credit enhancement. In respect of the financial assets recognised in the statement of financial position, the maximum exposure to credit risk is represented by the carrying amount after deducting for any impairment allowance.
Group Bank
2011 2010 2011 2010
Deposits with central banks 2,321,501 1,799,828 2,315,432 1,793,907
Deposits with banks and non-bank financial institutions 276,752 78,318 279,861 78,198
Placements with banks and non-bank financial institutions 109,040 63,962 110,533 68,528
Financial assets at fair value through profit or loss 14,375 7,860 8,715 3,044
Positive fair value of derivatives 14,127 11,224 13,073 10,153
Financial assets held under resale agreements 200,045 181,075 200,045 181,075
Interest receivable 56,776 44,088 56,420 43,861
Loans and advances to customers 6,325,194 5,526,026 6,189,363 5,428,279
Available-for-sale debt securities 661,036 676,840 651,585 675,277
Held-to-maturity investments 1,743,569 1,884,057 1,742,342 1,883,927
Debt securities classified as receivables 300,027 306,748 299,765 306,748
Other financial assets 13,695 10,994 29,676 27,835
Total 12,036,137 10,591,020 11,896,810 10,500,832
Off-balance sheet credit commitments 1,981,949 2,035,820 1,956,784 2,009,393
Maximum credit risk exposure 14,018,086 12,626,840 13,853,594 12,510,225

CHINA CONSTRUCTION BANK CORPORATION ANNUAL REPORT 2011
NOTES TO THE FINANCIAL STATEMENTS
(Expressed in millions of RMB, unless otherwise stated)
193
62 RISK MANAGEMENT (CONTINUED)(1) Credit risk (continued)
(b) Distribution of loans and advances to customers in terms of credit quality is analysed as follows:Group Bank
Note 2011 2010 2011 2010
Individually assessed and impaired gross amount 65,625 58,658 65,490 58,584
Allowances for impairment losses (38,109) (37,352) (38,020) (37,278)
Subtotal 27,516 21,306 27,470 21,306
Collectively assessed and impaired gross amount 5,290 6,054 5,178 5,920
Allowances for impairment losses (3,276) (3,657) (3,265) (3,648)
Subtotal 2,014 2,397 1,913 2,272
Overdue but not impaired
– not more than 90 days 14,567 15,971 14,209 15,707
Allowances for impairment losses (i) (696) (916) (696) (912)
Subtotal 13,871 15,055 13,513 14,795
Neither overdue nor impaired
– Unsecured loans 1,739,648 1,513,872 1,703,090 1,492,970
– Guaranteed loans 1,308,879 1,161,167 1,265,752 1,130,549
– Loans secured by tangible assets other than monetary assets 2,737,839 2,364,592 2,688,465 2,322,350
– Loans secured by monetary assets 624,563 548,814 617,362 544,460
Gross amount 6,410,929 5,588,445 6,274,669 5,490,329
Allowances for impairment losses (i) (129,136) (101,177) (128,202) (100,423)
Subtotal 6,281,793 5,487,268 6,146,467 5,389,906
Total 6,325,194 5,526,026 6,189,363 5,428,279
(i) The balances represent collectively assessed allowances of impairment losses.

194 CHINA CONSTRUCTION BANK CORPORATION ANNUAL REPORT 2011
NOTES TO THE FINANCIAL STATEMENTS
(Expressed in millions of RMB, unless otherwise stated)
62 RISK MANAGEMENT (CONTINUED))(1) Credit risk (continued)
(b) Distribution of loans and advances to customers in terms of credit quality is analysed as follows (continued):Group
Within overdue but not impaired loans and advances and impaired loans and advances which are subject to individual assessment, the portion covered or not covered by collateral held are shown as follows:
2011
Overdue but not impaired loans and advances
Impaired loans and advances
which are subject to individual
assessment
Corporate Personal Corporate
Portion covered 170 11,935 17,607
Portion not covered 123 2,339 48,018
Total 293 14,274 65,625
2010
Overdue but not impaired loans and advances
Impaired loans and advances
which are subject to individual
assessment
Corporate Personal Corporate
Portion covered 462 13,055 14,948
Portion not covered 2,002 452 43,710
Total 2,464 13,507 58,658

CHINA CONSTRUCTION BANK CORPORATION ANNUAL REPORT 2011
NOTES TO THE FINANCIAL STATEMENTS
(Expressed in millions of RMB, unless otherwise stated)
195
61 RISK MANAGEMENT (CONTINUED)(1) Credit risk (continued)
(b) Distribution of loans and advances to customers in terms of credit quality is analyzed as follows (continued):Bank
Within overdue but not impaired loans and advances and impaired loans and advances which are subject to individual assessment, the portion covered or not covered by collateral held are shown as follows:
2011
Overdue but not impaired loans and advances
Impaired loans and advances
which are subject to individual
assessment
Corporate Personal Corporate
Portion covered 45 11,766 17,605
Portion not covered 122 2,276 47,885
Total 167 14,042 65,490
2010
Overdue but not impaired loans and advances
Impaired loans and advances
which are subject to individual
assessment
Corporate Personal Corporate
Portion covered 387 12,925 14,946
Portion not covered 1,998 397 43,638
Total 2,385 13,322 58,584
The above collateral includes land use rights, buildings and equipment, etc. The fair value of collateral was estimated by the Group with reference to the latest available external valuations adjusted after taking into account the current realisation experience as well as the market situation.

196 CHINA CONSTRUCTION BANK CORPORATION ANNUAL REPORT 2011
NOTES TO THE FINANCIAL STATEMENTS
(Expressed in millions of RMB, unless otherwise stated)
62 RISK MANAGEMENT (CONTINUED))(1) Credit risk (continued)
(c) Loans and advances to customers analysed by economic sector concentrationsGroup
2011 2010
Gross loan
balance Percentage
Balance secured by
collateral
Gross loan
balance Percentage
Balance secured by
collateral
Corporate loans and advances
– Manufacturing 1,141,376 17.56% 393,347 1,010,527 17.83% 357,152
– Transportation, storage and postal services 765,763 11.79% 303,444 660,308 11.65% 267,123
– Production and supply of electric power, gas and water 591,315 9.10% 145,490 528,279 9.32% 129,473
– Real estate 465,899 7.17% 387,527 435,234 7.68% 354,485
– Leasing and commercial services 386,588 5.95% 168,593 361,713 6.38% 146,145
– Wholesale and retail trade 322,106 4.96% 113,374 243,738 4.30% 91,752
– Water, environment and public utility management 226,655 3.49% 100,239 216,328 3.82% 95,955
– Construction 190,096 2.93% 66,963 150,736 2.66% 53,883
– Mining 173,824 2.68% 26,793 148,261 2.62% 23,731
– Education 85,069 1.31% 35,214 100,193 1.77% 38,738
– Telecommunications, computer services and software 24,077 0.37% 7,271 28,498 0.50% 7,085
– Others 300,148 4.62% 111,642 251,180 4.40% 107,221
Total corporate loans and advances 4,672,916 71.93% 1,859,897 4,134,995 72.93% 1,672,743
Personal loans and advances 1,705,622 26.25% 1,558,628 1,390,957 24.54% 1,295,659
Discounted bills 117,873 1.82% – 143,176 2.53% –
Total loans and advances to customers 6,496,411 100.00% 3,418,525 5,669,128 100.00% 2,968,402
Details of impaired loans, impairment allowances, charges, and amounts written off in respect of economic sectors which constitute 10% or more of total gross loans and advances to customers are as follows:
2011
Gross impaired
loans
Individually assessed
impairment allowances
Collectively assessed
impairment allowances
Charged to profit or loss
during the yearWritten off
during the year
Manufacturing 25,883 (15,167) (25,254) 5,750 1,748
Transportation, storage and postal services 7,139 (3,636) (18,106) 6,371 28
2010
Gross impaired
loans
Individually assessed
impairment allowances
Collectively assessed
impairment allowances
Charged to profit or loss
during the yearWritten off
during the year
Manufacturing 22,538 (14,627) (22,345) 10,316 3,637
Transportation, storage and postal services 6,646 (3,194) (12,541) 1,839 82

CHINA CONSTRUCTION BANK CORPORATION ANNUAL REPORT 2011
NOTES TO THE FINANCIAL STATEMENTS
(Expressed in millions of RMB, unless otherwise stated)
197
62 RISK MANAGEMENT (CONTINUED)(1) Credit risk (continued)
(c) Loans and advances to customers analysed by economic sector concentrations (continued)Bank
2011 2010
Gross loan
balance Percentage
Balance secured by
collateral
Gross loan
balance Percentage
Balance secured by
collateral
Corporate loans and advances
– Manufacturing 1,121,439 17.61% 391,393 994,814 17.86% 355,803
– Transportation, storage and postal services 752,130 11.83% 298,202 653,718 11.74% 264,290
– Production and supply of electric power, gas and water 581,301 9.14% 144,399 522,734 9.38% 128,549
– Real estate 439,905 6.92% 365,509 413,977 7.43% 337,168
– Leasing and commercial services 385,789 6.07% 168,317 361,451 6.49% 145,918
– Wholesale and retail trade 306,287 4.82% 110,193 230,543 4.14% 88,661
– Water, environment and public utility management 226,560 3.56% 100,202 216,163 3.88% 95,924
– Construction 188,765 2.97% 66,764 149,348 2.68% 53,632
– Mining 169,852 2.67% 26,793 145,810 2.62% 23,731
– Education 84,983 1.34% 35,161 100,045 1.80% 38,620
– Telecommunications, computer services and software 23,510 0.37% 7,146 27,572 0.49% 6,900
– Others 283,334 4.46% 109,506 245,523 4.40% 105,837
Total corporate loans and advances 4,563,855 71.76% 1,823,585 4,061,698 72.91% 1,645,033
Personal loans and advances 1,677,910 26.38% 1,538,107 1,365,684 24.52% 1,276,534
Discounted bills 117,781 1.86% – 143,158 2.57% –
Total loans and advances to customers 6,359,546 100.00% 3,361,692 5,570,540 100.00% 2,921,567
Details of impaired loans, impairment allowances, charges, and amounts written off in respect of economic sectors which constitute 10% or more of total gross loans and advances to customers are as follows:
2011
Gross impaired
loans
Individually assessed
impairment allowances
Collectively assessed
impairment allowances
Charged to profit or loss
during the yearWritten off
during the year
Manufacturing 25,815 (15,099) (25,071) 5,680 1,748
Transportation, storage and postal services 7,073 (3,616) (17,987) 6,294 28
2010
Gross impaired
loans
Individually assessed
impairment allowances
Collectively assessed
impairment allowances
Charged to profit or loss
during the yearWritten off
during the year
Manufacturing 22,465 (14,554) (22,181) 10,210 3,637
Transportation, storage and postal services 6,646 (3,194) (12,479) 1,791 82

198 CHINA CONSTRUCTION BANK CORPORATION ANNUAL REPORT 2011
NOTES TO THE FINANCIAL STATEMENTS
(Expressed in millions of RMB, unless otherwise stated)
62 RISK MANAGEMENT (CONTINUED)(1) Credit risk (continued)
(d) Loans and advances to customers analysed by geographical sector concentrationsGroup
2011 2010
Gross loan
balance Percentage
Balance secured by
collateral
Gross loan
balance Percentage
Balance secured by
collateral
Yangtze River Delta 1,476,118 22.72% 882,276 1,321,708 23.31% 765,533
Bohai Rim 1,137,623 17.51% 497,565 1,008,340 17.79% 456,068
Western 1,108,112 17.06% 622,268 963,636 17.00% 532,143
Central 1,051,837 16.19% 567,187 922,185 16.27% 477,127
Pearl River Delta 955,937 14.71% 597,404 858,420 15.14% 515,678
Northeastern 406,035 6.25% 197,775 350,584 6.18% 163,249
Head office 105,632 1.63% 486 63,638 1.12% 494
Overseas 255,117 3.93% 53,564 180,617 3.19% 58,110
Gross loans and advances to customers 6,496,411 100.00% 3,418,525 5,669,128 100.00% 2,968,402
Details of impaired loans and impairment allowances in respect of geographical sectors which constitute 10% or more of total gross loans and advances to customers are as follows:
2011
Gross impaired
loans
Individually assessed
impairment allowances
Collectively assessed
impairment allowances
Yangtze River Delta 19,264 (9,721) (29,988)
Central 11,885 (6,296) (21,313)
Western 10,653 (5,878) (23,568)
Pearl River Delta 9,699 (5,458) (21,106)
Bohai Rim 9,428 (5,850) (23,412)
2010
Gross impaired
loans
Individually assessed
impairment allowances
Collectively assessed
impairment allowances
Yangtze River Delta 13,830 (8,106) (24,260)
Central 12,222 (6,290) (17,403)
Western 10,340 (6,138) (19,073)
Bohai Rim 9,400 (6,618) (18,816)
Pearl River Delta 8,491 (5,133) (16,507)
The definitions of geographical segments are set out in Note 57(1).

CHINA CONSTRUCTION BANK CORPORATION ANNUAL REPORT 2011
NOTES TO THE FINANCIAL STATEMENTS
(Expressed in millions of RMB, unless otherwise stated)
199
62 RISK MANAGEMENT (CONTINUED)(1) Credit risk (continued)
(d) Loans and advances to customers analysed by geographical sector concentrations (continued)Bank
2011 2010
Gross loan
balance Percentage
Balance secured by
collateral
Gross loan
balance Percentage
Balance secured by
collateral
Yangtze River Delta 1,472,744 23.17% 881,074 1,320,810 23.71% 765,222
Western 1,108,061 17.42% 622,253 963,592 17.30% 532,117
Bohai Rim 1,090,356 17.15% 483,614 978,095 17.56% 448,493
Central 1,050,747 16.52% 567,015 920,626 16.53% 476,579
Pearl River Delta 955,937 15.03% 597,404 858,420 15.41% 515,678
Northeastern 406,035 6.38% 197,775 350,584 6.29% 163,249
Head office 105,632 1.66% 486 63,638 1.14% 494
Overseas 170,034 2.67% 12,071 114,775 2.06% 19,735
Gross loans and advances to customers 6,359,546 100.00% 3,361,692 5,570,540 100.00% 2,921,567
Details of impaired loans and impairment allowances in respect of geographical sectors which constitute 10% or more of total gross loans and advances to customers are as follows:
2011
Gross impaired
loans
Individually assessed
impairment allowances
Collectively assessed
impairment allowances
Yangtze River Delta 19,264 (9,721) (29,914)
Central 11,885 (6,296) (21,289)
Western 10,653 (5,878) (23,567)
Pearl River Delta 9,699 (5,458) (21,106)
Bohai Rim 9,361 (5,829) (22,924)
2010
Gross impaired
loans
Individually assessed
impairment allowances
Collectively assessed
impairment allowances
Yangtze River Delta 13,830 (8,106) (24,251)
Central 12,222 (6,290) (17,387)
Western 10,340 (6,138) (19,073)
Bohai Rim 9,400 (6,618) (18,461)
Pearl River Delta 8,491 (5,133) (16,507)
The definitions of geographical segments are set out in Note 57(1).

200 CHINA CONSTRUCTION BANK CORPORATION ANNUAL REPORT 2011
NOTES TO THE FINANCIAL STATEMENTS
(Expressed in millions of RMB, unless otherwise stated)
62 RISK MANAGEMENT (CONTINUED)(1) Credit risk (continued)
(e) Loans and advances to customers analysed by types of collateralGroup Bank
2011 2010 2011 2010
Unsecured loans 1,655,537 1,520,613 1,618,823 1,499,484
Guaranteed loans 1,422,349 1,180,113 1,379,031 1,149,489
Loans secured by tangible assets other than monetary assets 2,787,776 2,412,285 2,738,008 2,369,804
Loans secured by monetary assets 630,749 556,117 623,684 551,763
Gross loans and advances to customers 6,496,411 5,669,128 6,359,546 5,570,540
(f) Rescheduled loans and advances to customersGroup
2011 2010
Total
% of gross loans and
advances to customers Total
% of gross loans and
advances to customers
Rescheduled loans and advances to customers 2,692 0.04% 2,070 0.04%
Less:
Rescheduled loans and advances overdue for more than 90 days 977 0.01% 668 0.01%
Rescheduled loans and advances overdue for not more than 90 days 1,715 0.03% 1,402 0.03%
Bank
2011 2010
Total
% of gross loans and
advances to customers Total
% of gross loans and
advances to customers
Rescheduled loans and advances to customers 2,575 0.04% 1,926 0.03%
Less:
Rescheduled loans and advances overdue for more than 90 days 975 0.01% 666 0.01%
Rescheduled loans and advances overdue for not more than 90 days 1,600 0.03% 1,260 0.02%

CHINA CONSTRUCTION BANK CORPORATION ANNUAL REPORT 2011
NOTES TO THE FINANCIAL STATEMENTS
(Expressed in millions of RMB, unless otherwise stated)
201
62 RISK MANAGEMENT (CONTINUED)(1) Credit risk (continued)
(g) Distribution of amounts due from banks and non-bank financial institutions in terms of credit quality is as follows:
Amount due from banks and non-bank financial institutions includes deposits and placements with banks and non-bank financial institutions, and financial assets held under resale agreements of which counterparties are banks and non-bank financial institutions.
Group Bank
2011 2010 2011 2010
Individually assessed and impaired gross amount 102 105 102 105
Allowances for impairment losses (74) (95) (74) (95)
Subtotal 28 10 28 10
Neither overdue nor impaired
– grade A to AAA 490,618 186,796 493,745 186,957
– grade B to BBB 92 90 92 90
– unrated 95,099 136,459 96,574 140,744
Subtotal 585,809 323,345 590,411 327,791
Total 585,837 323,355 590,439 327,801
Amounts neither overdue nor impaired are analysed above according to the Group and the Bank’s internal credit rating. Unrated amounts due from banks and non-bank financial institutions include amounts due from a number of banks and non-bank financial institutions for which the Group and the Bank have not assigned an internal credit rating.

202 CHINA CONSTRUCTION BANK CORPORATION ANNUAL REPORT 2011
NOTES TO THE FINANCIAL STATEMENTS
(Expressed in millions of RMB, unless otherwise stated)
62 RISK MANAGEMENT (CONTINUED)(1) Credit risk (continued)
(h) Distribution of debt securities investments analysed by rating
The Group adopts a credit rating approach to manage the credit risk of the debt securities portfolio held by its operations in Mainland China. The ratings are obtained from Bloomberg Composite, or major rating agencies where the issuers of the securities are located. The carrying amounts of debt securities investments analysed by the rating agency designations as at the end of the reporting period are as follows:
Group
2011
Unrated AAA AA A Lower than A Total
Individually assessed and impaired gross amount
– Policy banks – – – 45 – 45
– Banks and non-bank financial institutions 753 11 199 5,615 9,142 15,720
– Public sector entities 125 – – – – 125
– Other enterprises 312 2,818 – – 311 3,441
1,190 2,829 199 5,660 9,453 19,331
Impairment (8,674)
Subtotal 10,657
Neither overdue nor impaired
– Government 891,088 2,642 7,029 473 83 901,315
– Central banks 429,101 4,574 2,187 – 185 436,047
– Policy banks 285,340 – 264 140 – 285,744
– Banks and non-bank financial institutions 644,925 33,578 14,415 8,018 3,765 704,701
– Cinda 131,761 – – – – 131,761
– Public sector entities – 63 87 – 65 215
– Other enterprises 5,157 234,469 5,418 3,250 1,593 249,887
2,387,372 275,326 29,400 11,881 5,691 2,709,670
Impairment (1,320)
Subtotal 2,708,350
Total 2,719,007

CHINA CONSTRUCTION BANK CORPORATION ANNUAL REPORT 2011
NOTES TO THE FINANCIAL STATEMENTS
(Expressed in millions of RMB, unless otherwise stated)
203
62 RISK MANAGEMENT (CONTINUED)(1) Credit risk (continued)
(h) Distribution of debt securities investments analysed by rating (continued)Group (continued)
2010
Unrated AAA AA A Lower than A Total
Individually assessed and impaired gross amount
– Policy banks – – – 45 – 45
– Banks and non-bank financial institutions 2,077 34 258 8,227 9,004 19,600
– Public sector entities – – – – 1,128 1,128
– Other enterprises 315 – – 49 296 660
2,392 34 258 8,321 10,428 21,433
Impairment (10,970)
Subtotal 10,463
Neither overdue nor impaired
– Government 729,814 9,401 – 72,242 92 811,549
– Central banks 940,292 12,978 – 740 509 954,519
– Policy banks 183,087 – 11 654 162 183,914
– Banks and non-bank financial institutions 479,941 26,973 13,502 12,100 1,551 534,067
– Cinda 206,261 – – – – 206,261
– Public sector entities – 671 91 – 71 833
– Other enterprises 3,804 163,041 4,535 1,484 1,547 174,411
2,543,199 213,064 18,139 87,220 3,932 2,865,554
Impairment (512)
Subtotal 2,865,042
Total 2,875,505

204 CHINA CONSTRUCTION BANK CORPORATION ANNUAL REPORT 2011
NOTES TO THE FINANCIAL STATEMENTS
(Expressed in millions of RMB, unless otherwise stated)
62 RISK MANAGEMENT (CONTINUED)(1) Credit risk (continued)
(h) Distribution of debt securities investments analysed by rating (continued)Bank
2011
Unrated AAA AA A Lower than A Total
Individually assessed and impaired gross amount
– Policy banks – – – 45 – 45
– Banks and non-bank financial institutions 753 11 199 5,615 9,142 15,720
– Public sector entities 125 – – – – 125
– Other enterprises 312 2,818 – – 311 3,441
1,190 2,829 199 5,660 9,453 19,331
Impairment (8,674)
Subtotal 10,657
Neither overdue nor impaired
– Government 889,890 2,574 6,729 473 83 899,749
– Central banks 429,101 1,738 2,187 – – 433,026
– Policy banks 285,340 – – 130 – 285,470
– Banks and non-bank financial institutions 645,200 32,953 13,638 4,948 2,519 699,258
– Cinda 131,761 – – – – 131,761
– Public sector entities – 63 87 – 65 215
– Other enterprises 674 233,532 5,010 2,930 1,445 243,591
2,381,966 270,860 27,651 8,481 4,112 2,693,070
Impairment (1,320)
Subtotal 2,691,750
Total 2,702,407

CHINA CONSTRUCTION BANK CORPORATION ANNUAL REPORT 2011
NOTES TO THE FINANCIAL STATEMENTS
(Expressed in millions of RMB, unless otherwise stated)
205
62 RISK MANAGEMENT (CONTINUED)(1) Credit risk (continued)
(h) Distribution of debt securities investments analysed by rating (continued)Bank (continued)
2010
Unrated AAA AA A Lower than A Total
Individually assessed and impaired gross amount
– Policy banks – – – 45 – 45
– Banks and non-bank financial institutions 2,077 34 258 8,227 9,004 19,600
– Public sector entities – – – – 1,128 1,128
– Other enterprises 315 – – 49 296 660
2,392 34 258 8,321 10,428 21,433
Impairment (10,970)
Subtotal 10,463
Neither overdue nor impaired
– Government 729,814 9,072 – 72,112 92 811,090
– Central banks 940,123 12,978 – 740 – 953,841
– Policy banks 183,087 – – 374 162 183,623
– Banks and non-bank financial institutions 482,248 26,850 13,237 9,037 1,034 532,406
– Cinda 206,261 – – – – 206,261
– Public sector entities – 671 91 – 71 833
– Other enterprises 452 163,041 4,311 1,288 1,547 170,639
2,541,985 212,612 17,639 83,551 2,906 2,858,693
Impairment (510)
Subtotal 2,858,183
Total 2,868,646
(i) Credit risk arising from the Group’s derivatives exposures
The majority of the Group’s derivatives transactions with domestic customers are hedged back-to-back with overseas banks and non-bank financial institutions. The Group is exposed to credit risk both in respect of the domestic customers and the overseas banks and non-bank financial institutions. The Group manages this risk by monitoring this exposure on a regular basis.
(j) Settlement risk
The Group’s activities may give rise to settlement risk at the time of the settlement of transactions and trades. Settlement risk is the risk of loss due to the failure of an entity to honour its obligations to deliver cash, securities or other assets as contractually agreed.
For certain types of transactions, the Group mitigates this risk by conducting settlements through a settlement or clearing agent to ensure that a trade is settled only when both parties have fulfilled their contractual settlement obligations.

206 CHINA CONSTRUCTION BANK CORPORATION ANNUAL REPORT 2011
NOTES TO THE FINANCIAL STATEMENTS
(Expressed in millions of RMB, unless otherwise stated)
62 RISK MANAGEMENT (CONTINUED)(2) Market risk
Market risk is the risk of loss, in respect of the Group’s on and off balance sheet activities, arising from adverse movements in market rates including interest rates, foreign exchange rates, commodity prices and stock prices. Market risk arises from both the Group’s trading and non-trading business. A trading book consists of positions in financial instruments and commodities held either with trading intent or in order to hedge other elements of the trading book. Non-trading book records those financial instruments and commodities which are not included in the trading book.
The Risk Management Department is responsible for formulating standardised market risk management policies and rules and supervising the implementation of market risk management policies and rules of the Bank. The Asset and Liability Management Department (the “ALM”) and the International Business Department is responsible for managing the size and structure of the assets and liabilities in response to non-trading market risk. The Financial Market Department manages the Head Office’s RMB and foreign currency investment portfolios, conducts proprietary and customer-driven transactions, as well as implementing market risk management policies and rules. The Audit Department is responsible for regularly performing independent audits of the reliability and effectiveness of the processes constituting the risk management system.
The Group is primarily exposed to structural interest rate risk arising from interest generating commercial banking assets and interest bearing commercial banking liabilities. Interest rate risk is inherent in many of its businesses and largely arises from mismatches between the re-pricing dates of assets and liabilities. The Group manages this risk through regular interest rate gap analysis.
The Group’s foreign exchange exposure mainly comprises exposures from foreign currency portfolios within treasury proprietary investments in debt securities and money market placements, and currency exposures from its overseas business. The Group manages its foreign exchange exposure by entering into cross currency interest rate swaps to hedge these exposures on a portfolio basis.
The Group is also exposed to market risk in respect of its customer driven derivatives portfolio and manages this risk by entering into back-to-back hedging transactions on a trade-by-trade basis with overseas banks and non-bank financial institutions.
The Group considers that the market risk arising from stock prices in respect of its investment portfolios is minimal.
The Group monitors market risk separately in respect of trading portfolios and non-trading portfolios. Trading portfolios include exchange rate and interest rate derivatives as well as trading securities. The historical simulation model for the Value-at-risk (“VaR”) analysis is a major tool used by the Bank to measure and monitor the market risk of its trading portfolio and available-for-sale debt securities. Net interest income sensitivity analysis, interest rate repricing gap analysis and foreign exchange risk concentration analysis are the major tools used by the Group to monitor the market risk of its overall businesses.
(a) VaR analysisVaR is a technique which estimates the potential losses that could occur on risk positions taken, due to movements in market interest rates, foreign exchange rates and other market prices over a specified time horizon and at a given level of confidence. The Risk Management Department calculates interest rates, foreign exchange rates and commodity prices VaR for the Bank’s trading portfolio. By reference to historical movements in interest rates, foreign exchange rates and prices, the Risk Management Department calculates VaR on a daily basis for the trading portfolio and monitors regularly. VaR is calculated at a confidence level of 99% and with a holding period of one day.
A summary of the VaR of the Bank’s trading portfolio as at the end of the reporting period and during the respective years is as follows:
2011
As at 31 December Average Maximum Minimum
Risk valuation of trading portfolio 57 90 263 12 – Interest rate risk 18 25 67 7 – Foreign exchange risk(1) 49 84 260 8 – Commodity risk(2) 8 25 73 1
2010
As at 31 December Average Maximum Minimum
Risk valuation of trading portfolio 43 39 95 8 – Interest rate risk 10 17 47 2 – Foreign exchange risk(1) 44 36 97 4
(1) The reporting of risk in relation to bullion is included in foreign exchange risk above.
(2) The group calculates the commodity risk since November 2011.

CHINA CONSTRUCTION BANK CORPORATION ANNUAL REPORT 2011
NOTES TO THE FINANCIAL STATEMENTS
(Expressed in millions of RMB, unless otherwise stated)
207
62 RISK MANAGEMENT (CONTINUED)(2) Market risk (continued)
(a) VaR analysis (continued)
VaR for each risk factor is the independently derived largest potential loss in a specific holding period and within a certain confidence level due to fluctuations solely in that risk factor. The individual VaRs did not add up to the total VaR as there was diversification effect due to correlation amongst the risk factors.
The above average, maximum and minimum VaR for interest rate risk, foreign exchange risk and diversification of the trading portfolio represent a breakdown of the average, maximum and minimum VaR for the whole portfolio and not the individual average, maximum and minimum VaR for each risk within the portfolio.
Although VaR is an important tool for measuring market risk, the assumptions on which the model is based give rise to some limitations, including the following:
– A 1-day holding period assumes that it is possible to hedge or dispose of positions within that period. This is considered to be a realistic assumption in almost all cases but may not be the case in situations in which there is severe market illiquidity for a prolonged period;
– A 99 percent confidence level does not reflect losses that may occur beyond this level. Within the model used there is 1 percent probability that losses could exceed the VaR;
– VaR is calculated on an end-of-day basis and does not reflect exposures that may arise on positions during the trading day;
– The use of historical data as a basis for determining the possible range of future outcomes may not always cover all possible scenarios, especially those of an exceptional nature; and
– The VaR measure is dependent upon the Bank’s position and the volatility of market prices. The VaR of an unchanged position reduces if the market price volatility declines and vice versa.
(b) Net interest income sensitivity analysis
In monitoring interest rate risk on its overall non-derivative financial assets and liabilities, the Bank regularly measures its future net interest income sensitivity to an increase or decrease in market interest rates (assuming no asymmetrical movement in yield curves and a constant financial position). An incremental 100 basis points parallel fall or rise in all yield curves, other than that applicable to balances with central banks, would increase or decrease planned net interest income for the next twelve months from the reporting date by RMB37,516 million (2010: RMB34,771 million). Had the impact of yield curves movement for demand deposits from customers been excluded, the planned net interest income for the next twelve months from the reporting date would decrease or increase by RMB21,061 million (2010: RMB21,214 million).
The above interest rate sensitivity is for illustration purposes only and is assessed based on simplified assumptions. The figures here indicate estimated net interest income movements under various predicted yield curve scenarios and subject to the Bank’s current interest rate exposures. However, account has not been taken of the possible risk management measures that can be undertaken by the department who manage the interest related risk or related business departments to mitigate interest rate risk. In practice, the department who manage the interest related risk strives to reduce loss arising from interest rate risk while increasing its net income. These figures are estimated on the assumption that the interest rates on various maturities will move within similar ranges, and therefore do not reflect the potential net interest income changes in the event that interest rates on some maturities may change and others remain unchanged. Moreover, the above estimations are based on other simplified assumptions, including that all positions will be held to maturity and rolled over upon maturity.
(c) Interest rate repricing gap analysis
Interest rate risk refers to the risk where the market interest rates, tenor and other factors may experience unfavourable fluctuations which impact the overall profitability and fair value resulting in losses to the banking book. The key determinants of the Group’s interest rate risk arises from the mismatch between the maturity periods of the assets and liabilities, and inconsistent pricing basis, resulting in re-pricing risk and basis risk.
The ALM is responsible for regularly monitoring the interest rate risk positions and measuring the interest rate re-pricing gap. The main reason for measuring the interest rate re-pricing gap is to assist in analysing the impact of interest rate changes on net interest income.

208 CHINA CONSTRUCTION BANK CORPORATION ANNUAL REPORT 2011
NOTES TO THE FINANCIAL STATEMENTS
(Expressed in millions of RMB, unless otherwise stated)
62 RISK MANAGEMENT (CONTINUED)(2) Market risk (continued)
(c) Interest rate repricing gap analysis (continued)
The following tables indicate the effective interest rate (“EIR”) for the respective year, and the expected next repricing dates (or maturity dates whichever are earlier) for the assets and liabilities of the Group as at the end of the reporting period.
Group
2011
Note
Effective interest
rate Note (i)
Non- interest bearing
Within three
months
Between three
months and
one year
Between one year
and five years
More than five years Total
Assets
Cash and deposits with central banks 1.54% 197,288 2,182,521 – – – 2,379,809
Deposits and placements with banks and non-bank financial institutions 2.75% – 279,079 105,486 1,151 76 385,792
Financial assets held under resale agreements 4.03% – 198,966 1,079 – – 200,045
Loans and advances to customers (ii) 5.69% – 3,485,517 2,746,432 26,964 66,281 6,325,194
Investments (iii) 3.27% 24,811 258,463 465,984 1,098,204 896,357 2,743,819
Other assets – 247,175 – – – – 247,175
Total assets 4.27% 469,274 6,404,546 3,318,981 1,126,319 962,714 12,281,834
Liabilities
Borrowings from central banks 0.98% – 2,220 – – – 2,220
Deposits and placements from banks and non-bank financial institutions 2.35% – 948,479 58,520 37,955 – 1,044,954
Financial liabilities at fair value through profit or loss 1.33% 12,683 11,669 9,304 – – 33,656
Financial assets sold under repurchase agreements 5.67% – 9,543 918 – – 10,461
Deposits from customers 1.61% 44,435 7,185,234 2,057,323 692,825 7,633 9,987,450
Debt securities issued 3.41% – 18,100 20,518 31,123 98,571 168,312
Other liabilities – 218,120 – – – – 218,120
Total liabilities 1.70% 275,238 8,175,245 2,146,583 761,903 106,204 11,465,173
Asset-liability gap 2.57% 194,036 (1,770,699) 1,172,398 364,416 856,510 816,661

CHINA CONSTRUCTION BANK CORPORATION ANNUAL REPORT 2011
NOTES TO THE FINANCIAL STATEMENTS
(Expressed in millions of RMB, unless otherwise stated)
209
62 RISK MANAGEMENT (CONTINUED)(2) Market risk (continued)
(c) Interest rate repricing gap analysis (continued)Group (continued)
2010
Note
Effective interest
rateNote (i)
Non- interest bearing
Within three
months
Between three
months and
one year
Between one year
and five years
More than Five years Total
Assets
Cash and deposits with central banks 1.52% 65,649 1,782,380 – – – 1,848,029
Deposits and placements with banks and non-bank financial institutions 1.51% – 138,366 3,864 50 – 142,280
Financial assets held resale agreements 1.68% – 160,915 20,160 – – 181,075
Loans and advances to customers (ii) 5.07% – 2,753,781 2,682,962 21,099 68,184 5,526,026
Investments (iii) 2.83% 31,269 595,367 660,904 886,509 732,725 2,906,774
Other assets – 206,133 – – – – 206,133
Total assets 3.74% 303,051 5,430,809 3,367,890 907,658 800,909 10,810,317
Liabilities
Borrowings from central banks 2.34% – 1,781 – – – 1,781
Deposits and placements from banks and non-bank financial institutions 1.73% – 679,934 31,497 38,378 – 749,809
Financial liabilities at fair value through profit or loss 1.32% 2,926 9,963 51 2,347 – 15,287
Financial assets sold under repurchase agreements 1.82% – 4,868 54 – – 4,922
Deposits from customers 1.28% 41,602 6,708,141 1,951,209 367,097 7,320 9,075,369
Debt securities issued 3.78% – 7,563 3,401 24,425 57,926 93,315
Other liabilities – 168,929 – – – – 168,929
Total liabilities 1.34% 213,457 7,412,250 1,986,212 432,247 65,246 10,109,412
Asset-liability gap 2.40% 89,594 (1,981,441) 1,381,678 475,411 735,663 700,905
Notes:
(i) Effective interest rate represents the ratio of interest income/expense to average interest bearing assets/liabilities.
(ii) For loans and advances to customers, the “within three months” category includes overdue amounts (net of allowances for impairment losses) of RMB25,121 million as at 31 December 2011 (2010: RMB23,433 million).
(iii) Investments include financial assets at fair value through profit or loss, available-for-sale financial assets, held-to-maturity investment, debt securities classified as receivables and investments in associates and jointly controlled entities.

210 CHINA CONSTRUCTION BANK CORPORATION ANNUAL REPORT 2011
NOTES TO THE FINANCIAL STATEMENTS
(Expressed in millions of RMB, unless otherwise stated)
62 RISK MANAGEMENT (CONTINUED)(2) Market risk (continued)
(c) Interest rate repricing gap analysis (continued)Bank
2011
Note
Effective interest
rateNote (i)
Non- interest bearing
Within three
months
Between three
months and
one year
Between one year
and five years
More than five years Total
Assets
Cash and deposits with central banks 1.54% 192,636 2,180,857 – – – 2,373,493
Deposits and placements with banks and non-bank financial institutions 2.80% – 277,365 112,959 24 46 390,394
Financial assets held under resale agreements 4.03% – 198,966 1,079 – – 200,045
Loans and advances to customers (ii) 5.72% – 3,371,429 2,729,704 22,166 66,064 6,189,363
Investments (iii) 3.26% 23,949 253,680 460,878 1,093,014 894,834 2,726,355
Other assets – 259,240 – – – – 259,240
Total assets 4.27% 475,825 6,282,297 3,304,620 1,115,204 960,944 12,138,890
Liabilities
Borrowings from central banks 0.98% – 2,210 – – – 2,210
Deposits and placements from banks and non-bank financial institutions 2.30% – 941,999 37,133 36,555 – 1,015,687
Financial liabilities at fair value through profit or loss 1.33% 12,683 11,669 6,614 – – 30,966
Financial assets sold under repurchase agreements 4.85% – 10,676 918 – – 11,594
Deposits from customers 1.61% 40,221 7,119,711 2,047,688 691,184 7,289 9,906,093
Debt securities issued 3.52% – 14,904 15,573 29,002 98,571 158,050
Other liabilities – 207,713 – – – – 207,713
Total liabilities 1.70% 260,617 8,101,169 2,107,926 756,741 105,860 11,332,313
Asset-liability gap 2.57% 215,208 (1,818,872) 1,196,694 358,463 855,084 806,577

CHINA CONSTRUCTION BANK CORPORATION ANNUAL REPORT 2011
NOTES TO THE FINANCIAL STATEMENTS
(Expressed in millions of RMB, unless otherwise stated)
211
62 RISK MANAGEMENT (CONTINUED)(2) Market risk (continued)
(c) Interest rate repricing gap analysis (continued)Bank (continued)
2010
Note
Effective interest
rateNote (i)
Non- interest bearing
Within three
months
Between three
months and
one year
Between one year
and five years
More than five years Total
Assets
Cash and deposits with central banks 1.52% 65,408 1,776,459 – – – 1,841,867
Deposits and placements with banks and non-bank financial institutions 1.46% – 137,516 9,210 – – 146,726
Financial assets held under resale agreements 1.68% – 160,915 20,160 – – 181,075
Loans and advances to customers (ii) 5.07% – 2,693,227 2,648,564 18,464 68,024 5,428,279
Investments (iii) 2.83% 27,623 593,104 660,150 883,051 732,691 2,896,619
Other assets – 220,239 – – – – 220,239
Total assets 3.73% 313,270 5,361,221 3,338,084 901,515 800,715 10,714,805
Liabilities
Borrowings from central banks 2.34% – 1,781 – – – 1,781
Deposits and placements from banks and non-bank financial institutions 1.69% – 660,043 29,463 37,396 – 726,902
Financial liabilities at fair value through profit or loss 1.32% 2,926 9,963 51 – – 12,940
Financial assets sold under repurchase agreements 1.29% – 6,774 4,315 – – 11,089
Deposits from customers 1.28% 41,602 6,656,114 1,943,158 366,508 7,264 9,014,646
Debt securities issued 3.70% – 6,203 3,145 24,161 57,922 91,431
Other liabilities – 164,651 – – – – 164,651
Total liabilities 1.34% 209,179 7,340,878 1,980,132 428,065 65,186 10,023,440
Asset-liability gap 2.39% 104,091 (1,979,657) 1,357,952 473,450 735,529 691,365
Notes:
(i) Effective interest rate represents the ratio of interest income/expense to average interest bearing assets/liabilities.
(ii) For loans and advances to customers, the “within three months” category includes overdue amounts (net of allowances for impairment losses) of RMB24,664 million as at 31 December 2011 (2010: RMB23,092 million).
(iii) Investments include financial assets at fair value through profit or loss, available-for-sale financial assets, held-to-maturity investments, debt securities classified as receivables and investments in subsidiaries.

212 CHINA CONSTRUCTION BANK CORPORATION ANNUAL REPORT 2011
NOTES TO THE FINANCIAL STATEMENTS
(Expressed in millions of RMB, unless otherwise stated)
62 RISK MANAGEMENT (CONTINUED)(2) Market risk (continued)
(d) Currency risk
The Group’s foreign exchange exposure mainly comprises exposures that arise from the foreign currency portfolio within the treasury’s proprietary investments, and currency exposures originated by the Group’s overseas businesses.
The Group manages other currency risk by spot and forward foreign exchange transactions and by matching its foreign currency denominated assets with corresponding liabilities in the same currency, and also uses derivatives (principally foreign exchange swaps and cross currency swaps) in the management of its own foreign currency asset and liability portfolios and structural positions.
The currency exposures of the Group’s and the Bank’s assets and liabilities as at the end of the reporting period are as follows:
Group
2011
Note RMB
USD (RMB
equivalent)
Others (RMB
equivalent) Total
Assets
Cash and deposits with central banks 2,253,657 45,133 81,019 2,379,809
Deposits and placements with banks and non-bank financial institutions (i) 536,807 25,609 23,421 585,837
Loans and advances to customers 5,955,730 245,419 124,045 6,325,194
Investments 2,672,309 29,090 42,420 2,743,819
Other assets 218,568 22,703 5,904 247,175
Total assets 11,637,071 367,954 276,809 12,281,834
Liabilities
Borrowings from central banks 16 2,203 1 2,220
Deposits and placements from banks and non-bank financial institutions (ii) 856,133 81,819 117,463 1,055,415
Financial liabilities at fair value through profit or loss 22,323 8,545 2,788 33,656
Deposits from customers 9,690,386 164,752 132,312 9,987,450
Debt securities issued 132,920 20,399 14,993 168,312
Other liabilities 182,299 8,305 27,516 218,120
Total liabilities 10,884,077 286,023 295,073 11,465,173
Net position 752,994 81,931 (18,264) 816,661
Net notional amount of derivatives 44,469 (79,952) 36,194 711

CHINA CONSTRUCTION BANK CORPORATION ANNUAL REPORT 2011
NOTES TO THE FINANCIAL STATEMENTS
(Expressed in millions of RMB, unless otherwise stated)
213
62 RISK MANAGEMENT (CONTINUED)(2) Market risk (continued)
(d) Currency risk (continued)Group (continued)
2010
Note RMB
USD (RMB
equivalent)
Others (RMB
equivalent) Total
Assets
Cash and deposits with central banks 1,815,825 5,960 26,244 1,848,029
Deposits and placements with banks and non-bank financial institutions (i) 254,409 26,068 42,878 323,355
Loans and advances to customers 5,194,760 223,264 108,002 5,526,026
Investments 2,834,022 35,416 37,336 2,906,774
Other assets 198,160 1,769 6,204 206,133
Total assets 10,297,176 292,477 220,664 10,810,317
Liabilities
Borrowings from central banks 6 1,054 721 1,781
Deposits and placements from banks and non-bank financial institutions (ii) 619,166 68,882 66,683 754,731
Financial liabilities at fair value through profit or loss 12,865 75 2,347 15,287
Deposits from customers 8,833,230 126,643 115,496 9,075,369
Debt securities issued 79,910 3,610 9,795 93,315
Other liabilities 146,955 9,392 12,582 168,929
Total liabilities 9,692,132 209,656 207,624 10,109,412
Net position 605,044 82,821 13,040 700,905
Net notional amount of derivatives 56,482 (65,331) 10,622 1,773
Notes:
(i) Including financial assets held under resale agreements.
(ii) Including financial assets sold under repurchase agreements.

214 CHINA CONSTRUCTION BANK CORPORATION ANNUAL REPORT 2011
NOTES TO THE FINANCIAL STATEMENTS
(Expressed in millions of RMB, unless otherwise stated)
62 RISK MANAGEMENT (CONTINUED)(2) Market risk (continued)
(d) Currency risk (continued)Bank
2011
Note RMB
USD (RMB
equivalent)
Others (RMB
equivalent) Total
Assets
Cash and deposits with central banks 2,252,012 45,133 76,348 2,373,493
Deposits and placements with banks and non-bank financial institutions (i) 543,655 30,651 16,133 590,439
Loans and advances to customers 5,898,547 220,940 69,876 6,189,363
Investments 2,671,599 27,916 26,840 2,726,355
Other assets 234,948 22,717 1,575 259,240
Total assets 11,600,761 347,357 190,772 12,138,890
Liabilities
Borrowings from central banks 6 2,203 1 2,210
Deposits and placements from banks and non-bank financial institutions (ii) 832,280 84,504 110,497 1,027,281
Financial liabilities at fair value through profit or loss 22,323 8,545 98 30,966
Deposits from customers 9,675,116 150,321 80,656 9,906,093
Debt securities issued 131,796 17,442 8,812 158,050
Other liabilities 193,377 7,920 6,416 207,713
Total liabilities 10,854,898 270,935 206,480 11,332,313
Net position 745,863 76,422 (15,708) 806,577
Net notional amount of derivatives 44,785 (69,562) 25,439 662

CHINA CONSTRUCTION BANK CORPORATION ANNUAL REPORT 2011
NOTES TO THE FINANCIAL STATEMENTS
(Expressed in millions of RMB, unless otherwise stated)
215
62 RISK MANAGEMENT (CONTINUED)(2) Market risk (continued)
(d) Currency risk (continued)Bank (continued)
2010
Note RMB
USD (RMB
equivalent)
Others (RMB
equivalent) Total
Assets
Cash and deposits with central banks 1,815,109 5,960 20,798 1,841,867
Deposits and placements with banks and non-bank financial institutions (i) 258,007 28,914 40,880 327,801
Loans and advances to customers 5,162,066 209,412 56,801 5,428,279
Investments 2,837,047 33,378 26,194 2,896,619
Other assets 217,396 2,025 818 220,239
Total assets 10,289,625 279,689 145,491 10,714,805
Liabilities
Borrowings from central banks 6 1,054 721 1,781
Deposits and placements from banks and non-bank financial institutions (ii) 601,454 74,872 61,665 737,991
Financial liabilities at fair value through profit or loss 12,865 75 – 12,940
Deposits from customers 8,827,457 116,157 71,032 9,014,646
Debt securities issued 79,909 2,435 9,087 91,431
Other liabilities 152,348 8,913 3,390 164,651
Total liabilities 9,674,039 203,506 145,895 10,023,440
Net position 615,586 76,183 (404) 691,365
Net notional amount of derivatives 60,175 (61,683) 3,033 1,525
Notes:
(i) Including financial assets held under resale agreements.
(ii) Including financial assets sold under repurchase agreements.\
(3) Liquidity risk
Liquidity risk is the type of risk that occurs when, despite its debt servicing ability, the Group cannot obtain sufficient funds in time, or obtain sufficient funds at a reasonable cost, to meet the needs of asset growth or repay liabilities when they are due. It is caused by mismatches of assets and liabilities in terms of their amounts and maturity dates. In accordance with liquidity policies, the Group monitors the future cash flows to ensure that an appropriate level of highly liquid assets is maintained.
At the Group level, liquidity is managed and coordinated through the ALM. The ALM is responsible for formulation of the liquidity policies in accordance with regulatory requirements and prudential principles. Such policies include:
– adopting a prudent strategy and ensuring sufficient funds are available at any moment to satisfy any payment request;
– optimising the Group’s asset and liability structure, diversifying and stabilizing the source of funds, and reserving an appropriate proportion of highly credit-rated and liquid asset portfolio; and
– managing and utilising centrally the Bank’s liquid funds.
The Group uses a variety of methods including liquidity index analysis, analysis of remaining contractual maturities and undiscounted cash flow analysis to measure the liquidity risk. Gap analysis is used to predict the cash flow within one year. Various types of scenario analysis are then applied to assess the impact of liquidity risk.

216 CHINA CONSTRUCTION BANK CORPORATION ANNUAL REPORT 2011
NOTES TO THE FINANCIAL STATEMENTS
(Expressed in millions of RMB, unless otherwise stated)
62 RISK MANAGEMENT (CONTINUED)(3) Liquidity risk (continued)
(a) Maturity analysis
The following tables provide an analysis of the assets and liabilities of the Group and the Bank based on the remaining periods to repayment as at the end of the reporting period:
Group
2011
IndefiniteRepayable
on demandWithin one
month
Between one
month and three
months
Between three
months and one
year
Between one year
and five years
More than five
years Total
Assets
Cash and deposits with central banks 1,996,932 382,877 – – – – – 2,379,809
Deposits and placements with banks and non-bank financial institutions – 32,603 151,071 95,405 98,454 8,183 76 385,792
Financial assets held under resale agreements – – 185,613 13,353 1,079 – – 200,045
Loans and advances to customers 33,363 104,292 236,117 456,647 1,647,945 1,674,416 2,172,414 6,325,194
Investments
– Financial assets at fair value through profit or loss 8,722 – 2 201 6,382 6,326 1,463 23,096
– Available-for-sale financial assets 22,308 – 7,678 42,776 136,627 314,230 151,439 675,058
– Held-to-maturity investments 2,004 – 24,140 22,928 156,543 911,631 626,323 1,743,569
– Debt securities classified as receivables 368 – – 750 17,944 57,259 223,706 300,027
– Investments in associates and jointly controlled entities 2,069 – – – – – – 2,069
Other assets 138,347 31,518 14,631 25,221 28,087 4,689 4,682 247,175
Total assets 2,204,113 551,290 619,252 657,281 2,093,061 2,976,734 3,180,103 12,281,834
Liabilities
Borrowings from central banks – 2,220 – – – – – 2,220
Deposits and placements from banks and non-bank financial institutions – 445,029 320,833 156,922 57,350 64,820 – 1,044,954
Financial liabilities at fair value through profit or loss – 12,682 8,460 3,182 9,304 – 28 33,656
Financial assets sold under repurchase agreements – – 2,469 7,074 918 – – 10,461
Deposits from customers – 5,396,360 844,136 896,678 2,145,634 694,911 9,731 9,987,450
Debt securities issued
– Certificates of deposit issued – – 7,258 10,842 20,518 9,138 695 48,451
– Subordinated bonds issued – – – – – 21,985 97,876 119,861
Other liabilities 358 134,242 11,632 14,833 40,171 12,495 4,389 218,120
Total liabilities 358 5,990,533 1,194,788 1,089,531 2,273,895 803,349 112,719 11,465,173
Long/(short) position 2,203,755 (5,439,243) (575,536) (432,250) (180,834) 2,173,385 3,067,384 816,661
Notional amount of derivatives
– Interest rate contracts – – 2,471 8,976 69,553 74,121 28,539 183,660
– Exchange rate contracts – – 165,801 181,875 334,292 48,370 10,399 740,737
– Other contracts – – 399 59 3,969 584 – 5,011
Total – – 168,671 190,910 407,814 123,075 38,938 929,408

CHINA CONSTRUCTION BANK CORPORATION ANNUAL REPORT 2011
NOTES TO THE FINANCIAL STATEMENTS
(Expressed in millions of RMB, unless otherwise stated)
217
62 RISK MANAGEMENT (CONTINUED)(3) Liquidity risk (continued)
(a) Maturity analysis (continued)Group (continued)
2010
IndefiniteRepayable
on demandWithin one
month
Between one
month and three
months
Between three
months and one
year
Between oneyear
and five years
More than five
years Total
Assets
Cash and deposits with central banks 1,628,890 219,139 – – – – – 1,848,029
Deposits and placements with banks and non-bank financial institutions – 53,210 74,247 9,638 5,135 50 – 142,280
Financial assets held under resale agreements – – 99,961 60,954 20,160 – – 181,075
Loans and advances to customers 28,796 68,102 182,745 395,284 1,278,290 1,504,855 2,067,954 5,526,026
Investments
– Financial assets at fair value through profit or loss 9,484 – 796 1,239 1,576 3,945 304 17,344
– Available-for-sale financial assets 28,437 – 30,095 130,872 143,758 238,283 125,403 696,848
– Held-to-maturity investments 2,035 – 52,824 198,229 355,341 761,587 514,041 1,884,057
– Debt securities classified as receivables – – – – 16,494 3,628 286,626 306,748
– Investments in associates and jointly controlled entities 1,777 – – – – – – 1,777
Other assets 124,387 47,792 3,613 5,664 9,779 5,520 9,378 206,133
Total assets 1,823,806 388,243 444,281 801,880 1,830,533 2,517,868 3,003,706 10,810,317
Liabilities
Borrowings from central banks – 1,781 – – – – – 1,781
Deposits and placements from banks and non-bank financial institutions – 518,773 77,774 16,846 61,039 75,377 – 749,809
Financial liabilities at fair value through profit or loss – 2,926 3,043 6,896 24 2,347 51 15,287
Financial assets sold under repurchase agreements – – 2,868 2,000 54 – – 4,922
Deposits from customers – 5,162,475 809,818 775,614 1,949,539 367,799 10,124 9,075,369
Debt securities issued
– Certificates of deposit issued – – 794 898 6,569 5,149 4 13,414
– Subordinated bonds issued – – – – – 21,979 57,922 79,901
Other liabilities 243 76,817 8,056 15,598 58,579 3,946 5,690 168,929
Total liabilities 243 5,762,772 902,353 817,852 2,075,804 476,597 73,791 10,109,412
Long/(short) position 1,823,563 (5,374,529) (458,072) (15,972) (245,271) 2,041,271 2,929,915 700,905
Notional amount of derivatives
– Interest rate contracts – – 3,475 24,497 49,557 70,726 32,875 181,130
– Exchange rate contracts – – 159,043 146,726 275,359 27,309 11,012 619,449
– Other contracts – – 1,576 331 731 1,237 – 3,875
Total – – 164,094 171,554 325,647 99,272 43,887 804,454

218 CHINA CONSTRUCTION BANK CORPORATION ANNUAL REPORT 2011
NOTES TO THE FINANCIAL STATEMENTS
(Expressed in millions of RMB, unless otherwise stated)
62 RISK MANAGEMENT (CONTINUED)(3) Liquidity risk (continued)
(a) Maturity analysis (continued)Bank
2011
IndefiniteRepayable
on demandWithin one
month
Between one
month and three
months
Between three
months and one
year
Between one year
and fiveyears
More than five
years Total
Assets
Cash and deposits with central banks 1,995,697 377,796 – – – – – 2,373,493
Deposits and placements with banks and non-bank financial institutions – 30,093 148,930 98,343 105,958 7,024 46 390,394
Financial assets held under resale agreements – – 185,613 13,353 1,079 – – 200,045
Loans and advances to customers 32,274 103,938 230,801 443,386 1,613,532 1,628,225 2,137,207 6,189,363
Investments
– Financial assets at fair value through profit or loss – – 2 201 4,332 2,748 1,432 8,715
– Available-for-sale financial assets 20,284 – 6,791 40,350 132,784 312,415 150,959 663,583
– Held-to-maturity investments 2,004 – 24,141 22,888 156,503 911,447 625,359 1,742,342
– Debt securities classified as receivables 368 – – 750 17,944 57,047 223,656 299,765
– Investments in subsidiaries 11,950 – – – – – – 11,950
Other assets 154,043 30,666 14,212 24,889 27,432 3,316 4,682 259,240
Total assets 2,216,620 542,493 610,490 644,160 2,059,564 2,922,222 3,143,341 12,138,890
Liabilities
Borrowings from central banks – 2,210 – – – – – 2,210
Deposits and placements from banks and non-bank financial institutions – 447,667 322,533 146,309 35,808 63,370 – 1,015,687
Financial liabilities at fair value through profit or loss – 12,682 8,460 3,182 6,614 – 28 30,966
Financial assets sold under repurchase agreements – – 3,161 7,515 918 – – 11,594
Deposits from customers – 5,378,414 819,917 869,435 2,135,490 693,169 9,668 9,906,093
Debt securities issued
– Certificates of deposit issued – – 5,719 9,185 15,573 7,017 695 38,189
– Subordinated bonds issued – – – – – 21,985 97,876 119,861
Other liabilities 23 133,015 10,765 13,154 34,286 12,082 4,388 207,713
Total liabilities 23 5,973,988 1,170,555 1,048,780 2,228,689 797,623 112,655 11,332,313
Long/(short) position 2,216,597 (5,431,495) (560,065) (404,620) (169,125) 2,124,599 3,030,686 806,577
Notional amount of derivatives
– Interest rate contracts – – 1,798 6,532 68,583 67,200 28,539 172,652
– Exchange rate contracts – – 132,742 149,261 291,538 47,107 10,399 631,047
– Other contracts – – 298 – 2,839 – – 3,137
Total – – 134,838 155,793 362,960 114,307 38,938 806,836

CHINA CONSTRUCTION BANK CORPORATION ANNUAL REPORT 2011
NOTES TO THE FINANCIAL STATEMENTS
(Expressed in millions of RMB, unless otherwise stated)
219
62 MATURITY ANALYSIS (CONTINUED)(3) Liquidity risk (continued)
(a) Maturity analysis (continued)Bank (continued)
2010
IndefiniteRepayable
on demandWithin one
month
Between one
month and three
months
Between three
months and one
year
Between one year
and five years
More than five
years Total
Assets
Cash and deposits with central banks 1,628,372 213,495 – – – – – 1,841,867
Deposits and placements with banks and non-bank financial institutions – 49,494 72,580 14,172 10,480 – – 146,726
Financial assets held under resale agreements – – 99,961 60,954 20,160 – – 181,075
Loans and advances to customers 27,826 68,098 178,306 389,016 1,259,594 1,468,371 2,037,068 5,428,279
Investments
– Financial assets at fair value through profit or loss – – 599 1,007 653 515 270 3,044
– Available-for-sale financial assets 26,182 – 29,844 130,722 144,408 236,504 125,371 693,031
– Held-to-maturity investments 2,035 – 52,824 198,209 355,231 761,587 514,041 1,883,927
– Debt securities classified as receivables – – – – 16,494 3,628 286,626 306,748
– Investments in subsidiaries 9,869 – – – – – – 9,869
Other assets 142,005 47,456 3,093 5,209 8,012 5,081 9,383 220,239
Total assets 1,836,289 378,543 437,207 799,289 1,815,032 2,475,686 2,972,759 10,714,805
Liabilities
Borrowings from central banks – 1,781 – – – – – 1,781
Deposits and placements from banks and non-bank financial institutions – 520,782 77,870 14,111 40,889 73,250 – 726,902
Financial liabilities at fair value through profit or loss – 2,926 3,043 6,896 24 – 51 12,940
Financial assets sold under repurchase agreements – – 3,446 3,328 4,315 – – 11,089
Deposits from customers – 5,163,478 772,509 759,893 1,941,488 367,210 10,068 9,014,646
Debt securities issued
– Certificates of deposit issued – – 487 1,481 5,657 3,905 – 11,530
– Subordinated bonds issued – – – – – 21,979 57,922 79,901
Other liabilities 4 76,101 7,453 15,053 56,523 3,807 5,710 164,651
Total liabilities 4 5,765,068 864,808 800,762 2,048,896 470,151 73,751 10,023,440
Long/(short) position 1,836,285 (5,386,525) (427,601) (1,473) (233,864) 2,005,535 2,899,008 691,365
Notional amount of derivatives
– Interest rate contracts – – 3,475 23,719 43,435 69,163 32,875 172,667
– Exchange rate contracts – – 129,103 132,548 250,552 27,309 11,012 550,524
– Other contracts – – 1,502 – 90 33 – 1,625
Total – – 134,080 156,267 294,077 96,505 43,887 724,816

220 CHINA CONSTRUCTION BANK CORPORATION ANNUAL REPORT 2011
NOTES TO THE FINANCIAL STATEMENTS
(Expressed in millions of RMB, unless otherwise stated)
62 RISK MANAGEMENT (CONTINUED)(3) Liquidity risk (continued)
(b) Contractual undiscounted cash flowThe following tables provide an analysis of the contractual undiscounted cash flow of the non-derivative financial liabilities and off-balance sheet credit commitments of the Group and the Bank as at the end of the reporting period. The Group’s and the Bank’s expected cash flows on these instruments may vary significantly from this analysis.
Group
2011
Carrying amount
Gross cash outflow
Repayable on demand
Within one month
Between one
month and three
months
Between three
months and one
year
Between one year
and five years
More than five
years
Non-derivative financial liabilities Borrowings from central banks 2,220 2,220 2,220 – – – – –Deposits and placements from banks and non-bank financial institutions 1,044,954 1,068,048 445,050 322,102 159,237 59,685 81,974 –Financial liabilities at fair value through profit or loss 33,656 33,684 12,682 8,476 3,192 9,305 – 29Financial assets sold under repurchase agreements 10,461 10,615 – 2,480 7,175 960 – –Deposits from customers 9,987,450 10,201,224 5,400,418 851,975 915,887 2,217,601 802,755 12,588Debt securities issued – Certificates of deposit issued 48,451 49,133 – 7,261 10,859 20,655 9,432 926 – Subordinated bonds issued 119,861 164,820 – – 1,504 3,976 42,488 116,852Other financial liabilities 52,449 52,449 48,745 140 160 2,896 – 508
Total 11,299,502 11,582,193 5,909,115 1,192,434 1,098,014 2,315,078 936,649 130,903
Off-balance sheet loan commitments and credit card commitments (Note) 745,224 557,208 53,318 25,953 76,123 30,629 1,993
Guarantees, acceptances and other financial facilities (Note) 1,236,725 – 251,994 258,931 403,962 226,551 95,287
2010
Carrying amount
Gross cash outflow
Repayable on demand
Within one month
Between one
month and three
months
Between three
months and one
year
Between one year
and five years
More than five
years
Non-derivative financial liabilities Borrowings from central banks 1,781 1,781 1,781 – – – – –Deposits and placements from banks and non-bank financial institutions 749,809 773,294 518,852 78,010 16,966 67,208 92,258 –Financial liabilities at fair value through profit or loss 15,287 15,503 2,926 3,052 6,915 24 2,535 51Financial assets sold under repurchase agreements 4,922 4,956 – 2,872 2,027 57 – –Deposits from customers 9,075,369 9,206,516 5,163,295 816,968 790,309 2,008,784 415,469 11,691Debt securities issued – Certificates of deposit issued 13,414 13,628 – 827 915 6,653 5,228 5 – Subordinated bonds issued 79,901 105,220 – – 1,504 1,696 34,084 67,936Other financial liabilities 38,970 38,970 37,630 227 55 86 460 512
Total 9,979,453 10,159,868 5,724,484 901,956 818,691 2,084,508 550,034 80,195
Off-balance sheet loan commitments and credit card commitments (Note) 812,355 481,802 52,753 49,993 117,755 68,140 41,912
Guarantees, acceptances and other financial facilities (Note) 1,223,465 – 317,802 260,916 375,122 237,075 32,550

CHINA CONSTRUCTION BANK CORPORATION ANNUAL REPORT 2011
NOTES TO THE FINANCIAL STATEMENTS
(Expressed in millions of RMB, unless otherwise stated)
221
62 RISK MANAGEMENT (CONTINUED)(3) Liquidity risk (continued)
(b) Contractual undiscounted cash flow (continued)Bank
2011
Carrying amount
Gross cash
outflowRepayable on demand
Within one month
Between one
month and three
months
Between three
months and one
year
Between one year
and five years
More than five
years
Non-derivative financial liabilities Borrowings from central banks 2,210 2,210 2,210 – – – – –Deposits and placements from banks and non-bank financial institutions 1,015,687 1,036,867 447,688 323,783 148,369 36,736 80,291 –Financial liabilities at fair value through profit or loss 30,966 30,993 12,682 8,476 3,192 6,614 – 29Financial assets sold under repurchase agreements 11,594 11,779 – 3,189 7,630 960 – –Deposits from customers 9,906,093 10,119,604 5,382,466 827,734 888,559 2,207,347 800,974 12,524Debt securities issued – Certificates of deposit issued 38,189 38,766 – 5,721 9,199 15,681 7,239 926 – Subordinated bonds issued 119,861 164,820 – – 1,504 3,976 42,488 116,852Other financial liabilities 44,024 44,024 40,341 139 149 2,887 – 508
Total 11,168,624 11,449,063 5,885,387 1,169,042 1,058,602 2,274,201 930,992 130,839
Off-balance sheet loan commitments and credit card commitments (Note) 718,317 557,208 29,473 25,051 74,233 30,359 1,993
Guarantees, acceptances and other financial facilities (Note) 1,238,467 – 251,967 259,571 405,377 226,265 95,287
2010
Carrying amount
Gross cash
outflowRepayable on demand
Within one month
Between one
month and three
months
Between three
months and one
year
Between one year
and five years
More than five
years
Non-derivative financial liabilities Borrowings from central banks 1,781 1,781 1,781 – – – – –Deposits and placements from banks and non-bank financial institutions 726,902 749,660 520,806 78,142 14,198 46,487 90,027 –Financial liabilities at fair value through profit or loss 12,940 12,968 2,926 3,051 6,916 24 – 51Financial assets sold under repurchase agreements 11,089 11,378 – 3,450 3,373 4,555 – –Deposits from customers 9,014,646 9,145,793 5,164,298 779,659 774,588 2,000,733 414,880 11,635Debt securities issued – Certificates of deposit issued 11,530 11,743 – 520 1,498 5,741 3,984 – – Subordinated bonds issued 79,901 105,220 – – 1,504 1,696 34,084 67,936Other financial liabilities 36,046 36,046 34,719 225 48 86 456 512
Total 9,894,835 10,074,589 5,724,530 865,047 802,125 2,059,322 543,431 80,134
Off-balance sheet loan commitments and credit card commitments (Note) 786,799 481,802 30,098 49,139 115,964 67,884 41,912
Guarantees, acceptances and other financial facilities (Note) 1,222,594 – 317,831 260,513 375,114 236,586 32,550
Note: The off-balance sheet loan commitments and credit card commitments may expire without being drawn upon. Guarantees, acceptances and other financial facilities do not represent the amount to be paid.
222 CHINA CONSTRUCTION BANK CORPORATION ANNUAL REPORT 2011
NOTES TO THE FINANCIAL STATEMENTS
(Expressed in millions of RMB, unless otherwise stated)
62 RISK MANAGEMENT (CONTINUED)(4) Operational risk
Operational risk represents the risk of loss due to deficient and flawed internal processes, personnel and information system, or other external events.
The Group has continued to further strengthen the operational risk management processes to ensure operational stability and business as usual, by enhancing the self-assessment of operational risk, establishing key risk controls and examination, utilizing usage of operational risk tools and systems, performing emergency drills to ensure continuous business operations in adverse scenarios and promoting business continuity management:
– continuous self-assessment of operational risk – The Group continuously improves and expands the scope of self-assessment, placing particular focus on off-balance sheet related items to enhance respective regulations, processes and services;
– establishment of examination of key risk controls – The Group carries out examination over key risk controls, and continues to refine, expand and re-examine the scope and contents of the monitoring checks, placing particular focus on key business areas and preventive checks on major operational risk areas;
– strengthening the centralized operational risk management evaluation system – The Group refines the operational risk indicators with respect to corporate and personal credit businesses, which assists and drives branches’ evaluation of the operational risks;
– improvement in segregation of duties – The Group continues to improve and review the roles and responsibilities of its key staff positions to ensure adequate segregation of duties (responsibilities), further strengthening the system of checks and balances;
– steady progress in business continuity management – The Group conducts emergency operational drills in pilot branches, which improves the strategies and mechanisms of the Tier 2 institutions and networks in response to natural disasters;
– strengthening major risks and unforeseen events reporting process – The Group formalizes the supervision and monitoring over major risks and unforeseen events by prescribing the information recording and reporting processes. Clear information channels have also been established to increase the ability of the Group to address these risks and events;
– streamline and review of important system parameters – The Group continues to evaluate management system parameters and timely remediates deficiency to ensure secured and smooth system operations; and
– the Group has implemented laws, rules and regulations concerning anti-money laundering (AML). The Group continued to improve its internal control system relating to AML. The Group follows “know-your-customer” principle in identifying and recording customers’ identities and transactions diligently, and proactively identifies and reports significant, suspicious and suspected terrorist-related transactions. Training and publicity for AML has also been enhanced. All these measures are put in place to effectively fulfill the statutory AML obligations.
(5) Fair value
(a) Financial assets
The Group’s financial assets mainly include cash and deposits with central banks, deposits and placements with banks and non-bank financial institutions, financial assets at fair value through profit or loss, financial assets held under resale agreements, loans and advances to customers, available-for-sale financial assets, held-to-maturity investments and debt securities classified as receivables.
Deposits with central banks, deposits and placements with banks and non-bank financial institutions and financial assets held under resale agreements
Deposits with central banks, deposits and placements with banks and non-bank financial institutions and financial assets held under resale agreements are mainly priced at market interest rates and mature within one year. Accordingly, the carrying values approximate the fair values.
Loans and advances to customers
Majority of the loans and advances to customers are repriced at least annually to the market rate. Accordingly, their carrying values approximate the fair values.
Investments
Available-for-sale financial assets and financial assets at fair value through profit or loss are stated at fair value in the financial statements. The following table shows the carrying values and the fair values of the debt securities classified as receivables and held-to-maturity investments which are not presented in the statement of financial position at their fair values.

CHINA CONSTRUCTION BANK CORPORATION ANNUAL REPORT 2011
NOTES TO THE FINANCIAL STATEMENTS
(Expressed in millions of RMB, unless otherwise stated)
223
62 RISK MANAGEMENT (CONTINUED)(5) Fair value (continued)
(a) Financial assets (continued)Group
Carrying value Fair value
2011 2010 2011 2010
Debt securities classified as receivables 300,027 306,748 291,829 282,996
Held-to-maturity investments 1,743,569 1,884,057 1,753,842 1,864,881
Total 2,043,596 2,190,805 2,045,671 2,147,877
Bank
Carrying value Fair value
2011 2010 2011 2010
Debt securities classified as receivables 299,765 306,748 291,569 282,996
Held-to-maturity investments 1,742,342 1,883,927 1,752,585 1,864,751
Total 2,042,107 2,190,675 2,044,154 2,147,747
(b) Financial liabilities
The Group’s financial liabilities mainly include borrowings from central banks, deposits and placements from banks and non-bank financial institutions, financial liabilities at fair value through profit or loss, financial assets sold under repurchase agreements, deposits from customers, and debt securities issued. The carrying values of financial liabilities approximated their fair values as at the end of the reporting period, except that the fair value of subordinated bonds issued As at 31 December 2011 was RMB117,969 million (2010: RMB75,779 million), which was lower than their carrying value of RMB119,861 million (2010: RMB79, 901 million).
(6) Valuation of financial instruments
The Group measures fair values using the following fair value hierarchy that reflects the significance of the inputs used in making the measurements:
This category includes instruments valued using: quoted market prices in active markets for similar instruments; quoted prices for identical or similar instruments in markets that are considered less than active; or other valuation techniques where all significant inputs are directly or indirectly from market data.
valuation technique includes inputs not based on observable data and the unobservable inputs have a significant effect on the instrument’s valuation. This category includes instruments that are valued based on quoted prices for similar instruments where significant unobservable adjustments or assumptions are required to reflect differences between the instruments.

224 CHINA CONSTRUCTION BANK CORPORATION ANNUAL REPORT 2011
NOTES TO THE FINANCIAL STATEMENTS
(Expressed in millions of RMB, unless otherwise stated)
62 RISK MANAGEMENT (CONTINUED)(6) Valuation of financial instruments (continued)
The table below analyses financial instruments, measured at fair value at the end of the reporting period, by the level in the fair value hierarchy into which the fair value measurement is categorised:
Group
2011
Level 1 Level 2 Level 3 Total
Assets
Financial assets at fair value through profit or loss
Financial assets held for trading purpose
– Debt securities – 8,715 – 8,715
– Equity instruments and funds 549 – – 549
Financial assets designated as at fair value through profit or loss
– Debt securities 1,177 – 4,483 5,660
– Equity instruments 794 1,059 6,319 8,172
Positive fair value of derivatives – 11,709 2,418 14,127
Available-for-sale financial assets
– Debt securities 17,776 638,695 4,565 661,036
– Equity instruments and funds 10,499 1,118 552 12,169
Total 30,795 661,296 18,337 710,428
Liabilities
Financial liabilities at fair value through profit or loss
Financial liabilities designated as at fair value through profit or loss – 30,937 2,719 33,656
Negative fair value of derivatives – 10,860 2,450 13,310
Total – 41,797 5,169 46,966
2010
Level 1 Level 2 Level 3 Total
Assets
Financial assets at fair value through profit or loss
Financial assets held for trading purpose
– Debt securities 51 2,993 – 3,044
– Equity instruments and funds 1,541 – – 1,541
Financial assets designated as at fair value through profit or loss
– Debt securities 1,309 508 2,999 4,816
– Equity instruments 4,372 – 3,571 7,943
Positive fair value of derivatives – 8,763 2,461 11,224
Available-for-sale financial assets
– Debt securities 15,594 657,106 4,140 676,840
– Equity instruments and funds 16,666 400 374 17,440
Total 39,533 669,770 13,545 722,848
Liabilities
Financial liabilities at fair value through profit or loss
Financial liabilities designated as at fair value through profit or loss – 12,916 2,371 15,287
Negative fair value of derivatives – 7,212 2,146 9,358
Total – 20,128 4,517 24,645

CHINA CONSTRUCTION BANK CORPORATION ANNUAL REPORT 2011
NOTES TO THE FINANCIAL STATEMENTS
(Expressed in millions of RMB, unless otherwise stated)
225
62 RISK MANAGEMENT (CONTINUED)(6) Valuation of financial instruments (continued)
Bank
2011
Level 1 Level 2 Level 3 Total
Assets
Financial assets at fair value through profit or loss
Financial assets held for trading purpose
– Debt securities – 8,715 – 8,715
Positive fair value of derivatives – 10,707 2,366 13,073
Available-for-sale financial assets
– Debt securities 8,715 641,165 1,705 651,585
– Equity instruments and funds 10,064 34 62 10,160
Total 18,779 660,621 4,133 683,533
Liabilities
Financial liabilities at fair value through profit or loss
Financial liabilities designated as at fair value through profit or loss – 30,937 29 30,966
Negative fair value of derivatives – 9,992 2,362 12,354
Total – 40,929 2,391 43,320
2010
Level 1 Level 2 Level 3 Total
Assets
Financial assets at fair value through profit or loss
Financial assets held for trading purpose
– Debt securities 51 2,993 – 3,044
Positive fair value of derivatives – 8,033 2,120 10,153
Available-for-sale financial assets
– Debt securities 15,100 658,183 1,994 675,277
– Equity instruments and funds 15,952 – – 15,952
Total 31,103 669,209 4,114 704,426
Liabilities
Financial liabilities at fair value through profit or loss
Financial liabilities designated as at fair value through profit or loss – 12,916 24 12,940
Negative fair value of derivatives – 6,617 2,117 8,734
Total – 19,533 2,141 21,674
For the year ended 31 December 2011 and 2010, there were no significant transfer between level 1 and level 2 of the fair value hierarchy.

226 CHINA CONSTRUCTION BANK CORPORATION ANNUAL REPORT 2011
NOTES TO THE FINANCIAL STATEMENTS
(Expressed in millions of RMB, unless otherwise stated)
62 RISK MANAGEMENT (CONTINUED)(6) Valuation of financial instruments (continued)
The following table shows a reconciliation from the beginning balances to the ending balances for fair value measurement in level 3 of the fair value hierarchy:
Group
2011
Financial assets designated
as at fair value through profit or loss
Positive fair
value of derivatives
Available-for-sale financial assets
Total assets
Financial liabilities
designated as at
fair value through
profit or loss
Negative fair
value of derivatives
Total liabilities
Debt securities
Equity instruments and funds
Debt securities
Equity instruments and funds
As at 1 January 2011 2,999 3,571 2,461 4,140 374 13,545 (2,371) (2,146) (4,517)
Total gains or losses:
In profit or loss (330) 129 93 370 – 262 (48) (436) (484)
In other comprehensive income – – – (266) (28) (294) – – –
Purchases 3,091 3,244 35 2,085 207 8,662 (655) (88) (743)
Sales and settlements (1,277) (625) (193) (1,860) (1) (3,956) 355 191 546
Transfer in/out – – 22 96 – 118 – 29 29
As at 31 December 2011 4,483 6,319 2,418 4,565 552 18,337 (2,719) (2,450) (5,169)
Total gains or losses for the period included in profit or loss for
assets and liabilities held at the end of the reporting period (334) 129 631 370 – 796 (48) (1,027) (1,075)
2010
Financial assets designated
as at fair value through profit or loss
Positive fair
value of derivatives
Available-for-sale financial assets
Total assets
Financial liabilities
designated as at
fair value through
profit or loss
Negative fair
value of derivatives
Total liabilities
Debt securities
Equity instruments and funds
Debt securities
Equity instruments and funds
As at 1 January 2010 2,480 2,510 4,034 2,834 704 12,562 (29) (3,085) (3,114)
Total gains or losses:
In profit or loss 143 (1,449) (603) 244 – (1,665) (31) 386 355
In other comprehensive income – – – 193 60 253 – – –
Purchases 3,236 2,510 – 2,146 140 8,032 (2,311) – (2,311)
Sales and settlements (2,860) – (829) (1,212) (530) (5,431) – 547 547
Transfer out – – (141) (65) – (206) – 6 6
As at 31 December 2010 2,999 3,571 2,461 4,140 374 13,545 (2,371) (2,146) (4,517)
Total gains or losses for the period included in profit or loss for
assets and liabilities held at the end of the reporting period (61) (1,449) (152) 244 – (1,418) (31) (64) (95)

CHINA CONSTRUCTION BANK CORPORATION ANNUAL REPORT 2011
NOTES TO THE FINANCIAL STATEMENTS
(Expressed in millions of RMB, unless otherwise stated)
227
62 RISK MANAGEMENT (CONTINUED)(6) Valuation of financial instruments (continued)
Bank
2011
Positive fair value of derivatives
Available-for-sale financial assets
Total assets
Financial liabilities
designated as at fair value
through profit or loss
Negative fair value of derivatives
Total liabilitiesDebt securities
Equity instruments
and funds
As at 1 January 2011 2,120 1,994 – 4,114 (24) (2,117) (2,141)Total gains or losses: In profit or loss 437 370 – 807 (5) (436) (441) In other comprehensive income – (262) 8 (254) – – –Purchases 2 – 54 56 – – –Sales and settlements (193) (493) – (686) – 191 191Transfer in – 96 – 96 – – –
As at 31 December 2011 2,366 1,705 62 4,133 (29) (2,362) (2,391)
Total gains or losses for the period included in profit or
loss for assets and liabilities held at the end of the reporting period 601 370 – 971 (5) (598) (603)
2010
Positive fair value of derivatives
Available- for-sale
debt securities Total assets
Financial liabilities
designated as at fair value
through profit or loss
Negative fair value of derivatives
Total liabilities
As at 1 January 2010 3,064 2,834 5,898 (29) (3,056) (3,085)Total gains or losses: In profit or loss (387) 244 (143) 5 394 399 In other comprehensive income – 193 193 – – –Sales and settlements (549) (1,212) (1,761) – 545 545Transfer out (8) (65) (73) – – –
As at 31 December 2010 2,120 1,994 4,114 (24) (2,117) (2,141)
Total gains or losses for the period included in profit or loss for assets and liabilities held
at the end of the reporting period 64 244 308 5 (57) (52)
In Level 3 of the fair value hierarchy, total gains or losses included in profit or loss for the year in the above table are presented in net trading gain, net gain arising from investment securities and impairment losses of the statement of comprehensive income.
(7) Capital managementThe Group has implemented a comprehensive capital management policy, covering the management of regulatory capital, economic capital and accounting capital, including but not limited to management of capital adequacy ratio, capital planning, capital raising and economic capital.
Capital adequacy ratio is a reflection of the Group’s ability to run stable operations and resist adverse risks. The CBRC requires commercial banks to maintain the capital adequacy ratio at or above minimum of 8% and the core capital adequacy ratio at or above minimum of 4%. Supplementary capital of a commercial bank cannot exceed 100% of its core capital, and long-term subordinated debts qualified for inclusion in the supplementary capital cannot exceed 50% of the core capital. Any amount in excess of the balance of the trading book over 10% of total on and off-balance sheet assets or RMB8,500 million will be subject to provision for market risk in the computation of capital adequacy ratio. The Group timely monitors, analyses and reports capital adequacy ratio level to exercise effective management of capital adequacy ratio. The Group adopts various measures such as controlling asset growth, adjusting the structure of risk assets, accumulating capital internally and raising capital through external channels, to ensure that the capital adequacy ratio and core capital adequacy ratio of the Group and the Bank are in full compliance with regulatory requirements and meet internal management needs. This helps insulate against potential risks as well as support the healthy business development. The Group now fully complies with all regulatory requirements in this respect.
The Group’s capital planning has taken the regulatory requirements, the Group’s development strategy and risk appetite into consideration, and based on those factors the Group projects the capital usage and need. The Group regularly compares its position with its capital adequacy ratio target to ensure capital will be adequate for future or otherwise to plan for supplementation of capital.
The capital raising management of the Group involves reasonable utilisation of various capital instruments to ensure that both external regulatory and internal capital management objectives are met, taking in account capital planning and operating environment. This helps to optimize the Group’s total capital and structure, as well as improve the competitiveness of the Group’s cost of capital.

228 CHINA CONSTRUCTION BANK CORPORATION ANNUAL REPORT 2011
NOTES TO THE FINANCIAL STATEMENTS
(Expressed in millions of RMB, unless otherwise stated)
62 RISK MANAGEMENT (CONTINUED)(7) Capital management (continued)
The Group’s consolidated regulatory capital positions calculated in accordance with the guidance issued by the CBRC as at the end of the reporting period are as follows:
Note 2011 2010
Core capital adequacy ratio (a) 10.97% 10.40%
Capital adequacy ratio (b) 13.68% 12.68%
Components of capital base
Core capital:
– Share capital 250,011 250,011
– Capital reserve, investment revaluation reserve and exchange reserve (c) 130,562 127,536
– Surplus reserve and general reserve 134,918 112,028
– Retained earnings (c),(d) 229,649 140,995
– Non-controlling interests 5,520 4,113
750,660 634,683
Supplementary capital:
– General provision for doubtful debts 66,180 57,359
– Positive changes in fair value of financial instruments at fair value through profit or loss 3,675 7,547
– Subordinated bonds issued 120,000 80,000
189,855 144,906
Total capital base before deductions 940,515 779,589
Deductions:
– Goodwill (1,662) (1,534)
– Unconsolidated equity investments (12,402) (13,695)
– Others (e) (1,945) (1,911)
Net capital 924,506 762,449
Risk-weighted assets (f) 6,760,117 6,015,329
Notes:
(a) Core capital adequacy ratio is calculated by dividing the net amount of core capital, which is after deductions of 100% of goodwill and 50% of unconsolidated equity investments, and other items, by risk-weighted assets.
(b) Capital adequacy ratio is calculated by dividing the net capital by risk-weighted assets.
(c) The investment revaluation reserve arising from the accumulated net positive changes in the fair value of available-for-sale financial assets is excluded from the core capital and 50% of the balance is included in the supplementary capital. In addition, the unrealised accumulated net positive changes in fair value of financial instruments at fair value through profit or loss, net of income tax, are excluded from the core capital and included in the supplementary capital.
(d) The dividend proposed after the reporting period has been deducted from retained earnings.
(e) Others mainly represent investments in those asset backed securities specified by CBRC which required reduction.
(f) The balances of risk-weighted assets include an amount equal to 12.5 times the Group’s market risk capital.

CHINA CONSTRUCTION BANK CORPORATION ANNUAL REPORT 2011
NOTES TO THE FINANCIAL STATEMENTS
(Expressed in millions of RMB, unless otherwise stated)
229
63 EVENTS AFTER THE REPORTING PERIODThere are no significant events after the reporting period.
64 COMPARATIVE FIGURESCertain comparative figures have been adjusted to conform with changes in disclosures in current year.
65 ULTIMATE PARENTAs stated in Note 1, the immediate and ultimate parent of the Group is Huijin and CIC respectively.
66 POSSIBLE IMPACT OF AMENDMENTS, NEW STANDARDS AND INTERPRETATIONS ISSUED BUT NOT YET EFFECTIVEUp to the date of issue of the financial statements, the IASB has issued the following amendments, new standards and interpretations which are not yet effective for the year ended 31 December 2011 and which have not been adopted in the these financial statements.
The Group is in the process of making assessment of what the impact of these amendments is expected to be in the period of initial application. So far it has concluded that the adoption of them is unlikely to have a significant impact on the Group’s results of operations and financial position except for IFRS 9, Financial instruments, which may have an impact on the Group’s results and financial position.

230 CHINA CONSTRUCTION BANK CORPORATION ANNUAL REPORT 2011
UNAUDITED SUPPLEMENTARY FINANCIAL INFORMATION
(Expressed in millions of RMB, unless otherwise stated)
The following information of the Group does not form part of the audited financial statements, and is included herein for information purposes only.
1 DIFFERENCE BETWEEN THE FINANCIAL STATEMENTS PREPARED UNDER IFRS AND THOSE PREPARED IN ACCORDANCE WITH PRC GAAPChina Construction Bank Corporation (the “Bank”) prepares consolidated financial statements, which include the financial statements of the Bank and its subsidiaries (collectively the “Group”), in accordance with International Financial Reporting Standards (“IFRS”) and its interpretations promulgated by the International Accounting Standards Board and the applicable disclosure provisions of the Rules Governing the Listing of Securities on The Stock Exchange of Hong Kong Limited.
As a financial institution incorporated in the People’s Republic of China (the “PRC”) and listed in the Shanghai Stock Exchange, the Group also prepares its consolidated financial statements for the year ended 31 December 2011 in accordance with the Accounting Standards for Business Enterprises and other relevant regulations issued by the regulatory bodies of the PRC (collectively “PRC GAAP and regulations”).
There is no difference in the net profit for the year ended 31 December 2011 or total equity as at 31 December 2011 between the Group’s consolidated financial statements prepared under IFRS and those prepared under PRC GAAP and regulations respectively.
2 LIQUIDITY RATIOS
As at 31 December
2011
Average for the year ended
31 December 2011
As at 31 December
2010
Average for the year ended 31 December
2010
RMB current assets to RMB current liabilities 53.70% 52.33% 51.96% 51.66%
Foreign currency current assets to foreign currency current liabilities 53.54% 51.40% 57.20% 55.70%
The above liquidity ratios are calculated in accordance with the formula promulgated by the China Banking Regulatory Commission.
The Hong Kong Banking (Disclosure) Rules (the “Rules”) took effect on 1 January, 2007. It requires the disclosure of average liquidity ratio, which being the arithmetic mean of each calendar month’s liquidity ratio. The Group prepared liquidity ratio on a semi-annual basis and the disclosed average liquidity ratio is the arithmetic mean of two consecutive liquidity ratios as at 30 June and 31 December.
3 CURRENCY CONCENTRATIONS2011
USD (RMB
equivalent)
HKD (RMB
equivalent)
Others (RMB
equivalent) Total
Spot assets 358,091 181,021 119,685 658,797
Spot liabilities (276,244) (179,624) (139,599) (595,467)
Forward purchases 303,678 11,648 107,787 423,113
Forward sales (383,693) (3,648) (79,593) (466,934)
Net long position 1,832 9,397 8,280 19,509
Net structural position 15 (74) 64 5
2010
USD (RMB
equivalent)
HKD (RMB
equivalent)
Others (RMB
equivalent) Total
Spot assets 308,292 130,700 93,394 532,386
Spot liabilities (225,572) (125,218) (86,053) (436,843)
Forward purchases 254,778 25,861 60,516 341,155
Forward sales (320,109) (11,472) (64,283) (395,864)
Net long position 17,389 19,871 3,574 40,834
Net structural position 22 173 167 361

CHINA CONSTRUCTION BANK CORPORATION ANNUAL REPORT 2011
(Expressed in millions of RMB, unless otherwise stated)
231
UNAUDITED SUPPLEMENTARY FINANCIAL INFORMATION
3 CURRENCY CONCENTRATIONS (CONTINUED)The net option position is calculated using the delta equivalent approach required by the Hong Kong Monetary Authority (the “HKMA”). The net structural position of the Group includes the structural positions of the Bank’s overseas branches, banking subsidiaries and other subsidiaries substantially involved in foreign exchange. Structural assets and liabilities include:
– investments in property and equipment, net of accumulated depreciation;
– capital and statutory reserves of overseas branches; and
– investments in overseas subsidiaries and related companies.
4 CROSS-BORDER CLAIMSThe Group is principally engaged in business operations within Mainland China, and regards all claims on overseas third parties as cross-border claims.
For the purpose of this unaudited supplementary financial information, Mainland China excludes Hong Kong Special Administrative Region of the PRC (“Hong Kong”), Macau Special Administrative Region of the PRC (“Macau”) and Taiwan.
Cross-border claims include loans and advances to customers, deposits and placements with banks and non-bank financial institutions, holdings of trade bills and certificates of deposit and investment securities.
Cross-border claims have been disclosed by country or geographical area. A country or geographical area is reported where it constitutes 10% or more of the aggregate amount of cross-border claims, after taking into account any risk transfers. Risk transfers are only made if claims are guaranteed by a party in a country which is different from that of the counterparty or if claims are on an overseas branch of a bank whose head office is located in another country.
2011
Banks and non-bank financial
institutions
Public sector
entities Others Total
Asia Pacific excluding Mainland China 19,327 675 171,002 191,004
– of which attributed to Hong Kong 12,190 – 142,388 154,578
Europe 3,390 112 66,528 70,030
North and South America 24,361 84 57,448 81,893
Total 47,078 871 294,978 342,927
2010
Banks and non-bank financial
institutions
Public sector
entities Others Total
Asia Pacific excluding Mainland China 43,815 758 114,959 159,532
– of which attributed to Hong Kong 34,712 670 83,822 119,204
Europe 15,738 134 32,845 48,717
North and South America 35,377 1,068 18,927 55,372
Total 94,930 1,960 166,731 263,621
The above cross-border claims are disclosed in accordance with the requirements of the Rules. According to these requirements, “others” includes the transactions with sovereign counterparties.

232 CHINA CONSTRUCTION BANK CORPORATION ANNUAL REPORT 2011
(Expressed in millions of RMB, unless otherwise stated)
UNAUDITED SUPPLEMENTARY FINANCIAL INFORMATION
5 OVERDUE LOANS AND ADVANCES TO CUSTOMERS BY GEOGRAPHICAL SECTOR2011 2010
Yangtze River Delta 8,361 9,152
Bohai Rim 6,596 6,894
Central 6,331 5,992
Pearl River Delta 5,056 5,278
Western 3,789 5,246
Northeastern 3,116 3,345
Head office 1,736 1,619
Overseas 192 122
Total 35,177 37,648
The above analysis represents the gross amount of loans and advances overdue for more than 90 days as required by the Rules.
Loans and advances with a specific repayment date are classified as overdue when the principal or interest is overdue.
Loans and advances repayable on demand are classified as overdue when a demand for repayment has been served on the borrower but repayment has not been made in accordance with the instructions. If the loans and advances repayable on demand are outside the approved limit that was advised to the borrower, they are also considered as overdue.
6 NON-BANK MAINLAND CHINA EXPOSUREThe Bank is a commercial bank incorporated in Mainland China with its banking business primarily conducted in Mainland China. As at 31 December 2011, substantial amounts of the Bank’s exposures arose from businesses with Mainland China entities or individuals. Analyses of various types of exposures by counterparty have been disclosed in the respective notes to the financial statements.

CHINA CONSTRUCTION BANK CORPORATION ANNUAL REPORT 2011
ORGANISATIONAL STRUCTURE
233
CC
B’S
MA
NA
GE
ME
NT
STR
UC
TUR
E
Share
hold
ers
’ G
enera
l M
eeting
Board
of D
irecto
rsB
oard
of S
up
erv
isors
Board
of
Directo
rs O
ffice
Board
of
Sup
erv
isors
Offi
ce
Str
ate
gy D
evelo
pm
ent
Com
mitte
eA
ud
it C
om
mitte
eR
isk M
anagem
ent
Com
mitte
e
Nom
ination a
nd
Com
pensation
Com
mitte
e
Rela
ted
Part
yTra
nsactions C
om
mitte
eP
erf
orm
ance a
nd
Due D
iligence
Sup
erv
isio
n C
om
mitte
eFin
ance a
nd
Inte
rnal C
ontr
ol
Sup
erv
isio
n C
om
mitte
e
Pre
sid
ent
Asset
and
Lia
bility
C
om
mitte
e
Inte
rnal C
ontr
ol
Managem
ent
Com
mitte
e
Corp
ora
te a
nd
In
stitu
tional
Bankin
g C
om
mitte
e
Pers
onal B
ankin
gC
om
mitte
e
Inve
stm
ent
and
Wealth M
anagem
ent
Bankin
g C
om
mitte
e
Info
rmation
Technolo
gy
Com
mitte
e
Hum
an R
esourc
es
and
Cost
Contr
ol C
om
mitte
e
Executive Office
Human Resources Department
Asset & Liability Management Department
Finance & Accounting Department
Treasury Management & Settlement Department
Procurement Department
Information Centre
Risk Management Department
Credit Management Department
Audit Department
Research Department
Equity Investment and StrategicCooperation Department
Corporate Banking Department
Group Clients Department
Institutional Banking Department
International Business Department
Custody & Investor Services Department
Pension Business Department
Personal Deposit and Investment Department
Wealth Management and Private Banking Department
Housing Finance & Personal Lending Department
Credit Card Centre
Small Enterprise BankingDepartment
Financial Market Department
Investment Banking Department
Special Assets Resolution Department
Information Technology Management Department
Operation Management Department
Electronic Banking Department
Product and Quality Management Department
Legal and Compliance Department
Disciplinary & Supervisory Department
Security Department
Public Relations & Corporate Culture Department
Logistics Department
Bra
nches a
t P
rovin
ce a
nd
Auto
no
mo
us R
eg
ion L
evel
Sub
-bra
nches a
t U
rban D
istr
ict/
Co
unty
Level,
Sub
-op
era
ting
Offi
ces,
Dep
osit-t
akin
g O
ffices
Bra
nches a
t M
unic
ipalit
ies D
irectly
und
er
the C
entr
al G
overn
ment
Sub
-bra
nches a
t U
rban D
istr
ict/
Co
unty
Level,
Sub
-op
era
ting
Offi
ces,
Dep
osit-t
akin
g O
ffices
Bra
nches a
t S
pecia
l-Lis
ted
City
Sub
-bra
nches a
t U
rban D
istr
ict/
Co
unty
Level,
Sub
-op
era
ting
Offi
ces,
Dep
osit-t
akin
g O
ffices
Overs
eas B
ranches a
nd
R
ep
resenta
tive O
ffices

234 CHINA CONSTRUCTION BANK CORPORATION ANNUAL REPORT 2011
ORGANISATIONAL STRUCTURE
CC
B’S
EQ
UIT
Y I
NV
ES
TME
NT
STR
UC
TUR
E
Dom
estic S
ub
sid
iaries
Overs
eas S
ub
sid
iaries
CC
B O
vers
eas
Hold
ings L
imited
(100%
)
Lanhye Investm
ent
Hold
ings L
imited
(100%
)
CC
B F
inancia
l
Hold
ings L
imited
(100%
)
CC
B P
rop
ert
ies
Hold
ings L
imited
(100%
)
Chin
a C
onstr
uctio
n B
ank
(Asia
) C
orp
ora
tion L
imite
d
(100%
)
Lanhua Investm
ent
Lim
ited
(100%
)
CC
B Inte
rnational
(Hold
ings) Lim
ited
(100%
)
CC
B P
rop
ert
ies (H
ong
Ko
ng) H
old
ings L
imited
(100%
)
CC
B P
rincip
al A
sset
Managem
ent
Co., L
td.
(65%
)
CC
B F
inancia
l Leasin
g
Corp
ora
tion L
imited
(75.1
%)
Sin
o-G
erm
an
Bausp
ark
asse C
o.,
Ltd
.
(75.1
%)
CC
B T
rust
Co., L
td.
(67%
)
CC
B L
ife Insura
nce
Com
pany L
imited
.
(51%
) R
ura
l B
anks
1
Chin
a C
onstr
uction
Bank C
orp
ora
tio
n
CC
B Inte
rnational
Gro
up
Hold
ings L
imited
(100%
)
Sin
g J
ian D
evelo
pm
ent
Com
pany L
imited
(100%
)
Chin
a C
onstr
uction B
ank
(Lond
on) Lim
ited
(100%
)
1.
As
at 3
1 D
ecem
ber
2011
, the
Ban
k ha
d se
t up
16 r
ural
ban
ks in
tota
l, na
mel
y, H
unan
Tao
jiang
Jia
nxin
Rur
al B
ank
Cor
pora
tion
Lim
ited,
Zhe
jiang
Can
gnan
Jia
nxin
Rur
al B
ank
Cor
pora
tion
Lim
ited,
Zhe
jiang
Qin
gtia
n Jia
nxin
Ove
rsea
-Chi
nese
Rur
al B
ank
Com
pany
Li
mite
d, Z
hejia
ng W
uyi J
ianx
in R
ural
Ban
k C
ompa
ny L
imite
d, A
nhui
Fan
chan
g Jia
nxin
Rur
al B
ank
Com
pany
Lim
ited,
Sha
anxi
Ans
ai J
ianx
in R
ural
Ban
k C
ompa
ny L
imite
d, H
ebei
Fen
gnin
g Jia
nxin
Rur
al B
ank
Com
pany
Lim
ited,
Sha
ngha
i Pud
ong
Jianx
in R
ural
Ban
k C
ompa
ny L
imite
d, S
uzho
u C
hang
shu
Jianx
in R
ural
Ban
k C
ompa
ny L
imite
d, J
iang
su H
aim
en J
ianx
in R
ural
Ban
k C
ompa
ny L
imite
d, J
iang
su T
aixin
g Jia
nxin
Rur
al B
ank
Com
pany
Lim
ited,
Zhe
jiang
Jia
ngsh
an J
ianx
in R
ural
Ban
k C
ompa
ny L
imite
d, N
ingb
o C
ixi J
ianx
in
Rur
al B
ank
Com
pany
Lim
ited,
Nin
gbo
Nin
ghai
Jia
nxin
Rur
al B
ank
Com
pany
Lim
ited,
Hen
an X
inye
Jia
nxin
Rur
al B
ank
Com
pany
Lim
ited,
Sha
ndon
g Te
ngzh
ou J
ianx
in R
ural
Ban
k C
ompa
ny L
imite
d.

CHINA CONSTRUCTION BANK CORPORATION ANNUAL REPORT 2011
BRANCHES AND SUBSIDIARIES
235
TIER-ONE BRANCHES IN MAINLAND CHINABranches Address Telephone Facsimile
Anhui Branch No. 255, Huizhou Road, Hefei (0551) 2874100 (0551) 2872014Postcode: 230001
Beijing Branch No. 4, Building 28, Xuanwumen West Street, Beijing (010) 63603682 (010) 63603656Postcode: 100053
Chongqing Branch No. 123, Minzu Road, Yuzhong District, Chongqing (023) 63771855 (023) 63771835Postcode: 400010
Dalian Branch No. 1, Jiefang Street, Zhongshan District, Dalian (0411) 88066666 (0411) 82804560Postcode: 116001
Fujian Branch No. 142, Guping Road, Fuzhou (0591) 87838467 (0591) 87856865Postcode: 350003
Gansu Branch No. 77, Qin’an Road, Lanzhou (0931) 4891555 (0931) 4891862Postcode: 730030
Guangdong Branch No. 509, Dongfengzhong Road, Guangzhou (020) 83018888 (020) 83013950Postcode: 510045
Guangxi Branch No. 92, Minzu Road, Nanning (0771) 5513110 (0771) 5513012Postcode: 530022
Guizhou Branch No. 56, Zhonghua North Road, Guiyang (0851) 6696000 (0851) 6696377Postcode: 550001
Hainan Branch CCB Plaza, Guomao Avenue, Haikou (0898) 68587268 (0898) 68587569Postcode: 570125
Hebei Branch No. 40, Ziqiang Road, Shijiazhuang (0311) 87888866 (0311) 88601001Postcode: 050000
Henan Branch No. 80, Huayuan Road, Zhengzhou (0371) 65556699 (0371) 65556688Postcode: 450003
Heilongjiang Branch No. 67, Hongjun Street, Nan’gang District, Harbin (0451) 53619788 (0451) 53625552Postcode: 150001
Hubei Branch No. 709, Jianshe Street, Wuhan (027) 65775888 (027) 65775881Postcode: 430015
Hunan Branch Yin’gang Plaza, No. 2, Baisha Road, Changsha (0731) 84419192 (0731)84419141Postcode: 410005
Jilin Branch No. 810, Xi’an Road, Changchun (0431) 88573030 (0431) 88988748Postcode: 130061
Jiangsu Branch No. 188, Hongwu Road, Nanjing (025) 84200545 (025) 84209316Postcode: 210002
Jiangxi Branch No. 366, Bayi Street, Nanchang (0791) 86848200 (0791) 86848318Postcode: 330006
Liaoning Branch No. 176, Zhongshan Road, Heping District, Shenyang (024) 22787600 (024) 22856915Postcode: 110002
Inner Mongolia Branch No. 9, Zhao Wuda Street, Huhhot (0471) 6200256 (0471) 6200257Postcode: 010010
Ningbo Branch No. 31, Guangji Street, Ningbo (0574) 87313888 (0574) 87325019Postcode: 315010

236 CHINA CONSTRUCTION BANK CORPORATION ANNUAL REPORT 2011
BRANCHES AND SUBSIDIARIES
Branches Address Telephone Facsimile
Ningxia Branch No. 98, Nanxun West Road, Yinchuan (0951) 4126111 (0951) 4106165Postcode: 750001
Qingdao Branch Tower A, Qingdao International Finance Plaza, No. 222, Shenzhen Road, Qingdao
(0532) 68671888 (0532) 82670157
Postcode: 266061
Qinghai Branch No. 59, West Street, Xining (0971) 8261181 (0971) 8261225Postcode: 810000
Three Gorges Branch No. 1, Xiling First Road, Yichang, Hubei (0717) 6736888 -3515 (0717) 6738137Postcode: 443000
Shandong Branch No. 178, Luoyuan Street, Jinan (0531) 82088108 (0531) 86169108Postcode: 250012
Shaanxi Branch No. 38, South Guangji Street, Xi’an (029) 87617515 (029) 87617514Postcode: 710002
Shanxi Branch No. 126, Yingze Street, Taiyuan (0351) 4957800 (0351) 4957871Postcode: 030001
Shanghai Branch No.900, Lujiazui Ring Road, Shanghai (021) 58880000 (021) 58781818Postcode: 200120
Shenzhen Branch A Section, Rongchao Business Center, 6003 Yitian Road, Futian District, Shenzhen
(0755) 23828888 (0755) 23828111
Postcode: 518026
Sichuan Branch Sichuan CCB Building, No. 86, Tidu Street, Chengdu (028) 86767161 (028) 86767187Postcode: 610016
Suzhou Branch No. 18, Suhua Road, Suzhou Industrial Park, Suzhou (0512) 62788786 (0512) 62788783Postcode: 215021
Tianjin Branch Plus 1 No. 19, Nanjing Road, Hexi District, Tianjin (022) 23401166 (022) 23401811Postcode: 300203
Xiamen Branch No. 98, Lujiang Road, Xiamen (0592) 2158888 (0592) 2158862Postcode: 361003
Tibet Branch No. 21, Beijing West Road, Lhasa (0891) 6838792 (0891) 6836818Postcode: 850008
Xinjiang Branch No. 99, Minzhu Road, Urumqi (0991) 2848666 (0991) 2819160Postcode: 830002
Yunnan Branch CCB Plaza, No. 306, Jinbi Road, Kunming (0871) 3060997 (0871) 3060333Postcode: 650021
Zhejiang Branch No. 33, Jiefang East Road, Hangzhou (0571) 85313263 (0571) 85313001Postcode: 310016
BRANCHES AND REPRESENTATIVE OFFICES OUTSIDE MAINLAND CHINAFrankfurt Branch Bockenheimer Landstrasse 51-53,
60325 Frankfurt am Main, GermanyTelephone : (49) 69-9714950Facsimile : (49) 69-97149588, 97149577Website : www.ccbff.de
Ho Chi Minh City Branch 1105-1106 Sailing Tower, 111A Pasteur Street, District 1, Ho Chi Minh City, VietnamTelephone : (84) 8 382 95533Facsimile : (84) 8 382 75533

CHINA CONSTRUCTION BANK CORPORATION ANNUAL REPORT 2011 237
BRANCHES AND SUBSIDIARIES
Hong Kong Branch 12/F, AIA Central, 1 Connaught Road Central, Central, Hong KongTelephone : (852) 28684438Facsimile : (852) 25377182Website : www.ccbhk.com
Johannesburg Branch 95 Grayston Drive, Morningside,Sandton, South Africa 2196Telephone : (27) 11-5209400Facsimile : (27) 11-5209411Website : www.ccbjhb.com
Moscow Representative Office Testovskaya Street 10, 11 floor, block 19-2, 123317 Moscow RussiaTelephone : (7)-495-6606555Facsimile : (7)-495-7950711
New York Branch 33rd Floor, 1095 Avenue of the Americas,New York, USANY 10018Telephone : (1) 212-207-8188Facsimile : (1) 212-207-8288
Seoul Branch 7th Floor, Seoul Finance Centre,84 Taepyungro 1-GA, Chung-gu, Seoul 100-768, KoreaTelephone : (82) 2-67301718Facsimile : (82) 2-67301701Website : www.ccbseoul.com
Singapore Branch 9 Raffles Place, #33-01/02,Republic Plaza, Singapore 048619Telephone : (65) 65358133Facsimile : (65) 65356533Website : www.ccb.com.sg
Sydney Branch Level 33, Deutsche Bank Place, 126 Phillip Street, Sydney,NSW 2000, Australia
Telephone : (61) 2-80316100Facsimile : (61) 2-92239099
Taipei Representative Office 2/F-A3,No.106,Sec.5,Xinyi Road,Xinyi Dist., TaipeiTelephone : (886)-2-87292008Facsimile : (886)-2-27235399
Tokyo Branch Toranomon 2, Chome Building 8F,2-3-17 Toranomon Minatoku, Tokyo 105-0001, JapanTelephone : (81) 3-5511-0188Facsimile : (81) 3-5511-0189Website : www.ccbtokyo.com
SUBSIDIARIESCCB Principal Asset Management Co., Ltd. 16/F, Winland International Finance Centre, No. 7, Financial Street, Xicheng District, Beijing
Postcode : 100033Telephone : (010) 66228888Facsimile : (010) 66228889Website : www.ccbfund.cn
CCB Financial Leasing Corporation Limited 6/F, 1-4, Naoshikou Street, Xicheng District, Beijing, ChinaPostcode : 100031Telephone : (010) 67594013Facsimile : (010) 66275808/9Website : www.ccbleasing.com

238 CHINA CONSTRUCTION BANK CORPORATION ANNUAL REPORT 2011
BRANCHES AND SUBSIDIARIES
CCB Life Insurance Company Limited 8/F, Gc Tower, No.1088 Yuanshen Road, Pudong New District, ShanghaiPostcode : 200122Telephone : (021) 38991666Facsimile : (021) 33922185Website : www.ccb-life.com.cn
CCB Trust Co., Limited No. 45, Jiushiqiao Street, Hefei, Anhui ProvincePostcode : 230001Telephone : (0551) 5295555Facsimile : (0551) 2679542Website : www.ccbtrust.com.cn
CCB International (Holdings) Limited 35/F, Two Pacific Place, 88 Queensway, Admiralty, Hong KongTelephone : (852) 25326100Facsimile : (852) 25301496Website : www.ccbintl.com
Sino-German Bausparkasse Co. Ltd. No.19 Guizhou Road, Heping District, TianjinPostcode : 300051Telephone : (022) 58086699Facsimile : (022) 58086808Website : www.sgb.cn
China Construction Bank (London) Limited 18/F, 40 Bank Street, Canary Wharf, London E145NR, UKTelephone : (0044) 207-0386000Facsimile : (0044) 207-0386001
China Construction Bank (Asia) Corporation Limited 16/F, York House, The Landmark, 15 Queen’s Road Central, Central, Hong KongTelephone : (852) 37182288Facsimile : (852) 37182019Website : www.asia.ccb.com
Anhui Fanchang Jianxin Rural Bank Company Limited 1/F, Oversea-Chinese International Hotel, Fanyang Town, Fanchang County, Anhui ProvincePostcode : 241200Telephone : (0553) 7853939Facsimile : (0553) 7853939
Hebei Fengning Jianxin Rural Bank Company Limited No.5-7, Fengheyuan Community, Xinfeng Road, Dage Town, Fengning County, Hebei ProvincePostcode : 068350Telephone : (0314) 5975005Facsimile : (0314) 5975005
Henan Xinye Jianxin Rural Bank Company Limited North Chaoyang Road, Xinye County, Henan ProvincePostcode : 473500Telephone : (0377) 60917789Facsimile : (0377) 60917111
Hunan Taojiang Jianxin Rural Bank Corporation Limited Junction of Furong Road and Taohui Road, Taohuajiang Town, Taojiang County, Hunan ProvincePostcode : 413400Telephone : (0737) 8213820Facsimile : (0737) 8213820
Jiangsu Haimen Jianxin Rural Bank Company Limited No.248, Middle Jiefang Road, Haimen Town, Haimen City, Jiangsu ProvincePostcode : 226100Telephone : (0513) 81262289Facsimile : (0513) 81262292
Jiangsu Taixing Jianxin Rural Bank Company Limited No.177, Zhongxing Avenue, Taixing City, Jiangsu ProvincePostcode : 225400Telephone : (0523) 80737889Facsimile : (0523) 87091017

CHINA CONSTRUCTION BANK CORPORATION ANNUAL REPORT 2011 239
BRANCHES AND SUBSIDIARIES
Ningbo Cixi Jianxin Rural Bank Company Limited No.311, Sanbei Road and No.2-10, Xianjing Road, Shigongshan Village, Longshan Town, Cixi County, Ningbo City, Zhejiang ProvincePostcode : 315311Telephone : (0574) 63993505Facsimile : (0574) 63993506
Ningbo Ninghai Jianxin Rural Bank Company Limited No.115, Binhai Road, Xidian Town, Ninghai County, Ningbo City, Zhejiang ProvincePostcode : 315613Telephone : (0574) 82535268Facsimile : (0574) 82535268
Shandong Tengzhou Jianxin Rural Bank Company Limited No.42, North Shanguo Road, Tengzhou City, Shandong ProvincePostcode : 277500Telephone : (0632) 3598159Facsimile : (0632) 3598159
Shaanxi Ansai Jianxin Rural Bank Company Limited Chengbei District, Ansai County, Shanxi ProvincePostcode : 717400Telephone : (0911) 6211077Facsimile : (0911) 6211077
Shanghai Pudong Jianxin Rural Bank Company Limited No.26, Beishi Street, Chuansha Town, Pudong New District, ShanghaiPostcode : 201200Telephone : (021) 58385938Facsimile : (021) 58385938
Suzhou Changshu Jianxin Rural Bank Company Limited No.33, North Haiyu Road, Changshu City, Jiangsu ProvincePostcode : 215500Telephone : (0512) 51910526Facsimile : (0512) 51910526
Zhejiang Cangnan Jianxin Rural Bank Corporation Limited No.102-104, Building No.2, Yihe City Homeland, Yucang Road, Lingxi Town, Cangnan County, Zhejiang ProvincePostcode : 325800Telephone : (0577) 68857896Facsimile : (0577) 68857893
Zhejiang Jiangshan Jianxin Rural Bank Company Limited No.56, the First Street, South Hushan Street, Jiangshan County, Zhejiang ProvincePostcode : 324100Telephone : (0570) 4037899Facsimile : (0570) 4037895
Zhejiang Qingtian Jianxin Oversea-Chinese Rural Bank Company Limited
Building A, Shenghua Business Square, No.59-75, Shengzhi Street, Qingtian County,Zhejiang ProvincePostcode : 323900Telephone : (0578) 6812966Facsimile : (0578) 6812910
Zhejiang Wuyi Jianxin Rural Bank Company Limited 1/F, No.4 Area, Bussiness Hall, Jiefang Middle Street, Wuyi County, Zhejiang ProvincePostcode : 321200Telephone : (0579) 87679091Facsimile : (0579) 87679091
Sing Jian Development Company Limited 11/F, Devon House, 979 King’s Road, Hong KongTelephone : (852) 37182797Facsimile : (852) 37182799

240 CHINA CONSTRUCTION BANK CORPORATION ANNUAL REPORT 2011
DEFINITIONS
In this annual report, unless the context otherwise requires, the following terms shall have the meanings set out below.
“Bank” China Construction Bank Corporation
“Bank of America” Bank of America Corporation
“Baosteel Group” Baosteel Group Corporation
“Board” Board of directors
“CBRC” China Banking Regulatory Commission
“CCB Asia” China Construction Bank (Asia) Corporation Limited
“CCB Financial Leasing” CCB Financial Leasing Corporation Limited
“CCB International” CCB International (Holdings) Limited
“CCB Life” CCB Life Insurance Company Limited
“CCB London” China Construction Bank (London) Limited
“CCB Principal Asset Management” CCB Principal Asset Management Co., Ltd.
“CCB Trust” CCB Trust Co., Limited
“CIC” China Investment Corporation
“Company Law” The Company Law of the People’s Republic of China
“CSRC” China Securities Regulatory Commission
“Fullerton Financial” Fullerton Financial Holdings Pte Ltd.
“Group”, “CCB” China Construction Bank Corporation and its subsidiaries
“Hong Kong Stock Exchange” The Stock Exchange of Hong Kong Limited
“Huijin” Central Huijin Investment Limited
“IFRS” International Financial Reporting Standards
“Jianyin” China Jianyin Investment Limited
“Listing Rules of Hong Kong Stock Exchange” Rules Governing the Listing of Securities on The Stock Exchange of Hong Kong Limited
“MOF” Ministry of Finance of the People’s Republic of China
“Pacific-Antai” Pacific-Antai Life Insurance Co., Ltd.
“PBC” People’s Bank of China
“PRC GAAP”Accounting Standards for Business Enterprises promulgated by the MOF on 15 February 2006 and other relevant requirements
“RMB” Renminbi
“SAFE” State Administration of Foreign Exchange
“SFO” Securities and Futures Ordinance
“Sino-German Bausparkasse” Sino-German Bausparkasse Co., Ltd.
“State Grid” State Grid Corporation of China
“Temasek” Temasek Holdings (Private) Limited
“Yangtze Power” China Yangtze Power Co., Limited

We have included in this report certain forward-looking statements with respect to our financial position, operating resultsand business development. We use words such as “will”, “may”, “expect”, “try”, “strive”, and similar expressions to identifyforward-looking statements. These statements are based on current plans, estimates and projections. Although we believethat the expectations reflected in these forward-looking statements are reasonable, we can give no assurance that thoseexpectations will prove to have been correct, and you are cautioned not to place undue reliance on such statements. Readersare cautioned that a number of factors could cause actual results to differ, in some instances materially, from those anticipatedor implied in any forward-looking statements. These factors include, among others: changes in general economic conditionsin the markets in which the Group operates, changes in the government’s adjustment and control policies and in laws andregulations, and factors specific to the Group.

www.ccb.comRegistered address and postcodeNo. 25, Financial Street, Xicheng District, Beijing 100033
Stock Code: 939 China Construction Bank Corporation(A joint stock limited company incorporated in the People’s Republic of China with limited liability)
The annual report is printed on recyclable paper


