\ \ \ \ \ \ \ \ \ \ 1 2 3 4 5 6 7 8 9 0 \ \ \ \ \ \ \ \ \ \ 1 2 3 4 5 6 7 8 9 0 \ \ \ \ \ \ \ \ \ \ 1 2 3 4 5 6 7 8 9 0 \ \ \ \ \ \ \ \ \ \ 1 2 3 4 5 6 7 8 9 0 \ \ \ \ \ \ \ \ \ \ 1 2 3 4 5 6 7 8 9 0 \ \ \ \ \ \ \ \ \ \ 1 2 3 4 5 6 7 8 9 0 \ \ \ \ \ \ \ \ \ \ \ \ \ \ \ \ \ \ \ \ \ \ \ \ \ \ \ \ \ \ \ \ \ \ \ \ \ \ \ \ \ \ \ \ \ \ \ \ \ \ \ \ \ \ \ \ \ \ \ \ \\\\ \ \ \ \ \ \ \ \ \ \ \ \ \ \ \ \ \ \ \ \ \ \ \ \ \ \ \ \ \ \ \ \ \ \ \ \ \ \ \ \ \ \ \ \ \ \ \ \ \ \ \ \ A F A F A F A F A F A F A B G B G B G B G B G B G B C H C H C H C H C H C H C D J D J D J D J D J D J D \ \ \ \ \ \ \ \ \ \ \ \ \ \ \ \ \ \ \ \ \ \ \ \ \ \ \ \ \ \ \ \ \ \ \ \ \ \ \ \ A F A F A F A F A F B G B G B G B G B G C H C H C H C H C H D J D J D J D J D J \ \ \ \ \ \ \ \ \ \ E K E K E K E K E K \ \ \ \ \ \ \ \ \ \ \ \ \ \ \ \ \ \ \ \ \ \ \ \ \ \ \ \ \ \ \ \ \ \ \ \ \ \ \ \ A F A F A F A F A F B G B G B G B G B G C H C H C H C H C H D J D J D J D J D J \ \ \ \ \ \ \ \ \ \ E K E K E K E K E K \ \ \ \ \ \ \ \ \ \ \ \ \ \ \ \ \ \ \ \ \ \ \ \ \ \ \ \ \ \ \ \ \ \ \ \ \ \ \ \ A F A F A F A F A F B G B G B G B G B G C H C H C H C H C H D J D J D J D J D J \ \ \ \ \ \ \ \ \ \ E K E K E K E K E K \ \ \ \ \ \ \ \ \ \ \ \ \ \ \ \ \ \ \ \ \ \ \ \ \ \ \ \ \ \ \ \ \ \ \ \ \ \ \ \ A F A F A F A F A F B G B G B G B G B G C H C H C H C H C H D J D J D J D J D J \ \ \ \ \ \ \ \ \ \ E K E K E K E K E K \ \ \ \ \ \ \ \ \ \ \ \ \ \ \ \ \ \ \ \ \ \ \ \ \ \ \ \ \ \ \ \ \ \ \ \ \ \ \ \ A F A F A F A F A F B G B G B G B G B G C H C H C H C H C H D J D J D J D J D J \ \ \ \ \ \ \ \ \ \ E K E K E K E K E K \ \ \ \ \ \ \ \ \ \ \ \ \ \ \ \ \ \ \ \ \ \ \ \ \ \ \ \ \ \ \ \ \ \ \ \ \ \ \ \ A F A F A F A F A F B G B G B G B G B G C H C H C H C H C H D J D J D J D J D J \ \ \ \ \ \ \ \ \ \ E K E K E K E K E K \ \ \ \ \ \ \ \ \ \ \ \ \ \ \ \ \ \ \ \ \ \ \ \ \ \ \ \ \ \ \ \ \ \ \ \ \ \ \ \ \ \ \ \ \ \ \ \ \ \ \ \ F A F A F A F A F A F A F G B G B G B G B G B G B G H C H C H C H C H C H C H J D J D J D J D J D J D J \ \ \ \ \ \ \ \ \ \ \ \ \ \ \ \ \ \ \ \ \ \ \ \ \ \ \ \ A F A F A F A B G B G B G B C H C H C H C D J D J D J D \ \ \ \ \ \ \ \ \ \ \ \ \ \ \ \ \ \ \ \ \ \ \ \ \ \ \ \ F A F A F A F G B G B G B G H C H C H C H J D J D J D J \ \ \ \ \ \ \ \ \ \ \ \ \ \ \ \ \ \ \ \ \ \ \ \ \ \ \ \ A F A F A F A B G B G B G B C H C H C H C D J D J D J D \ \ \ \ \ \ \ \ \ \ \ \ \ \ \ \ \ \ \ \ \ \ \ \ \ \ \ \ F A F A F A F G B G B G B G H C H C H C H J D J D J D J \ \ \ \ \ \ \ \ \ \ \ \ \ \ \ \ \ \ \ \ \ \ \ \ \ \ \ \ A F A F A F A B G B G B G B C H C H C H C D J D J D J D \ \ \ \ \ \ \ \ \ \ \ \ \ \ \ \ \ \ \ \ F A F A F G B G B G H C H C H J D J D J \ \ \ \ \ \ \ \ \ \ \ \ \ \ \ \ \ \ \ \ \ \ \ \ \ \ \ \ A F A F A F A B G B G B G B C H C H C H C D J D J D J D \ \ \ \ \ \ \ \ \ \ \ \ \ \ \ \ \ \ \ \ \ \ \ \ \ \ \ \ F A F A F A F G B G B G B G H C H C H C H J D J D J D J \ \ \ \ \ \ \ \ \ \ \ \ \ \ \ \ \ \ \ \ \ \ \ \ \ \ \ \ A F A F A F A B G B G B G B C H C H C H C D J D J D J D \ \ \ \ \ \ \ \ \ \ \ \ \ \ \ \ \ \ \ \ \ \ \ \ \ \ \ \ F A F A F A F G B G B G B G H C H C H C H J D J D J D J \ \ \ \ \ \ \ \ \ \ \ \ \ \ \ \ \ \ \ \ \ \ \ \ \ \ \ \ A F A F A F A B G B G B G B C H C H C H C D J D J D J D \ \ \ \ \ \ \ \ \ \ \ \ \ \ \ \ \ \ \ \ F A F A F G B G B G H C H C H J D J D J \ \ \ \ \ \ \ \ \ \ \ \ \ \ \ \ \ \ \ \ \ \ \ \ \ \ \ \ \ \ \ \ \ \ \ \ \ \ \ \ \ \ \ \ \ \ \ \ \ \ \ \ A F A F A F A F A F A F A B G B G B G B G B G B G B C H C H C H C H C H C H C D J D J D J D J D J D J D \ \ \ \ \ \ \ \ \ \ \ \ \ \ \ \ \ \ \ \ \ \ \ \ \ \ \ \ \ \ \ \ \ \ \ \ \ \ \ \ \ \ \ \ \ \ \ \ \ \ \ \ F A F A F A F A F A F A F G B G B G B G B G B G B G H C H C H C H C H C H C H J D J D J D J D J D J D J \ \ \ \ \ \ \ \ \ \ \ \ \ \ \ \ \ \ \ \ \ \ \ \ \ \ \ \ \ \ \ \ \ \ \ \ \ \ \ \ \ \ \ \ \ \ \ \ \ \ \ \ A F A F A F A F A F A F A B G B G B G B G B G B G B C H C H C H C H C H C H C D J D J D J D J D J D J D \ \ \ \ \ \ \ \ \ \ \ \ \ \ \ \ \ \ \ \ \ \ \ \ \ \ \ \ \ \ \ \ \ \ \ \ \ \ \ \ F A F A F A F A F A G B G B G B G B G B H C H C H C H C H C J D J D J D J D J D \ \ \ \ \ \ \ \ \ \ \ \ \ \ \ \ \ \ \ \ \ \ \ \ \ \ \ \ \ \ Incorrect marks: Overlapping mark: Cross-out mark: Smudged erasure: Mark is too light: 64F 68E 69C 69E 70D 70E 71B 71F 72A 72D 72E 72F 73A 73D 73E 73F 73H 74A 75A 75B 75C 75D 75E 75F 75G 75H 75R 75S 76A 96H 96Y 98H 98J 98K 98L 98N 98P 98Q 98R 98T PAGE 2 BOOKLET NUMBER TEST 1 TEST 2 TEST 3 TEST 4 ACT STUDENT REVIEW: The test administrator will give you instructions for completing this section. FORM Print your 3-character Test Form in the boxes above and fill in the corresponding oval at the right. Marking Directions: Mark only one oval for each question. Fill in response completely. Erase errors cleanly without smudging. Do NOT use these incorrect or bad marks. Correct mark: BE SURE TO FILL IN THE CORRECT FORM OVAL. 1 2 3 4 5 6 7 8 9 10 11 12 13 14 15 16 17 18 19 20 21 22 23 24 25 26 27 28 29 30 31 32 33 34 35 36 37 38 39 40 41 42 43 44 45 46 47 48 49 50 51 52 53 54 55 56 57 58 59 60 61 62 63 64 65 66 67 68 69 70 71 72 73 74 75 1 2 3 4 5 6 7 8 9 10 11 12 13 14 15 16 17 18 19 20 21 22 23 24 25 26 27 28 29 30 31 32 33 34 35 36 37 38 39 40 41 42 43 44 45 46 47 48 49 50 51 52 53 54 55 56 57 58 59 60 1 2 3 4 5 6 7 8 9 10 11 12 13 14 1 2 3 4 5 6 7 8 9 10 11 12 13 14 15 16 17 18 19 20 21 22 23 24 25 26 27 28 29 30 31 32 33 34 35 36 37 38 39 40 15 16 17 18 19 20 21 22 23 24 25 26 27 28 29 30 31 32 33 34 35 36 37 38 39 40 Student Review: Your responses to these items will assist ACT and your test center in providing the best possible conditions for testing and planning for the future. Fill in the oval indicating your response to each item printed on the back of your test booklet. 1 2 3 4 5 6 7 8 9 10 11 12 13 14 15 Yes No Yes No Yes No PRE 64 3832 *080192160* Rev 1
Transcript
1832 *080192150* Rev 1
\\\\\\\\\\
1234567890
\\\\\\\\\\
1234567890
\\\\\\\\\\
1234567890
\\\\\\\\\\
1234567890
\\\\\\\\\\
1234567890
\\\\\\\\\\
1234567890
\\\\\\\\\\
\\\\\\\\\\
\\\\\\\\\\
\\\\\\\\\\
\\\\\
\\\\\
\\\\\
\\\\\
\\\\
\\\\\\\\\\\\\
\\\\\\\\\\\\\
\\\\\\\\\\\\\
\\\\\\\\\\\\\
AFAFAFAFAFAFA
BGBGBGBGBGBGB
CHCHCHCHCHCHC
DJDJDJDJDJDJD
\\\\\\\\\\
\\\\\\\\\\
\\\\\\\\\\
\\\\\\\\\\
AFAFAFAFAF
BGBGBGBGBG
CHCHCHCHCH
DJDJDJDJDJ
\\\\\\\\\\
EKEKEKEKEK
\\\\\\\\\\
\\\\\\\\\\
\\\\\\\\\\
\\\\\\\\\\
AFAFAFAFAF
BGBGBGBGBG
CHCHCHCHCH
DJDJDJDJDJ
\\\\\\\\\\
EKEKEKEKEK
\\\\\\\\\\
\\\\\\\\\\
\\\\\\\\\\
\\\\\\\\\\
AFAFAFAFAF
BGBGBGBGBG
CHCHCHCHCH
DJDJDJDJDJ
\\\\\\\\\\
EKEKEKEKEK
\\\\\\\\\\
\\\\\\\\\\
\\\\\\\\\\
\\\\\\\\\\
AFAFAFAFAF
BGBGBGBGBG
CHCHCHCHCH
DJDJDJDJDJ
\\\\\\\\\\
EKEKEKEKEK
\\\\\\\\\\
\\\\\\\\\\
\\\\\\\\\\
\\\\\\\\\\
AFAFAFAFAF
BGBGBGBGBG
CHCHCHCHCH
DJDJDJDJDJ
\\\\\\\\\\
EKEKEKEKEK
\\\\\\\\\\
\\\\\\\\\\
\\\\\\\\\\
\\\\\\\\\\
AFAFAFAFAF
BGBGBGBGBG
CHCHCHCHCH
DJDJDJDJDJ
\\\\\\\\\\
EKEKEKEKEK
\\\\\\\\\\\\\
\\\\\\\\\\\\\
\\\\\\\\\\\\\
\\\\\\\\\\\\\
FAFAFAFAFAFAF
GBGBGBGBGBGBG
HCHCHCHCHCHCH
JDJDJDJDJDJDJ
\\\\\\\
\\\\\\\
\\\\\\\
\\\\\\\
AFAFAFA
BGBGBGB
CHCHCHC
DJDJDJD
\\\\\\\
\\\\\\\
\\\\\\\
\\\\\\\
FAFAFAF
GBGBGBG
HCHCHCH
JDJDJDJ
\\\\\\\
\\\\\\\
\\\\\\\
\\\\\\\
AFAFAFA
BGBGBGB
CHCHCHC
DJDJDJD
\\\\\\\
\\\\\\\
\\\\\\\
\\\\\\\
FAFAFAF
GBGBGBG
HCHCHCH
JDJDJDJ
\\\\\\\
\\\\\\\
\\\\\\\
\\\\\\\
AFAFAFA
BGBGBGB
CHCHCHC
DJDJDJD
\\\\\
\\\\\
\\\\\
\\\\\
FAFAF
GBGBG
HCHCH
JDJDJ
\\\\\\\
\\\\\\\
\\\\\\\
\\\\\\\
AFAFAFA
BGBGBGB
CHCHCHC
DJDJDJD
\\\\\\\
\\\\\\\
\\\\\\\
\\\\\\\
FAFAFAF
GBGBGBG
HCHCHCH
JDJDJDJ
\\\\\\\
\\\\\\\
\\\\\\\
\\\\\\\
AFAFAFA
BGBGBGB
CHCHCHC
DJDJDJD
\\\\\\\
\\\\\\\
\\\\\\\
\\\\\\\
FAFAFAF
GBGBGBG
HCHCHCH
JDJDJDJ
\\\\\\\
\\\\\\\
\\\\\\\
\\\\\\\
AFAFAFA
BGBGBGB
CHCHCHC
DJDJDJD
\\\\\
\\\\\
\\\\\
\\\\\
FAFAF
GBGBG
HCHCH
JDJDJ
\\\\\\\\\\\\\
\\\\\\\\\\\\\
\\\\\\\\\\\\\
\\\\\\\\\\\\\
AFAFAFAFAFAFA
BGBGBGBGBGBGB
CHCHCHCHCHCHC
DJDJDJDJDJDJD
\\\\\\\\\\\\\
\\\\\\\\\\\\\
\\\\\\\\\\\\\
\\\\\\\\\\\\\
FAFAFAFAFAFAF
GBGBGBGBGBGBG
HCHCHCHCHCHCH
JDJDJDJDJDJDJ
\\\\\\\\\\\\\
\\\\\\\\\\\\\
\\\\\\\\\\\\\
\\\\\\\\\\\\\
AFAFAFAFAFAFA
BGBGBGBGBGBGB
CHCHCHCHCHCHC
DJDJDJDJDJDJD
\\\\\\\\\\
\\\\\\\\\\
\\\\\\\\\\
\\\\\\\\\\
FAFAFAFAFA
GBGBGBGBGB
HCHCHCHCHC
JDJDJDJDJD
\\\\\
\\\\\
\\\\\
\\\\\
\\\\\
\\\\\
Incorrect marks:Overlapping mark:
Cross-out mark:Smudged erasure:
Mark is too light:
64F68E69C69E70D70E71B71F72A72D
72E72F73A73D73E73F73H74A75A75B
75C75D75E75F75G75H75R75S76A96H
96Y98H98J98K98L98N98P98Q98R98T
PAGE 2
BOOKLET NUMBER
TEST 1
TEST 2
TEST 3
TEST 4
ACT STUDENT REVIEW: The test administrator will give you instructions for completing this section.
FORM
Print your 3-characterTest Form inthe boxesabove andfill in thecorrespondingoval at theright.
Marking Directions: Mark only one oval foreach question. Fill in response completely.Erase errors cleanly without smudging.
Do NOT use these incorrect or badmarks.
Correct mark:
BE SURE TO FILL IN THE CORRECT FORM OVAL.
123456789
10111213
14151617181920212223242526
27282930313233343536373839
40414243444546474849505152
53545556575859606162636465
66676869707172737475
123456789
10
11121314151617181920
21222324252627282930
31323334353637383940
41424344454647484950
51525354555657585960
1234567
89
1011121314
1234567
89
1011121314
15161718192021
22232425262728
29303132333435
3637383940
15161718192021
22232425262728
29303132333435
3637383940
Student Review: Your responses to these items will assist ACT and your test center in providing the best possible conditions fortesting and planning for the future. Fill in the oval indicating yourresponse to each item printed on the back of your test booklet.
12345
6789
10
1112131415
Yes No Yes No Yes No
PRE
643832 *080192160* Rev 1
Passage I
Researchers studied how diet and the ability to smellfood can affect the life span of normal fruit flies (Strain N)and fruit flies unable to detect many odors (Strain X).
Study 1Three tubes (Tubes 1−3), each with 15% sugar yeast
(SY) medium (a diet with 15% sugar and 15% killed yeast),were prepared. Then, 200 virgin female Strain N fruit fliesless than 24 hr old were added to each tube. No additionalsubstance was added to Tube 1. Additional odors from liveyeast were added to Tube 2, and live yeast was added toTube 3. The percent of fruit flies alive was determinedevery 5 days for 75 days (see Figure 1).
Figure 1
Study 2Three tubes (Tubes 4−6), each with 5% SY medium (a
diet with 5% sugar and 5% killed yeast), were prepared.Then, 200 virgin female Strain N fruit flies less than 24 hrold were added to each tube. No additional substance wasadded to Tube 4. Additional odors from live yeast wereadded to Tube 5, and live yeast was added to Tube 6. Thepercent of fruit flies alive was determined every 5 days for75 days (see Figure 2).
Figure 2
days
perc
ent a
live
1009080706050403020100
65605550454035302520151050 70 75
15% SY medium15% SY medium + additional odors from live yeast15% SY medium + live yeast
Key
days
perc
ent a
live
1009080706050403020100
65605550454035302520151050 70 75
Key5% SY medium5% SY medium + additional odors from live yeast5% SY medium + live yeast
SCIENCE TEST35 Minutes—40 Questions
DIRECTIONS: There are several passages in this test.Each passage is followed by several questions. Afterreading a passage, choose the best answer to eachquestion and fill in the corresponding oval on youranswer document. You may refer to the passages asoften as necessary.
You are NOT permitted to use a calculator on this test.
GO ON TO THE NEXT PAGE.ACT-1572CPRE
4 4
40
41
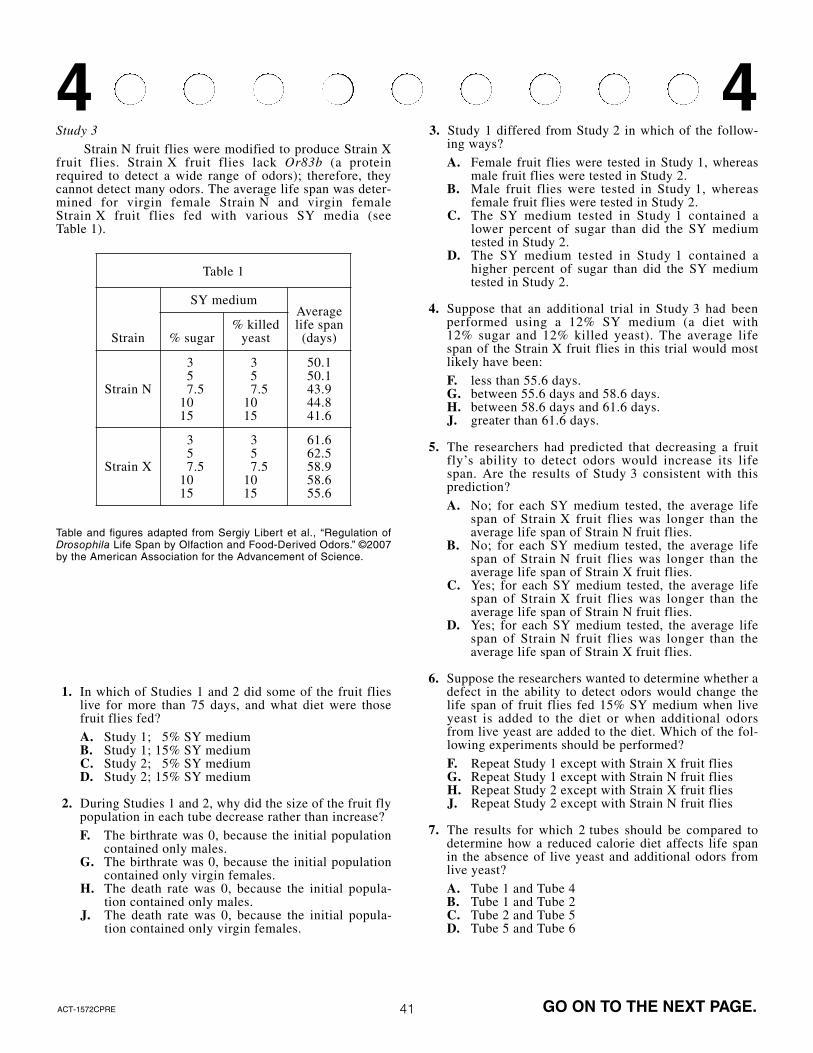
Study 3Strain N fruit flies were modified to produce Strain X
fruit flies. Strain X fruit flies lack Or83b (a proteinrequired to detect a wide range of odors); therefore, theycannot detect many odors. The average life span was deter-mined for virgin female Strain N and virgin femaleStrain X fruit flies fed with various SY media (seeTable 1).
1. In which of Studies 1 and 2 did some of the fruit flieslive for more than 75 days, and what diet were thosefruit flies fed?A. Study 1; 05% SY mediumB. Study 1; 15% SY mediumC. Study 2; 05% SY mediumD. Study 2; 15% SY medium
2. During Studies 1 and 2, why did the size of the fruit flypopulation in each tube decrease rather than increase?F. The birthrate was 0, because the initial population
contained only males.G. The birthrate was 0, because the initial population
contained only virgin females.H. The death rate was 0, because the initial popula-
tion contained only males.J. The death rate was 0, because the initial popula-
tion contained only virgin females.
3. Study 1 differed from Study 2 in which of the follow-ing ways?A. Female fruit flies were tested in Study 1, whereas
male fruit flies were tested in Study 2.B. Male fruit flies were tested in Study 1, whereas
female fruit flies were tested in Study 2.C. The SY medium tested in Study 1 contained a
lower percent of sugar than did the SY mediumtested in Study 2.
D. The SY medium tested in Study 1 contained ahigher percent of sugar than did the SY mediumtested in Study 2.
4. Suppose that an additional trial in Study 3 had beenperformed using a 12% SY medium (a diet with 12% sugar and 12% killed yeast). The average lifespan of the Strain X fruit flies in this trial would mostlikely have been:F. less than 55.6 days.G. between 55.6 days and 58.6 days.H. between 58.6 days and 61.6 days.J. greater than 61.6 days.
5. The researchers had predicted that decreasing a fruitfly’s ability to detect odors would increase its lifespan. Are the results of Study 3 consistent with thisprediction?A. No; for each SY medium tested, the average life
span of Strain X fruit flies was longer than theaverage life span of Strain N fruit flies.
B. No; for each SY medium tested, the average lifespan of Strain N fruit flies was longer than theaverage life span of Strain X fruit flies.
C. Yes; for each SY medium tested, the average lifespan of Strain X fruit flies was longer than theaverage life span of Strain N fruit flies.
D. Yes; for each SY medium tested, the average lifespan of Strain N fruit flies was longer than theaverage life span of Strain X fruit flies.
6. Suppose the researchers wanted to determine whether adefect in the ability to detect odors would change thelife span of fruit flies fed 15% SY medium when liveyeast is added to the diet or when additional odorsfrom live yeast are added to the diet. Which of the fol-lowing experiments should be performed?F. Repeat Study 1 except with Strain X fruit fliesG. Repeat Study 1 except with Strain N fruit fliesH. Repeat Study 2 except with Strain X fruit fliesJ. Repeat Study 2 except with Strain N fruit flies
7. The results for which 2 tubes should be compared todetermine how a reduced calorie diet affects life spanin the absence of live yeast and additional odors fromlive yeast?A. Tube 1 and Tube 4B. Tube 1 and Tube 2C. Tube 2 and Tube 5D. Tube 5 and Tube 6
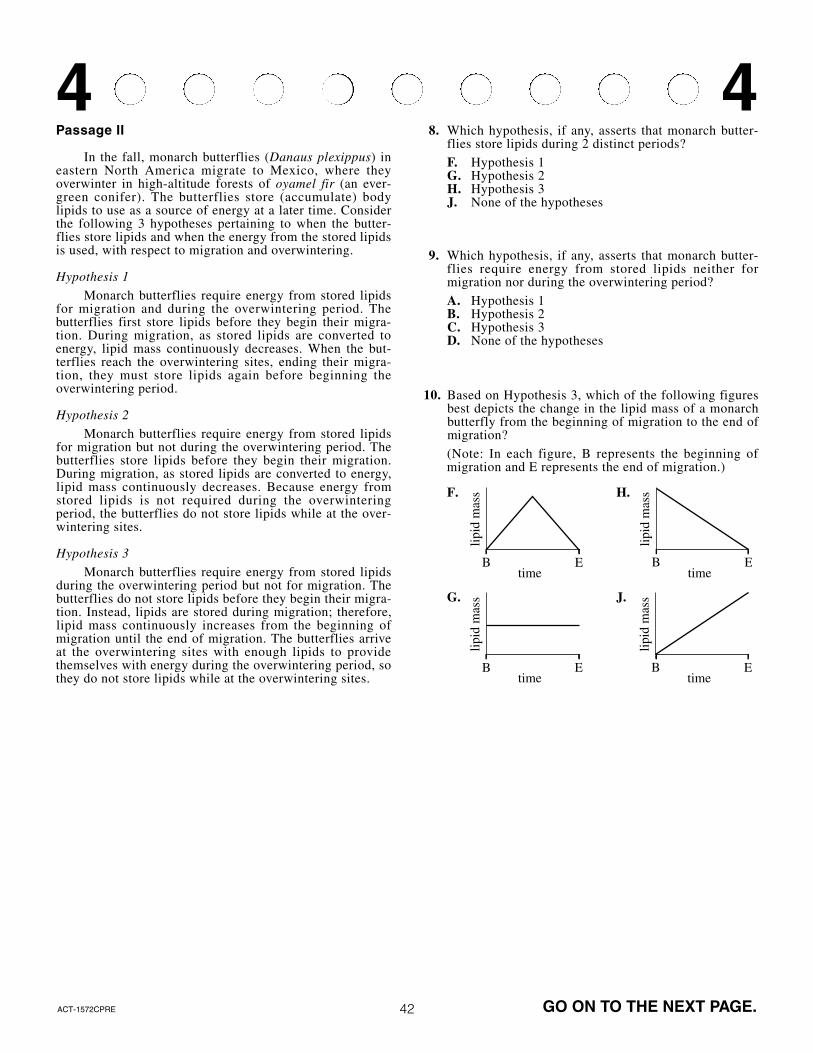
In the fall, monarch butterflies (Danaus plexippus) ineastern North America migrate to Mexico, where theyoverwinter in high-altitude forests of oyamel fir (an ever-green conifer). The butterflies store (accumulate) bodylipids to use as a source of energy at a later time. Considerthe following 3 hypotheses pertaining to when the butter-flies store lipids and when the energy from the stored lipidsis used, with respect to migration and overwintering.
Hypothesis 1Monarch butterflies require energy from stored lipids
for migration and during the overwintering period. Thebutterflies first store lipids before they begin their migra-tion. During migration, as stored lipids are converted toenergy, lipid mass continuously decreases. When the but-terflies reach the overwintering sites, ending their migra-tion, they must store lipids again before beginning theoverwintering period.
Hypothesis 2Monarch butterflies require energy from stored lipids
for migration but not during the overwintering period. Thebutterflies store lipids before they begin their migration.During migration, as stored lipids are converted to energy,lipid mass continuously decreases. Because energy fromstored lipids is not required during the overwinteringperiod, the butterflies do not store lipids while at the over-wintering sites.
Hypothesis 3Monarch butterflies require energy from stored lipids
during the overwintering period but not for migration. Thebutterflies do not store lipids before they begin their migra-tion. Instead, lipids are stored during migration; therefore,lipid mass continuously increases from the beginning ofmigration until the end of migration. The butterflies arriveat the overwintering sites with enough lipids to providethemselves with energy during the overwintering period, sothey do not store lipids while at the overwintering sites.
8. Which hypothesis, if any, asserts that monarch butter-flies store lipids during 2 distinct periods?F. Hypothesis 1G. Hypothesis 2H. Hypothesis 3J. None of the hypotheses
9. Which hypothesis, if any, asserts that monarch butter-flies require energy from stored lipids neither formigration nor during the overwintering period?A. Hypothesis 1B. Hypothesis 2C. Hypothesis 3D. None of the hypotheses
10. Based on Hypothesis 3, which of the following figuresbest depicts the change in the lipid mass of a monarchbutterfly from the beginning of migration to the end ofmigration?(Note: In each figure, B represents the beginning ofmigration and E represents the end of migration.)
F.
G.
H.
J.
lipid
mas
s
timeB E
lipid
mas
s
timeB E
lipid
mas
s
timeB E
lipid
mas
s
timeB E
GO ON TO THE NEXT PAGE.ACT-1572CPRE
4 4
42
43
11. Assume that changes in the body mass of a monarchbutterfly are caused only by changes in the mass of thebutterfly’s stored lipids. The statement “The percent ofa monarch butterfly’s body mass that is made up oflipids is greater at the beginning of migration than atthe end of migration” is supported by which of thehypotheses?A. Hypothesis 1 onlyB. Hypothesis 2 onlyC. Hypotheses 1 and 2 onlyD. Hypotheses 1, 2, and 3
12. To store lipids, monarch butterflies convert sugar fromnectar they have consumed into lipids. A supporter ofwhich hypothesis, if any, would be likely to claim thatto ensure the butterflies can store lipids for the over-wintering period, nectar must be present at the butter-flies’ overwintering sites?F. Hypothesis 1G. Hypothesis 2H. Hypothesis 3J. None of the hypotheses
13. Which of the following statements about lipids inmonarch butterflies is consistent with all 3 hypotheses?A. The butterflies’ lipid masses do not change during
the overwintering period.B. The butterflies’ lipid masses change during
migration.C. The butterflies use energy from stored lipids
during the overwintering period.D. The butterflies use energy from stored lipids for
migration.
14. When the monarch butterflies use their stored lipids,the lipids must be broken down to produce energy-richmolecules that can be readily used by cells. Which ofthe following molecules is produced as a direct resultof the breakdown of the lipids?F. ATPG. StarchH. DNAJ. Amino acids
GO ON TO THE NEXT PAGE.ACT-1572CPRE
4 4
Passage III
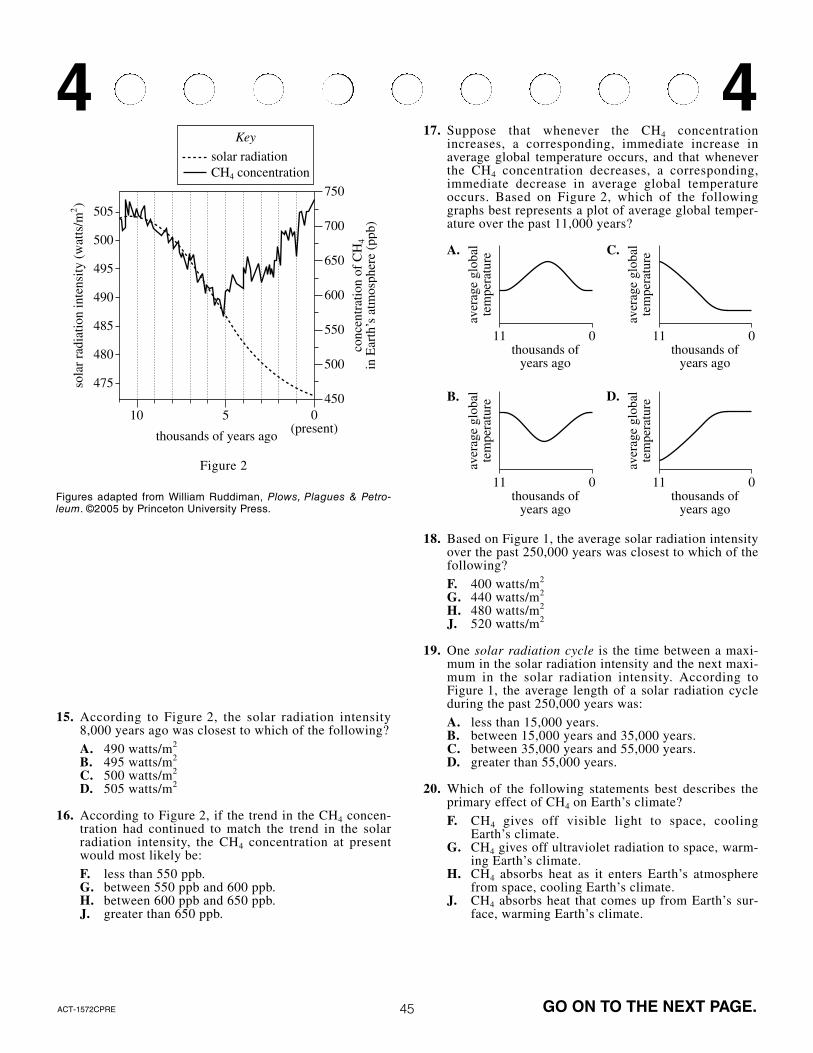
Greenhouse gases such as methane (CH4) warmEarth’s climate. Figure 1 shows the concentration of CH4in Earth’s atmosphere and the solar radiation intensity atEarth’s surface for tropical Europe and Asia over the past250,000 years. As the figure shows, the CH4 concentrationand the solar radiation intensity have increased anddecreased at the same times over most of this period.Figure 2 shows the same types of data for the same regionover the past 11,000 years. This figure is consistent withthe hypothesis that the greenhouse gases from human activities may have begun warming Earth’s climate thou-sands of years earlier than once thought.
15. According to Figure 2, the solar radiation intensity8,000 years ago was closest to which of the following?A. 490 watts/m2
B. 495 watts/m2
C. 500 watts/m2
D. 505 watts/m2
16. According to Figure 2, if the trend in the CH4 concen-tration had continued to match the trend in the solarradiation intensity, the CH4 concentration at presentwould most likely be:F. less than 550 ppb.G. between 550 ppb and 600 ppb.H. between 600 ppb and 650 ppb.J. greater than 650 ppb.
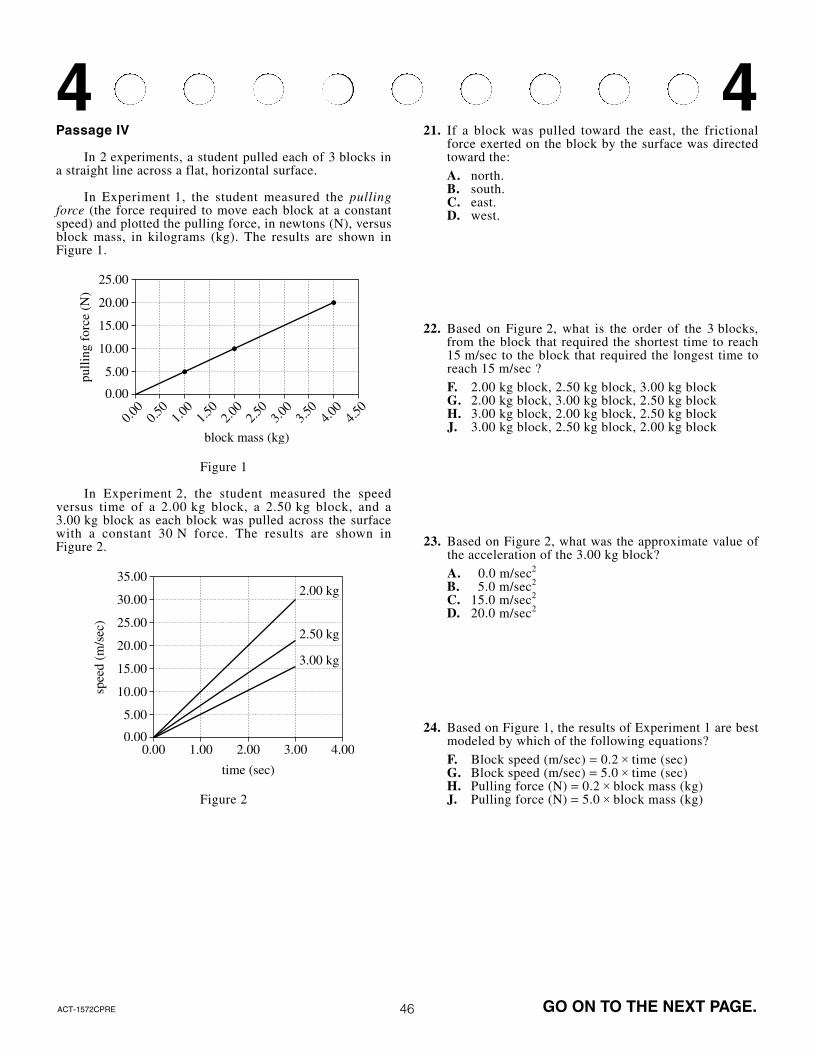
17. Suppose that whenever the CH4 concentrationincreases, a corresponding, immediate increase in average global temperature occurs, and that wheneverthe CH4 concentration decreases, a corresponding,immediate decrease in average global temperatureoccurs. Based on Figure 2, which of the followinggraphs best represents a plot of average global temper-ature over the past 11,000 years?
18. Based on Figure 1, the average solar radiation intensityover the past 250,000 years was closest to which of thefollowing?F. 400 watts/m2
G. 440 watts/m2
H. 480 watts/m2
J. 520 watts/m2
19. One solar radiation cycle is the time between a maxi-mum in the solar radiation intensity and the next maxi-mum in the solar radiation intensity. According toFigure 1, the average length of a solar radiation cycleduring the past 250,000 years was:A. less than 15,000 years.B. between 15,000 years and 35,000 years.C. between 35,000 years and 55,000 years.D. greater than 55,000 years.
20. Which of the following statements best describes theprimary effect of CH4 on Earth’s climate?F. CH4 gives off visible light to space, cooling
Earth’s climate.G. CH4 gives off ultraviolet radiation to space, warm-
ing Earth’s climate.H. CH4 absorbs heat as it enters Earth’s atmosphere
from space, cooling Earth’s climate.J. CH4 absorbs heat that comes up from Earth’s sur-
face, warming Earth’s climate.
sola
r rad
iatio
n in
tens
ity (w
atts
/m2)
conc
entr
atio
n of
CH
4in
Ear
th’s
atm
osph
ere
(ppb
)
thousands of years ago
solar radiationCH4 concentration
Key
505
500
495
490
485
480
475
10 5 0(present)
750
700
650
600
550
500
450
aver
age
glob
alte
mpe
ratu
re
11thousands of
years ago
0
aver
age
glob
alte
mpe
ratu
re11
thousands ofyears ago
0
aver
age
glob
alte
mpe
ratu
re
11thousands of
years ago
0
aver
age
glob
alte
mpe
ratu
re
11thousands of
years ago
0
A.
B.
C.
D.
GO ON TO THE NEXT PAGE.ACT-1572CPRE
4 4
Passage IV
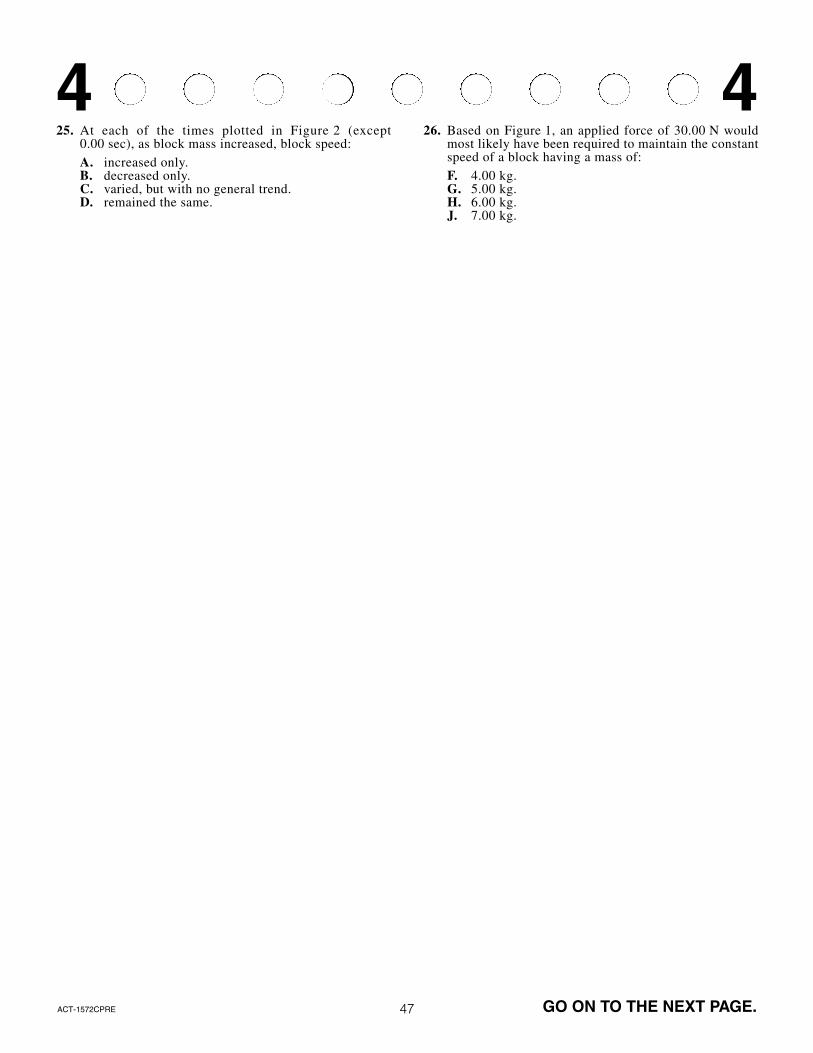
In 2 experiments, a student pulled each of 3 blocks ina straight line across a flat, horizontal surface.
In Experiment 1, the student measured the pullingforce (the force required to move each block at a constantspeed) and plotted the pulling force, in newtons (N), versusblock mass, in kilograms (kg). The results are shown inFigure 1.
Figure 1
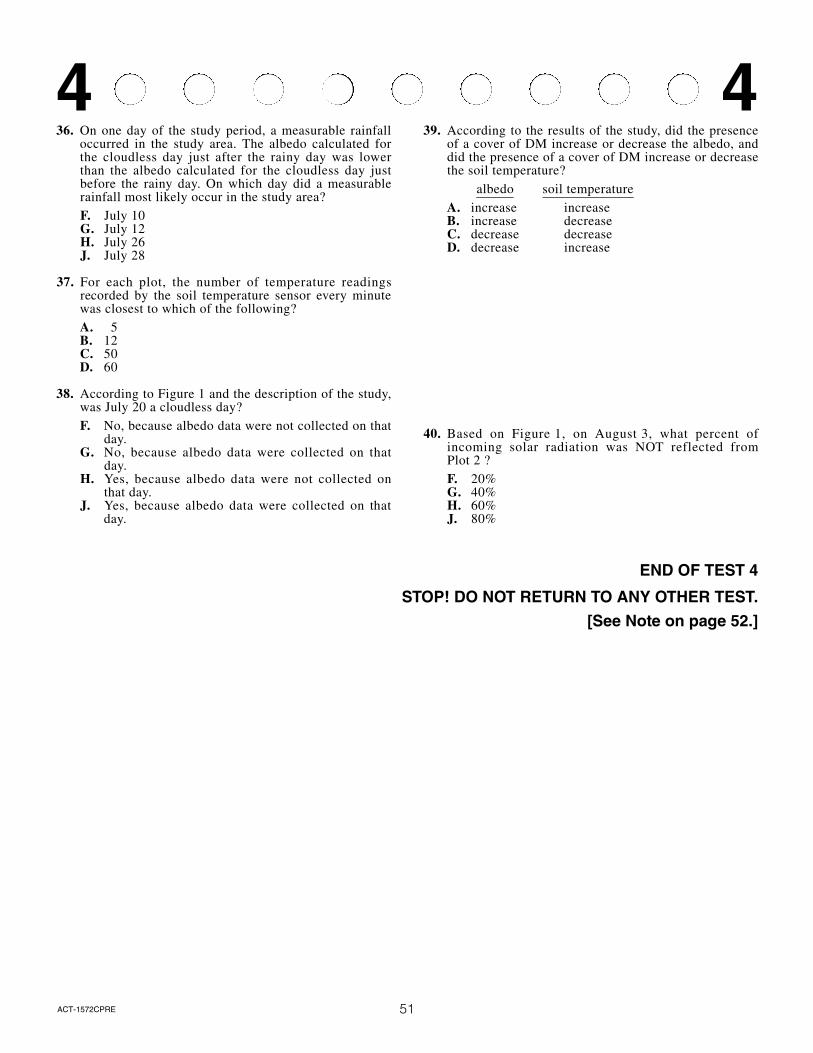
In Experiment 2, the student measured the speedversus time of a 2.00 kg block, a 2.50 kg block, and a3.00 kg block as each block was pulled across the surfacewith a constant 30 N force. The results are shown inFigure 2.
Figure 2
21. If a block was pulled toward the east, the frictionalforce exerted on the block by the surface was directedtoward the:A. north.B. south.C. east.D. west.
22. Based on Figure 2, what is the order of the 3 blocks,from the block that required the shortest time to reach15 m/sec to the block that required the longest time toreach 15 m/sec ?F. 2.00 kg block, 2.50 kg block, 3.00 kg blockG. 2.00 kg block, 3.00 kg block, 2.50 kg blockH. 3.00 kg block, 2.00 kg block, 2.50 kg blockJ. 3.00 kg block, 2.50 kg block, 2.00 kg block
23. Based on Figure 2, what was the approximate value ofthe acceleration of the 3.00 kg block?A. 00.0 m/sec2
B. 05.0 m/sec2
C. 15.0 m/sec2
D. 20.0 m/sec2
24. Based on Figure 1, the results of Experiment 1 are bestmodeled by which of the following equations?F. Block speed (m/sec) = 0.2 × time (sec)G. Block speed (m/sec) = 5.0 × time (sec)H. Pulling force (N) = 0.2 × block mass (kg)J. Pulling force (N) = 5.0 × block mass (kg)
0.00
10.00
5.00
20.00
25.00
15.00
0.00
block mass (kg)1.0
01.5
02.5
03.5
00.5
02.0
03.0
04.5
04.0
0
pulli
ng fo
rce
(N)
0.00
10.00
5.00
35.00
20.00
25.00
30.00
15.00
0.00
time (sec)
1.00 2.00 3.00
2.50 kg
4.00
spee
d (m
/sec
)
3.00 kg
2.00 kg
GO ON TO THE NEXT PAGE.ACT-1572CPRE
4 4
46
47
25. At each of the times plotted in Figure 2 (except0.00 sec), as block mass increased, block speed:A. increased only.B. decreased only.C. varied, but with no general trend.D. remained the same.
26. Based on Figure 1, an applied force of 30.00 N wouldmost likely have been required to maintain the constantspeed of a block having a mass of:F. 4.00 kg.G. 5.00 kg.H. 6.00 kg.J. 7.00 kg.
GO ON TO THE NEXT PAGE.ACT-1572CPRE
4 4
Passage V
A typical acid-base indicator is a compound that willbe one color over a certain lower pH range but will be adifferent color over a certain higher pH range. In the smallrange between these pH ranges—the transition range—theindicator’s color will be an intermediate of its other 2 colors.
Students studied 5 acid-base indicators using colorlessaqueous solutions of different pH and a well plate (a platecontaining a matrix of round depressions—wells—that canhold small volumes of liquid).
Experiment 1The students added a pH = 0 solution to 5 wells in the
first column of the well plate, then added a pH = 1 solutionto the 5 wells in the next column, and so on, up to pH = 7.Next, they added a drop of a given indicator (in solution) toeach of the wells in a row, and then repeated this process,adding a different indicator to each row. The color of theresulting solution in each well was then recorded in Table 1(B = blue, G = green, O = orange, P = purple, R = red,Y = yellow).
Experiment 2Experiment 1 was repeated with solutions that had a
pH of 8 or greater (see Table 2).
Experiment 3Students were given 4 solutions (Solutions I−IV) of
unknown pH. The well plate was used to test samples ofeach solution with 4 of the 5 indicators (see Table 3).
Metanil yellow Y Y Y OResorcin blue B B R RCurcumin R R Y YIndigo carmine B Y B B
Table 1
Indicator
Color in solution with a pH of:
0 1 2 3 4 5 6 7
Metanil yellow R R O Y Y Y Y YResorcin blue R R R R R P P BCurcumin Y Y Y Y Y Y Y YHessian bordeaux B B B B B B B BIndigo carmine B B B B B B B B
Table 2
Indicator
Color in solution with a pH of:
8 9 10 11 12 13 14
Metanil yellow Y Y Y Y Y Y YResorcin blue B B B B B B BCurcumin O R R R R R RHessian bordeaux B R R R R R RIndigo carmine B B B B G Y Y
GO ON TO THE NEXT PAGE.ACT-1572CPRE
4 4
48
49
27. One way Experiment 2 differed from Experiment 3was that in Experiment 2:A. the solutions to which indicators were added were
of known pH.B. the solutions to which indicators were added were
of unknown pH.C. metanil yellow was used.D. metanil yellow was not used.
28. Based on the description of the well plate and how itwas used, the empty well plate would most likely havebeen which of the following colors?F. BlackG. BlueH. RedJ. White
29. Based on the results of Experiments 1 and 2, which ofthe following is a possible transition range for curcumin?A. pH = 3.9 to pH = 7.3B. pH = 4.2 to pH = 6.6C. pH = 7.4 to pH = 8.6D. pH = 8.4 to pH = 9.5
30. A chemist has 2 solutions, one of pH = 1 and one ofpH = 6. Based on the results of Experiments 1 and 2,could indigo carmine be used to distinguish betweenthese solutions?F. No; indigo carmine is blue at both pH = 1 and
pH = 6.G. No; indigo carmine is blue at pH = 1 and is yellow
at pH = 6.H. Yes; indigo carmine is blue at both pH = 1 and
pH = 6.J. Yes; indigo carmine is blue at pH = 1 and is yellow
at pH = 6.
31. The indicator propyl red has a transition range ofpH = 4.6 to pH = 6.8. If propyl red had been includedin Experiments 1 and 2, it would have produced resultsmost similar to those produced by which of the 5 indicators?A. Metanil yellowB. Resorcin blueC. CurcuminD. Indigo carmine
32. A student claimed that Solution III has a pH of 7.3.Are the results of Experiments 1−3 consistent with thisclaim?F. No, because in Solution III metanil yellow was
yellow.G. No, because in Solution III resorcin blue was red.H. Yes, because in Solution III metanil yellow was
yellow.J. Yes, because in Solution III resorcin blue was red.
33. Based on the results of Experiments 1−3, which ofSolutions I−IV has the lowest pH ?A. Solution IB. Solution IIC. Solution IIID. Solution IV
GO ON TO THE NEXT PAGE.ACT-1572CPRE
4 4
Passage VI
Drilling mud (DM) is a suspension of clay particles inwater. When a well is drilled, DM is injected into the holeto lubricate the drill. After this use, the DM is brought backup to the surface and then disposed of by spraying it onadjacent land areas.
A cover of DM on plants and soil can affect thealbedo (proportion of the total incoming solar radiationthat is reflected from a surface), which in turn can affectthe soil temperature. The effect of a cover of DM on thealbedo and the soil temperature of an unsloped, semiaridgrassland area was studied from July 1 to August 9 of aparticular year.
On June 30, 3 plots (Plots 1−3), each 10 m by 40 m,were established in the grassland area. For all the plots, thetypes of vegetation present were the same, as was the den-sity of the vegetation cover. At the center of each plot, asoil temperature sensor was buried in the soil at a depth of2.5 cm. An instrument that measures incoming andreflected solar radiation was suspended 60 cm above thecenter of each plot.
An amount of DM equivalent to 40 cubic meters per hectare (m3/ha) was then sprayed evenly on Plot 2.(One hectare equals 10,000 m2.) An amount equivalent to80 m3/ha was sprayed evenly on Plot 3. No DM wassprayed on Plot 1.
For each plot, the albedo was calculated for eachcloudless day during the study period using measurementsof incoming and reflected solar radiation taken at noon onthose days (see Figure 1).
Figure 1
For each plot, the sensor recorded the soil temperatureevery 5 sec over the study period. From these data, theaverage soil temperature of each plot was determined foreach day (see Figure 2).
34. Albedo was measured at noon because that time of dayis when solar radiation reaching the ground is:F. 100% reflected.G. 100% absorbed.H. least intense.J. most intense.
35. Why was the study designed so that the 3 plots had thesame types of vegetation present and the same densityof vegetation cover? These conditions ensured that anyvariations in albedo and soil temperature would mostlikely be attributable only to variations among theplots in the:A. amount of DM sprayed.B. type of soil present.C. plot area.D. plot slope.
albe
do
0.26
0.24
0.22
0.20
0.18
0.16
0.14June30
July5
July10
July15
July20
July25
July30
Aug.4
Aug.9
KeyPlot 1Plot 2Plot 3
daily
ave
rage
soi
lte
mpe
ratu
re (°
C)
28
26
24
22
20
18June30
July5
July10
July15
July20
July25
July30
Aug.4
Aug.9
KeyPlot 1Plot 2Plot 3
GO ON TO THE NEXT PAGE.ACT-1572CPRE
4 4
50
51ACT-1572CPRE
4 436. On one day of the study period, a measurable rainfall
occurred in the study area. The albedo calculated forthe cloudless day just after the rainy day was lowerthan the albedo calculated for the cloudless day justbefore the rainy day. On which day did a measurablerainfall most likely occur in the study area?F. July 10G. July 12H. July 26J. July 28
37. For each plot, the number of temperature readingsrecorded by the soil temperature sensor every minutewas closest to which of the following?A. 05B. 12C. 50D. 60
38. According to Figure 1 and the description of the study,was July 20 a cloudless day?F. No, because albedo data were not collected on that
day.G. No, because albedo data were collected on that
day.H. Yes, because albedo data were not collected on
that day.J. Yes, because albedo data were collected on that
day.
39. According to the results of the study, did the presenceof a cover of DM increase or decrease the albedo, anddid the presence of a cover of DM increase or decreasethe soil temperature?
40. Based on Figure 1, on August 3, what percent ofincoming solar radiation was NOT reflected fromPlot 2 ?F. 20%G. 40%H. 60%J. 80%
END OF TEST 4
STOP! DO NOT RETURN TO ANY OTHER TEST.[See Note on page 52.]
5858
Test 3: Reading—Scoring Key
Number Correct (Raw Score) for:
Social Studies/Sciences (SS) _______Subscore Area (20)
Arts/Literature (AL) Subscore Area _______(20)
Total Number Correct for Reading Test _______(SS + AL) (40)
Test 4: Science—Scoring Key
Number Correct (Raw Score) for:
Total Number Correct for Science Test _______(40)
SubscoreArea*
Key SS AL
1. A ___2. J ___3. C ___4. H ___5. B ___6. J ___7. A ___8. H ___9. B ___
10. J ___11. A ___12. J ___13. C ___14. J ___15. B ___16. H ___17. B ___18. F ___19. D ___20. F ___
SubscoreArea*
Key SS AL
21. A ___22. G ___23. D ___24. J ___25. C ___26. G ___27. C ___28. J ___29. C ___30. G ___31. A ___32. G ___33. A ___34. J ___35. D ___36. H ___37. B ___38. J ___39. A ___40. H ___
*SS = Social Studies/SciencesAL = Arts/Literature 1572CPRE
Key
1. C ___2. G ___3. D ___4. G ___5. C ___6. F ___7. A ___8. F ___9. D ___
10. J ___11. C ___12. F ___13. B ___14. F ___15. C ___16. F ___17. B ___18. H ___19. B ___20. J ___
Key
21. D ___22. F ___23. B ___24. J ___25. B ___26. H ___27. A ___28. J ___29. C ___30. F ___31. B ___32. G ___33. D ___34. J ___35. A ___36. H ___37. B ___38. F ___39. D ___40. J ___
1572CPRE
59
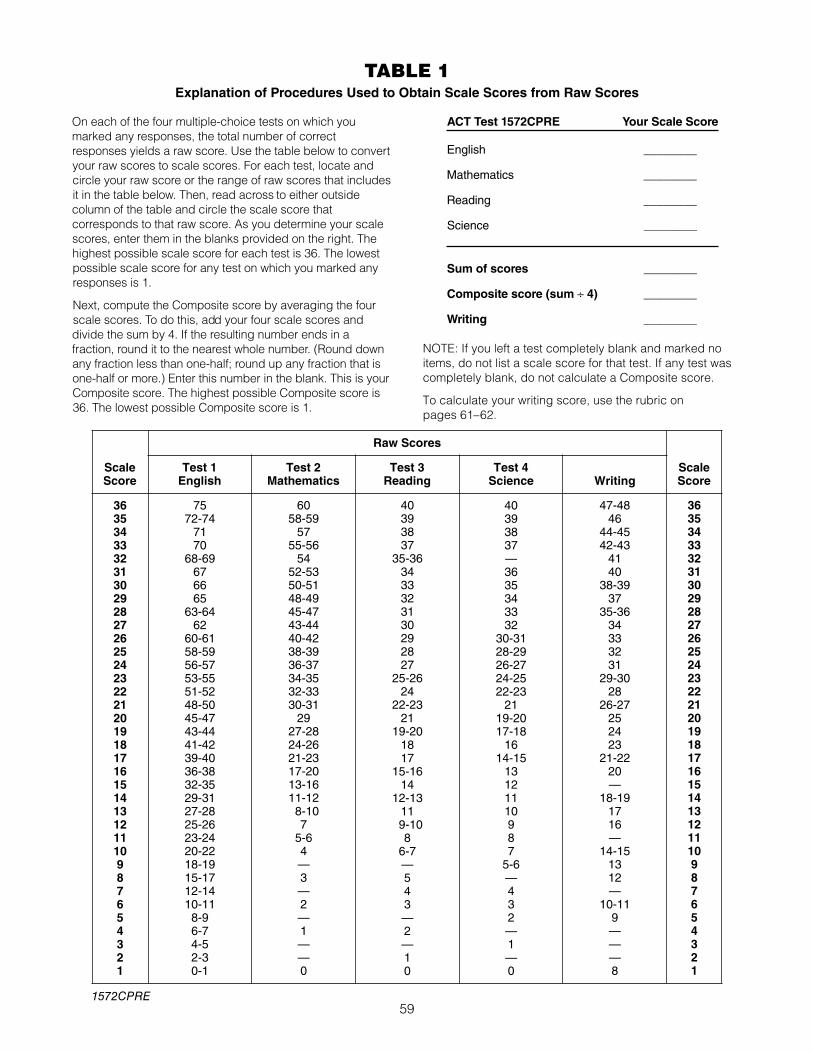
TABLE 1Explanation of Procedures Used to Obtain Scale Scores from Raw Scores
On each of the four multiple-choice tests on which youmarked any responses, the total number of correctresponses yields a raw score. Use the table below to convertyour raw scores to scale scores. For each test, locate andcircle your raw score or the range of raw scores that includesit in the table below. Then, read across to either outsidecolumn of the table and circle the scale score thatcorresponds to that raw score. As you determine your scalescores, enter them in the blanks provided on the right. Thehighest possible scale score for each test is 36. The lowestpossible scale score for any test on which you marked anyresponses is 1.
Next, compute the Composite score by averaging the fourscale scores. To do this, add your four scale scores anddivide the sum by 4. If the resulting number ends in afraction, round it to the nearest whole number. (Round downany fraction less than one-half; round up any fraction that isone-half or more.) Enter this number in the blank. This is yourComposite score. The highest possible Composite score is36. The lowest possible Composite score is 1.
ACT Test 1572CPRE Your Scale Score
English ________
Mathematics ________
Reading ________
Science ________
Sum of scores ________
Composite score (sum ÷ 4) ________
Writing ________
NOTE: If you left a test completely blank and marked noitems, do not list a scale score for that test. If any test wascompletely blank, do not calculate a Composite score.To calculate your writing score, use the rubric on pages 61–62.